Article

Performance of Rice Genotypes under Temporally Variable Wetland Salinity Conditions of a Semiarid Sub-Saharan Climatic Environment

by
Simon Kamwele Awala
1,2,*,
Kudakwashe Hove
1,3,*,
Evans Kamwi Simasiku
1,3,
Yasuhiro Izumi
4,
Osmund Damian Mwandemele
1 and
Morio Iijima
5
1
Faculty of Agriculture, Engineering and Natural Sciences, University of Namibia, Windhoek 10005, Namibia
2
Department of Crop Production and Agricultural Technologies, Private Bag 5520, Oshakati 15001, Namibia
3
Department of Wildlife Management and Tourism Studies, Private Bag 1096, Katima Mulilo Campus, Katima Mulilo 20001, Namibia
4
School of Environmental Science, The University of Shiga Prefecture, Hikone 522-8533, Japan
5
Graduate School of Agriculture, Kindai University, Nara 631-8505, Japan
*
Authors to whom correspondence should be addressed.
Land 2023, 12(4), 888; https://doi.org/10.3390/land12040888
Submission received: 25 February 2023 / Revised: 6 April 2023 / Accepted: 9 April 2023 / Published: 15 April 2023

Abstract

:
In semiarid regions, soil salinity, like drought, restricts crop productivity, causing food shortages among most inhabitants—the smallholder subsistence farmers. Seasonal wetlands formed in these regions during the rainy seasons could be utilised for rice (Oryza spp.) cultivation to increase food security, but rice is sensitive to salinity. Field and greenhouse-pot experiments were performed at the University of Namibia-Ogongo Campus, North-Central Namibia, to evaluate rice genotypes’ responses to seasonal wetland salinity. The field experiments assessed 16 rice genotypes for growth during the dry season and grain production during the rainy season, in saline and non-saline (control) seasonal wetlands. The saline-wetland salinity was predominantly NaCl; electrical conductivity levels increased from 2.8 dS m−1 (rainy season) to 34.3 dS m−1 (dry season), resulting in a 0–14% dry-season plant survival rate. The rainy-season wetland salinity decreased paddy yields in all rice genotypes; however, Pokkali produced the highest paddy and relative yields. The pot experiment assessed CG14 (salt-sensitive) and Pokkali (salt-tolerant) genotypes for growth using soils collected bi-monthly from the saline wetland. The rainy-season soil salinity reduced shoot growth in CG14 but did not affect growth in Pokkali, while the dry-season salinity killed both genotypes. The results of this study suggest the possibility of cultivating the salt-tolerant rice genotype, Pokkali, in the saline wetland during the rainy season due to salt dilution; however, the dry-season salinity levels would be detrimental to rice. More salinity-tolerance screening studies are warranted, in order to increase rice production and food security in Namibia and other flood-prone semiarid regions worldwide.

1. Introduction

In dryland regions, soil salinity is one of the major abiotic stresses limiting crop productivity [1,2], and hence causing food deficits in these regions. Globally, saline-affected drylands represent about 412 million hectares, with salinity occurring in soils found in arid regions, semi-arid regions, fertile alluvial plains, river valleys, coastal areas, and irrigated districts; Africa constitutes the highest proportion of this area, at 29% [1]. Countries with significant soil salinity problems include Australia, China, Egypt, Ethiopia, India, Iran, Iraq, Mexico, Pakistan, and the United States of America [3]. In sub-Saharan Africa, inhabitants of the drylands are resource-poor and food-insecure subsistence farmers [4,5]. Soil salinization is expected to increase in future climate change scenarios, due to rising sea levels and temperatures, thus exacerbating salinization [3,6].
Salt ions in the soil-water matrix may inhibit crop performance in two ways, that is, through the osmotic effect, by reducing soil water potential thus limiting water absorption by plants; and via ion-excess effect, which is the accumulation of salt ions in the plant, causing cell injuries [7]. Salinity stress affects all major plant processes, such as germination, growth, photosynthesis, water relation, nutrient imbalance, and yield, and its harmful effects are manifested in plant death, reduced growth, or decreased productivity. Salinity stress delayed and decreased seed germination percentage and rate, as well as emergence percentage and rate, in tomatoes [8], canola [9], and maize [10]. Plant growth was depressed by high salinity in canola [9], Trifolium fragiferum [11], and Plantago coronopus (L.) [12]. Salinity decreased photosynthesis, leaf water potential, and osmotic potential in Plantago coronopus (L.) [12], and decreased photosynthesis in different vegetable crops [13]. Salt stress caused a decrease in the concentration in plants of major nutrient elements, such as Ca, K, Mg, and nitrate, thus reducing growth and yields [11,12].
Namibia, a semiarid sub-Saharan country in southwestern Africa, has suffered persistent food insecurity since attaining its political independence, in 1990 [14]. The country is characterised by low and erratic summer rainfall, high temperatures, and a high evapotranspiration rate [15]. Its population of 2.5 million people is projected to reach 3.0 million by 2031 [16]. More than 45% of this population lives in the densely populated north-central region [16], which receives relatively higher rainfall of 450–500 mm [17], compared with most parts of the country [18]. Situated in the Cuvelai Drainage Basin originating in the southern Angolan highlands, where rainfall is usually higher, Namibia’s north-central region is characterised by a massive network of natural seasonal wetlands, locally called iishana or oondombe [19].
The seasonal wetlands are traditionally used for livestock grazing, fishing, and tourism, and they provide immeasurable ecosystem services [20,21]. However, they could be utilised more effectively for food production, to contribute to food security. Over the past two decades, there have been efforts to introduce rice cultivation in the wetlands [22,23,24,25,26]. Some wetlands are ephemeral and characterised by variable soils, while others are naturally vegetated, more fertile, and hence favourable for rice cultivation [22,27]. Other seasonal wetlands are generally barren, with naturally occurring salinity, which could affect future rice production in the wetlands.
Soils in the local wetlands are classified into three main groups: Cambic Arenosols, Eutric Cambisols, and Haplic Calcisols, characterised as alkali soil or solonetz [28]. Ref. [29] reported 46 saline wetlands in the north-central region, collectively measuring 89,500 ha. Since the wetlands are seasonal, sodium chloride (NaCl) salt usually precipitates on the soil surface, as water is eventually lost through surface evaporation [26,29]. Bangladesh [30], Spain [31], and India [31] have used saline wetlands for rice production. Therefore, in the face of a changing climate, increasing food demand in Namibia may dictate rice cultivation in agriculturally marginal areas, such as the saline wetlands, to feed the growing population.
Most rice genotypes are sensitive to salinity stress, especially at the seedling and seed-setting stages [31]. In rice, a high soil salinity level affects various growth and yield characteristics [30,31,32], decreasing stand establishment, panicle, and tiller number per plant, grain size, and increasing floret sterility [32,33,34]. The presence of salinity in the local wetlands may therefore affect sustainable rice production in the region.
Sustainable rice production in North-Central Namibia may be achieved by introducing genotypes adapted to farm micro-environmental conditions. Therefore, genotypic evaluation of rice in the saline wetlands is necessary to the selection of suitable, salt-tolerant genotypes, to optimise local rice production. Our former solution culture study revealed genetic variations for sodium chloride (NaCl) (i.e., salt) in the rice [Oryza glaberrima Steud., Oryza sativa L. and Interspecific Progenies (NERICA)] germplasm delivered to Namibia [35]. Also, a recent field study has demonstrated that rice can be cultivated in the region’s non-saline wetlands [19]. However, so far, literature concerning the performance of rice in local saline wetlands is not available.
Therefore, the present study evaluated rice genotypes in a naturally occurring saline wetland in North-Central Namibia, and assessed the effects of seasonally fluctuating salinity on crop growth and grain production.

2. Materials and Methods

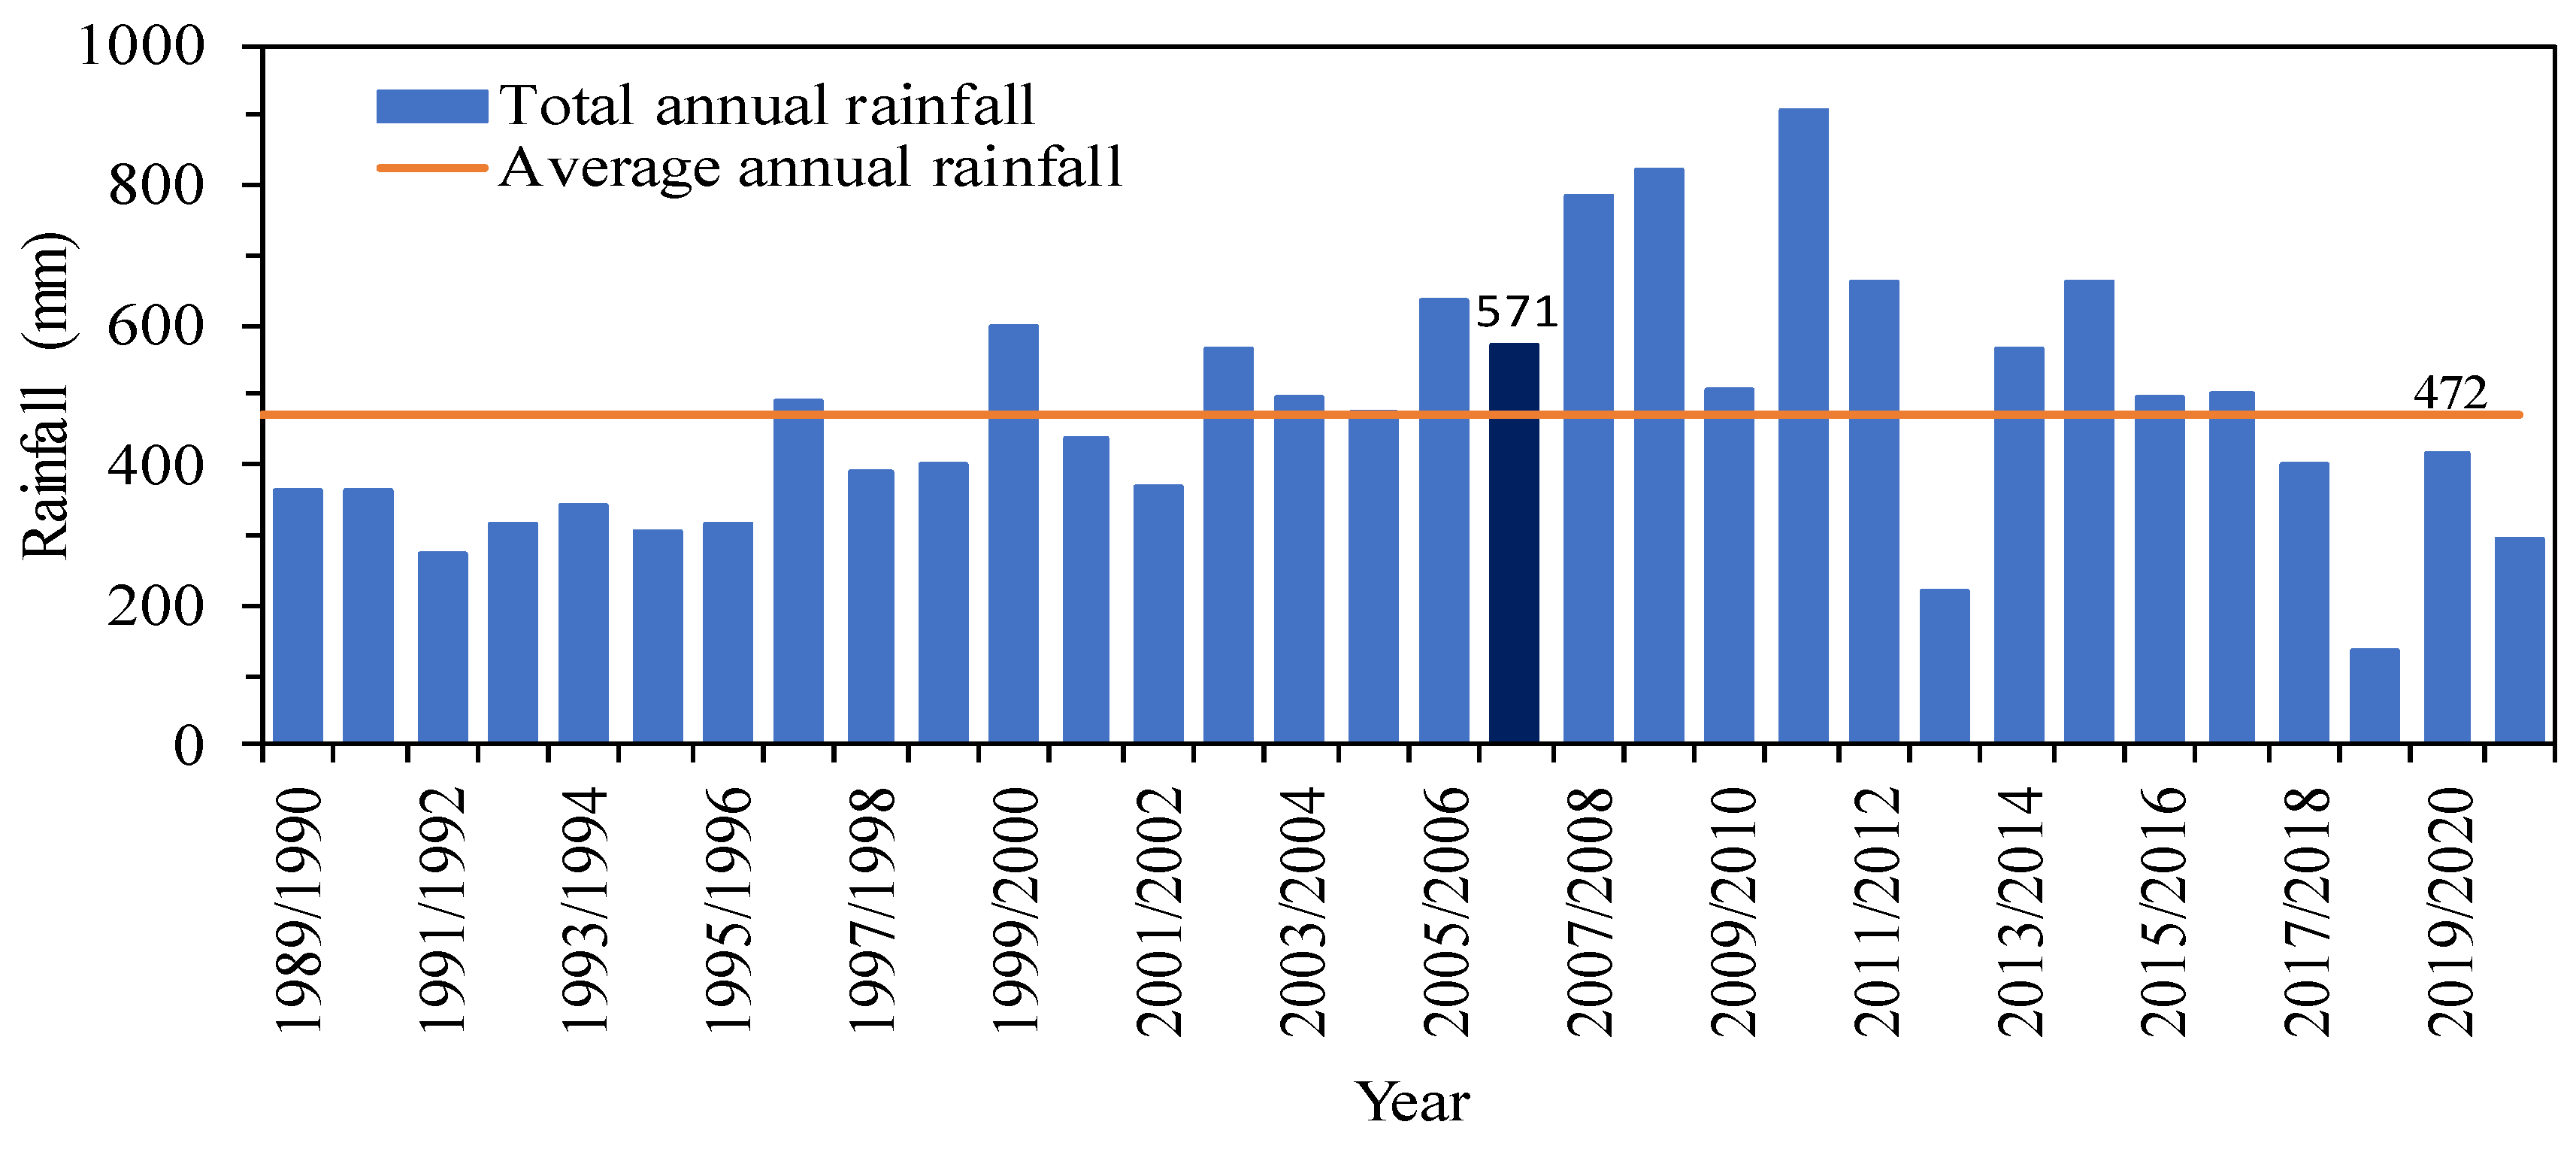
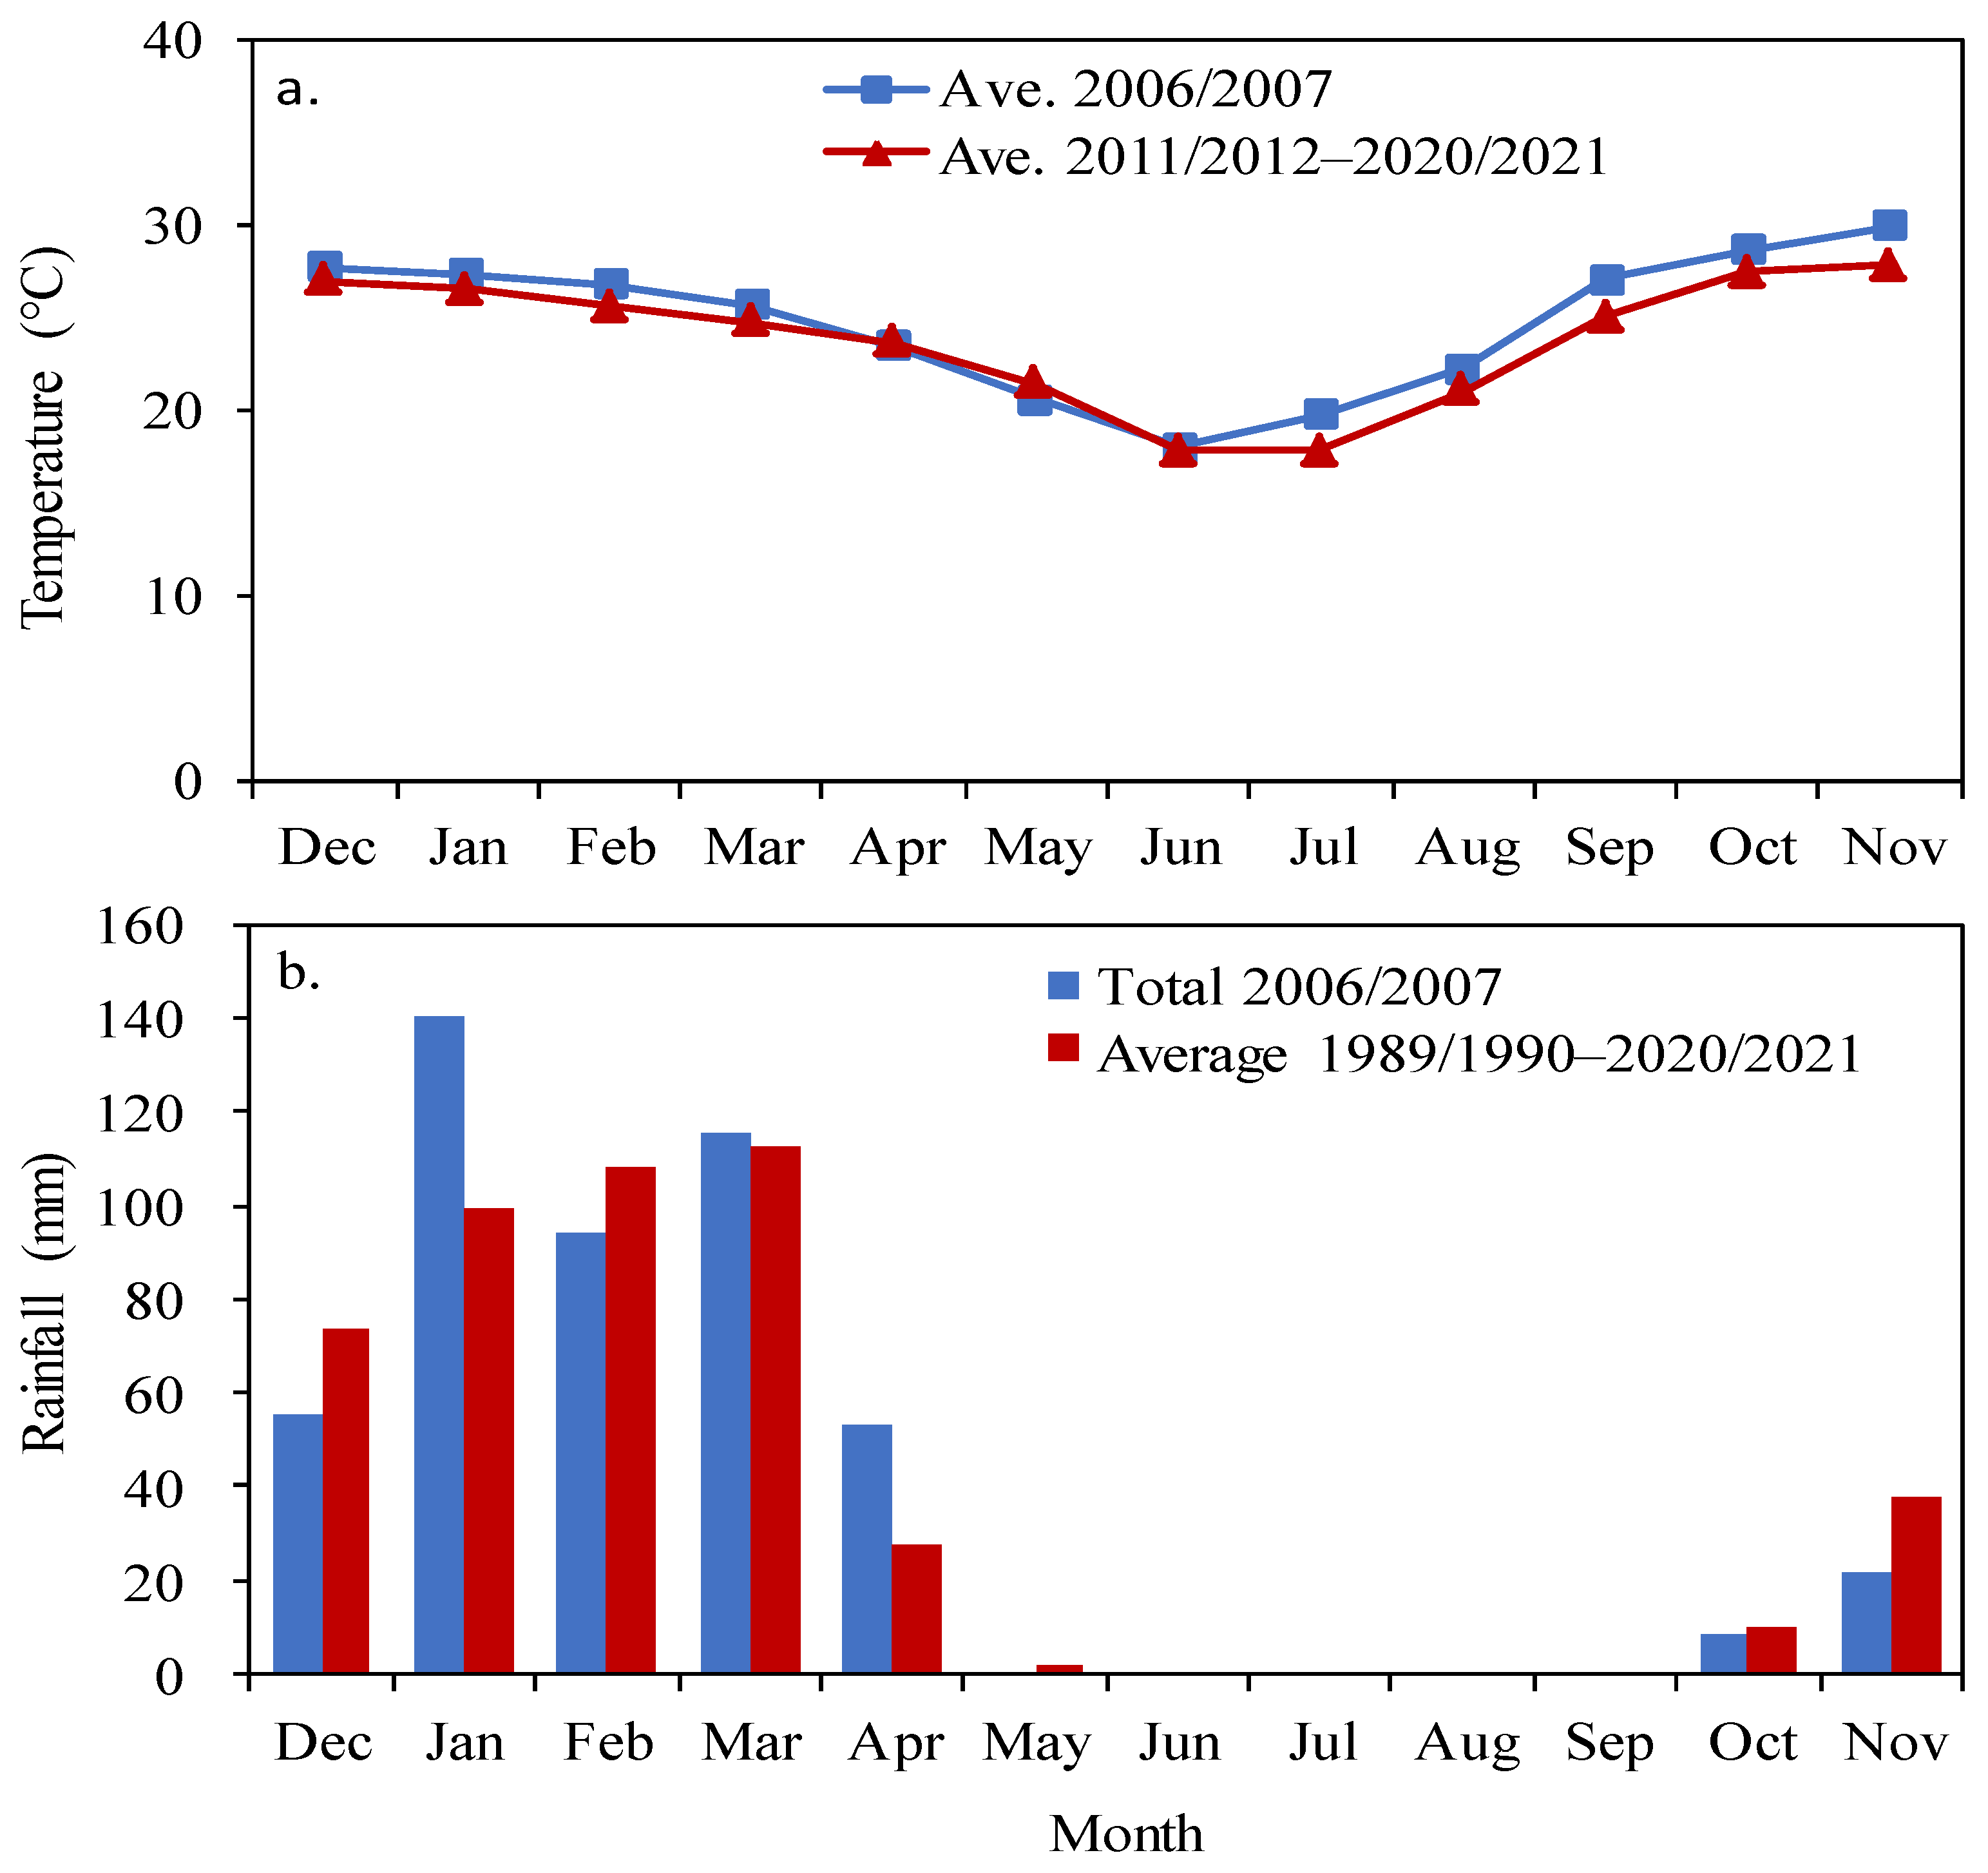
2.1. Study Site and Environmental Conditions

A greenhouse pot and two field experiments were performed at the University of Namibia-Ogongo Campus (17°41′ S, 15°17′ E, 1094 m altitude), North-Central Namibia, to assess rice genotypes for salinity tolerance under a saline seasonal wetland versus a non-saline (control) wetland conditions. Experiments were conducted between December 2006 and November 2007. So far, no other salinity-related studies have been performed in the local saline seasonal wetlands since we carried out this study; however, small-scale rice production among individual farmers has been ongoing. Also, to date, there has been no significant noticeable change in the ecosystem of the seasonal wetland. The north-central region is characterised by a semiarid environment with an annual mean temperature of >22 °C [20], annual rainfall for the past 32 years (1989/1990–2020/2021) ranging between 134 mm in 2018/2019 and 908 mm in 2010/2011, and an average of 472.0 ± 31.1 mm (Figure 1). Rainfall data during the experiments were obtained from the nearest government agricultural research station, the Omahenene Research Station. However, the station did not have a thermometer at that time; thus, temperature data were acquired from the Ondangwa Weather Station, which is second to the Omahenene Research Station in terms of proximity to the study site.
Soils in the north-central region are characteristically sandy, with low fertility levels [4]. In the field experiments, soil sampling in the topsoil (0–20 cm soil depth) was carried out just before executing the experiments, at the beginning of the rainy season in November 2006 for the first experiment (Exp. 1), and at the mid-dry season in September 2007 for the second experiment (Exp. 2). For the pot experiment (Exp. 3), sampling was done sequentially in alternate months across the study period. The soil samples were analysed for salinity characteristics, including EC, SAR, Na, Cl, carbonate, and bicarbonate ions; only the control wetland soils were analysed for nutritional status. The National Soil Science Laboratory in Namibia, performed soil analyses.
The temperature and rainfall conditions during the study period (December 2006–November 2007) are illustrated in Figure 2a,b. The overall average temperature during the study was 24.8 ± 1.1 °C, compared with the recent medium-term (2011/2012–2020/2021) average value of 23.9 ± 1.0 °C; both values are closer to the region’s long-term average temperature of >22 °C [20]. For the rainy-season experiment (Exp. 1) (December–May), the average temperature was 25.3 ± 1.1 °C, although the temperature for the December–February period was slightly higher, 27.3 ± 0.3 °C, than the recent medium-term average value of 26.4 ± 0.4 °C for the same period. By the end of the experiment in May, the average temperature declined to 20.6 °C. As for the dry-season experiment (Exp. 2) (October–November), the average temperature was 29.3 ± 0.7 °C, also slightly higher than the recent medium-term average of 27.7 ± 0.2 °C. The temperature was generally higher during the dry season than during the rainy season, possibly due to the lack of cloud cover and rainfall showers during the dry-summer months. Additional information about the temperature is presented in Figure 2a.
Total rainfall during the study period was 488.3 ± 14.7 mm, compared with the long-term (1989/1990–2020/2021) average rainfall of 470.7 ± 13.3 mm for the December–November period. These values are exceedingly comparable, just differing by 17.6 mm; thus, the experimental year can be considered a typical year with average rainfall. The total rainfall for Exp. 1 (December–May) and Exp. 2 (October–November) was 456.0 ± 20.6 and 30.3 ± 6.4 mm, compared with the corresponding long-term average values of 429.3 ± 19.3 and 49.5 ± 14.3 mm. The differences between the rainfall recorded during the study and the long-term average rainfall were relatively small, although Exp. 1 had 40 and 25 mm more rainfall in January and April, respectively than Exp. 2. Additional information on rainfall distribution during the experiments is presented in Figure 2b.
The topsoil in the control wetland was classified as sand, with a texture of 84.4% sand, 2.6% clay, and 17.1% silt, with 5.0 g organic matter kg−1 of soil, 0.2 g total N kg−1, 12.3 mg available P kg−1, 41.0 5 mg K kg−1, and a pH (H2O) of 5.9. The soil salinity characteristics of both the control and saline wetlands are presented in Table 1. The soil salinity level in the control wetland was negligible. However, the salinity level in the saline wetland was only lower during the rainy season (November–May), but much higher during the dry season (July–September), seemingly due to increased evaporation, causing surface salt precipitation. For Exp. 1 (rainy season), the EC and SAR values in the control wetland were 0.3 dS m−1 and 0.1, respectively, but the values were 7.3 dS m−1 and 69 in the saline wetland. For Exp. 2 (dry season), the EC and SAR values of the saline wetland were 34.2 dS m−1 and 205, respectively. Also, Na and Cl ion levels were 62.39 and 45.71 meq/100 g, which were much higher than that of carbonate/bicarbonate ions, at 0.11 meq/100 g, affirming that the type of salinity in the wetland was caused by NaCl ions.

2.2. Plant Materials

We evaluated 12, 16, and 2 rice genotypes, in experiments 1, 2, and 3, respectively (Table 2). The rice genotypes [O. glaberrima (6), interspecific progenies/NERICA (7), and O. sativa (6)] used in this study were drawn from a germplasm collection of 120 genotypes originating in West Africa and Asia. This germplasm was received in 2005 from Nagoya University, Japan; Japan International Research Centre for Agricultural Sciences–Agricultural Research Institute of Guinea (JIRCAS-IRAG) Project, Guinea; and AfriRice, Cote d’Ivoire to initiate rice field experiments in Namibia. The genotypes studied were selected based on various characteristics, including short growth duration and high yield potential observed in the initial study in non-saline wetlands in Namibia, and salinity tolerance observed in solution culture studies at Nagoya University, Japan [35]. We assessed the performance of rice genotypes in the 3 experiments (Table 2) at the University of Namibia-Ogongo Campus, North-Central Namibia.

2.3. Rainy-Season Experiment

In experiment 1 (Exp. 1) (Table 2), we used the 12 rice genotypes, including the NERICA parents—CG14 (the O. glaberrima parent) and WAB56-104 (the O. sativa parent)—and 2 salt-tolerant genotypes, Nona Bokra and Pokkali, to evaluate growth and grain production under two seasonal wetlands, the saline and non-saline (control) wetlands, during the rainy season, from December 2006 to April 2007. A randomised complete block design with three replications was used. Pre-germinated seeds were sown in seedling trays filled with soil in a nursery, in order to produce uniform seedlings. On 14 December, 30 days after nursery sowing, the seedlings were transplanted to the fields by placing one seedling per hill.
Each genotype was transplanted in a 3-m long single row, comprising 20 plants. Inter-row and intra-row spacing regimes were 0.3 m and 0.15 m, respectively. Such spacing was configured in order to produce sufficient plants for evaluation, while minimizing the nutrient competition effect in the naturally infertile sandy soils of the wetlands. The total experimental area at each wetland was 81 m2. The area was disc ploughed to 25–30 cm soil depth, and levelled before earth bands were constructed to keep water in the experiment during crop growth. Subsequently, the area was surface irrigated and then paddled for a day before transplanting. Basal fertilisers of 30 kg N ha−1, 45 kg P2O5 ha−1, and 30 kg K2O ha−1, were applied. No top dressing was done; however, due to a high evapotranspiration rate, the plots received supplemental surface irrigation to maintain a 5–10 cm water depth during plant growth, so no drainage was done. Weed control was done manually in order to keep a weed-free experiment.
At crop maturity, in each plot, the number of panicles and paddy yield data were collected from six randomly selected plants (hills). The panicles were sun-dried for a few days, and then threshed. Seeds were cleaned by water selection, thus floating chaffs and unfilled spikelets were discarded. The filled spikelets (paddy grains) were collected, oven-dried at 45 °C for 3 days, and then weighed. The rice paddy yields were finally determined after the grain moisture contents were adjusted to 14%.

2.4. Dry-Season Experiment

In experiment 2 (Exp.2) (Table 2), we assessed the effects of the wetland salinity on the survival rate and growth of the 16 rice genotypes during the dry season, from October to November of 2007. The genotypes included 9 from Exp. 1, plus 5 others. Genotypes C0440, Mala Noir V, and Nona Bokra, which failed to mature in Exp. 1, were excluded from this experiment. Experimental procedures and management were similar to those for Exp. 1. On 9 October, the 30-day old seedlings were transplanted to the field in 3.24 m2 (1.8 m × 1.8 m) plots, each having 36 plants. At 34 days after transplanting, rice plants with green leaves were counted in each plot to determine the survival rate, calculated as the number of survived plants expressed as a percentage of the number of plants transplanted. After the survival counts, shoots were harvested and oven-dried at 80 °C for 72 h. The dry shoot weights were measured to determine the genotypes’ biomass production.

2.5. Rice Growth in Alternate-Months Saline Soils

In experiment 3 (Exp. 3), only Pokkali and CG14 were used to test the effect of seasonally fluctuating wetland soil salinity on rice growth in pots under greenhouse conditions. These genotypes were selected for their vigorous seedling growth and differential responses to salinity stress—CG14 being sensitive and Pokkali being tolerant to salinity stress [35]. Treatments consisted of the two rice genotypes and five soil salinity groups. One of the soil sample groups was collected from the non-saline wetland (control) in November 2006. The other four samples were collected from the saline wetland in 2007, i.e., in alternate months, beginning with March (rainy season), May (end of rainy season), July and September (dry season), each characterised by a different salinity level. The soil samples were stored under shade until the time of planting. We used a completely randomised design, with three replications. Rice was grown in pots measuring 15 cm high and with a diameter of 14 cm, each filled with 3.5 kg of soil. The nursery procedures were similar to those for Exp. 1. For each genotype, 30-day-old rice seedlings were transplanted to individual pots (planting 3 seedlings per pot) on 7 October 2007, and then grown for another 30 days before the experiment was concluded. During the experiment, water levels in the pots were maintained at 5 cm above the soil surface. In the nursery seedling boxes and the experimental pots, basal fertilisers of 83, 111, and 97 mg kg−1 soil of N, P2O5, and K2O, respectively, were applied and mixed with the soil. The average greenhouse temperature during the experiment was 30 °C. For each pot, 30 days after transplanting, the rice shoots were harvested and dried as in Exp. 2; the dry shoot weights for each pot were then measured.

2.6. Statistical Analysis

To test the genotypes’ performance under saline versus performance in control fields (Exp. 1), we adopted a t-test for independent samples, under the assumption of homogeneity and normality of the data, with small sample sizes n 1 = n 2 = 12 , n i < 30 . We define a common variance between yield characters from the population of rice under saline and those under control fields as
S p 2 = ( n 1 1 ) s 1 + ( n 2 1 ) s 2 n 1 + n 2 2
The test statistic for testing the null hypothesis for the equality of average yield character between the saline rice population and the control field, is given by:
T = ( X ¯ 1 X ¯ 2 ) D 0 S p 2 1 n 1 + 1 n 2
The null hypothesis H 0 is rejected if (2) is greater than the tabulated value, t n 1 + n 2 2 α 2 or the probability value is less than α .

3. Results

3.1. Rainy-Season Grain Production Study (Exp. 1)

3.1.1. Genotype Comparative Performance in the Saline and Control Wetlands

Only 11 of the 12 genotypes studied in Exp. 1 reached full physiological maturity; Nona Bokra did not mature under the prevailing environmental conditions; thus, no yield was recorded, and hence this genotype was excluded from the analysis. Table 3 shows the pairwise comparison of rice genotypes for plant density, panicles, and paddy yield, between the saline wetland and non-saline (control) wetland at Ogongo Campus during the 2006/2007 rainy season. For plant density, individual genotypes performed differently, but mean differences between the saline and control wetlands were positive in all of the genotypes, denoting that all of the genotypes had lower plant density in the saline plots than in the control ones. Moreover, the mean differences were significant (p < 0.05) in most genotypes except in NERICA 3, WAS161-B-6-B-3-1B, CG14, and Mala Noir IV. The most significant differences were observed in WAB56-104, Mala Noir V, and ITA230 (FARO50), with 10.3 ± 1.7, 10.0 ± 1.6, and 8.3 ± 1.9 plants m−2, respectively. In contrast, minor differences were found in Pokkali, WAS161-B-6-B-3-1B, and WAS122-IDSA-10-WAS-1-1-FKR-1, with 3.7 ± 0.7, 4.0 ± 1.0, and 4.7 ± 0.7 plants m−2, respectively.
As in plant density, in panicles per m2, the mean differences between the saline and control wetlands differed from genotype to genotype, with positive values in all of the genotypes. The panicle mean differences were significant (p < 0.05) in most genotypes except in NERICA 3, WAS161-B-6-B-3-1B, CG14, and Mala Noir IV. The most significant mean differences were noted in ITA230 (FARO50), C0440, and WAS122-IDSA-10-WAS-1-1-FKR-1, with differences of 77.9 ± 17.2, 66.7 ± 14.8, and 59.9 ± 12.6 panicles per m2, respectively; whereas, minor differences were recorded in Pokkali, NERICA 4, and NERICA 3, differing by 20.7 ± 4.7, 28.8 ± 6.2, and 31.3 ± 4.7 panicles per m2.
For paddy yield, the mean differences between the saline and control wetlands were positive and significant (p < 0.05) for all of the genotypes, except Pokkali and CG14 (p > 0.05). The most significant differences were observed in Mala Noir V, NERICA 4, and WAB56-104, differing by 204.0 ± 28.0, 204.2 ± 21.1, and 197.4 ± 25.3 g.m−2, respectively, whereas minor differences were found in Pokkali, NERICA 3, and CG14, with 95.4 ± 26.2, 101.5 ± 14.6, and 122.1 ± 32.7 g m−2, respectively. Genotypic pairwise comparison for plant density, panicles per m2, and paddy yield production between the control wetland and saline wetland, demonstrated higher performance in the control wetland than in the saline wetland. Since field management practices and environmental conditions in the control and saline wetlands were almost similar, with the exception of the salinity conditions, it seems that salinity stress reduced plant stand density, panicles per m2, and grain yield among the rice genotypes; however, for grain yield, such reduction was not statistically significant in CG14 and Pokkali.

3.1.2. Genotypic Absolute and Relative Performance

Table 4 shows the survival rate, absolute and relative panicles, and absolute and relative paddy yield of the rice genotypes evaluated for salinity tolerance under wetland conditions at Ogongo Campus during the 2006/2007 rainy season. The plant survival rate in the saline wetland differed significantly (p = 0.015) among the rice genotypes. The minimum and maximum survival rates were 42.6% and 80.0%, observed in WAB56-104 and Pokkali, respectively. The panicles per m2 also differed significantly (p < 0.001) among the rice genotypes in both the control and saline wetlands, but panicle production was generally higher in the control wetland. In the control wetland, the minimum and maximum panicles m−2 was 57.3 and 182.9, recorded in WAB56-104 and CG14, respectively. Corresponding values in the saline wetland were 19.7 and 127.8 panicle m−2, again observed in CG14 and WAB56-104. Other genotypes that had the most panicles per m2 in both the control and saline wetlands were WAS122-IDSA-10-WAS-1-1-FKR-1, WAS161-B-6-B-3-1B, and ITA230 (FARO50). The relative panicle number was not statistically significant (p = 0.194) among the genotypes. However, WAB56-104, ITA230 (FARO50), and C0440, exhibited the lowest relative panicle values, of 34%, 41%, and 48%, respectively, whereas Pokkali, CG14, and WAS122-IDSA-10-WAS-1-1-FKR-1, had the highest values, of 73%, 70%, and 68%, respectively.
Paddy yield followed the same pattern as the panicles per m2, differing significantly among the genotypes in both the control wetland (p = 0.001) and saline wetland (p < 0.001). The minimum and maximum yields in the control wetland were 154.7 and 331.1 g m−2, respectively. The maximum yield was observed in Pokkali, followed by WAS122-IDSA-10-WAS-1-1-FKR-1, while the minimum yield of 154.7 g m−2 was measured in NERICA 3, followed by C0440, with 202.4 g m−2. The minimum and maximum paddy yields in the saline wetland were 35.2 and 235.7 g m−2, measured in WAB56-104 and Pokkali, respectively. It seemed that the genotypes that produced the highest yields in the control wetland also had the highest yields in the saline wetland.
For relative paddy yield, salinity significantly (p < 0.001) influenced the relative yield among the rice genotypes. The highest relative yield was observed in Pokkali, followed by CG14 and WAS161-B-6-B-3-1B, with respective relative values of 72%, 52%, and 50%. The lowest relative paddy yield was measured in WAB56-104, followed by NERICA 4 and Mala Noir V, with corresponding relative values of 15%, 21%, and 28%. These results revealed that soil salinity significantly reduced all yield characters among the rice genotypes, but Pokkali produced the highest relative panicles and paddy yield.

3.1.3. Correlations among Yield Characters

Figure 3 presents a partial correlation matrix for the yield characters of the rice genotypes studied in Exp. 1. The relative paddy yield was positively correlated with survival rate and with panicles per m2, relative panicles, and paddy yield in saline plots. However, the relative paddy yield had no significant correlation with panicles per m2 and paddy yield in control plots. The results also showed that paddy yields in saline plots were positively correlated with all of the variables measured, except panicle per m2 in control plots, which exhibited no correlation. Further, the results showed that paddy yield in control plots had no significant correlations with all variables except paddy yield in saline plots. Relative panicles were also positively correlated with survival rate and panicles per m2 in saline plots, but showed no correlation with panicles per m2 in control plots. Panicles per m2 in saline plots were positively correlated with all of the characters measured, except panicles per m2 and paddy yield in control plots. These results demonstrated that paddy yield in the saline plots was positively correlated with most characters studied, but it had no correlation with paddy yield in control plots.

3.2. Dry-Season Plant Survival Rate and Growth in the Saline Wetland (Exp. 2)

Table 5 demonstrates the effects of the dry-season soil salinity on the survival rate and shoot biomass of the 16 rice genotypes cultivated in the saline wetland and a corresponding non-saline control wetland. Salinity decreased the survival rate and shoot dry weight among the rice genotypes. The survival rate ranged between 0 and 14%, and only 4 genotypes exceeded the 10% survival rate. These genotypes were Tataro, NERICA4, LK1484-5, and Pokkali. Shoot biomass production in the control wetland differed significantly (p < 0.001) among the genotypes, varying from 23 g m−2 in NERICA 3 to 53 g m−2 in WAB1159-4-10-15-1-3. In the saline wetland, shoot biomass production was much lower, but differed significantly (p = 0.044) among the surviving rice genotypes, ranging between 0.002 g m−2 in WAB56-104, and 0.253 g m−2 in Totaro. Although Loubi tetera and WAB1159-4-10-15-1-3 had the highest shoot biomass in the control wetland, salinity in the saline wetland killed the two genotypes before data collection; thus, their survival rates were zero. We, therefore, excluded these genotypes from the statistical analysis. Tataro produced the highest absolute shoot biomass in the saline wetland, followed by NERICA 4 and LK1484-5. Regarding genotype salinity tolerance, Tataro, NERICA 4, and LK1484-5 displayed superior performance, having the highest survival rate, absolute shoot dry under salinity conditions, and relative shoot dry weights, followed by Pokkali and Mala Noir IV. These results demonstrated that the rice genotypes tested, differed significantly in their salinity tolerance levels.

3.3. Plant Growth in Soils Collected during the Rainy and Dry Seasons (Exp. 3)

Table 6 shows the effect of seasonally changing wetland salinity on the shoot dry weight of Pokkali and CG14 rice genotypes. The results showed that plant growth was possible in the soils of the rainy season months, but no growth in the soils of the dry-season months, salinity ultimately killed all the plants. However, May soil’s salinity level significantly reduced plant growth compared to March soil. Under May soils, the highest growth reduction occurred in CG14, with 45% relative growth. By contrast, the relative growth of Pokkali under the same May soils was 91%, with a growth reduction of only 9%. These results revealed that none of the two genotypes could grow in the dry-season soils; however, Pokkali could grow in the saline-affected wetland during the wet season.

4. Discussion

4.1. Environmental Conditions

This study is the first to assess rice performance in the climatic conditions of the local saline wetlands of northern Namibia. Based on the weather results, the overall average temperature value in the area during the study period, December 2006–November 2007, was at par with medium-term average temperature (Figure 2a) and long-term regional average reported by [20]. The results also showed that the total amounts of rainfall received during the experimental phase, December 2006–November 2007 (Figure 2b), were comparable with the long-term average annual and seasonal rainfall values for the 1989–2021 period (Figure 1 and Figure 2b). In areas affected by arid and semiarid climates, such as northern-central Namibia, any dramatic change in rainfall could disrupt the ecological balance, thus negatively affecting biodiversity and community livelihoods [17]. The agreement between the short-term (experimental year) and long-term weather statistics, demonstrates that the study was conducted in a normal year. The long-term weather statistics also indicate that the local environment of North-Central Namibia has been relatively stable. To our knowledge, ever since we carried out this study, no other salinity-related studies have been performed in the local saline seasonal wetlands of northern Namibia. Therefore, the results reported here are critical for both local and international application.

4.2. Crop Growth in the Saline Wetland

The generally low survival rate and biomass production among the genotypes grown in the saline wetland during the dry season, October and November (Table 5), may be related to the confounding effects of high soil salt concentration (EC = 34.2 dS m−1) in the wetland (Table 1), and intense heat due to high dry-season temperatures with an average maximum value of 37.9 ± 0.1 °C (also see Figure 2a). The survival rate was low in all of the genotypes, including the salt-tolerant Pokkali. Soils with EC values exceeding 4 dS m−1 are considered detrimental to rice, which is particularly less tolerant to salinity at the seedling stage [35] and seed-setting stage [36]. In this study, rice was transplanted to the field when the seedlings were as young as 30 days old. The dry-season wetland salinity level is remarkably high, thus suppressing rice establishment and growth. These results are similar to those of [34,37], who reported significant decreases in plant stand due to the effect of salinity stress.
For the pot study (Table 6), plant growth in March and May soils was attributable to the lower salinity levels in the soil samples used (Table 1). During March, flood and rainwaters stagnated in the saline wetland; hence, the salinity level was lower due to leaching and water dilution. The NaCl salt in the saline seasonal wetland is generally highly soluble in water and can be easily diluted and leached by water. The month of May marks a transition from the rainy to the dry season, characterised by high surface evaporation. Total plant death in July and September was attributed to high salt accumulation in the topsoil layer during the dry season (Table 1). NaCl ions usually precipitates on the soil surface as water is lost through evaporation and deep percolation [26,29]. Increased evaporation during the dry season should have caused the salt to accumulate on the soil surface, decreasing plant growth and causing death. Soil salinity inhibits plant growth through osmotic and ionic stresses [26,38]. These results suggest that salt-tolerant genotypes may be cultivated in the saline wetland during the rainy season, when flood and rainwaters dilute the wetland’s salt concentration. However, the higher dry-season salt levels would be detrimental to rice, making plant growth and development virtually impossible, as the salt concentration is too high.

4.3. Rice Paddy Production in the Saline Wetland

Crop diversification in semiarid regions is essential to improve the food security and livelihoods of the resident smallholder subsistence farmers. The results of the rainy-season experiment (Table 3) demonstrated higher genotypic performance in the control wetland than in the saline wetland. It appears that salinity stress reduced plant stand density, panicles per m2, and grain yield among the rice genotypes; however, for grain yield, such reduction was not statistically significant in CG14 and Pokkali. Field management practices and environmental conditions in the control and saline wetlands were virtually similar, except the salinity conditions, thus the differences in the genotype performance between the wetlands should have been attributed to salinity stress. The high paddy yield by Pokkali in the saline wetland (Table 1) seems to confirm the genotype’s high salt tolerance ability, expressed at the seedling stage in the solution culture experiment [35], and at the vegetative growth stage (Table 5). The high yield also seems to demonstrate the genotype’s adaptability to the local saline-wetland environment and the prevailing weather conditions. However, the genotype flowered relatively late, taking 104 days to flower after field transplanting (flowering data not shown). This late-flowering could affect Pokkali cultivation under northern Namibia’s short cropping season of 3–5 months [17], which is characterised by terminal droughts and ends in the cold winter. Our yield results are however contrary to those of [39], who reported significant grain yield reduction in Pokkali after exposure to 25 mM salinity stress in pots. Differences in cultivation environments may be the reason for this yield discrepancy.
CG14, like Pokkali, also demonstrated high paddy yield under the saline field conditions, although sensitive to the strong salinity at the seedling [35] and vegetative growth stages (Table 5 and Table 6). Under moderate or low salinity levels, rice plants tend to develop more tillers, to reduce salt’s effect by partitioning salt ions into several tillers [32]. CG14 had the highest survival rate and panicles per m2 under the saline field conditions, and the highest relative number of panicles and relative paddy yield (Table 4). These four variables were also positively correlated with grain production in the saline wetland (Figure 3). The genotype flowered 73 days following field transplanting; it was still raining at this time, and the wetland had water. Therefore, the diluted salt concentration in the wetland (Figure 2 and Table 1) appears to be too weak to induce a stress level suppressing paddy yield production. Although CG14 is generally weakened as a result of salinity stress, this genotype is tolerant of many other abiotic stresses [40,41] and biotic stresses [42,43], particularly under African conditions. As a result, researchers mainly use CG14 as a source of valuable agronomic traits, such as disease and iron toxicity tolerance, in rice improvement programs [44,45,46].
Although salinity reduced grain production in most rice genotypes, the results further revealed that a substantial number of genotypes were not significantly affected by NaCl salinity in the wetland, as far as plant density and panicles per m2 (Table 3) are concerned. The weaker salt concentration in the wetland due to water dilution during the rainy season (Table 1) did not substantially affect the plant density and panicles per m2. However, salt concentration could have been strong enough to induce spikelet sterility and reduce grain weight, especially in salt-sensitive genotypes, resulting in reduced grain per panicle, reduced grain weight, and low paddy yield [46]. Under moderate or low salinity levels, rice plants tend to develop more tillers, to reduce salt’s effect by partitioning salt ions into several tillers [22].
Waterlogging has a dilution effect, thus reducing the effect of salinity on rice plants, and the crop tends to perform better compared to those in non-waterlogged conditions. The results suggest that rice production in the saline seasonal wetlands can be enhanced by flood water which has a higher dilution effect (see results of the rainy-season and pot experiments) than just normal irrigation water (see results of the dry-season and pot experiments). However, irrigation using plenty of water to leach down excessive salt, and applying soil amendments (straw, farm yard manure, and gypsum) and fertilizers, could also ameliorate the harmful effects of salinity on plants [13], which could result in improved rice production in the wetland. As rice plants under saline conditions experience nutrient imbalances due to poor uptake and translocation of essential minerals such as N, Ca, K, Mg, and Zn, decreasing growth and productivity, such minerals can be applied as fertilizers in order to alleviate nutrient deficiencies and improve crop growth; also, selenium can be applied to strengthen plant stress tolerance mechanisms [47].

4.4. Genotypic Salinity Tolerance

In this study, we define genotypic salinity tolerance as the performance in the saline wetland, expressed as a percentage of the performance in the control wetland [22,38]. The higher the relative value, the more salt-tolerant the genotype is. These results showed that Pokkali produced the highest relative panicles and paddy yield (Table 4); relative paddy yield highly correlated with survival rate, the number of panicles per m2 in saline plots, relative panicles, and paddy yield in saline plots (Figure 3). A significant positive correlation between the relative paddy yield and these variables, suggests that such variables could be used as indirect measures for genotypic salt tolerance, thus aiding in selecting salt-tolerant genotypes. The high relative paddy yield in Pokkali demonstrates that this genotype could tolerate NaCl salt stress in the saline seasonal wetland. These results are expected, since Pokkali is an elite salt-tolerant genotype [36,48].
Nonetheless, although cultivated in some coastal areas of India [18], Pokkali is mainly used as the source of salt tolerance traits [48,49,50] in rice salinity studies and rice breeding programs. Generally, Pokkali is susceptible to lodging, has poor grain quality, and is photoperiod sensitive, making it unpopular for commercial cultivation [18]. Nonetheless, the use of salt tolerant genotypes has been widely recommended as an effective way to overcome salinity problems in crop production [13,47]. Crop diversification with rice in semiarid regions is essential to improving those regions’ food security statuses. Therefore, more salinity-tolerance screening studies are needed, to identify the most suitable rice genotypes for cultivation under the saline-wetland conditions of North-Central Namibia.

5. Conclusions

The soil salinity level in the saline wetland studied in North-Central Namibia was remarkably lower during the rainy season, and higher during the dry season. The rainy-season salinity level reduced paddy yield, plant growth, and survival rate in all the rice genotypes tested. However, Pakkali produced the highest relative paddy yield (72% of control) and absolute paddy yield under the saline wetland condition. In the dry-season field experiment, soil salinity reduced plant survival rate to 0–14% among the rice genotypes. In the pot experiment, comparing the salt-sensitive CG14 and salt-tolerant Pokkali genotypes, soil salinity during the rainy season had little effect on plant shoot growth, especially in Pokkali. However, salinity levels of the soils collected during the dry season killed all plants, irrespective of the genotypes. The results of this study indicate that Pokkali may be cultivated in the local saline wetlands and other similar agroecosystems during the rainy season. However, soil salinity levels vary among local seasonal wetlands, which may affect the performance of the genotype. Future studies in the local wetlands should focus on screening more genotypes for salinity tolerance to increase rice production and food security in the country.

Author Contributions

Conceptualization, S.K.A., M.I. and O.D.M.; methodology, S.K.A. and K.H.; software, K.H.; validation, E.K.S., Y.I. and O.D.M.; formal analysis, S.K.A. and K.H.; investigation, S.K.A.; resources, M.I.; writing—original draft preparation, S.K.A.; writing—review and editing, E.K.S., M.I., S.K.A., Y.I. and O.D.M.; visualization, S.K.A., K.H. and E.K.S.; supervision, M.I., Y.I. and O.D.M.; project administration, M.I.; funding acquisition, M.I. All authors have read and agreed to the published version of the manuscript.

Funding

This study was funded by the grant-in-aid (B2-16405020) from the Japanese Society for the Promotion of Science, and Japan International Cooperation Agency, which offered the first author a scholarship to study at Nagoya University, Japan, from 2006 to 2008.

Institutional Review Board Statement

Not applicable.

Informed Consent Statement

Not applicable.

Data Availability Statement

Not applicable.

Acknowledgments

We thank T. Lwiinga, A. Shomagwe and W. Kuume (University of Namibia) for contributing to the project. We also thank Jun-Ichi Sakagami, formerly at Japan International Research Center for Agricultural Sciences (JIRCAS), for supporting the project.

Conflicts of Interest

The authors declare no conflict of interest.

References

  1. Panagos, P.; Borrelli, P.; Robinson, D. FAO Calls for Actions to Reduce Global Soil Erosion. Mitig. Adapt. Strateg. Glob. Chang. 2020, 25, 789–790. [Google Scholar] [CrossRef] [Green Version]
  2. Zhao, G.Q.; Ma, B.L.; Ren, C.Z. Growth, Gas Exchange, Chlorophyll Fluorescence, and Ion Content of Naked Oat in Response to Salinity. Crop Sci. 2007, 47, 123–131. [Google Scholar] [CrossRef]
  3. Shahid, S.A.; Zaman, M.; Heng, L. Soil Salinity: Historical Perspectives and a World Overview of the Problem. In Guideline for Salinity Assessment, Mitigation and Adaptation Using Nuclear and Related Techniques; Springer International Publishing: Cham, Switzerland, 2018; pp. 43–53. ISBN 9783319961903. [Google Scholar]
  4. Awala, S.K.; Yamane, K.; Izumi, Y.; Fujioka, Y.; Watanabe, Y.; Wada, K.C.; Kawato, Y.; Mwandemele, O.D.; Iijima, M. Field Evaluation of Mixed-Seedlings with Rice to Alleviate Flood Stress for Semi-Arid Cereals. Eur. J. Agron. 2016, 80, 105–112. [Google Scholar] [CrossRef] [Green Version]
  5. Porter, J.R.; Xie, L.; Challinor, A.J.; Cochrane, K.; Howden, S.M.; Iqbal, M.M.; Lobell, D.B.; Travasso, M.I. Food Security and Food Production Systems. In Climate Change 2014: Impacts, Adaptation, and Vulnerability. Part A: Global and Sectoral Aspects. Contribution of Working Group II to the Fifth Assessment Report of the Intergovernmental Panel on Climate Change; Cambridge University Press: Cambridge, UK, 2014; pp. 485–533. [Google Scholar]
  6. Chaudhry, S.; Sidhu, G.P.S. Climate Change Regulated Abiotic Stress Mechanisms in Plants: A Comprehensive Review. Plant Cell Rep. 2021, 41, 1–31. [Google Scholar] [CrossRef]
  7. Parihar, P.; Singh, S.; Singh, R.; Singh, V.P.; Prasad, S.M. Effect of Salinity Stress on Plants and Its Tolerance Strategies: A Review. Environ. Sci. Pollut. Res. 2015, 22, 4056–4075. [Google Scholar] [CrossRef]
  8. Kaveh, H.; Nemati, H.; Farsi, M.; Jartoodeh, S.V. How Salinity Affect Germination and Emergence of Tomato Lines. J. Biol. Environ. Sci. 2011, 5, 159–163. [Google Scholar]
  9. Bybordi, A. The Influence of Salt Stress on Seed Germination, Growth and Yield of Canola Cultivars. Not. Bot. Horti Agrobot. Cluj-Napoca 2010, 38, 128–133. [Google Scholar]
  10. Khodahmpour, Z. Effects of NaCl Salinity on Maize (Zea mays L.) at Germination and Early Seedling Stage. Afr. J. Biotechnol. 2011, 11, 298–303. [Google Scholar] [CrossRef] [Green Version]
  11. Jēkabsone, A.; Andersone-Ozola, U.; Karlsons, A.; Romanovs, M.; Ievinsh, G. Effect of Salinity on Growth, Ion Accumulation and Mineral Nutrition of Different Accessions of a Crop Wild Relative Legume Species, Trifolium Fragiferum. Plants 2022, 11, 797. [Google Scholar] [CrossRef]
  12. Koyro, H.-W. Effect of Salinity on Growth, Photosynthesis, Water Relations and Solute Composition of the Potential Cash Crop Halophyte Plantago coronopus (L.). Environ. Exp. Bot. 2006, 56, 136–146. [Google Scholar] [CrossRef]
  13. Patel, D.; Jayswal, S.; Solanki, H.; Maitreya, B. Effect of Salinity on Different Vegetable Crops—A Review. Int. J. Recent Sci. 2020, 11, 37418–37422. [Google Scholar] [CrossRef]
  14. FAO; IFAD; UNICEF; WFP; WHO. The State of Food Security and Nutrition in the World 2019: Safeguarding against Economic Slowdowns and Downturns; FAO: Rome, Italy, 2019; ISBN 9789251315705. [Google Scholar]
  15. Heyns, P. Guidelines for the Utilisationof Water Resources and Protection of Wetlands in Namibia. Madoqua 1991, 1991, 249–251. [Google Scholar]
  16. Namibia Statistics Agency. Namibia 2011 Population & Housing Census—Main Report; Windhoek. 2013. Available online: https://cms.my.na/assets/documents/p19dmn58guram30ttun89rdrp1.pdf (accessed on 19 September 2021).
  17. Awala, S.K.; Hove, K.; Wanga, M.A.; Valombola, J.S.; Mwandemele, O.D. Rainfall Trend and Variability in Semi-Arid Northern Namibia: Implications for Smallholder Agricultural Production. Welwitschia Int. J. Agric. Sci. 2019, 1, 1–25. [Google Scholar]
  18. Gregorio, G.B.; Senadhira, D.; Mendoza, R.D.; Manigbas, N.L.; Roxas, J.P.; Guerta, C.Q. Progress in Breeding for Salinity Tolerance and Associated Abiotic Stresses in Rice. Field Crops Res. 2002, 76, 91–101. [Google Scholar] [CrossRef]
  19. Hirooka, Y.; Awala, S.K.; Hove, K.; Nanhapo, P.I.; Iijima, M. Effects of Cultivation Management on Pearl Millet Yield and Growth Differed with Rainfall Conditions in a Seasonal Wetland of Sub-Saharan Africa. Agronomy 2021, 11, 1767. [Google Scholar] [CrossRef]
  20. Mendelsohn, J.; Jarvis, A.; Robertson, T. A Profile and Atlas of the Cuvelai-Etosha Basin; Raison: Windhoek, Namibia, 2013; ISBN 9991678077. [Google Scholar]
  21. Mendelsohn, J.; Jarvis, A.; Roberts, C.; Robertson, T. Atlas of Namibia: A Portrait of the Land and Its People; David Philip Publishers: Cape Town, South Africa, 2002; ISBN 0-86486-516-3. [Google Scholar]
  22. Awala, S.K.; Hove, K.; Shivute, V.; Valombola, J.S.; Nanhapo, P.I.; Hirooka, Y.; Mwandemele, O.D.; Iijima, M. Growth and Productivity Assessment of Short-Duration Rice (Oryza sativa L. and Upland NERICA) Genotypes in Semiarid North-Central Namibia. Adv. Agric. 2021, 2021, 6676081. [Google Scholar] [CrossRef]
  23. Hirooka, Y.; Masuda, T.; Watanabe, Y.; Izumi, Y.; Inai, H.; Awala, S.K.; Iijima, M. Agronomic and Socio-Economic Assessment of the Introduction of a Rice-Based Mixed Cropping System to Cuvelai Seasonal Wetland System in Northern Namibia. Agrekon 2021, 60, 145–156. [Google Scholar] [CrossRef]
  24. Iijima, M.; Awala, S.K.; Watanabe, Y.; Kawato, Y.; Fujioka, Y.; Yamane, K.; Wada, K.C. Mixed Cropping Has the Potential to Enhance Flood Tolerance of Drought-Adapted Grain Crops. J. Plant Physiol. 2016, 192, 21–25. [Google Scholar] [CrossRef] [Green Version]
  25. Kotani, A.; Hiyama, T.; Ohta, T.; Hanamura, M.; Kambatuku, J.R.; Awala, S.K.; Iijima, M. Impact of Rice Cultivation on Evapotranspiration in Small Seasonal Wetlands of North-Central Namibia. Hydrol. Res. Lett. 2017, 11, 134–140. [Google Scholar] [CrossRef] [Green Version]
  26. Suzuki, T.; Ohta, T.; Hiyama, T.; Izumi, Y.; Mwandemele, O.; Iijima, M. Effects of the Introduction of Rice on Evapotranspiration in Seasonal Wetlands. Hydrol. Process. 2014, 28, 4780–4794. [Google Scholar] [CrossRef]
  27. Watanabe, Y.; Itanna, F.; Fujioka, Y.; Ruben, S.; Iijima, M. Soil Fertility Status of Seasonally Closed Wetland Ecosystem (Ondombe) in North-Central Namibia. Afr. J. Agric. Res. 2017, 12, 1538–1546. [Google Scholar] [CrossRef] [Green Version]
  28. Mendelsohn, J. Farming Systems in Namibia; Raison: Windhoek, Namibia, 2006; ISBN 9991678042. [Google Scholar]
  29. Lindeque, M.; Archibald, T.J. Seasonal Wetlands in Ovambo and the Etosha National Park. Madoqua 1991, 1991, 129–133. [Google Scholar]
  30. Khan, M.R.; Rahman, M.H.; Hasan, M.; Sarker, R.R.; Ali, M.M. Nutrient Management for Rice-Fallow-Rice Cropping Pattern Grown under Costal Saline Area of Satkhira, Bangladesh. Int. J. Biosci. 2018, 12, 310–316. [Google Scholar]
  31. Herrero, J.; Castañeda, C. Temporal Changes in Soil Salinity at Four Saline Wetlands in NE Spain. Catena 2015, 133, 145–156. [Google Scholar] [CrossRef] [Green Version]
  32. Shabbir, G.; Hussain, N.; Bhatti, M.K.; Ahmad, A.; Javed, M.A.; Shakir, M.A. Salt Tolerance Potential of Some Selected Fine Rice Cultivars. Online J. Biol. Sci. 2001, 1, 1175–1177. [Google Scholar] [CrossRef]
  33. Zeng, L. Exploration of Relationships between Physiological Parameters and Growth Performance of Rice (Oryza sativa L.) Seedlings under Salinity Stress Using Multivariate Analysis. Plant Soil 2005, 268, 51–59. [Google Scholar] [CrossRef]
  34. Zeng, L.; Shannon, M.C. Effects of Salinity on Grain Yield and Yield Components of Rice at Different Seeding Densities. Agron. J. 2000, 92, 418–423. [Google Scholar] [CrossRef]
  35. Awala, S.K.; Nanhapo, I.; Sakagami, J.-I.; Kanyomeka, L.; Iijima, M. Differential Salinity Tolerance among Oryza Glaberrima, Oryza Sativa and Their Interspecies Including NERICA. Plant Prod. Sci. 2010, 13, 3–10. [Google Scholar] [CrossRef] [Green Version]
  36. Erfandi, D.; Rachman, A. Identification of Soil Salinity Due to Seawater Intrusion on Rice Field in the Northern Coast of Indramayu, West Java. J. Trop. Soils 2013, 16, 115–121. [Google Scholar] [CrossRef]
  37. Zeng, L.; Shannon, M.C. Salinity Effects on Seedling Growth and Yield Components of Rice. Crop Sci. 2000, 40, 996–1003. [Google Scholar] [CrossRef] [Green Version]
  38. Hussain, S.; Cao, X.; Zhong, C.; Zhu, L.; Khaskheli, M.A.; Fiaz, S.; Zhang, J.; Jin, Q. Sodium Chloride Stress during Early Growth Stages Altered Physiological and Growth Characteristics of Rice. Chil. J. Agric. Res. 2018, 78, 183–197. [Google Scholar] [CrossRef]
  39. Saleethong, P.; Sanitchon, J.; Kong-ngern, K.; Theerakulpisut, P. Effects of Exogenous Spermidine (Spd) on Yield, Yield-Related Parameters and Mineral Composition of Rice (Oryza sativa L. ssp. Indica) Grains under Salt Stress. Aust. J. Crop Sci. 2013, 7, 1293–1301. [Google Scholar]
  40. Jagadish, S.V.K.; Craufurd, P.Q.; Wheeler, T.R. Phenotyping Parents of Mapping Populations of Rice for Heat Tolerance during Anthesis. Crop Sci. 2008, 48, 1140–1146. [Google Scholar] [CrossRef]
  41. Sahrawat, K.L. Reducing Iron Toxicity in Lowland Rice with Tolerant Genotypes and Plant Nutrition. Plant Stress 2010, 4, 70–75. [Google Scholar]
  42. Cabasan, M.T.N.; Kumar, A.; De Waele, D. Effects of Initial Nematode Population Density and Water Regime on Resistance and Tolerance to the Rice Root-Knot Nematode Meloidogyne Graminicola in African and Asian Rice Genotypes. Int. J. Pest Manag. 2018, 64, 252–261. [Google Scholar] [CrossRef]
  43. Touré, A.; Rodenburg, J.; Saito, K.; Oikeh, S.; Futakuchi, K.; Gumedzoe, D.; Huat, J. Cultivar and Weeding Effects on Weeds and Rice Yields in a Degraded Upland Environment of the Coastal Savanna. Weed Technol. 2011, 25, 322–329. [Google Scholar] [CrossRef]
  44. Fukuta, Y.; Konisho, K.; Senoo-Namai, S.; Yanagihara, S.; Tsunematsu, H.; Fukuo, A.; Kumashiro, T. Genetic Characterization of Rainfed Upland New Rice for Africa (NERICA) Varieties. Breed. Sci. 2012, 62, 27–37. [Google Scholar] [CrossRef] [Green Version]
  45. Jones, M.P.; Dingkuhn, M.; Aluko, G.K.; Semon, M. Interspecific Oryza sativa L. x O. glaberrima Steud. Progenies in Upland Rice Improvement. Euphytica 1997, 94, 237–246. [Google Scholar] [CrossRef]
  46. Ndjiondjop, M.N.; Seek, P.A.; Lorieux, M.; Futakuchi, K.; Yao, K.N.; Djedatin, G.; Sow, M.E.; Bocco, R.; Cisse, F.; Fatondji, B. Effect of Drought on Oryza Glaberrima Rice Accessions and Oryza Glaberrima Derived-Lines. Asian J. Agric. Res. 2012, 6, 144–157. [Google Scholar] [CrossRef]
  47. Korres, N.E.; Loka, D.A.; Gitsopoulos, T.K.; Varanasi, V.K.; Chachalis, D.; Price, A.; Slaton, N.A. Salinity Effects on Rice, Rice Weeds, and Strategies to Secure Crop Productivity and Effective Weed Control. A Review. Agron. Sustain. Dev. 2022, 42, 58. [Google Scholar] [CrossRef]
  48. Shahzad, B.; Yun, P.; Shabala, L.; Zhou, M.; Sellamuthu, G.; Venkataraman, G.; Chen, Z.H.; Shabala, S. Unravelling the Physiological Basis of Salinity Stress Tolerance in Cultivated and Wild Rice Species. Funct. Plant Biol. 2022, 49, 351–364. [Google Scholar] [CrossRef] [PubMed]
  49. Farooq, M.; Park, J.-R.; Jang, Y.-H.; Kim, E.-G.; Kim, K.-M. Rice Cultivars under Salt Stress Show Differential Expression of Genes Related to the Regulation of Na+/K+ Balance. Front. Plant Sci. 2021, 12, 680131. [Google Scholar] [CrossRef] [PubMed]
  50. Rahman, M.A.; Thomson, M.J.; Shah-E-Alam, M.; De Ocampo, M.; Egdane, J.; Ismail, A.M. Exploring Novel Genetic Sources of Salinity Tolerance in Rice through Molecular and Physiological Characterization. Ann. Bot. 2016, 117, 1083–1097. [Google Scholar] [CrossRef] [PubMed]
Figure 1. Annual rainfall patterns in North-Central Namibia from 1989/1990 to 2020/2021 highlighting the long-term average rainfall and experimental year, 2006/2007. Data source: Omahenene Research Station, Ministry of Agriculture, Water and Land Reform, Namibia.
Land 12 00888 g001
Figure 2. Patterns of monthly average temperatures for 2006/2007 and 2011/2012–2020/2021 period (a) monthly total rainfall for 2006/2007 and monthly average rainfall for the 1989/1990–2020/2021 period; (b) in North-Central Namibia. Ave., average. Data source: Rainfall data, Omahenene Research Station; temperature data, Ondangwa Weather Station.
Land 12 00888 g002
Figure 3. Correlation matrix for survival rate (SurvR): panicles in control (PanC), panicles in saline (PanS), relative panicles (Rp), paddy yield in control (PyC), paddy yield in saline (PyS), and relative paddy yield (RpY).
Land 12 00888 g003
Table 1. Salinity levels in the saline wetland at the Ogongo Campus during the 2006–2007 period.
SeasonSamplingEC *SAR #pHHCO3/CO32−Cl Na
Month(dS m−1) (meq/100 g)(meq/100 g)(meq/100 g)
RainyControl
Nov. 20060.30.16.30.040.040.07
Saline
Nov. 20067.369.35.70.0055.5614.50
Jan. 20072.938.26.30.073.685.25
Mar.2.816.05.50.550.130.68
May4.120.66.20.260.210.70
DryJul.18.25126.55.30.3216.7342.88
Sept.34.25205.35.00.1145.7162.39
Values represent the means of three replicate samples. * EC, Electrical conductivity; # SAR, Sodium adsorption ratio; HCO3, Bicarbonate; CO32−, carbonate.
Table 2. Origins and ecotypes of rice genotypes used in different salinity tolerance assessment experiments.
No.Cultivar Name Species #OriginEcotype Experiment
123
1.C0440GGuineaD×
2.CG14GSenegalRL/U×××
3.Loubi teteraG L ×
4.Mala Noir ⅣGNigerD××
5.Mala Noir VGNigerD×
6.TataroGMaliRL ×
7.NERICA 3ICote d’IvoireU××
8.NERICA 4ICote d’IvoireU××
9.WAB1159-2-12-11-2-10ICote d’IvoireL ×
10.WAB1159-4-10-15-1-3ICote d’IvoireL ×
11.WAS122-IDSA-10-WAS-1-1-FKR-1I L××
12.WAS161-B-6-B-3-1BISenegalL××
13.WAS173-B-2-1ISenegalL ×
14.EL BoutikaSMaliD ×
15.ITA230 (FARO50)SNigeriaL××
16.LK1484-5SGuineaL ×
17.Nona BokraSIndia ×
18.PokkaliSIndiaL×××
19.WAB56-104SCote d’IvoireU××
# Species: G, O. glaberrima; I, Interspecific progenies; S, O. sativa. Ecotype: D, Deepwater; L, Lowland; RL/U, Rainfed lowland/upland; U, Upland; IL, Irrigated lowland. ×, indicates the genotype used in a particular experiment.
Table 3. Pairwise comparison of rice-genotype yield characters between the control (C) and saline (S) wetlands (Exp. 1).
VarietyPlant Density (No. m−2)Panicles (No. m−2)Paddy Yield (g m−2)
Mean Diff. ± SE (C-S)p-ValueMean Diff. ± SE (C-S)p-ValueMean Diff. ± SE (C-S)p-Value
Pokkali3.7 ± 0.70.032 *20.7 ± 4.70.047 *95.4 ± 26.20.068 ns
WAB56-10410.3 ± 1.70.025 *37.6 ± 4.30.013 *197.4 ± 25.30.016 *
ITA230 (FARO50)8.3 ± 1.90.046 *77.9 ± 17.20.046 *134.7 ± 22.70.027 *
NERICA 34.7 ± 1.20.060 ns31.3 ± 4.70.022 *101.5 ± 14.60.020 *
NERICA 45.0 ± 0.60.013 *28.8 ± 6.20.044 *204.2 ± 21.10.010 *
WAS161-B-6-B-3-1B4.0 ± 1.00.057 ns39.3 ± 12.50.088 ns138.0 ± 24.60.030 *
WAS122-IDSA-10-WAS-1-1-FKR-14.7 ± 0.70.020 *59.9 ± 12.60.041 *183.8 ± 24.60.018 *
CG145.3 ± 1.50.067 ns55.1 ± 27.20.180 ns122.1 ± 32.70.065 ns
C04406.0 ± 1.20.035 *66.7 ± 14.80.046 *140.9 ± 32.30.049 *
Mala Noir IV7.3 ± 1.90.058 ns52.6 ± 14.60.069 ns184.5 ± 14.10.006 **
Mala Noir V10.0 ± 1.60.013 *38.8 ± 12.60.091 ns204.0 ± 28.00.018 *
Values are the mean differences ± SE (standard errors) between the control and saline wetlands of three replications. **, *, significant at p < 0.01, and < 0.05. ns, not significant by t-test.
Table 4. Rice genotype survival rate, absolute and relative yield characters, in saline and control wetlands (Exp. 1).
VarietySurvival Rate (%)Panicles.
(No. m−2)
Relative Panicle
No. (% Control)
Paddy Yield
(g m−2)
Relative Paddy Yield (% Control)
SalineControlSalineControlSaline
Pokkali80.0a75.2ef54.5bcd72.9a331.1a235.7a71.9a
WAB56-10442.6c57.3f19.7e34.4a232.5def35.2g15.3d
ITA230(FARO50)53.7bc130.8b52.9bcd41.3a208.6ef74.0ef36.0bc
NERICA 374.1ab63.2f31.9de50.6a154.7g53.2fg34.8bc
NERICA 472.2ab64.1f35.3de55.3a256.4bcd52.2fg20.6cd
WAS161-B-6-B-3-1B77.8a120.5bc81.2b68.4a273.0bc135.0b50.2b
WAS122-IDSA-10-WAS-1-1-FKR-174.1ab129.9b70.0bc54.9a292.8ab109.0bcd37.6bc
CG1470.4ab182.9a127.8a70.5a244.9cde122.9bc51.6b
C044066.7ab127.4bc60.7bcd48.4a202.4f61.5fg32.4cd
Mala Noir IV59.3abc107.7cd55.1bcd52.2a281.0bc96.5cde34.2bc
Mala Noir V44.4c88.9de50.1cde57.2a279.1bc75.2def27.5cd
Values are the means of three replications. Within the column, means with the same letters are not significantly different using the LSD test at the 5% probability level.
Table 5. Effects of salinity on survival rate and shoot dry weight of rice genotypes grown in a saline wetland (Exp. 2).
GenotypeThe % Survival Rate in Saline FieldAbsolute Shoot Dry Weight * Relative Shoot Dry Weight
(% Control)
(g m−2)
ControlSaline
Pokkali1343.6abcd0.047b0.11
WAB56-104329.6def0.002b0.01
ITA230 (FARO50)643.6abcd0.011b0.03
NERICA 3423.3f0.006b0.03
NERICA 41426.1ef0.094ab0.36
WAS161-B-6-B-3-1B638.6abcdef0.019b0.05
WAS122-IDSA-10-WAS-1-1-FKR-1234.4bcdef0.004b0.01
CG14636.9bcdef0.009b0.02
Mala Noir IV930.9cdef0.051b0.17
WAS173-B-2-1634.2bcdef0.023b0.07
Loubi tetera #039.0abcdef
LK1484-51150.1ab0.151ab0.30
Tataro1440.4abcde0.253a0.63
WAB1159-2-12-11-2-10246.4abc0.004b0.01
EL Boutika336.2bcdef0.009b0.02
WAB1159-4-10-15-1-3 #053.1a
Values are the means of three replications. * Shoot dry weight was estimated as average shoot biomass per plot × survival rate. # Plants were killed by salinity before data collection, the survival rates were zero, but the dry shoot weights were not measured. Within the column, means with the same letters are not significantly different using the LSD test at the 5% probability level.
Table 6. Effect of seasonally changing wetland salinity on shoot dry weight and relative shoot dry weight of CG14 and Pokkali rice genotypes grown in pots (Exp. 3).
Sampling MonthSoil Electrical Conductivity
(dS m−1)
CG14Pokkali
Absolute Shoot Dry Weight (g pot−1)Relative Shoot Dry Weight (% Control)Absolute Shoot Dry Weight (g pot−1)Relative Shoot Dry Weight (% Control)
Control0.36.2 ± 0.7 a8.0 ± 0.8 a
Mar-072.84.3 ± 1.0 b698.6 ± 0.5 a108
May4.12.8 ± 0.3 c457.3 ± 1.2 b91
Jul #18.25
Sept #34.25
p-value0.0370.007
Values for absolute shoot dry weight represent the means ± S.E of three replications. # Plants were killed by salinity within five days after transplanting; the dry shoot weights were not measured. Within the column, means with the same letters are not significantly different using the LSD test at the 5% probability level.
Disclaimer/Publisher’s Note: The statements, opinions and data contained in all publications are solely those of the individual author(s) and contributor(s) and not of MDPI and/or the editor(s). MDPI and/or the editor(s) disclaim responsibility for any injury to people or property resulting from any ideas, methods, instructions or products referred to in the content.

