Article

China’s Urban and Rural Development Significantly Affects the Pattern of Human Appropriation of Net Primary Production

1
Northwest Land and Resource Research Center, Shaanxi Normal University, Xi’an 710119, China
2
College of Urban and Environmental Sciences, Peking University, Beijing 100871, China
*
Author to whom correspondence should be addressed.
Land 2023, 12(5), 1062; https://doi.org/10.3390/land12051062
Submission received: 12 April 2023 / Revised: 11 May 2023 / Accepted: 11 May 2023 / Published: 12 May 2023
(This article belongs to the Special Issue Rethinking the Man-Land Relations in China)

Abstract

:
Increasing human activities have greatly influenced the ecosystem and the use of ecological resources, and the unbalanced urban–rural development in China (urban and rural areas being two major bases of human activities) has always been accompanied by heterogeneous ecological effects. Human appropriation of net primary production (HANPP) is an integrated indicator quantifying the human domination of productivity and harvest in the biosphere. Identifying the unbalanced constraints of urban and rural development on HANPP has become necessary for improving human–land relationships. This study analyzed the spatial distribution and regional differentiations of the HANPP in China in 2015 and investigated how HANPP and its components responded to unbalanced regional urban–rural development. The results show that the total amount of HANPP was 2.68 PgC and gradually decreased from the southeast to the northwest of China in 2015, representing 60.33% of the NPPpot. In addition, HANPPluc, harvest through cropland, livestock grazing, and forestry contributed 60.70%, 29.86%, 8.53%, and 0.91%, respectively, to the total HANPP, with HANPPluc playing the dominant role in 21 provinces. There was a significant differentiation (p < 0.05) in the spatial distribution of HANPP (gC/m2), HANPPharv (gC/m2), and HANPPluc (gC/m2), especially between the Huanyong Hu Line and the western–eastern part of China, fundamentally resulting from uneven regional development. In addition, biomass production–consumption decoupling existed in most regions in China, 17 provinces were identified as consumption type, and a universal positive correlation (p < 0.05) was identified between the production–consumption ratio of occupied biomass and HANPPharv (%HANPP). Different drive mechanisms were found between urban–rural development and HANPP, and each HANPP index was more likely to be affected by urban economy (UE), rural population (RP), and rural agricultural technology (RA) in China. The higher regional average nighttime light intensity, the proportion of the built-up area, and the urban road area corresponded with a large HANPPluc value. Conversely, HANPP would decrease as the proportion of urban green spaces increased. Furthermore, HANPP (%NPPpot) and HANPP (gC/m2) mostly depended on the rural development index, while HANPPluc and HANPPharv were mainly controlled by urban and rural development, respectively. Our findings help understand, first, how unbalanced regional development influences human-induced biomass occupation, the comprehensive urban ecological construction, and rural ecological restoration and, second, that the overall planning of urban–rural integration development must be strengthened to face greater ecological pressures in the future.

1. Introduction

The increase in human activity (urbanization, deforestation, cultivation, hunting, etc.) has had a tremendous impact on ecosystems and ecological resources. Excessive interference has led to a series of contradictions in human–land relationships and has become the core of geography research [1]. Intensified human–land conflict and the excessive transformation and occupation of ecological resources have posed severe challenges to sustainable global development. In view of this situation, there is an urgent need to study ecological pressure and the factors that lead to it. However, quantifying the magnitude of the substantial amount of human interference and its consequences for the ecosystem is a challenge [2]. Human appropriation of net primary production (HANPP) is a credible aggregated indicator that quantifies the magnitude of human-activity-related alterations in the ecological energy flows from the perspective of the carbon cycle [3]. HANPP is always represented as the ratio of the ecological sources used by human activities to the potential ones, and can measure regional ecological pressure and sustainability. Net primary productivity (NPP) refers to the amount of photosynthetic active radiation fixed by green vegetation as the carbon storage per unit area [4], which determines the ecological resource capacity that humans can occupy [5].
Urban and rural areas are considered as two major bases of human activities, and there is a big difference between their construction and economic levels [6,7,8]. As the most typical way by which the ecosystem is altered by humans, urbanization can not only directly consume multiple ecological resources through land conversions, but also drive the exchange of the regional population, economy, and materials [9,10]. Meanwhile, as suppliers of materials, labor, and various services to cities [11], expansive rural areas bear the pressure of ecological resource consumption resulting from urban population growth. With the continuous concentration of population in cities, there is a local and telecoupling phenomenon between the consumption and production of ecological resources in urban and rural areas [12]. The unbalanced development between urban and rural areas directly affects the supply–demand relationship of ecological resources and regional functions, especially the food security and ecological security in the areas where ecological resources are supplied are under increasing pressure. Whether human activities in some areas have exceeded the threshold of the ecosystems and what are the influencing factors are the topical questions that need to be answered urgently. Therefore, exploring the differentiation of HANPP under the influence of urban and rural development is helpful to identify the areas of human activity overload, and to clarify the contributions of urban and rural areas to the sustainable development of an ecosystem. In recent years, with the implementation of strategies for rural revitalization and urban–rural integration, China, as a large developing country, has entered a critical period of transformation in urban–rural relations. However, the long-standing “dual system” has resulted in the division of urban and rural areas and unbalanced development [13] accompanied by heterogeneous ecological effects of human activities. Therefore, determining the internal driving mechanisms of the unbalanced urban–rural development on HANPP is helpful to judge the constraints affecting the ecological sustainable development, which is a crucial topic to alleviate the ecological contradictions between urban and rural areas and to improve human–land relations globally.
HANPP is an effective method of assessing human–land relationships and research on HANPP has received increasing attention internationally; however, related research in China is still in its infancy. Relevant studies mostly focus on the improvement of the simulation model [14], comparison with other similar indicators [15], and the evaluation and spatial–temporal dynamic analysis of HANPP on global [16,17,18], national [5,19,20,21], or regional scales [2,22,23,24]. Embodied HANPP, an indicator closely related to the import and export of ecological resources, is an emerging research field [25]. Different results can be found based on various global-scale models and periods, i.e., HANPP was estimated to be 20.32% in 1995 [26], 23.8% in 2000 [16], and 13–25% from 1910 to 2005 [18]. Existing national-scale studies mostly focus on European countries and always show a relatively high level of HANPP (over 50%), with a tendency to decline over a long time series [27,28,29]. However, case studies in Asian countries show that the ecological pressure has significantly increased [5,30], representing the imbalanced effect of human activities on HANPP in densely inhabited regions. Moreover, as a biophysical indicator for measuring regional sustainable development, the relationship between HANPP and ecological footprint [31,32] as well as biodiversity [33,34], has always been focused on. Studies on the driving mechanism of HANPP are mostly limited to the single factor of social economy, among which the decoupling of HANPP and population or GDP has attracted more attention [35]. Population density has been found to have a significant influence on the spatial distribution of HANPP [36]. However, less attention has been paid to the comprehensive studies of how HANPP responds to multidimensional indicators for urban and rural development, such as land conversion, population growth, economy development, technology progress, and ecological construction, and studies on the variation in HANPP during urban–rural relationship transformation are also particularly lacking in recent years.
The past decades have been characterized by rapid economic development and intensive human activities in China, and the duality of rural–urban development is a common problem in most regions, inducing an obvious spatial heterogeneity of ecological resources consumed by human activities. If the relationship between urban–rural development and HANPP was quantified, it would fill research gaps and help answer the essential question of how to reduce the ecological pressure of human activities and promote harmonious human–land relationships through coordinated urban–rural development, and thus be referable for further studies in other regions. Therefore, with the ultimate goal of identifying the influence mechanism of urban–rural development on HANPP and investigating the factors driving its heterogeneity, three detailed objectives were defined in this study: (1) to evaluate HANPP in China in 2015 and its spatial imbalance characteristics; (2) to depict the relationships between HANPP and China’s urban–rural development and investigate HANPP responses to the degree of regional urban–rural coordination; and (3) to identify the dominant driving factors of different dimensions of urban and rural construction on HANPP and its components.

2. Materials and Methods

2.1. Data Sources

In this paper, three categories of datasets were chosen from 31 regions in China (22 provinces, 5 autonomous regions, and 4 municipalities). This excluded unobtainable statistical datasets from Hong Kong, Macau, and Taiwan. The dataset included remote sensing images, statistical yearbook data, and vector datasets. To estimate the terrestrial potential NPP, yearly land cover data MCD12Q1 with the resolution of 500 m were obtained from NASA Earthdata (https://lpdaac.usgs.gov/products/mcd12q1v061/ (accessed on 12 May 2022)) and MOD17A3HGF data were used to characterize the actual NPP (https://lpdaac.usgs.gov/products/mod17a3hgfv061/ (accessed on 23 May 2022)). The Monthly Normalized Difference Vegetation Index (NDVI) with a resolution of 1 km was obtained from the MOD13A3 dataset (https://lpdaac.usgs.gov/products/mod13a3v061/ (accessed on 6 June 2022)) and was mainly used to spatialize the harvested NPP of each province by virtue of its linear relationship with regional crop and livestock production. Among the statistical data, the annual average temperature and the annual total precipitation data of 830 meteorological stations in China used in this study were collected from the China Meteorological Data Service Centre (http://data.cma.cn/ (accessed on 15 June 2022)) and used to drive the Thornthwaite Memorial model to evaluate the potential NPP in China. For the missing data of several individual stations, this study selected the threshold of 80% and used Lagrange’s theorem to interpolate and fill in the gaps [37]. If the number of missing months exceeded 20%, the data of the station in that year would be taken as a null value. The dataset of 31 provinces in China on biomass harvested or destroyed during harvest for crop yield, wood harvest, and livestock, available in the China statistical yearbooks in the National Bureau of Statistics (http://www.stats.gov.cn/tjsj/ (accessed on 17 June 2022)), was quantified. Indicators representing urban and rural population growth, economic development, land expansion, ecological construction, and agricultural technology, which comprehensively reflect the level of urban–rural development in China, were also obtained from these annual statistical yearbooks.

2.2. Estimation Model of HANPP

On the basis of different research backgrounds and spatial scales, several definitions of HANPP have been used before [16,26,38,39], which caused a slight obstacle when the HANPP estimation results were being compared. In this study, we chose the definition proposed by Haberl et al. (2007) [16], which has been widely recognized in recent years. According to the definition of HANPP [16], two major parts were considered when human activities appropriated the ecosystem NPP, the harvested biomass and the HANPP caused by land use and land conversion. Specifically, agricultural harvest, forestry product, and livestock grazing are defined as principal combinations of the harvested part (HANPPharv) [40]. The NPP of the potential natural vegetation without human disturbance is called NPPpot and the one of the currently prevailing vegetation is called NPPact, and the difference between them (HANPPluc) was defined as the change in biomass caused by human-induced land use. Some amount of biomass still remains in the ecosystem after harvest (i.e., straw and stump), which is called NPPeco. Therefore, HANPP could be calculated using Formula (1) and transformed into more detailed forms using Formula (2). Figure S1 presents a conceptual model of HANPP.
H A N P P = N P P p o t N P P e c o = H A N P P l u c + H A N P P h a r v
H A N P P l u c = N P P p o t N P P a c t
Accurate estimation of NPPpot is the key to quantifying HANPPluc. In terms of the selection of estimation models, many studies have used the Lund–Potsdam–Jena dynamic global vegetation model (LPJ-DGVM) [16,41]. The Integrated biosphere simulator (IBIS) and LPJ-GUESS (general ecosystem simulator) models can also simulate the vegetation dynamics under different climate scenarios [42]. However, these models are mainly applied on the global scale, and the resolution is generally 0.5° × 0.5°, which is not suitable for the accurate characterization of small-scale HANPP when used alone. In addition, some studies have established the transformation relationship between NPPact and NPPpot in stable-vegetation areas based on climatic elements to achieve an extended estimation of non-vegetated areas. Among them, O’Neill et al. (2007) divided all pixels of land use data into ones disturbed and undisturbed by human activities and assumed that the NPPpot of undisturbed pixels is equal to NPPact, whereas the NPPpot of all disturbed pixels could be replaced by the average NPPact of the surrounding undisturbed pixels [2]. Models such as Miami, Thornthwaite Memorial, and Chikugo have been widely used for estimating NPPpot by establishing the relationship between meteorological indicators and potential vegetation [5,23,43]. To integrate the advantages of each model, improve the accuracy of NPPpot estimation, and represent the optimal NPPpot in their research, Erb et al. (2016) used the average value of the Miami model, the LPJ-DGVM model, and a vegetation-approach model [44]. Therefore, in this study, NPPpot was derived by combining the Thornthwaite Memorial model, the LPJ model, and the vegetation-approach model, among which the result of the LPJ model came from the potential NPP simulation with a resolution of 0.5° × 0.5° under the S2 scenario provided by the TRENDY program. In addition, according to the research of Erb et al. (2016) on global vegetation biomass [44], the conversion rules of NPPact and NPPpot of various land use types were extracted (Table S3) so as to drive the vegetation-approach model. The spatial patterns of NPPpot simulated by the three models are highly similar, and the results of each model and the average value of NPPpot in China are shown in Figure S2.
HANPPharv is the biomass harvested or destroyed during harvest (harvest of crops and crop residues, harvest through livestock grazing, harvest through forestry, etc.), which is derived from the statistics yearbooks from the Chinese National Bureau of Statistics database, and HANPPharv in this study was converted into carbon (gC) by assuming an average carbon content of dry matter (DM) biomass of 50% [18]. HANPPharv on cropland consists of crop harvest and the used or unused residues [45]. The annual yields of 15 kinds of crops widely cultivated in China were collected, and their harvested fresh weights were converted into dry matter equivalents with the moisture content (%). The moisture content of the specific crop was obtained from the International Network of Food Data Systems provided by FAO (http://www.fao.org/infoods/infoods/tables-and-databases/ (accessed on 20 March 2022)) and the literature [3,5]. Furthermore, the crop residues were calculated from crop yield data with the harvest factors and recovery rates (the former is the ratio of crop residual to primary crop harvest, and the latter is the ratio of used crop residues to available residues), which were obtained from the literature [18]. The grazed biomass was calculated as the difference between feed demand and supply [45]. In this study, 5 grass-feeding livestock species (asses, horses, mules, cows, and sheep) were transformed into standard sheep units and the feed demand was calculated by the forage consumption (1.8 kg of dry matter coarse forage per sheep unit per day). In addition, the feed supply was derived by the conversion coefficients from croplands to straw from 6 crops species (i.e., rice, wheat, maize, millet, sorghum, and soybeans) and the 25% straw utilization factor [5]. The forestry harvest includes the removal of timber and felling losses. The total timber and bamboo production was collected from the Chinese National Bureau of Statistics and the National Forestry Statistical Yearbook; 49.5% of wood density (0.495 t/m3) was used to convert fresh weight to dry matter [46], and the felling losses were estimated using recovery rates defined as the ratio of wood removal to felling [18]. In addition, considering the method of Haberl et al. (2007) [16], HANPPharv on built-up land was assumed to be 50% of NPPact. The detailed calculation methods of HANPPharv are provided in Supplementary File S1.

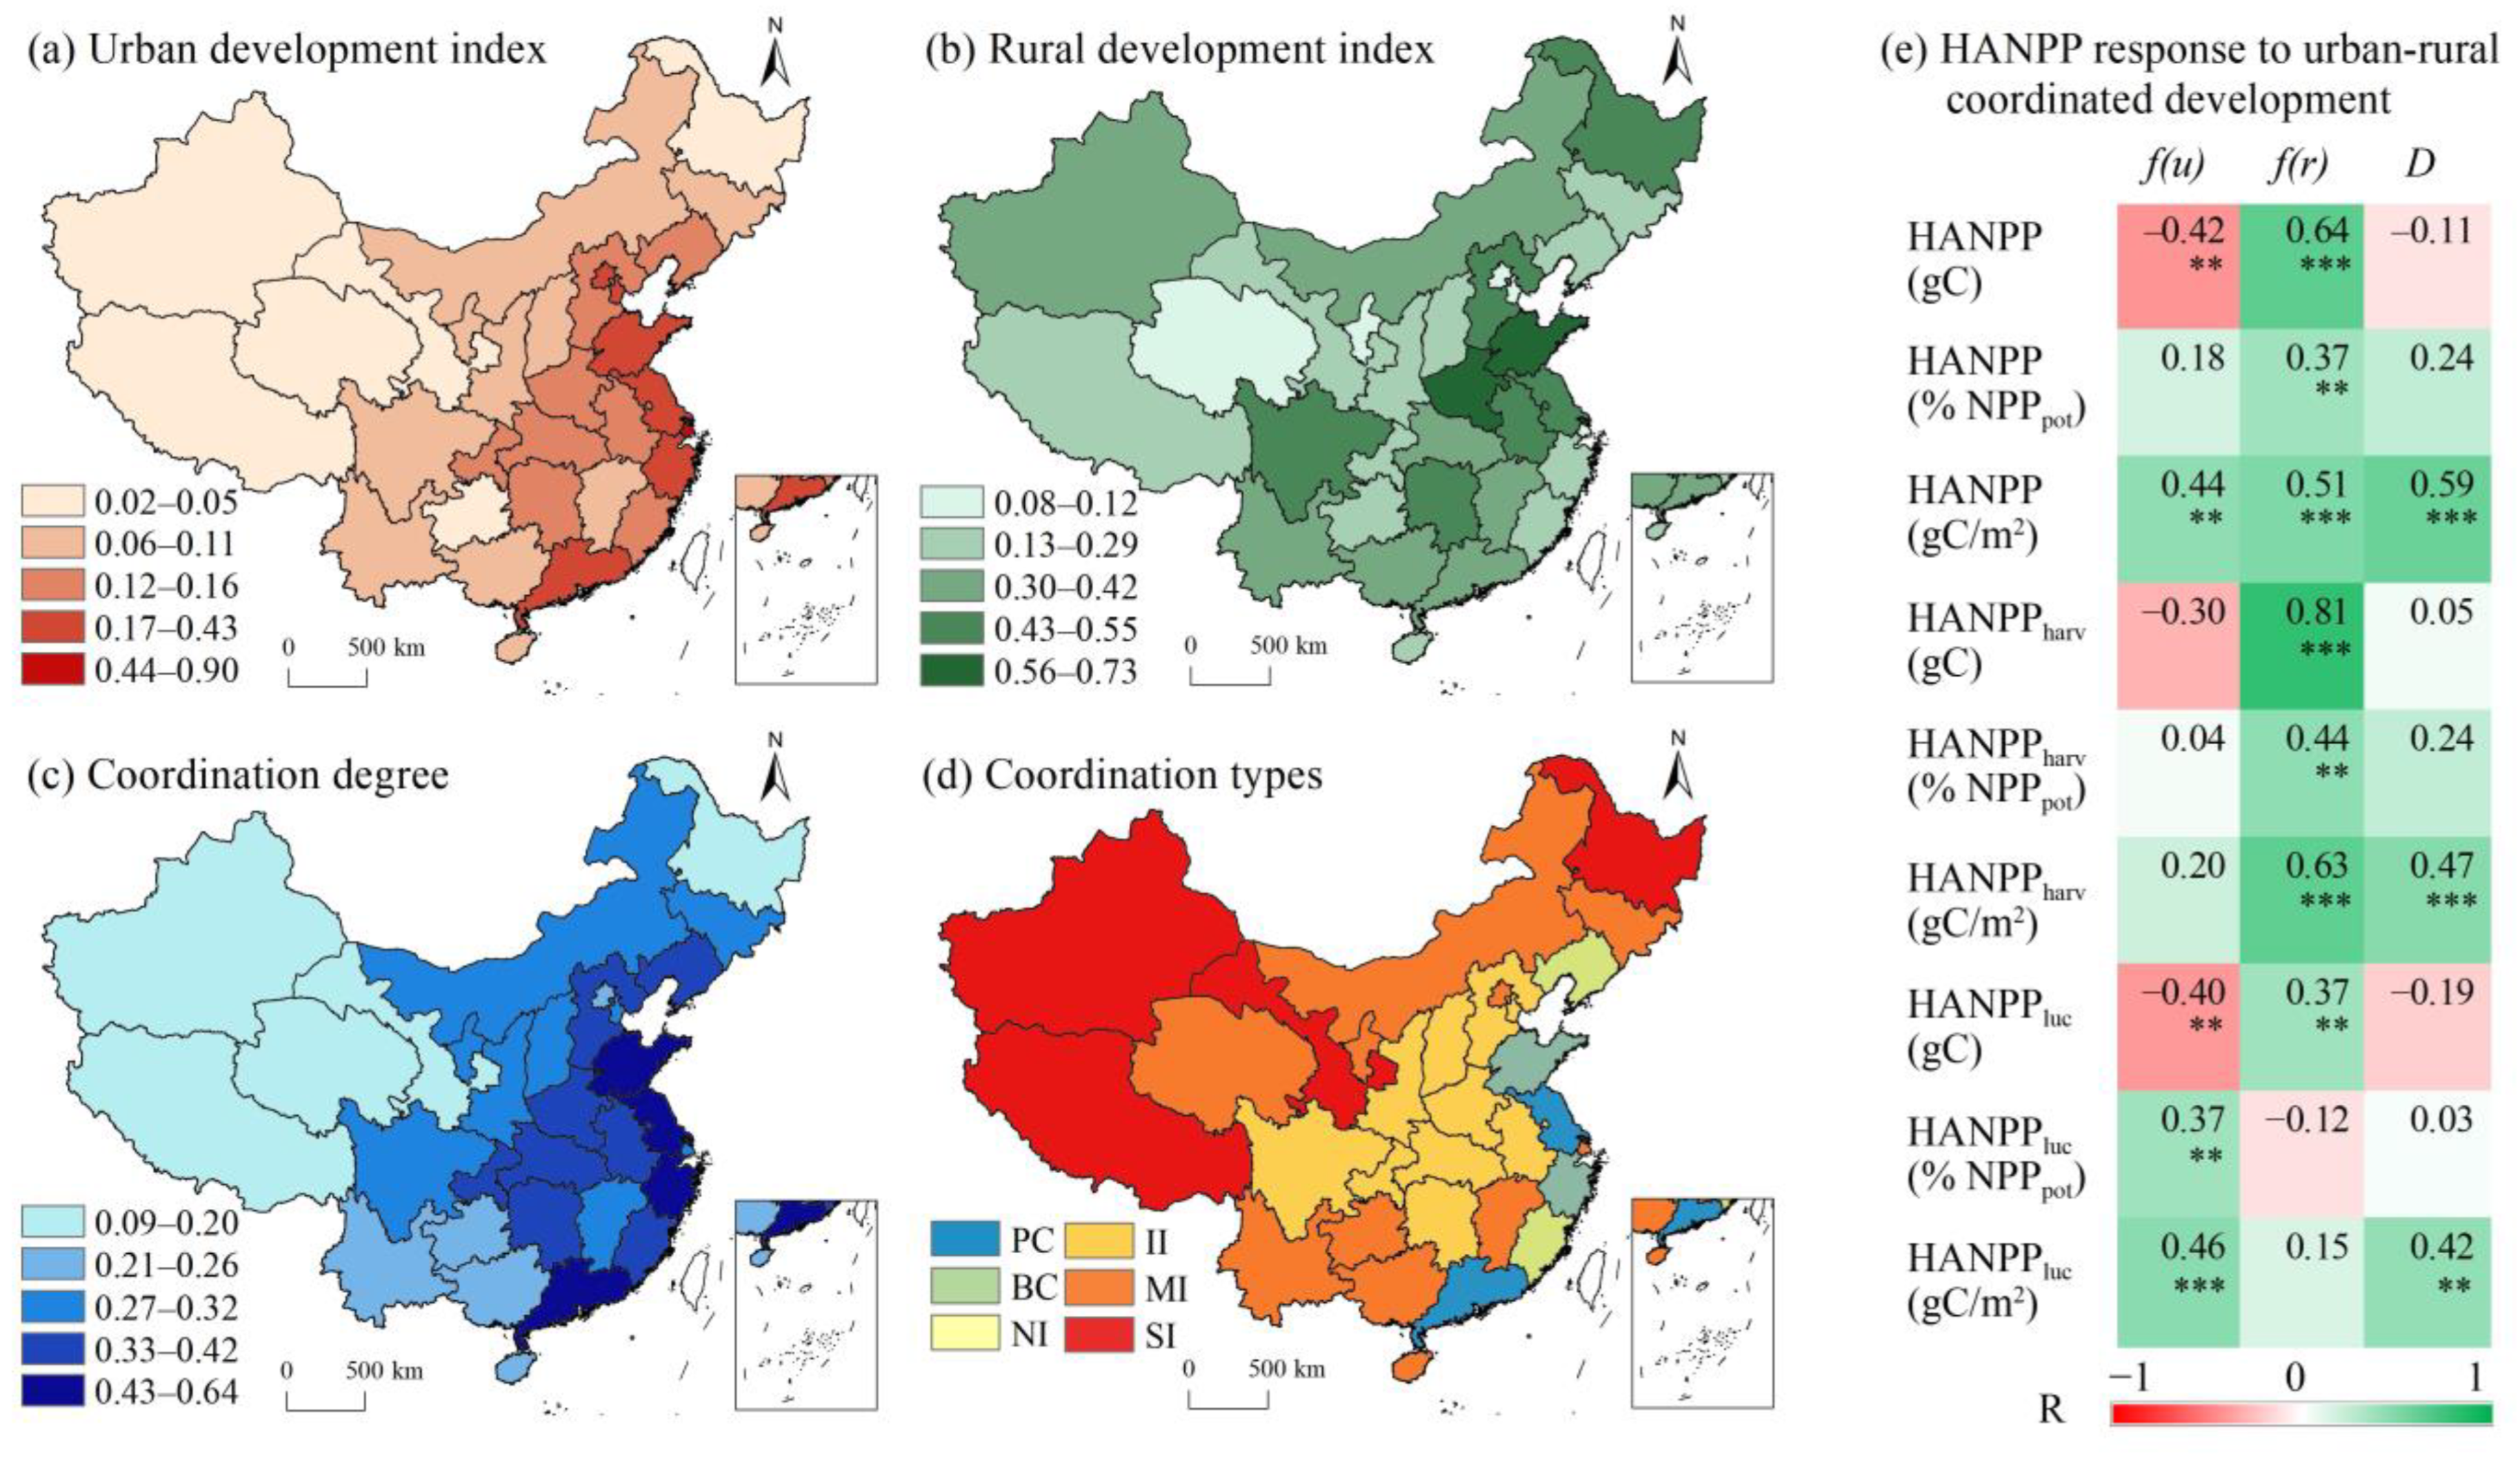
2.3. Quantification of Urban and Rural Development

In this study, the focus was how HANPP responds to regional development in China, so multi-indicators were selected to quantify the unbalanced urban–rural growth. Urban areas expand spatially when people crowd into these areas as the economy improves. According to this, 10 urbanization indicators from three perspectives (economy, population, and spatial expansion) were chosen to detect their relationship with HANPP. The corresponding rural development could also be measured using those 10 indicators but from the perspectives of economy, population, and agricultural technology. The indicators from 31 Chinese provinces, presented in Table 1, which were collected from China’s statistical yearbooks of 2015, provide a comprehensive reflection of China’s urban–rural development. The level of coordinated urban–rural development in China was also assessed using these indicators. After standardizing with the data range, the weight of each indicator in Table 1 was calculated using the entropy method [47]. Then, the urban and rural development indexes (expressed as f(u) and f(r), respectively) in 31 provinces in China could be quantified. A larger value of f(u) or f(r) means a higher level of rural–urban development, with which the comprehensive urban–rural development index (T) was also calculated. In addition, referring to the coupled coordination model in physics, the coupling degree (C ∈ [0, 1]) expressed by f(u), f(r), and T was used to analyze whether the whole urban–rural system is ordered. Since the C value only reflects the interaction within each system, which cannot indicate the coordinated order [48], the coordinated development degree (D ∈ [0, 1]) in each province was evaluated by the coordination degree model, which was divided into 9 levels in this study [49] (Table 2). The detailed formulas of all the indicators are presented in Supplementary File S2.

2.4. Statistical Methods

Spatial analysis in ArcMap 10.3 and multi-statistical methods were applied to the evaluation of spatial heterogeneity and driving factors of HANPP in China. In this study, the independent-samples t test was used to explore the differentiation of HANPP and its components and investigate whether HANPP differs significantly among different zones in China (i.e., western, eastern, northern, and southern area; coastal land; and inland area). Furthermore, stepwise regression analysis helped verify what kind of constraints the urban–rural development in China exerted on HANPP and then we extracted the factors dominating the differentiation of HANPP based on the standard partial regression coefficient in the model.

3. Results

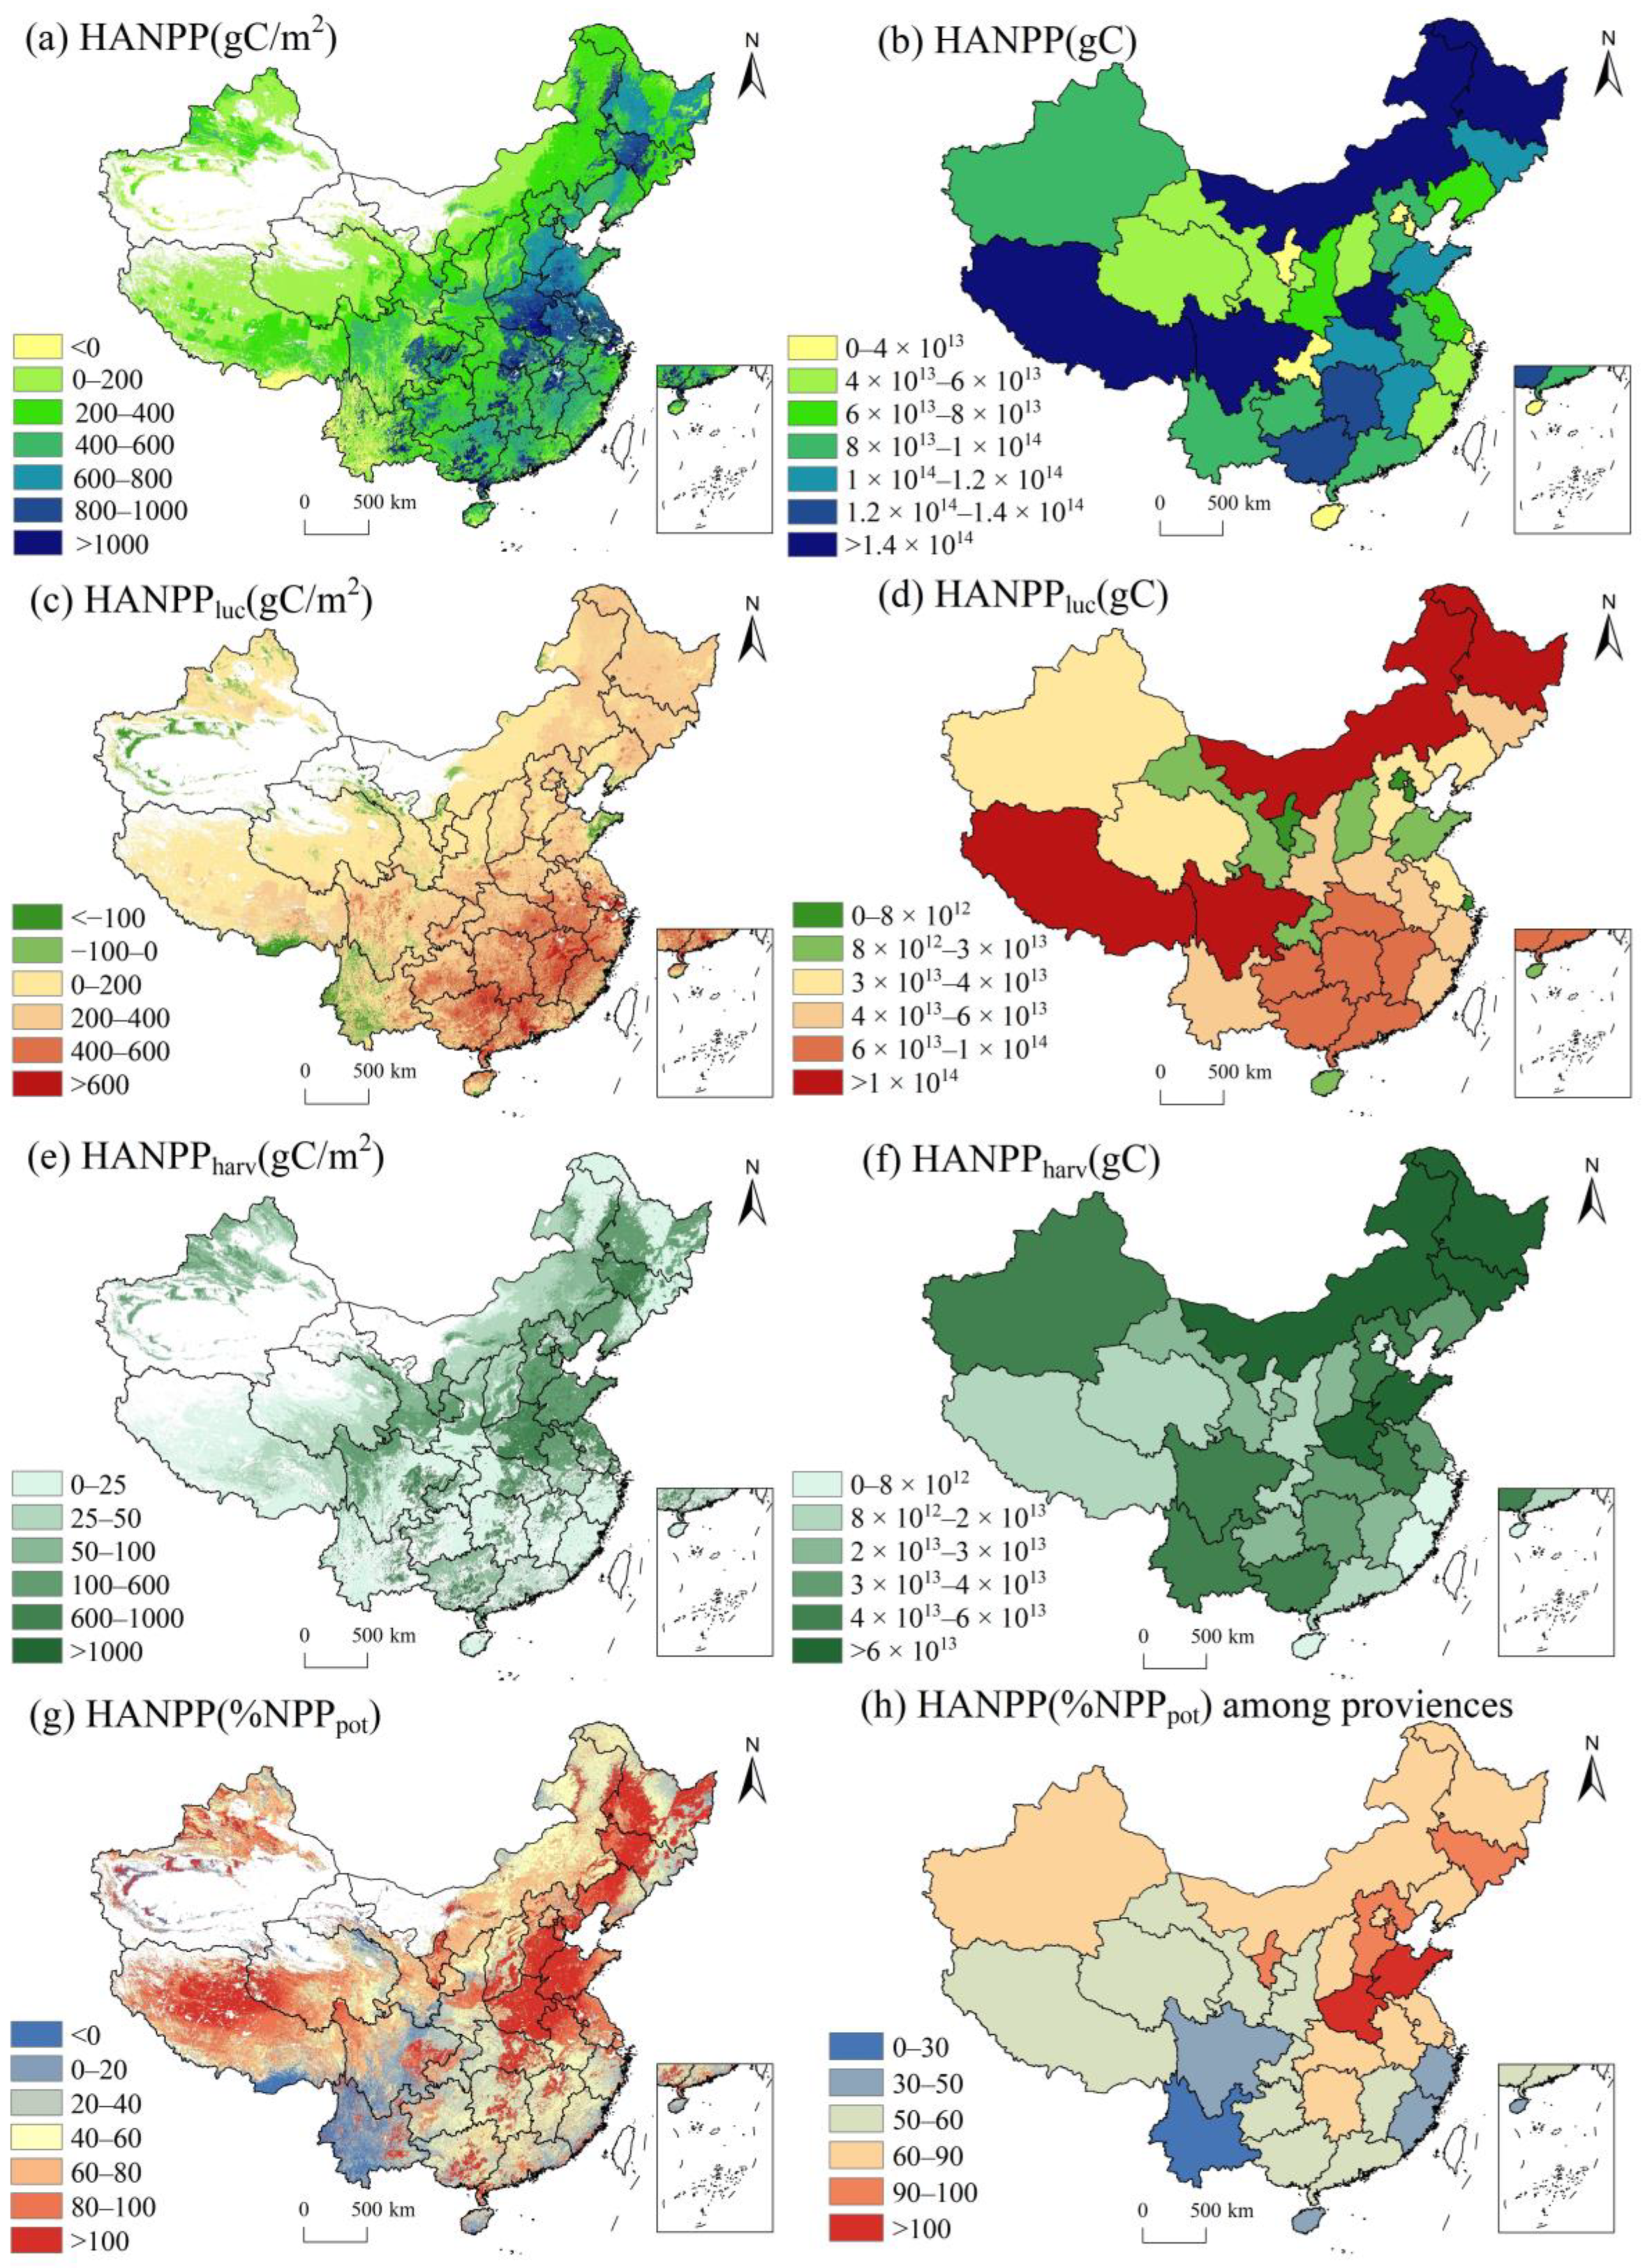
3.1. Spatial Distribution of HANPP in China

The total amount of human appropriation of biomass was 2.68 PgC, representing 60.33% of the NPPpot in China in 2015. Figure 1a shows that HANPP (gC/m2) gradually decreased from the southeast to the northwest of China, showing an obvious difference on both sides of the Hu Huanyong Line (the mutation line of China’s population density). Hunan, Hubei, Henan, Jiangxi, Guangxi, Guangdong, and Jilin Provinces had high HANPP values (greater than 1000 gC/m2). The negative value of HANPP (gC/m2) came from the contribution of HANPPluc, mainly concentrated in central Xinjiang, western Yunnan, and southern Tibet, reflecting that the actual carbon sequestration of vegetation was higher than the potential sequestration under the same climatic conditions. Among these, the negative HANPP values in Xinjiang Province mainly appeared in the cultivated land. In addition, two high-value strips were identified in the east–west direction of HANPP (gC) in each province (Figure 1b), which consisted of Inner Mongolia (0.224 PgC), Heilongjiang Province (0.207 PgC), Sichuan Province (0.170 PgC), Tibet (0.146 PgC), and Henan Province (0.143 PgC).
Figure 1c shows obvious positive and negative differences in HANPPluc (gC/m2) in China in 2015, indicating that land use change played a bidirectional role on ecosystem NPP. An HANPPluc (gC/m2) value of less than 0 means that the production capacity of vegetation after human intervention could be higher than the potential capacity under the same climatic conditions. The negative values of HANPPluc (gC/m2) in Xinjiang, Ningxia, and Gansu Provinces were mainly the result of cultivated land, indicating that in regions with a relatively insufficient natural background, cultivation based on artificial management could break through the climate limit of biomass accumulation to a certain extent, which has been confirmed by an existing study [18]. On the contrary, positive values of HANPPluc (gC/m2) were dominant across the whole country, indicating that human activity has destroyed the original green spaces to a certain extent, and HANPPluc (gC/m2) values in big cities (i.e., Beijing, Tianjin, Shanghai, Shenzhen, and Guangzhou Provinces) were significantly higher than those in surrounding areas. Total HANPPluc (gC) values of over 0.1 PgC are mainly concentrated in Inner Mongolia (0.148 PgC), Tibet (0.130 PgC), Heilongjiang Province (0.118 PgC), and Sichuan Province (0.112 PgC) (Figure 1d). Although China has continuously strengthened the protection of grasslands and vigorously promoted the policy of “returning grazing land to grassland” in recent years, most grassland was still overloaded and overgrazed [50]. Inner Mongolia and Tibet are the key pastoral areas of China, and the high values of HANPPluc (gC) in Inner Mongolia and Tibet were mainly related to grassland degradation caused by grazing.
The North China Plain and northeast provinces in China had relatively high HANPPharv (gC/m2) values (Figure 1e), with an average value of more than 600 gC/m2, and the biomass harvest in these regions was mainly provided by cultivated land. Among them, Shandong and Henan Provinces had the most extensive distribution of cultivated land with stable production. In addition, there was significant spatial heterogeneity of HANPPharv (gC/m2) among the provinces in southern China, where the harvest of crops and the amount of crop residues were much higher than those in the surrounding woodlands. The limited ecological land in northern Xinjiang Province showed relatively high HANPPharv (gC/m2), mainly resulting from grassland and cultivated land. Figure 1f shows that the high-value areas of HANPPharv (gC) in each province in 2015 expanded from the North China Plain to the entire northeast of China. Among them, Henan (0.097 PgC), Heilongjiang (0.089 PgC), and Shandong (0.077 PgC) were the top three provinces of HANPPharv (gC), while Beijing, Tianjin, and Shanghai Province were at the bottom since they did not undertake the production function and their area is relatively small.
HANPP (%NPPpot) can reflect the ecological pressure caused by the use of resources resulting from human activities, and the low-value areas of HANPP (%NPPpot) were mainly distributed in the southeast coastal areas and southwest China (Figure 1g). Specifically, the mountainous area accounted for more than 80% of the total area in Yunnan Province, which limited the destruction of natural vegetation and land reclamation by humans. In addition, the HANPPharv in southeastern coastal provinces mainly resulted from the low-level harvest of forestry, which also led to a relatively low HANPP (%NPPpot). It is worth noting that Tibet is a major pasturing area in China, but the NPPact in Tibet was only 137.38 gC/m2, while the harvest through livestock grazing was already close to the NPPpot, so the HANPP (%NPPpot) in most areas of Tibet was generally high in 2015. Estimating the HANPP (%NPPpot) of each province helps identify the regions with oversaturated ecological occupation in China, which provides scientific support for formulating urban development strategies and ecological construction measures in corresponding areas. It can be seen from Figure 1h that HANPP was high (%NPPpot) in the grain-producing provinces in the North China Plain, while HANPP was low in the southwestern provinces with complex terrain. With the major grain-producing provinces benefiting from improved agricultural technology and efficient manual management, the high value of HANPP (%NPPpot) in these provinces was actually a sign of a significant increase in land production efficiency.

3.2. Contributions of HANPP Components

The total amounts of HANPPluc and HANPPharv were found to be 1.63 PgC and 1.05 PgC, respectively, in China in 2015. Specifically, the harvest through cropland, livestock grazing, and forestry contributed 29.86%, 8.53%, and 0.91% to the total HANPP, respectively, while the land-use-induced biomass appropriation contributed 60.70%. However, there were great differences in the contributions of HANPP components among provinces (Figure 2). HANPPluc played the dominant role among 21 provinces (over 50% of HANPP), especially in the cities with rapid urban expansion (i.e., Shanghai and Beijing, with 74.82% and 74.78% of HANPPluc (%HANPP), respectively) and some coastal cities (i.e., Fujian, Zhejiang, and Guangdong, with 86.07%, 85.99%, and 79.07% of HANPPluc (%HANPP), respectively). On the contrary, the harvest on cropland (HANPPharv (crop)) contributed most to HANPP in Shandong (62.33%), Henan (57.30%), Jilin (51.66%), Jiangsu (50.58%), and Hebei (50.46%), the traditional grain-producing provinces, and livestock grazing in the traditional pastoral regions (i.e., Gansu, Xinjiang, Ningxia, and Qinghai) resulted in 20% of HANPP. It is worth noting that different urban functions and development planning resulted in various ecological occupation structures, and expansive impervious surface replaced almost all ecological land in Shanghai, the economic center in China, where HANPPluc contributed the highest to NPPpot in China (50.55%). Compared with the high HANPP (%NPPpot) due to harvested biomass through cropland, livestock grazing, and forestry, the substantial compression of ecological land due to excessive urban development needs more attention.
The amount of HANPPharv can reflect the production capacity of an ecosystem, and the regional population directly determines the consumption demand of the local biomass. Without considering the local import and export, we built a production–consumption ratio, which was calculated as the ratio of HANPPharv to the multiplication of national biomass consumption per capita and the regional population. The production–consumption ratio was divided into three types: an area was self-sufficient if the ratio was close to one, a ratio over one indicated adequate biomass production, and a ratio under one indicated inadequate biomass production. The latter two values lead to ecological resources being circulated among regions. On the basis of HANPPharv in 2015, a significant imbalance could be found between the supply of and demand for biomass in China (Figure 3a). In all, 14 provinces in the north and southwest China were defined as the production type, and ratios over the 95th percentile were found in the sparsely populated Tibet (6.36) and Inner Mongolia (4.07). Conversely, the remaining 17 provinces in the middle and southeastern coastal areas in China needed external biomass supplies. Specifically, the production–consumption ratios of rapidly growing cities such as Shanghai (0.06) and Beijing (0.09) were under the fifth percentiles. Furthermore, it should be clarified that a telecoupling of ecological resources always occurs in remote spaces, and the gradient differences of production–consumption ratios in Figure 3a represent interregional resource flows; more attention should be paid to this in future studies.
Five dominant production types were identified among 31 provinces with production–consumption ratios of HANPPharv through agriculture, forestry, and grazing (Figure 3b), and a significant spatial aggregation could be found among all these types. A great number of ecological resources were needed among consumption regions with ratios under 1, which included the metropolis with high population densities (i.e., Shanghai, Beijing, and Tianjin) and several provinces in the middle of China. On the contrary, only two production regions (i.e., Inner Mongolia and Jilin) were found in the northeast of China where the production–consumption ratios of the components of HANPPharv were over 1. Furthermore, huge gaps existed among the three ratios in the remaining provinces and the highest ratio was selected as the dominant production type. Specifically, five agriculture-dominant provinces, situated mostly in the circum-Bohai Sea region, and five provinces in south China with better climate conditions, provided more biomass through forestry. HANPPharv through grazing was found as the dominant production type among eight traditional husbandry provinces in the west of China. Figure 3c shows that a universal positive correlation could be found between the production–consumption ratio and the HANPPharv (% of HANPP) through agriculture, forestry, and grazing in 31 provinces in China. The aggregation characteristics of sample points declared whether the HANPPharv was consumed locally, showing that the interregional flows and the exchange of agricultural and livestock products were more complicated than the forestry products.

3.3. Regional Differentiations in HANPP

An obvious spatial differentiation of HANPP was found in China. However, the focus should be to identify whether there is a significant difference among regionalization zones, and nine HANPP indexes were chosen for further discussion (Table 3). Here, the independent-samples T test was used to detect the differentiation of nine HANPP indexes across the four zones (Zone 1 to Zone 4; Figure S3). The result showed that HANPP (gC/m2), HANPPharv (gC/m2), and HANPPluc (gC/m2) were significantly different on both sides of the Huanyong Hu line (Zone 1) but their total amount and contribution to NPPpot did not pass the test. The same regional differentiation of HANPP indexes could be found between the western and eastern parts of China (Zone 2) as Zone 1, and the ecological pressure caused by human occupation (HANPP (%NPPpot)) was also significantly different in Zone 2. HANPPharv and HANPPluc have different sensitivities to meteorological elements, so the corresponding indexes showed various characteristics between the north and south parts of China (Zone 3), which was divided on the basis of regional temperature and precipitation. There is a difference between economic development and population agglomeration in China’s coastal and inland regions, so the HANPPharv indexes related to land productivity did not show significant differentiations in Zone 4. Furthermore, from the perspective of the nine HANPP indexes, it is worth noting that HANPP (gC/m2) showed significant differences among all the regionalization zones (Table 3). The complex characteristics of HANPP indexes in China indicated that they were not only restricted by population density and terrestrial natural conditions but that a complex mechanism of regional comprehensive development (i.e., economy, urbanization, and agrotechnique) also had an impact on them.

4. Discussion

4.1. Credibility of HANPP

In existing studies, HANPP (%NPPpot) has attracted more attention than HANPP (gC/m2) or HANPP (gC) due to its ability to represent regional ecological sustainability and the ecological pressure caused by human occupation. However, the lack of a uniform standard in the selection of estimation models of NPPpot and NPPact hinders the comparison of HANPP results among different regions. For instance, in related studies, a variety of models have been used to estimate NPPpot, e.g., LPJ-DGVM [16,41], the Guangsheng Zhou model [5], the new calibrated Miami model [45], and multiple-iterations modification based on the disturbed pixels in NPPact [2]. Rather than comparing the similarities of HANPP (%NPPpot) between regions, it is better to focus on whether its spatial distribution and long-term variation characteristics are similar.
In China, HANPP (%NPPpot) was found to be 60.33% in 2015, which is higher than it was in 2010 (57.80%), estimated by Chen et al. (2015) [5], as well as the global HANPP (%NPPpot) values in 2000 (23.80%), 2005 (25.00%), and 2010 (20.70%) [16,17,18]. Huang et al. (2020) found that HANPP (%NPPpot) was 72.4% in the Yangtze River Delta in 2015 [51], and we found a slightly lower value (68.92%) in the same region in this study. From the perspective of the spatial distribution characteristics of HANPP, the grid-scaled HANPP (%NPPpot) in this study is highly similar to the results of Haberl et al. (2007) and Kastner et al. (2021) [16,17]. In general, the simulation of HANPP among provinces and cities in China is still in its infancy and the deviations are mainly due to different methods and datasets used during NPPpot and HANPPharv estimation within limited studies.

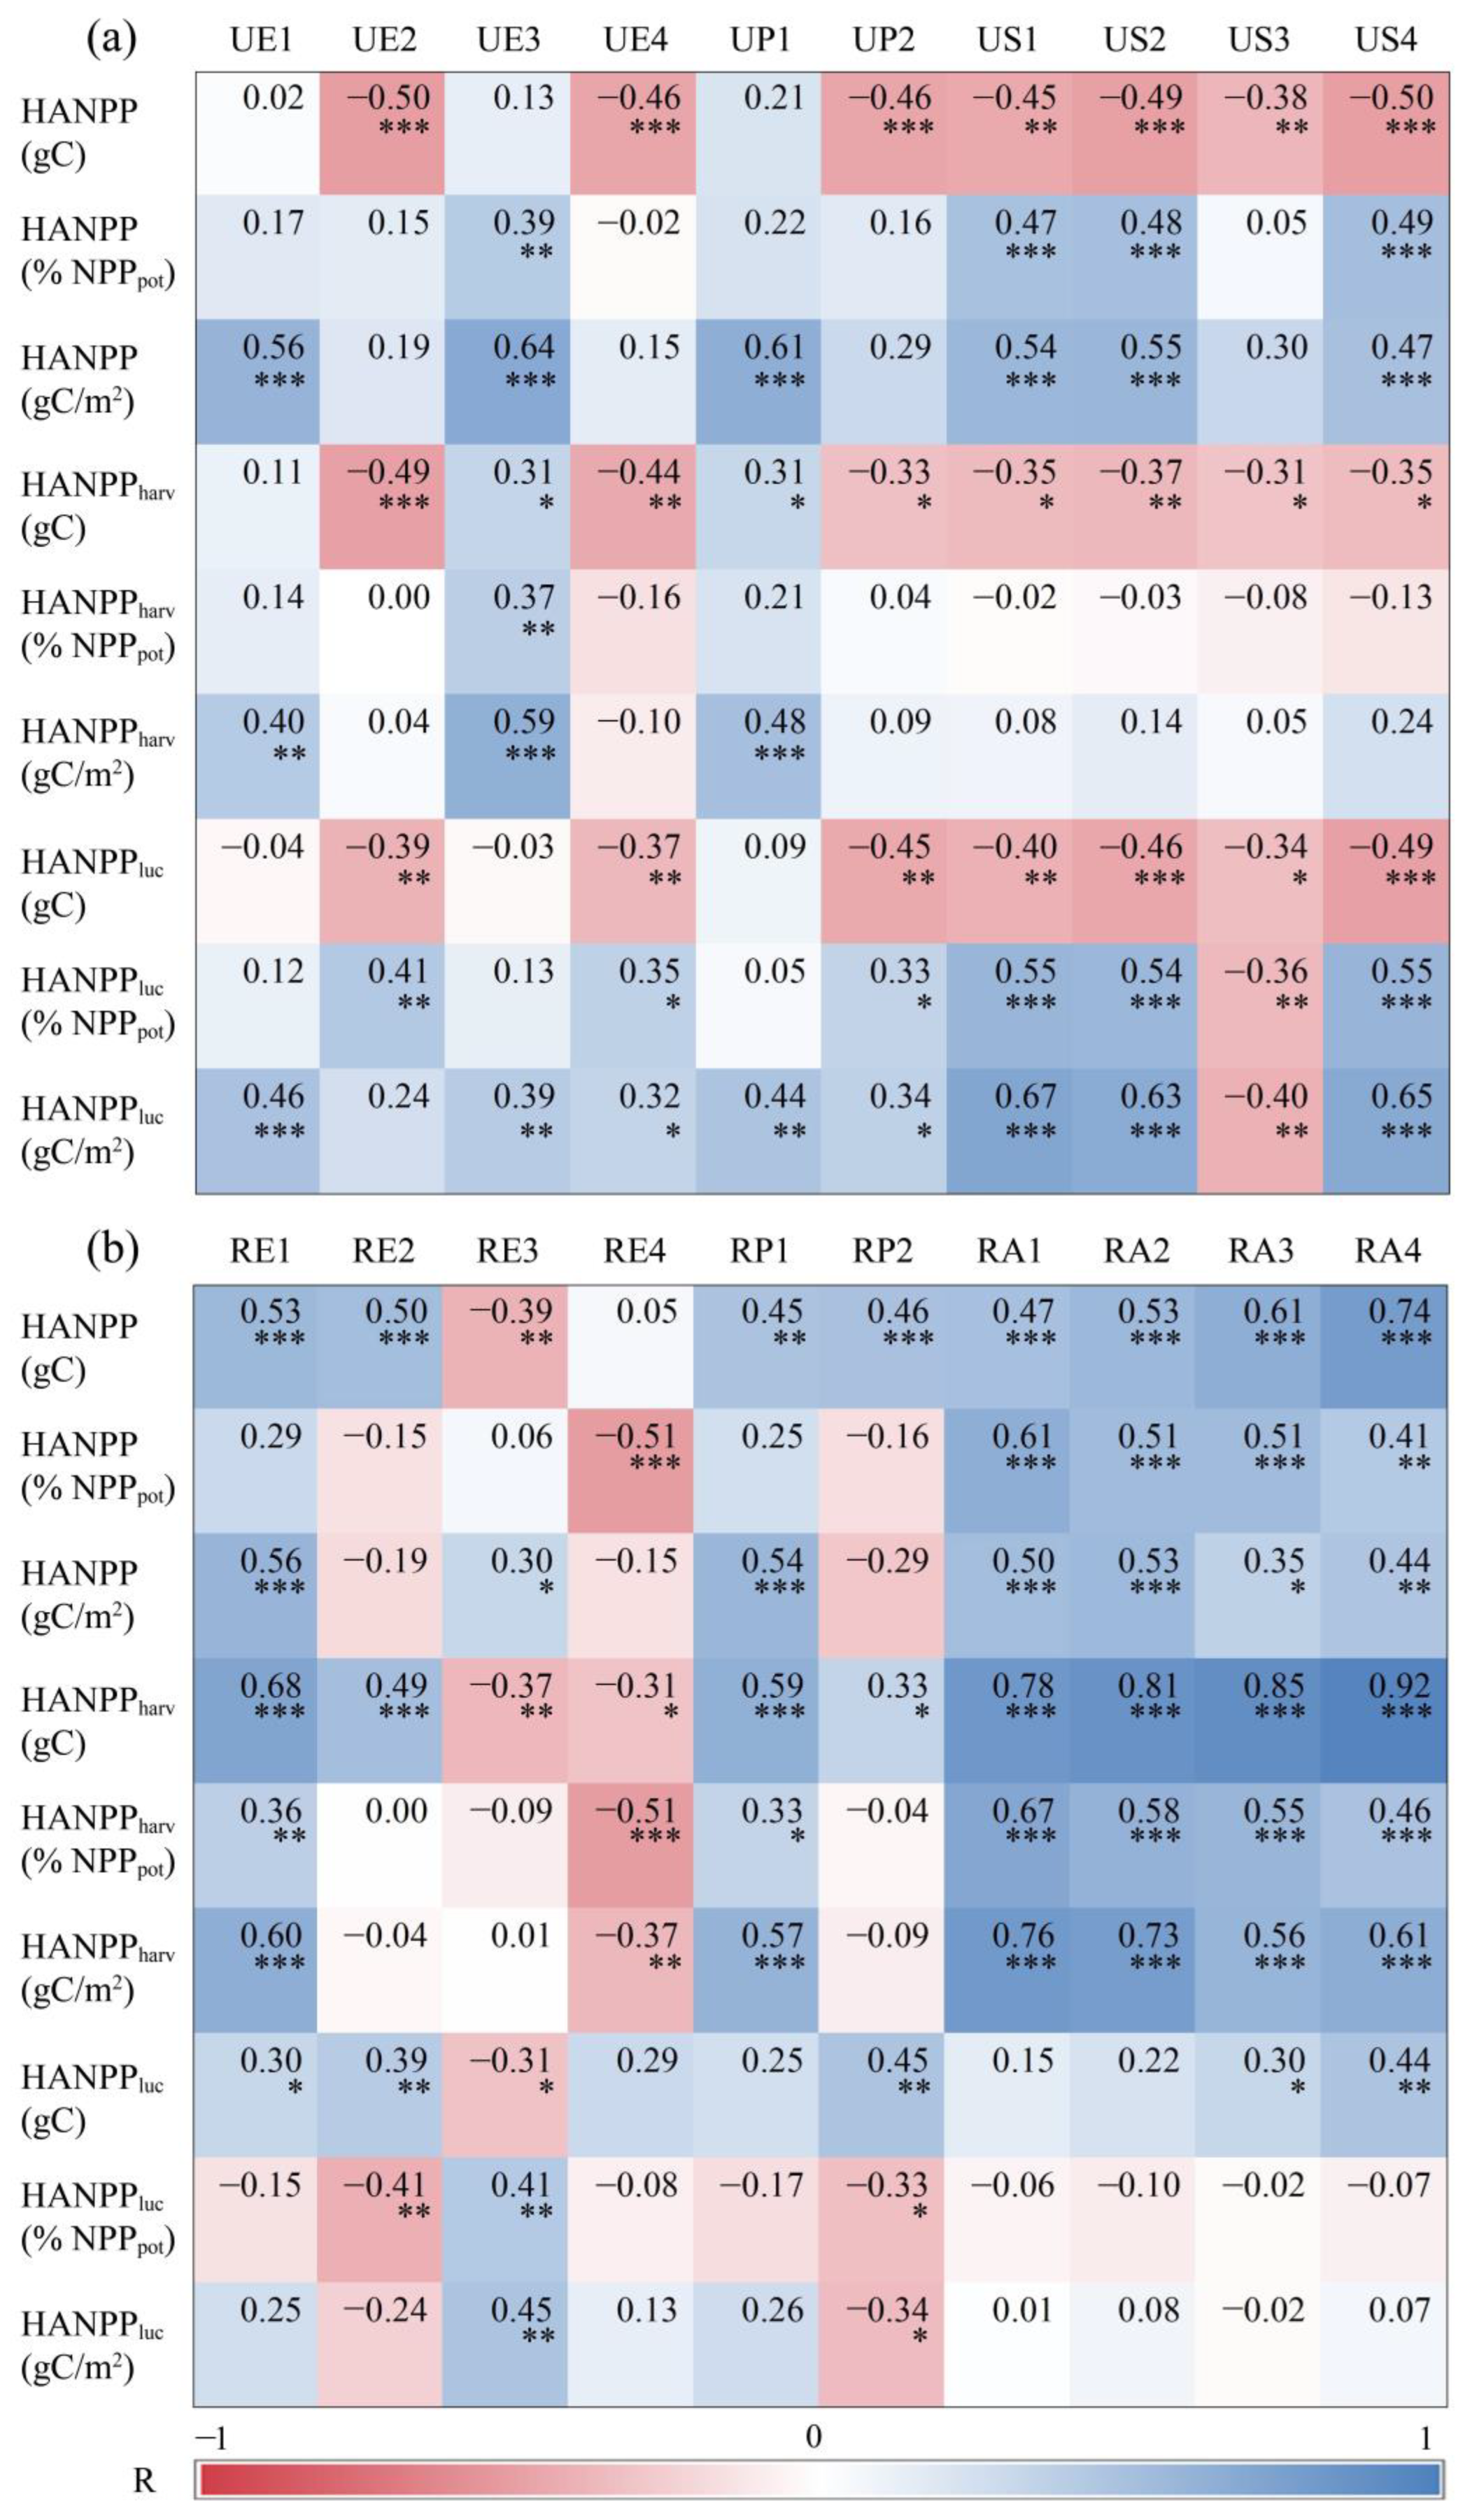
4.2. Relationships between HANPP and China’s Urban and Rural Development

Significant spatial differentiation of HANPP was found under the impact of unbalanced human activities and the ecological environment in China, especially the duality of rural–urban development. In this study, 20 indictors reflecting regional economy, population, urban expansion, and rural agricultural technology were chosen, as shown in Table 1, and the correlation coefficients and nine HANPP indexes (Table 3) of 31 provinces were summarized (Figure 4). From the perspective of urban economy, significant positive correlations were identified between the added value of the secondary and tertiary industries (UE1) and HANPP (gC/m2), HANPPharv (gC/m2), and HANPPluc (gC/m2). The added value of transportation, warehousing, and postal services (UE3) had a significant influence on most HANPP indexes (Figure 4a), which guarantees the circulation of regional ecological resources. However, UE2 and UE4 showed a negative correlation with the total amount of HANPP, HANPPharv, and HANPPluc, which is because a larger proportion of UE1 and a higher consumption expenditure of urban residents always appears in highly urbanized areas, which usually have a relatively weak biomass production (low HANPPharv); the HANPPluc would also not increase significantly when urban construction is saturated, so the HANPP indexes would be suppressed instead. High urban population (UP1) resulted in a great amount of biomass occupation per unit area, whereas the negative correlations between urban population proportion (UP2) and HANPP (gC), HANPPharv (gC), and HANPPluc (gC) reflected the polarization characteristics of the urban population agglomeration and ecological resource production. Among the urban spatial expansion indicators, the higher regional average nighttime light intensity (US1), the proportion of the built-up area (US2), and the proportion of the urban road area (US4) always corresponded with large HANPPluc (% NPPpot) and HANPPluc (gC/m2) values, which also directly led to the significant positive correlations (p < 0.01) and relatively high correlation coefficients with HANPP (% NPPpot) and HANPP (gC/m2). Conversely, urban ecological construction gained valuable space to counter the degradation of natural vegetation caused by urban expansion, and most of the HANPP indexes, especially the HANPPluc indexes, decreased as the proportion of urban green spaces increased (US3).
HANPP indexes responded to rural development in different ways (Figure 4b). Stronger positive correlations existed between the added value of the primary industry (RE1) and all HANPPharv indexes than UE1, and the total amount of HANPP, HANPPharv, and HANPPluc in each province was more sensitive to the proportion of the added value of the primary industry (RE2) than other HANPP indexes. Higher consumption expenditure of rural residents (RE3) appeared not only in highly urbanized areas but also in the agriculture, forestry, and animal husbandry developed areas, which showed relatively lower correlations with the total amount of HANPP, HANPPharv, and HANPPluc than UE4. The higher the Engel coefficient of rural residents (RE4), the lower the HANPP (% NPPpot) and all HANPPharv indexes. This shows that the main article consumed by residents was food, the regional economy was relatively lagging in terms of development, and the influence of human activities on ecology was relatively weak. Rural population (RP1) had significant and higher positive correlations with all the HANPPharv indexes than UP1 but no statistical correlations with HANPPluc indexes. Moreover, the biomass occupied through land use per unit area and its percentage in NPPpot would be reduced if the rural population was the main component (RP2) in a region. All the rural agricultural technology indicators showed similar impacts on the nine HANPP indexes, especially in terms of the significant positive effects (p < 0.01) on and high correlation coefficients among HANPPharv (gC), HANPPharv (% NPPpot), and HANPPharv (gC/m2). Adequate effective irrigated area (RA3) and total sown area of crops (RA4) are necessary for adequate food supply, the total power of the agricultural machinery (RA1) reflects the regional agricultural machinery ownership, and the harvest biomass of grain and forestry would benefit from these elements as well as the amount of agricultural fertilizer (RA2) applied.
An interaction effect always exists between regional economy improvement and biomass occupation, and industrial structure would alter the HANPP proration. Overdevelopment of the secondary and tertiary industries would restrain harvest biomass, but adequate ecological supply depends on the primary industry, so balanced industrial development should be the focus among regions. Harvested biomass (HANPPharv) is mostly determined by the rural population rather than the urban population, while the urban or rural population proportion has hardly any influence on it, indicating that urban people mainly play the role of the consumer of ecological resources. Urban sprawl, a result of land surface modification by humans, usually leads to the irrecoverable loss of NPP. Cultivated land offers additional products along with the improvement of agricultural technology, although it replaces part of the natural vegetation. Moreover, worldwide, the increasing populations and economies are inevitably accompanied by rapid urbanization, and the corresponding requirements of ecological resources must be sustainable. Thus, through policies and agriculture techniques, it is necessary to improve agriculture production and the utilization efficiency of NPP per area, as well as properly control urban expansion.

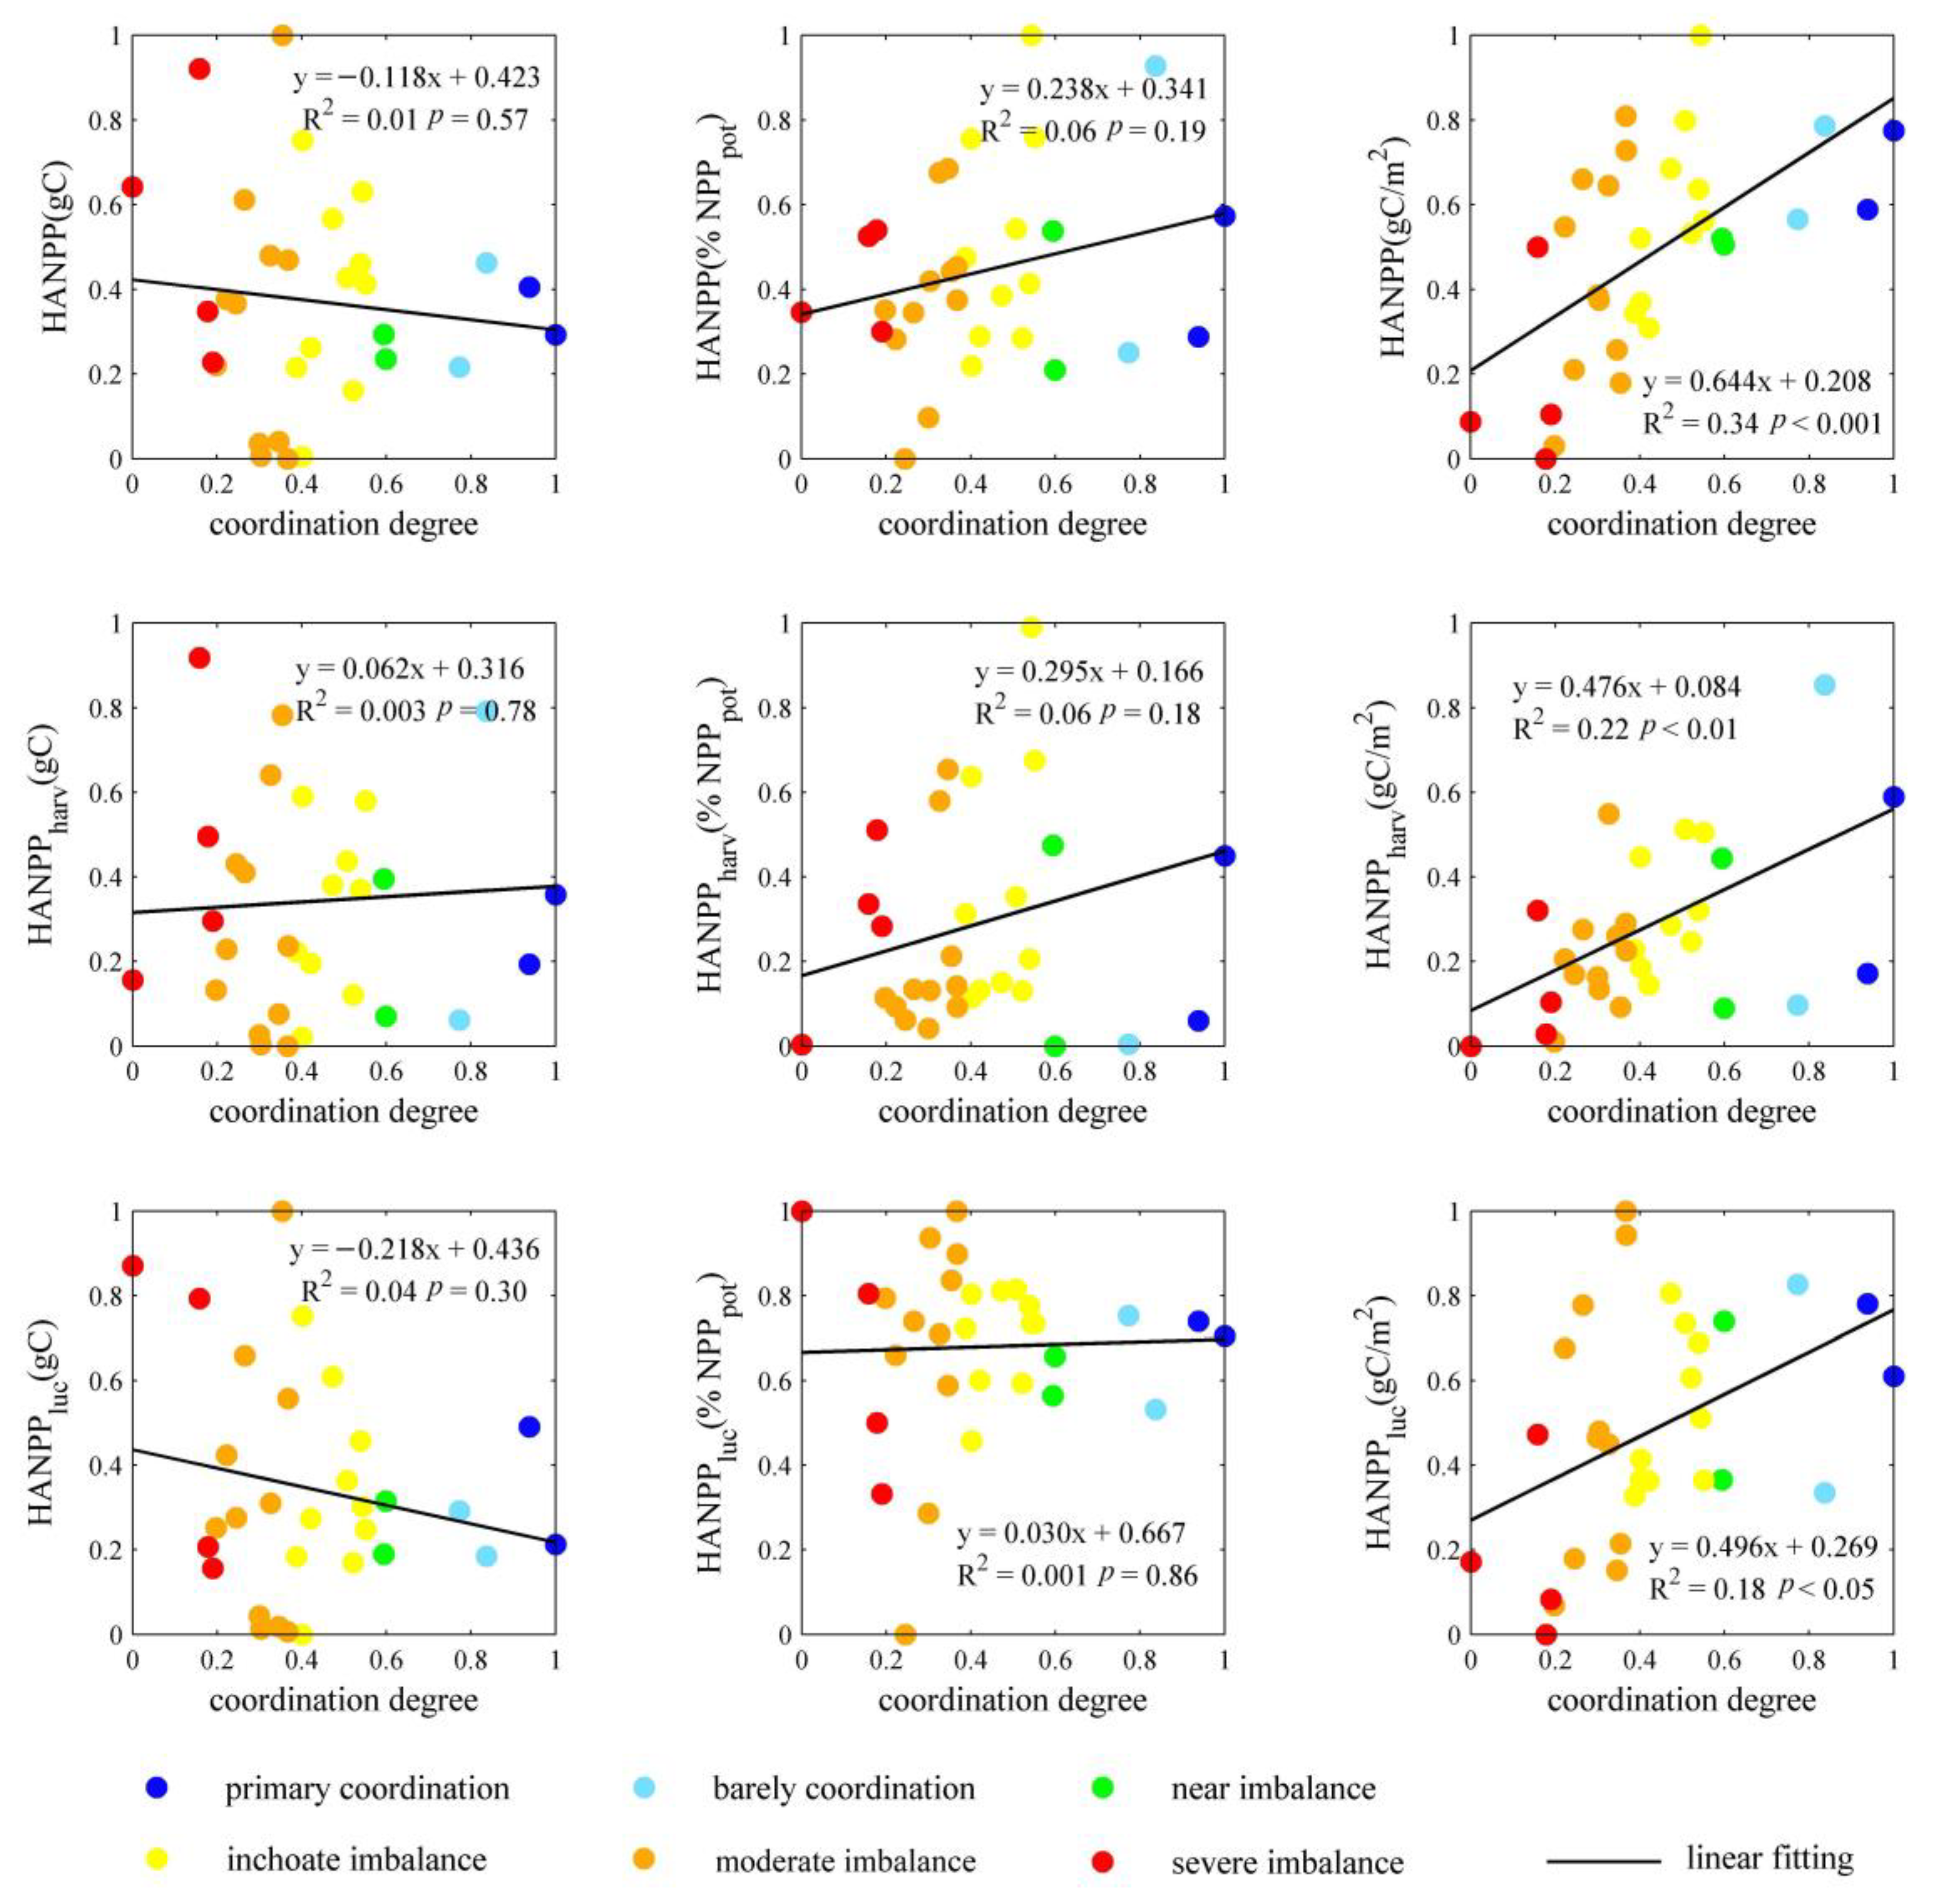
4.3. HANPP Responses to Coordinated Regional Urban–Rural Development

As two major systems indispensable to regional development, urban areas and rural areas play an important role in promoting sustainable use of ecological resources. Therefore, coordinated urban–rural development and the impact on the HANPP in 31 provinces in China was quantified. The quantification of the urban development index (f(u)) indicated that highly urbanized areas (Figure 5a) were mostly concentrated in the coastal provinces but high values of the rural development index (f(r)) mostly appeared in southern China (Figure 5b). Specifically, Shanghai (f(u) = 0.90), Beijing (f(u) = 0.43), Henan (f(r) = 0.73), and Shandong (f(r) = 0.68) showed the peak values over the 95th percentiles of f(u) and f(r). In contrast, the valley values under the fifth percentiles were in Qinghai (f(u) = 0.04), Tibet (f(u) = 0.02), Tianjin (f(r) = 0.09), and Beijing (f(r) = 0.08). Furthermore, the degree of coordinated urban–rural development (D) among provinces was evaluated by the comprehensive urban–rural development index (T) and the coupling degree (C) (Table S4) and showed an obvious spatial differentiation between coastal and inland areas (Figure 5c). In this study, the D value was divided into nine levels (Table 2) to map coordinated urban–rural development types in China (Figure 5d). Only a few coastal provinces had achieved primary coordination (Jiangsu and Guangdong) and barely coordination (Shandong and Zhejiang). Inversely, most regions showed a universal imbalance and urban–rural development gap. Notably, there was severe imbalance in Heilongjiang Province, Tibet, Gansu Province, and Xinjiang Province. In short, the ideal urban–rural coordination did not exist in China in 2015.
The relationship between HANPP indexes and coordinated urban–rural development (Figure 5e) helped create verifications and supplements for Figure 4. It is worth noting that f(u) and f(r) showed opposite driving effects on HANPP (gC), HANPPharv (gC), and HANPPluc (gC) and the regional ecological pressure characterized by HANPP (%NPPpot) and HANPP (gC/m2) mostly depended on f(r). The highly urbanized regions with high f(u) usually appeared in provinces with limited territorial areas (i.e., Shanghai, Beijing, and Tianjin), in which the total amount of occupied biomass was at a relatively low level. On the contrary, provinces with high levels of f(r) had relatively large territorial areas in China and developed production capacity. As a component of HANPP, HANPPluc was mainly controlled by the urban development index (f(u)). Conversely, f(r) made significant positive impacts on HANPPharv. All the occupied biomass indexes per unit area showed the most sensitive response to coordinated urban–rural development degree (D) and good urban–rural coordination obviously improved HANPP (gC/m2) and HANPPharv (gC/m2) but relatively weaker urban–rural coordination influenced HANPPluc (gC/m2) variation. From the perspective of six coordination types among provinces in China, the sample points of HANPPharv (gC/m2) tended to be discrete, along with a higher degree of coordination (Figure 6), and the samples with moderate imbalance (MI) urban–rural coordination showed the highest degree of dispersion of HANPP (gC/m2) and HANPPluc (gC/m2).

4.4. Dominant Driving Factors of Each HANPP Index

Bidirectional effects were found among urban–rural development indictors of biomass appropriation, and the dominant driving factors of each HANPP index were detected by stepwise regression to eliminate the indirect correlation. Table 4 shows the fitting models and correlation coefficients from three perspectives (urban, rural, and urban–rural development), in which stronger decisive effects were displayed by the driving factor with larger standardized coefficients, and a higher R referred to a better fitting model. Among all the driving factors in the 27 fitting equations in Table 4, the rural development indicators (34 times) appeared more frequently than the urban development indicators (21 times). At the same time, in different dimensions of urban–rural development, each HANPP index was more likely to be affected by urban economy (UE) than rural economy (RE), more likely to be affected by rural population (RP) than urban population (UP), and more likely to be affected by rural agricultural technology (RA) than urban spatial expansion (US). From the analog effect of each equation, driven by 20 urban and rural development indicators, the analog effect of HANPPharv indexes was the best, followed by that of HANPP indexes, and HANPPluc indexes were the weakest; the selected urban and rural development indicators could explain their variation characteristics only to a certain extent. From the perspectives of urban, rural, and comprehensive urban–rural development, the analog effects of all the nine HANPP indexes were the best when only considering rural development indicators, followed by the regression models of comprehensive urban–rural development indicators, and the ability to explain HANPP indexes was relatively limited when only considering urban development indicators. From the perspective of the explanatory ability of each independent variable, the impact of urban economy (UE) on occupied biomass was much stronger than that of urban population (UP) and urban spatial expansion (US). On the contrary, rural population (RP) and rural agricultural technology (RA) had more significant explanatory effects on each HANPP index than rural economy (RE). Among all the independent variables, UP2, US1, US2, US3, and RA3 did not appear in any of the fitting models.
Comprehensively considering the dominant driving factors and standardized coefficients of each HANPP index, it was found that UE3 had the strongest explanation for the differentiation characteristics of HANPP (gC/m2) and that the restriction of RP and RA indicators on HANPP (%NPPpot) was much stronger than that of urban development indicators. The total amount of HANPP (gC) was affected by the opposite effects of RA4 and US4, and RA4 showed a stronger control of it. In addition, RP and RA indicators showed absolute driving advantages in HANPPharv (%NPPpot) and HANPPharv (gC) and RA indicators had a stronger positive driving effect on them. From the perspective of comprehensive urban–rural development, urban development indicators had no significant driving effect on the above two indexes. The influence of each independent variable on HANPPharv (gC/m2) was relatively complicated, in consideration of RA, UE, and US indicators, and a better-fitting model could obtain HANPPharv (gC/m2); the standardized coefficient showed that the urban development indicators played a more important role. Table 4 shows that the fitting equations between the independent variables and HANPPluc were relatively simple. US4, RE2, and UE1 were the dominant driving factors for HANPPluc (gC), HANPPluc (%NPPpot), and HANPPluc (gC/m2), respectively, and none of the population factors were correlated. It should be noted that the ability of selected independent variables to interpret all HANPPluc indexes was significantly weaker than their ability to interpret HANPP and HANPPharv, indicating that there are driving factors besides those selected in this study. Further analysis of the positive or negative driving differences of each independent variable showed that UE3, RA1, RA2, and RA4 had a significant positive influence in each fitting model, which could be verified and compared with the results in Figure 4. In summary, HANPP (%NPPpot), HANPPharv (%NPPpot), and HANPPluc (%NPPpot) were more dependent on rural development, while urban development was the decisive factor for all HANPP indexes per unit area, and the total amount of occupied biomass of each province was more affected by rural development than urban.

5. Conclusions

In this study, we estimated the HANPP in China in 2015 based on multi-source datasets and quantified the contribution characteristics of HANPP components as well as the biomass production–consumption types in 31 provinces. The regional differentiations of HANPP indexes among typical regionalization zones were also identified. In addition, an evaluation framework of urban–rural development was built to investigate how HANPP indexes respond to the regional unbalanced development and we identified the dominant driving factors of HANPP indexes from the perspectives of economy, population, urban expansion, and agricultural technology. The results showed that the total amount of HANPP was 2.68 PgC and gradually decreased from the southeast to the northwest of China, which represented 60.33% of the NPPpot. The grain-producing provinces had high HANPP (%NPPpot) values, while the southwestern provinces with complex terrain had low HANPP (%NPPpot) values. HANPP (gC/m2), HANPPharv (gC/m2), and HANPPluc (gC/m2) were significantly different (p < 0.05) between the Huanyong Hu Line and the western–eastern part of China, while HANPPharv did not show significant differentiations in the coastal land and inland areas.
From the perspective of HANPP components, in China, the total amount and the average value of HANPPluc and HANPPharv were found to be 1.63 PgC and 216.97 gC/m2 and 1.05 PgC and 126.53 gC/m2, respectively, and the harvest through cropland, livestock grazing, and forestry contributed 29.86%, 8.53%, and 0.91% to the total HANPP, respectively. Land use change had a bidirectional influence on HANPPluc (gC/m2); the negative values were mostly concentrated in a small number of cultivated land patches in northwest China, which indicated that the biomass production under intensive artificial management could be higher than the potential production. Moreover, the North China Plain and northeast provinces had relatively high HANPPharv (gC/m2) values, mainly provided by cultivated land. Different urban functions resulted in various ecological occupation structures. HANPPluc played the dominant role among 21 provinces (over 50% of HANPP), especially in the cities with rapid urban expansion and some coastal ones. With the production–consumption ratio of biomass based on HANPP, 17 provinces in the middle and southeastern coastal areas in China were defined as the consumption type. Specifically, the ratios in Shanghai (0.06) and Beijing (0.09) were under the fifth percentiles, and a great number of ecological resources were needed from surrounding regions. In addition, a universal positive correlation (p < 0.05) was found between the production–consumption ratio and the HANPPharv (% of HANPP) through agriculture, forestry, and grazing in 31 provinces in China.
In different dimensions of urban–rural development, each HANPP index was more likely to be affected by urban economy (UE) than rural economy (RE); the impact of rural population (RP) was much stronger than that of urban population (UP); and rural agricultural technology (RA) had more significant explanatory effects on each HANPP index than urban spatial expansion (US). Specifically, in the dimension of economic development, the added value of transportation, warehousing, and postal services (UE3) had a significant influence on most HANPP indexes. From the demographic perspective, rural population (RP1) had significant and higher positive correlations with all the HANPPharv indexes than UP1 but no statistical correlation with HANPPluc. Meanwhile, agricultural technology indicators showed significant positive effects (p < 0.01) on and high correlations with HANPPharv. The higher regional average nighttime light intensity (US1), the proportion of the built-up area (US2), and the proportion of urban road area (US4) always corresponded with large HANPPluc values. Conversely, most HANPP indexes decreased as the proportion of urban green spaces increased (US3). Furthermore, the regional ecological pressure characterized by HANPP (%NPPpot) and HANPP (gC/m2) mostly depended on the rural development index (f(r)) and HANPPluc and HANPPharv were mainly controlled by f(u) and f(r), respectively. A higher degree of urban–rural coordination (D) obviously improved HANPP (gC/m2) and HANPPharv (gC/m2) but had a relatively weaker effect on the variation in HANPPluc (gC/m2).

Supplementary Materials

The following supporting information can be downloaded at https://www.mdpi.com/article/10.3390/land12051062/s1: Figure S1: Conceptual model of human appropriation of net primary production (HANPP); Figure S2: Spatial distribution of NPPpot in China; Figure S3: Typical regionalization of China to detect the HANPP differentiation; Table S1: Moisture contents (%), harvest factors and recovery rates of typical crops; Table S2: Conversion coefficients from crop harvest to straw; Table S3: Regulation for assessing NPPpot by vegetation-approach model; Table S4: Urban–rural coordinated development indexes; Supplementary File S1: Estimation of HANPPharv; Supplementary File S2: Evaluation of urban–rural coordinated development.

Author Contributions

Conceptualization, T.Z. and J.P.; methodology, T.Z.; software, T.Z.; validation, T.Z. and J.P.; formal analysis, T.Z.; resources, J.P.; data curation, X.C.; writing—original draft preparation, T.Z.; writing—review and editing, J.P.; visualization, T.Z.; supervision, X.C.; funding acquisition, T.Z. and X.C. All authors have read and agreed to the published version of the manuscript.

Funding

This research was funded by the National Natural Science Foundation of China (Grant No. 42001097) and the National Natural Science Foundation of China (Grant No. 41831284).

Data Availability Statement

The data presented in this study are available on request from the corresponding author.

Acknowledgments

We gratefully acknowledge Helmut Haberl from the University of Natural Resources and Life Sciences for his advice on the research methods and the HANPP estimation model used in this manuscript.

Conflicts of Interest

The authors declare no conflict of interest.

References

  1. Fan, Y.P.; Fang, C.L. Eco-city and man-land relationship. Acta Ecol. Sin. 2022, 42, 4313–4323. [Google Scholar]
  2. O’Neill, D.W.; Tyedmers, P.H.; Beazley, K.F. Human appropriation of net primary production (HANPP) in Nova Scotia, Canada. Reg. Environ. Chang. 2007, 7, 1–14. [Google Scholar] [CrossRef]
  3. Schwarzlmueller, E. Human appropriation of aboveground net primary production in Spain, 1955–2003: An empirical analysis of the industrialization of land use. Ecol. Econ. 2009, 69, 282–291. [Google Scholar] [CrossRef]
  4. Piao, S.L.; Fang, J.Y.; Zhou, L.M.; Zhu, B.; Tan, K.; Tao, S. Changes in vegetation net primary productivity from 1982 to 1999 in China. Glob. Biogeochem. Cycles 2005, 19, 1605–1622. [Google Scholar] [CrossRef]
  5. Chen, A.F.; Li, R.Y.; Wang, H.L.; He, B. Quantitative assessment of human appropriation of aboveground net primary production in China. Ecol. Model. 2015, 312, 54–60. [Google Scholar] [CrossRef]
  6. Epstein, T.S.; Jezeph, D. Development-There is another way: A rural-urban partnership development paradigm. World Dev. 2001, 29, 1443–1454. [Google Scholar] [CrossRef]
  7. Jiang, C.J.; Li, J.T.; Liu, J.L. Does urbanization affect the gap between urban and rural areas? Evidence from China. Socio-Econ. Plan. Sci. 2022, 82, 101271. [Google Scholar] [CrossRef]
  8. Gao, Y.Y.; Zheng, J.H.; Bu, M.L. Rural-urban income gap and agricultural growth in China: An empirical study on the provincial panel data, 1978–2010. China Agric. Econ. Rev. 2014, 6, 92–107. [Google Scholar] [CrossRef]
  9. Yu, B.B. Ecological effects of new-type urbanization in China. Renew. Sustain. Energy Rev. 2021, 135, 110239. [Google Scholar] [CrossRef]
  10. Du, X.J.; Huang, Z.H. Ecological and environmental effects of land use change in rapid urbanization: The case of Hangzhou, China. Ecol. Indic. 2017, 81, 243–251. [Google Scholar] [CrossRef]
  11. Haase, D.; Toetzer, T. Urban-rural linkages-analysing, modelling, and understanding drivers, pressures, and impacts of land use changes along the rural-to-urban gradient. Environ. Plan. B-Urban 2012, 39, 194–197. [Google Scholar] [CrossRef]
  12. Ren, Y.F.; Fang, C.L.; Li, G.D.; Sun, S.A.; Bao, C.; Liu, R.W. Progress in local and tele-coupling relationship between urbanization and eco-environment. Acta Geogr. Sin. 2020, 75, 589–606. [Google Scholar]
  13. Chen, Y.; Luo, P.; Chang, T. Urbanization and the urban–rural income gap in China: A continuous wavelet coherency analysis. Sustainability 2020, 12, 8261. [Google Scholar] [CrossRef]
  14. Pan, Y.; Yu, C.Q.; Zhang, X.Z.; Chen, B.X.; Wu, J.X.; Tu, Y.L.; Miao, Y.J.; Luo, L.M. A modified framework for the regional assessment of climate and human impacts on net primary productivity. Ecol. Indic. 2016, 60, 184–191. [Google Scholar] [CrossRef]
  15. Teixido-Figueras, J.; Steinberger, J.K.; Krausmann, F.; Haberl, H.; Wiedmann, T.; Peters, G.P.; Duro, J.A.; Kastner, T. International inequality of environmental pressures: Decomposition and comparative analysis. Ecol. Indic. 2016, 62, 163–173. [Google Scholar] [CrossRef]
  16. Haberl, H.; Erb, K.H.; Krausmann, F.; Gaube, V.; Bondeau, A.; Plutzar, C.; Gingrich, S.; Lucht, W.; Fischer-Kowalski, M. Quantifying and mapping the human appropriation of net primary production in earth’ terrestrial ecosystems. Proc. Natl. Acad. Sci. USA 2007, 104, 12942–12945. [Google Scholar] [CrossRef] [PubMed]
  17. Kastner, T.; Matej, S.; Forrest, M.; Gingrich, S.; Haberl, H.; Hickler, T.; Krausmann, F.; Lasslop, G.; Niedertscheider, M.; Plutzar, C.; et al. Land use intensification increasingly drives the spatiotemporal patterns of the global human appropriation of net primary production in the last century. Glob. Chang. Biol. 2021, 28, 307–322. [Google Scholar] [CrossRef]
  18. Krausmann, F.; Erb, K.H.; Gingrich, S.; Haberl, H.; Bondeau, A.; Gaube, V.; Lauk, C.; Plutzar, C.; Searchinger, T.D. Global human appropriation of net primary production doubled in the 20th century. Proc. Natl. Acad. Sci. USA 2013, 110, 10324–10329. [Google Scholar] [CrossRef]
  19. Niedertscheider, M.; Gingrich, S.; Erb, K.H. Changes in land use in South Africa between 1961 and 2006: An integrated socio-ecological analysis based on the human appropriation of net primary production framework. Reg. Environ. Chang. 2012, 12, 715–727. [Google Scholar] [CrossRef]
  20. Plutzar, C.; Kroisleitner, C.; Haberl, H.; Fetzel, T.; Bulgheroni, C.; Beringer, T.; Hostert, P.; Kastner, T.; Kuemmerle, T.; Lauk, C.; et al. Changes in the spatial patterns of human appropriation of net primary production (HANPP) in Europe 1990–2006. Reg. Environ. Chang. 2016, 16, 1225–1238. [Google Scholar] [CrossRef]
  21. Mahbub, R.B.; Ahmed, N.; Rahman, S.; Hossain, M.M.; Sujauddin, M. Human appropriation of net primary production in Bangladesh, 1700–2100. Land Use Policy 2019, 87, 104067. [Google Scholar] [CrossRef]
  22. Huang, X.; Yang, Y.; Chen, C.; Zhao, H.; Yao, B.; Ma, Z.; Ma, L.; Zhou, H. Quantifying and mapping human appropriation of net primary productivity in Qinghai grasslands in China. Agriculture 2022, 12, 483. [Google Scholar] [CrossRef]
  23. Andersen, C.B.; Donovan, R.K.; Quinn, J.E. Human appropriation of net primary production (HANPP) in an agriculturally-dominated watershed, southeastern USA. Land 2015, 4, 513–540. [Google Scholar] [CrossRef]
  24. Zhang, Y.J.; Pan, Y.; Zhang, X.Z.; Wu, J.X.; Yu, C.Q.; Li, M.; Wu, J.S. Patterns and dynamics of the human appropriation of net primary production and its components in Tibet. J. Environ. Manag. 2018, 210, 280–289. [Google Scholar] [CrossRef] [PubMed]
  25. Roux, N.; Kastner, T.; Erb, K.H.; Haberl, H. Does agricultural trade reduce pressure on land ecosystems? Decomposing drivers of the embodied human appropriation of net primary production. Ecol. Econ. 2021, 181, 106915. [Google Scholar] [CrossRef]
  26. Imhoff, M.L.; Bounoua, L.; Ricketts, T.; Loucks, C.; Harriss, R.; Lawrence, W.T. Global patterns in human consumption of net primary production. Nature 2004, 429, 870–873. [Google Scholar] [CrossRef]
  27. Niedertscheider, M.; Kuemmerle, T.; Müller, D.; Erb, K.H. Exploring the effects of drastic institutional and socio-economic changes on land system dynamics in Germany between 1883 and 2007. Glob. Environ. Chang. 2014, 28, 98–108. [Google Scholar] [CrossRef]
  28. Krausmann, F. Land use and industrial modernization: An empirical analysis of human influence on the functioning of ecosystems in Austria 1830–1995. Land Use Policy 2001, 18, 17–26. [Google Scholar] [CrossRef]
  29. Gingrich, S.; Niedertscheider, M.; Kastner, T.; Haberl, H.; Cosor, G.; Krausmann, F.; Kuemmerle, T.; Müller, D.; Reith-Musel, A.; Jepsen, M.R.; et al. Exploring long-term trends in land use change and aboveground human appropriation of net primary production in nine European countries. Land Use Policy 2015, 47, 426–438. [Google Scholar] [CrossRef]
  30. Kastner, T. Trajectories in human domination of ecosystems: Human appropriation of net primary production in the Philippines during the 20th century. Ecol. Econ. 2009, 69, 260–269. [Google Scholar] [CrossRef]
  31. Dorninger, C.; Wehrden, H.V.; Krausmann, F.; Bruckner, M.; Feng, K.S.; Hubacek, K.; Erb, K.H.; Abson, D.J. The effect of industrialization and globalization on domestic land-use: A global resource footprint perspective. Glob. Environ. Chang. 2021, 69, 102311. [Google Scholar] [CrossRef]
  32. Haberl, H.; Steinberger, J.K.; Plutzar, C.; Erb, K.H.; Gaube, V.; Gingrich, S.; Krausmann, F. Natural and socioeconomic determinants of the embodied human appropriation of net primary production and its relation to other resource use indicators. Ecol. Indic. 2012, 23, 222–231. [Google Scholar] [CrossRef]
  33. Marull, J.; Tello, E.; Bagaria, G.; Font, X.; Cattaneo, C.; Pino, J. Exploring the links between social metabolism and biodiversity distribution across landscape gradients: A regional-scale contribution to the land-sharing versus land-sparing debate. Sci. Total Environ. 2018, 619–620, 1272–1285. [Google Scholar] [CrossRef]
  34. Haberl, H.; Plutzar, C.; Erb, K.H.; Gaube, V.; Pollheimer, M.; Schulz, N.B. Human appropriation of net primary production as determinant of avifauna diversity in Austria. Agric. Ecosyst. Environ. 2005, 110, 119–131. [Google Scholar] [CrossRef]
  35. Zhou, C.; Elshkaki, A.; Graedel, T. Global human appropriation of net primary production and associated resource decoupling: 2010–2050. Environ. Sci. Technol. 2018, 52, 1208–1215. [Google Scholar] [CrossRef] [PubMed]
  36. Krausmann, F.; Haberl, H.; Erb, K.H.; Wiesinger, M.; Gaube, V.; Gingrich, S. What determines geographical patterns of the global human appropriation of net primary production? J. Land Use Sci. 2009, 4, 15–33. [Google Scholar] [CrossRef]
  37. Das, B.; Chakrabarty, D. Lagrange’s interpolation formula: Representation of numerical data by a polynomial curve. Int. J. Math. Trends Technol. 2016, 34, 64–72. [Google Scholar] [CrossRef]
  38. Wright, D.H. Human impacts on energy flow through natural ecosystems, and implications for species endangerment. Ambio 1990, 19, 189–194. [Google Scholar]
  39. Rojstaczer, S.; Sterling, S.M.; Moore, N.J. Human appropriation of photosynthesis products. Science 2001, 294, 2549–2552. [Google Scholar] [CrossRef]
  40. Haberl, H.; Erb, K.H.; Krausmann, F. Human appropriation of net primary production: Patterns, trends, and planetary boundaries. Annu. Rev. Environ. Resour. 2014, 39, 363–391. [Google Scholar] [CrossRef]
  41. Fetzel, T.; Gradwohl, M.; Erb, K.H. Conversion, intensification, and abandonment: A human appropriation of net primary production approach to analyze historic land-use dynamics in New Zealand 1860–2005. Ecol. Econ. 2014, 97, 201–208. [Google Scholar] [CrossRef]
  42. Yuan, Q.Z.; Wu, S.H.; Dai, E.F.; Zhao, D.S.; Ren, P.; Zhang, X.R. NPP vulnerability of China’s potential vegetation to climate change in the past 50 years. Acta Geogr. Sin. 2016, 71, 797–806. [Google Scholar]
  43. Du, J.S.; Yu, D.Y. Impacts of climate change and human activities on net primary productivity of grassland in agro-pastoral transitional zone in northern China. J. Beijing Norm. Univ. 2018, 54, 365–372. [Google Scholar]
  44. Erb, K.H.; Fetzel, T.; Plutzar, C.; Kastner, T.; Lauk, C.; Mayer, A.; Niedertscheider, M.; Körner, C.; Haberl, H. Biomass turnover time in terrestrial ecosystems halved by land use. Nat. Geosci. 2016, 9, 674–678. [Google Scholar] [CrossRef]
  45. Zhang, F.Y.; Pu, L.J.; Huang, Q. Quantitative assessment of the human appropriation of net primary production (HANPP) in the coastal areas of Jiangsu, China. Sustainability 2015, 7, 15857–15870. [Google Scholar] [CrossRef]
  46. Schwarzlmüller, E. Human appropriation of net primary production (HANPP) in Spain, 1955–2003: A socio-ecological analysis. In Social Ecology Working Paper 99; Faculty for Interdisciplinary Studies, Klagenfurt University: Vienna, Austria, 2008. [Google Scholar]
  47. Wang, F.X.; Mao, A.H.; Li, H.L.; Jia, M.L. Quality measurement and regional difference of urbanization in Shandong Province based on the entropy method. Sci. Geogr. Sin. 2013, 33, 1323–1329. [Google Scholar]
  48. Wang, W. The evaluation of coordinated development level between urban and rural and its spatial-temporal pattern in Yangtze River economic zone. Econ. Geogr. 2017, 37, 60–66. [Google Scholar]
  49. Wang, Y.; Sun, P.J.; Li, C.G.; Liu, H.; Zhou, J. Spatial-temporal evolution features of urban and rural harmonious in northeast China since 2003. Econ. Geogr. 2018, 38, 59–66. [Google Scholar]
  50. Liu, Y. Grassland monitoring report in China in 2015. Chin. Animat. Anime 2016, 6, 18–35. [Google Scholar]
  51. Huang, Q.; Zhang, F.; Zhang, Q.; Ou, H.; Jin, Y. Quantitative assessment of the impact of human activities on terrestrial net primary productivity in the Yangtze River Delta. Sustainability 2020, 12, 1697. [Google Scholar] [CrossRef]
Figure 1. HANPP, HANPPluc, HANPPharv, and HANPP (% NPPpot) in China (a,c,e,g) and among provinces (b,d,f,h) in 2015.
Land 12 01062 g001
Figure 2. Contribution of HANPP components in provinces.
Land 12 01062 g002
Figure 3. The production–consumption ratio (a), the dominant production types among provinces in China (b), and the relationships between production–consumption ratios and HANPPharv (%HANPP) (c).
Land 12 01062 g003
Figure 4. Relationship between HANPP indexes and urban (a) and rural (b) development indicators. (UE1–4, UP1–2, and US1–4 and RE1–4, RP1–2, and RA1–4; refer to Table 1; *: p < 0.1, **: p < 0.05, and ***: p < 0.01).
Land 12 01062 g004
Figure 5. Urban and rural development index (a,b) and coordinated urban–rural development degree (c) and types (d) in China. HANPP responses to coordinated regional urban–rural development (e). (PC, primary coordination; BC, barely coordination; NI, near imbalance; II, inchoate imbalance; MI, moderate imbalance; SI, severe imbalance; **: p < 0.05, and ***: p < 0.01).
Land 12 01062 g005
Figure 6. Correlations between HANPP indexes and the degree of coordinated urban–rural development.
Land 12 01062 g006
Table 1. Quantification indicators of urban–rural development in China.
ObjectsPerspectiveIndexesSymbols *Weights
UrbanEconomyAdded value of the secondary and tertiary industries (108 CNY)UE10.065
Proportion of added value of the secondary and tertiary industries (%)UE20.019
Added value of transportation, warehousing, and postal services (108 CNY)UE30.051
Per capita consumption expenditure of urban residents (CNY)UE40.084
PopulationUrban population (104 people)UP10.045
Proportion of urban population (%)UP20.020
SpaceNighttime light intensity (nW/cm2/sr)US10.194
Proportion of built-up area (%)US20.147
Proportion of urban green spaces (%)US30.243
Proportion of urban road area (%)US40.134
RuralEconomyAdded value of the primary industry (108 CNY)RE10.103
Proportion of added value of the primary industry (%)RE20.058
Per capita consumption expenditure of rural residents (CNY)RE30.073
Engel coefficient of rural residents (%) RE40.134
PopulationRural population (104 people)RP10.118
Proportion of rural population (%)RP20.037
Agricultural technologyTotal power of agricultural machinery (104 kW)RA10.129
Application amount of agricultural fertilizer (104 tons)RA20.112
Effective irrigated area (103 hectare)RA30.125
Total sown area of crops (103 hectare)RA40.111
* UE, UP, and US are the abbreviations for urban economy, urban population, and urban space, respectively, and RE, RP, and RA are the abbreviations for rural economy, rural population, and rural agricultural technology, respectively.
Table 2. Classification criteria of coordinated urban–rural development (D).
D ValueImplicationsD ValueImplicationsD ValueImplications
0 < D ≤ 0.2Severe imbalance0.4 < D ≤ 0.5Near imbalance0.7 < D ≤ 0.8Intermediate coordination
0.2 < D ≤ 0.3Moderate imbalance0.5 < D ≤ 0.6Barely coordination0.8 < D ≤ 0.9Well coordination
0.3 < D ≤ 0.4Inchoate imbalance0.6 < D ≤ 0.7Primary coordination0.9 < D ≤ 1Super coordination
Table 3. Regional differentiations of HANPP indexes.
IndexesRegional Differentiation *
Zone 1Zone 2Zone 3Zone 4
t Valuep Valuet Valuep Valuet Valuep Valuet Valuep Value
HANPP(gC)−0.4330.668−0.7800.4410.2930.772−2.3230.027 *
(%NPPpot)−0.0090.9932.1410.041 *3.6720.001 ***0.4740.639
(gC/m2)5.9330.001 ***4.9240.001 ***−2.3410.026 *2.1700.039 *
HANPPharv(gC)0.1910.8500.2580.7981.6670.109−1.6490.110
(%NPPpot)−0.0350.9731.4500.1583.7210.001 ***0.3080.760
(gC/m2)2.6470.013 *3.7300.001 ***0.7860.4410.9420.354
HANPPluc(gC)−0.5310.616−1.3350.192−0.6540.518−2.1670.039 *
(%NPPpot)0.0660.9841.9390.0620.5250.6040.4980.623
(gC/m2)8.4770.00 1 ***3.3140.002 **−5.8170.001 ***1.8810.070
* Zone 1 refers to two regions between the Huanyong Hu Line; Zones 2 and 3 refer to the western/eastern and northern/southern parts of China, respectively; and Zone 4 refers to the coastal land and the inland area, which are also shown in Figure S3. *: p < 0.05, **: p < 0.01, and ***: p < 0.001.
Table 4. Dominant driving factors of each HANPP index.
Dependent VariablesIndependent VariablesModel with Standardized CoefficientsR
HANPP(gC)Urban= −0.599UE2 + 0.366UP10.613
Rural= 1.111RA4 + 0.348RE4 − 0.365RP10.823
Urban–rural= 0.650RA4 − 0.309US40.797
(%NPPpot)Urban= 1.223UE3 − 0.924UE10.567
Rural= 1.007RA1 − 1.044RP1 − 0.384RE2 + 0.599RA20.849
Urban–rural= 1.007RA1 − 1.045RP1 + 0.384UE2 + 0.599RA20.849
(gC/m2)Urban= 0.642UE30.642
Rural= 0.628RE1 − 0.401RP20.682
Urban–rural= 0.642UE30.642
HANPPharv(gC)Urban= −0.672UE2 + 0.543UE30.706
Rural= 0.897RA4 − 0.371RP1 + 0.345RA20.940
Urban–rural= 0.897RA4 − 0.371RP1 + 0.345RA20.940
(%NPPpot)Urban= 1.245UE3 − 0.978UE10.566
Rural= 1.189RA1 − 0.641RP10.763
Urban–rural= 1.189RA1 − 0.641RP10.763
(gC/m2)Urban= 1.210UE3 − 0.688UE10.665
Rural= 0.846RA1 − 0.315RP20.822
Urban–rural= 0.340RA1 + 0.771US4 − 0.480UE4 + 0.425RA20.897
HANPPluc(gC)Urban= −0.486US40.486
Rural= 0.356RP2 + 0.912RA4 − 0.698RA10.678
Urban–rural= −0.486US40.486
(%NPPpot)Urban= 0.412UE20.412
Rural= −0.412RE20.412
Urban–rural= −0.412RE20.412
(gC/m2)Urban= 0.458UE10.458
Rural= 0.513RE3 + 0.357RP10.568
Urban–rural= 0.458UE10.458
Disclaimer/Publisher’s Note: The statements, opinions and data contained in all publications are solely those of the individual author(s) and contributor(s) and not of MDPI and/or the editor(s). MDPI and/or the editor(s) disclaim responsibility for any injury to people or property resulting from any ideas, methods, instructions or products referred to in the content.

