Article

Multi-Scenario Land Use Change Simulation and Spatial Response of Ecosystem Service Value in Black Soil Region of Northeast China

1
School of Public Administration and Law, Northeast Agricultural University, Harbin 150030, China
2
The Second Geomatics Cartography Institute, Ministry of Natural Resource, Harbin 150080, China
3
College of Geo-Exploration Science and Technology, Jilin University, Changchun 130026, China
*
Authors to whom correspondence should be addressed.
Land 2023, 12(5), 962; https://doi.org/10.3390/land12050962
Submission received: 10 April 2023 / Revised: 23 April 2023 / Accepted: 24 April 2023 / Published: 26 April 2023
(This article belongs to the Special Issue New Insights in Mollisol Quality and Management)

Abstract

:
Simulating the spatial response of ecosystem service value (ESV) caused by land use change in Heilongjiang Province under different scenarios in the future is of great significance for ensuring ecological security and sustainable development in the region. Heilongjiang Province, an important grain-producing region in China, is taken as the research area in this study. Five land use maps (2000, 2005, 2010, 2015, and 2020) were used to evaluate the change of ecosystem service value in Heilongjiang Province in the past 20 years. In addition, the area of each land use type under different future scenarios was predicted by Markov model and MOP model, the future land use pattern was simulated based on PLUS model, the ESV under different scenarios was calculated, and the spatial distribution and the degree of ESV clustering were further explored. The results show that: (1) During 2000–2020, the built-up land in Heilongjiang Province continued to grow, with a total increase of 5076 km2 during the 20-year period, the area of water continued to grow, the area of unused land gradually decreased, and the area of farmland and forest land changed less. (2) During the study period, the ESV in 2000, 2005, 2010, 2015, and 2020 were 1320.8 billion yuan, 1334.5 billion yuan, 1342.1 billion yuan, 1327.6 billion yuan, and 1328.4 billion yuan, respectively. Generally, it shows a fluctuating trend. (3) The ESV of natural development scenario (NDS), economic priority scenario (ERS) and ecological protection scenario (EPS) are 1334.3 billion yuan, 1254.8 billion yuan and 1455.6 billion yuan, respectively. The ESV of different scenarios is quite different. (4) The spatial distribution of ESV was higher in the northwest, central, and southeast, and lower in the east and west. The hot and cold spots of ESV are widely distributed and the degree of polymerization is high. The methods and conclusions of this study can provide scientific reference for the optimization of national spatial pattern and the formulation of sustainable development policy.

1. Introduction

Ecosystems, as the unity of life and environment on Earth, are not only the basis for human survival and development, but also provide the material basis for the formation and maintenance of ecosystem services and functions [1]. Ecosystem services are life support products and services that humans obtain directly or indirectly through the structures, processes and functions of ecosystems [2,3,4,5]. The concept of Ecological Services Value (ESV) was derived by assigning quantifiable value attributes to ecosystem functions. Ecological service values link natural ecosystems with economic and social systems and mainly include provisioning services, regulating services, cultural services, and supporting services [6,7,8]. It is part of the economic value of the earth and is closely related to human well-being [9]. The valuation of ecosystem services performs a pivotal role in quantifying the utility value of services and support provided by ecosystems for human survival and development [10].
Since the 21st century, the concept of sustainable development has been widely recognized with the significant increase in the number of ecologically fragile areas and the degree of ecological fragility worldwide [11,12]. However, in past decades, with the continuous growth of global population, increasing urbanization, and drastic changes in the climatic environment, enormous pressure has been put on the ecosystem, which has directly led to the continuous degradation of the ecosystem [13,14]. Therefore, protecting natural ecosystems and enhancing their ecosystem services has become an urgent global challenge [15,16,17].
Ecosystem services are of enormous value to human well-being. However, it was not until the late 1970s that ecosystem services were objectively recognized [1]. Until then, ecosystem services have been considered a rich, inexhaustible, and freely exploitable public service [18,19]. In 1997, Costanza pointed out the importance of valuation of ecosystem services and calculated the changes in the of ecosystem services value in monetary units [20]. The Millennium Ecosystem Assessment (MA) project further promoted the research process and formulated the reference standard of ESV quantification, making ESV a research hotspot in the fields of ecology and geography [21,22]. With the continuous innovation of relevant technologies and research methods, the research field has realized the coverage from watersheds and nature reserve to coastal areas and Marine areas [23,24,25,26]; In terms of research objects, it includes forest land, cultivated land, wetland, and other different land types [27,28]; In terms of research methods, it mainly applies market value method, carbon tax method, shadow engineering method, travel cost method, etc. [29,30,31]. Based on Costanza’s research and combined with China’s actual national conditions, Xie et al. proposed an Equivalent Scale of Ecosystem Service Value per Unit Area of the Chinese Terrestrial Ecosystem, and modified it constantly, making it an important basis for studying the ecosystem service value in China. It has greatly promoted the development process of ESV evaluation in China [32,33]. It has been widely used in the Pearl River Delta urban agglomeration [34], Ganzhou region [35], Tibet region [36], Yangtze River Economic Belt [37], and other different regions in China.
As a common carrier of ecosystems and human activities, Land Use Cover Change (LUCC) is a direct reflection of the interaction between humans and natural ecosystems, changing the structure, processes, and functions of ecosystems, and having a significant impact on the value of ecosystem services [38]. Exploring the relationship between land use change and the response of past, present, and future ESVs requires predicting the spatial pattern of future land use. Previous simulation studies on future LUCC mainly include top-down and bottom-up directions [39,40]. Top-down approach refers to the use of constraints of macro conditions, such as the use of relevant expected indices in territorial spatial planning, relevant effects of GDP, population, policies, etc., to determine the quantity of each land type, and the common methods include multi-objective planning models, system dynamics models, Markov models, and linear prediction models [41,42]. Bottom-up approach refers to assigning different land types to different locations based on corresponding conversion rules. The commonly used methods are mainly related models based on the principle of cellular automata, such as SLEUTH, Dinamica EGO, FLUS, PLUS, etc. [40,43,44,45]. However, both of them have certain limitations. The top-down approach only predicts the quantity of each land type and cannot reflect the spatial distribution and heterogeneity of land use change from a microscopic perspective. Although the bottom-up approach can determine the future spatial pattern, it cannot obtain quantitative constraints on land use types at the macro scale and lacks quantitative optimization of land use structure. The coupled model is used to determine the spatial pattern of future land use change can effectively overcome the above limitations [7,46]. By simulating the distribution of LUCC under different scenarios and determining the ESV of the corresponding scenarios, we provide scientific reference for the formulation of relevant policies and sustainable development of ecological environment.
In this paper, we propose a coupled model based on the Multi-Objective Programming (MOP) method and the Patch-generating Land Use Simulation PLUS (PLUS) model. In this paper, we propose a coupled model based on the Multi-Objective Programming (MOP) method and the Patch-generating Land Use Simulation PLUS (PLUS) model to determine the ecosystem service values of land use change patterns under different future scenarios. The MOP model is a land use structure optimization method that can be used to solve conflicting objectives in complex land systems and can also be adjusted by incorporating relevant planning policies [47]. The PLUS model has adaptive inertia mechanism and roulette wheel competitive gambling mechanism, and further explore the spatial transformation rules, which can simulate the spatial distribution pattern of future land use more accurately [48].
Due to the phased progress of ecosystem services research and the development needs of different regions, it is still very urgent to determine the impact of land use on ESV. Recent studies on the response of land use change to ecosystem service values are abundant, but most of them are located in economically developed regions and ecologically fragile regions, such as Wuhan, Tibetan regions, Sichuan and Yunnan regions, etc. [34,36]; or the research objects only focus on a certain type of land use, such as forest land, arable land, urban land, etc. [25,49]. The research on the relationship between overall land use pattern and ecosystem service value in black soil region is weak, which limits the application of related research results in ecological environment management and land use planning. In this paper, Heilongjiang Province, a typical black soil region in China, is taken as the research area. Based on MOP-PLUS model, the spatial pattern of future land use is simulated in multiple scenarios, and the spatial and temporal evolution characteristics of ESV from 2000 to 2035 are quantitatively evaluated. From the study area, Heilongjiang province is an important grain-producing region in China and bears an important responsibility for food production security. Taking Heilongjiang province as an example, it can provide a reference for other large agricultural provinces in ESV research and can also provide a reference basis for regional green low-carbon development and sustainable ecological management. From the research framework, the current research mainly focuses on the relationship between land use and ESV from the “past-present” perspective, which leads to a certain lag in the assessment of ESV. Based on a through perspective of “past-present-future”, this study not only compares ESV changes in Heilongjiang Province in the past, but also evaluates ESV under different scenarios in the future.
At present, research on ESV is of great significance for ecological environment protection and sustainable human development, which can further enhance people’s understanding of the value, well-being, and importance of natural assets [50]. Heilongjiang Province, located in the northeast of China, is an important grain producing area in China. Clarifying the impact of land use change on ESV is of great significance for coordinating food security and ecological security and realizing sustainable management of natural resources [51,52]. Therefore, this study takes Heilongjiang Province as the study area and aims to: (1) To evaluate the spatial distribution and change characteristics of ESV in Heilongjiang Province during 2000–2020. (2) Combined with the 2035 Land Spatial Planning of Heilongjiang Province, the land use change pattern of different scenarios in Heilongjiang Province in 2035 was predicted based on MOP-PLUS model, and the dynamic response of ESV under different scenarios was explored. It is expected to provide scientific reference for the construction of ecological security pattern, sustainable development of agriculture and optimization of the spatial distribution of land in Heilongjiang Province.

2. Materials and Methods

2.1. Study Area

Heilongjiang Province is located in the northeast of China (121°11′ E–135°05′ E, 43°26′ N–53°33′ N), across the river from Russia in the north and east, adjacent to Inner Mongolia in the west and bordering Jilin Province in the south, and is the northernmost and easternmost provincial administrative region in China (Figure 1). The topography is generally high in the northwest, north and southeast, and low in the northeast and southwest. It is a cold-temperate and temperate continental monsoon climate. Precipitation exhibits obvious monsoonal characteristics. In summer, under the influence of the southeast monsoon, precipitation is abundant, and in winter, under the control of the dry and cold northwest wind, it is dry with little rain. As of 2021, the total resident population at the end of the year is 31.25 million, GDP is 1487.92 billion yuan, and the province’s grain production is 75.408 million tons, ranking first in the country for 10 consecutive years. The geographical location and elevation of Heilongjiang Province are shown in Figure 1.

2.2. Data Source and Technical Route

In this study, all the data required for the experiment were converted to WGS84 coordinate system, the raster data were resampled to 200 m resolution, and the slope data were generated by ArcGIS 10.2 processing. The data details are shown in Table 1.
The technical route of this study is shown in Figure 2. First, the ecosystem service values of Heilongjiang Province in 2000, 2005, 2010, 2015, and 2020 were assessed. Second, the land use data and driver data were used as inputs to the PLUS model to simulate the land use in 2020 with the 2015 land use data as the base period, and after accuracy verification, the land use patterns of the Natural Development Scenario (NDS), Economic Priority Scenario (ERS), and the Ecological Protection Scenario (EPS) in 2035 were simulated and the ecosystem service values under different scenarios were evaluated separately. Finally, a cold hotspot analysis of ESV was conducted to determine the spatial clustering relationship between the high-value and low-value areas of ESV.

2.3. ESV Evaluation

In this study, the study area was divided into 20 km grid as the basic unit for ESV assessment. Based on the equivalent scale of ecosystem service value per unit area of the Chinese terrestrial ecosystem established by Xie Gaodi et al. [33]. Based on the type of land use in the study area, the built-up land service value equivalent was set to 0 [2,5,53]. Based on the equivalence coefficient method, the ecosystem service value of Heilongjiang Province was assessed (Equations (1) and (2)).
ESV = i = 1 n A i × V C i
V C i = j = 1 k E C j × E a
where ESV is ecosystem service value (yuan/year), i is land use type; j is ecosystem service type, A i is the area of land use type i (ha), V C i is the ecological service values per unit area of land use type i (yuan/(ha.a)), E C j is the jth ecosystem service value equivalent for a particular land use type, k is the number of ecosystem service types, and E a is the economic value per unit of ecosystem services (yuan/(ha.a)).
According to the rule that “the economic value of ecosystem services provided by existing unit farmland is seven times the economic value of natural ecosystems without human input” [54,55]. The planting area and market price of main grain crops (soybean, corn, wheat, and rice) in Heilongjiang Province in 2020 were used to revise (Equation (3)). The economic value of ecosystem services per unit area in Heilongjiang Province is 2030 (Yuan/ha.a). The market prices, acreage, and production of food crops are shown in Table 2.
E a = 1 7 i = 1 n m i p i q i M
where E a is the economic value of 1 unit of ecosystem services (yuan/ha.a), i is the grain crop type, m i is the average price of grain crop i in the study area (yuan/kg), p i is the yield of grain crop i (kg/ha), q i is the planting area of grain crop i (ha), and M is the total area planted in grain crops (ha).

2.4. Multi-Scenario Simulation of Land Use Change

2.4.1. PLUS Model and Choice of Driving Factors

The PLUS model contains two components, the Land Expansion Analysis Strategy (LEAS) and the meta-cellular automata model based on multi-class random patch seeding (CARS). The LEAS module is able to extract the part of the expansion of each type of land use between the two periods of land use change and use the random forest algorithm to dig into the factors of each type of land use expansion and drivers one by one to obtain the development probability of each type of land use and the contribution of each driver to the expansion of each type of land use in that time period. The CARS module combines random seed generation and a threshold decreasing mechanism, enabling the automatic generation of patches to be simulated dynamically within the constraints of development probability [42,56].
In the simulation of land use change, the role of driving factors is crucial and directly affects the accuracy of the simulation. Additionally, the factors leading to land use change in the study area are complex and diverse and are the result of the combined effect of natural conditions, socio-economic conditions, and human activities. Therefore, in this study, considering the principles of data accessibility, spatial variability and comprehensiveness, a total of 15 driving factors were selected from three aspects: physical geographic data, socio-economic data, and traffic data to construct the index system (Figure 3), and open water was used as a prohibited transformation area (Figure 3P). The driving factors include DEM, slope, precipitation (Pre), temperature (Tem), soil type, net primary productivity (NPP), NDVI, population (POP), GDP, night lighting, distance to center of government (Dis_Gov), distance to railway (Dis_Railway), distance to highway (Dis_Highway), distance to road (Dis_Road), and distance to city road (Dis_Cityroad).

2.4.2. Scenario Setting

The scenarios are set up to explore the various possibilities of future land use pattern development in the study area, compare the changes in ESV under different development scenarios, and provide a reference basis for decision makers. Three scenarios were designed to simulate the land use pattern of Heilongjiang Province in 2035: Natural Development Scenario (NDS), Economic Priority Scenario (ERS), and Ecological Protection Scenario (EPS). The Natural Development Scenario represents the development of land use patterns according to natural trends, without considering the constraints or impacts of future policies on land use change. The area of each site type was predicted based on a Markov model [57,58]. The economic priority scenario means maximizing economic benefits from different land use patterns, and the ecological conservation scenario means maximizing ecological benefits from different land use patterns [46,59]. A Multi-Objective Programming (MOP) model was constructed to determine the area of each land use type in 2035 under the economic priority scenario and the ecological protection scenario.
The Multi-Objective Programming (MOP) model is a basic model for land use optimization, which solves the area of each land use type in different scenarios by defining appropriate objective optimization functions and constraints. The MOP model contains three parts: decision variables, objective functions, and constraints (Equations (4)–(6)).
F E R S ( x ) = m a x i = 1 n c i x i
F E P S ( x ) = m a x i = 1 n d i x i
s . t . = { j = 1 n a i j x i = ( , ) b j , ( i = 1 ,   2 , 6 ) x i 0 , ( i = 1 , 2 , 6 )
where F E R S ( x ) is the economic efficiency objective function, F E P S ( x ) is the eco-efficiency objective function, x i is the area of different land types, c i is the economic benefit coefficient, d i is the ecological benefit coefficient, a i j is the conditional coefficient of variable i under constraint j, and b j is the constant value under constraint j. The economic efficiency factor and ecological efficiency factor are the GDP and ESV per unit area of different land types. The ecological benefit coefficient for each of the land types were obtained according to the equivalence coefficient method in Section 2.3. The economic efficiency coefficients of farmland, forest land, grassland, and water were obtained based on the output value of agriculture, forestry, animal husbandry, and fishery in the study area; the economic efficiency coefficient of construction land was calculated based on the sum of the output value of secondary and tertiary industries; and the economic efficiency coefficient of unused land was set to 0 [60,61]. The economic benefit objective function and the ecological benefit objective function are shown in Equations (7) and (8). The constraint conditions are shown in Table 3.
F E R S ( x ) = 199.9 x 1 + 8.7 x 2 + 3207.1 x 3 + 155.7 x 4 + 6804 x 5 + 0 x 6
F E P S ( x ) = 80.3 x 1 + 430.75 x 2 + 400.26 x 3 + 2553.43 x 4 + 0 x 5 + 4.1 x 6

2.5. Subsection

Hotspot analysis (Getis-Ord Gi*) is a common tool used to identify the spatial distribution of cold and hot spot areas, which can effectively identify spatially statistically significant cold and hot spot areas [62]. In this study, hotspot analysis (Equations (9)–(11)) was used to determine the spatial clustering relationship between high-value and low-value areas of ecosystem service values in Heilongjiang Province [53].
G i * = j = 1 n w i , j x j X j = 1 n w i , j [ n j = 1 n w i , j 2 ( j = 1 n w i , j ) 2 ] ( n 1 ) s
X = 1 n j = 1 n x i
S = 1 n j = 1 n x j 2 ( X ) 2
where n is the number of spatial grid units, x i and x j are the observed values of unit i and unit j , respectively, and w i , j is the spatial weight matrix established based on the spatial k adjacency relationship. If the ESV is high in a certain range, it is called a statistically significant hot spot, called the ESV hot spot area, indicating that the ecosystem service value is larger in the area; if the ESV is low in a certain range, it is called a statistically significant cold spot, called the ESV cold spot area, indicating that the ecosystem service value is smaller in the area.

3. Results

3.1. Analysis of Land Use Change Characteristics from 2000–2020

During 2000–2020, the land use types in Heilongjiang Province were mainly forest land, accounting for about 50% of the total area of the study area, with an overall trend of increasing, then decreasing. In addition, the change in the area of farmland is relatively small, with an average share of 44.33% over the 20-year period; grass land shows a gradual decrease over the past 10 years; the area of water has been increasing over the 20-year period; the area of built-up land continues to expand; and the area of unused land gradually decreases. The area and percentage of each land type are shown in Table 4.
The total area of land use type conversion during the study period was 46,767 km2, accounting for 10.34% of the province’s area. Among them, the largest area of farmland was transferred out, reaching 20,572 km2, accounting for 43.99% of the total transferred area. A total of 46.39% was transferred to forest land and 30.36% was transferred to built-up land due to the influence of the policy of returning farmland to forest and continuous economic growth; the largest area of built-up land was transferred, with 78.82% coming from farmland. Its land use transfer matrix with the 2000–2020 Sankey is shown in Table 5 and Figure 4.

3.2. Characteristics of ESV Changes from 2000 to 2020

During the study period, the ecological service value in Heilongjiang Province in 2000, 2005, 2010, 2015, and 2020 was 1320.8 billion, 1334.5 billion, 1342.1 billion, 1327.6 billion, and 1328.4 billion, respectively. The change of increase, then decrease shows the volatility of ESV changes in Heilongjiang province (Table 6). Among the land use types, the ESV of farmland showed a trend of increase and then decrease, with relatively small changes over 20 years. Forest land consistently had the largest ESV during the study period, with a share of more than 70% in all of the cases. The ESVs of grassland and water are highly variable, in which the ESV of grassland decreases year by year from 159.3 billion in 2000 to 23.9 billion in 2020, the ESV of water has the greatest change and continues to grow from 31.4 billion in 2000 to 188.1 billion in 2020, the ESV of built-up land is 0 during the study period, and the ESV of unused land is the smallest and shows a gradual decreasing trend.
Using the natural breakpoint method, ESVs in Heilongjiang Province in 2000, 2005, 2010, 2015, and 2020 were classified into five grades (Figure 5). As can be seen from the figure, the largest area share of grade IV ESV was found in the northwestern, central, and southeastern regions of Heilongjiang Province during the study period. The smallest area of grade V ESVs was distributed in the southwest and southeast regions of Heilongjiang Province.

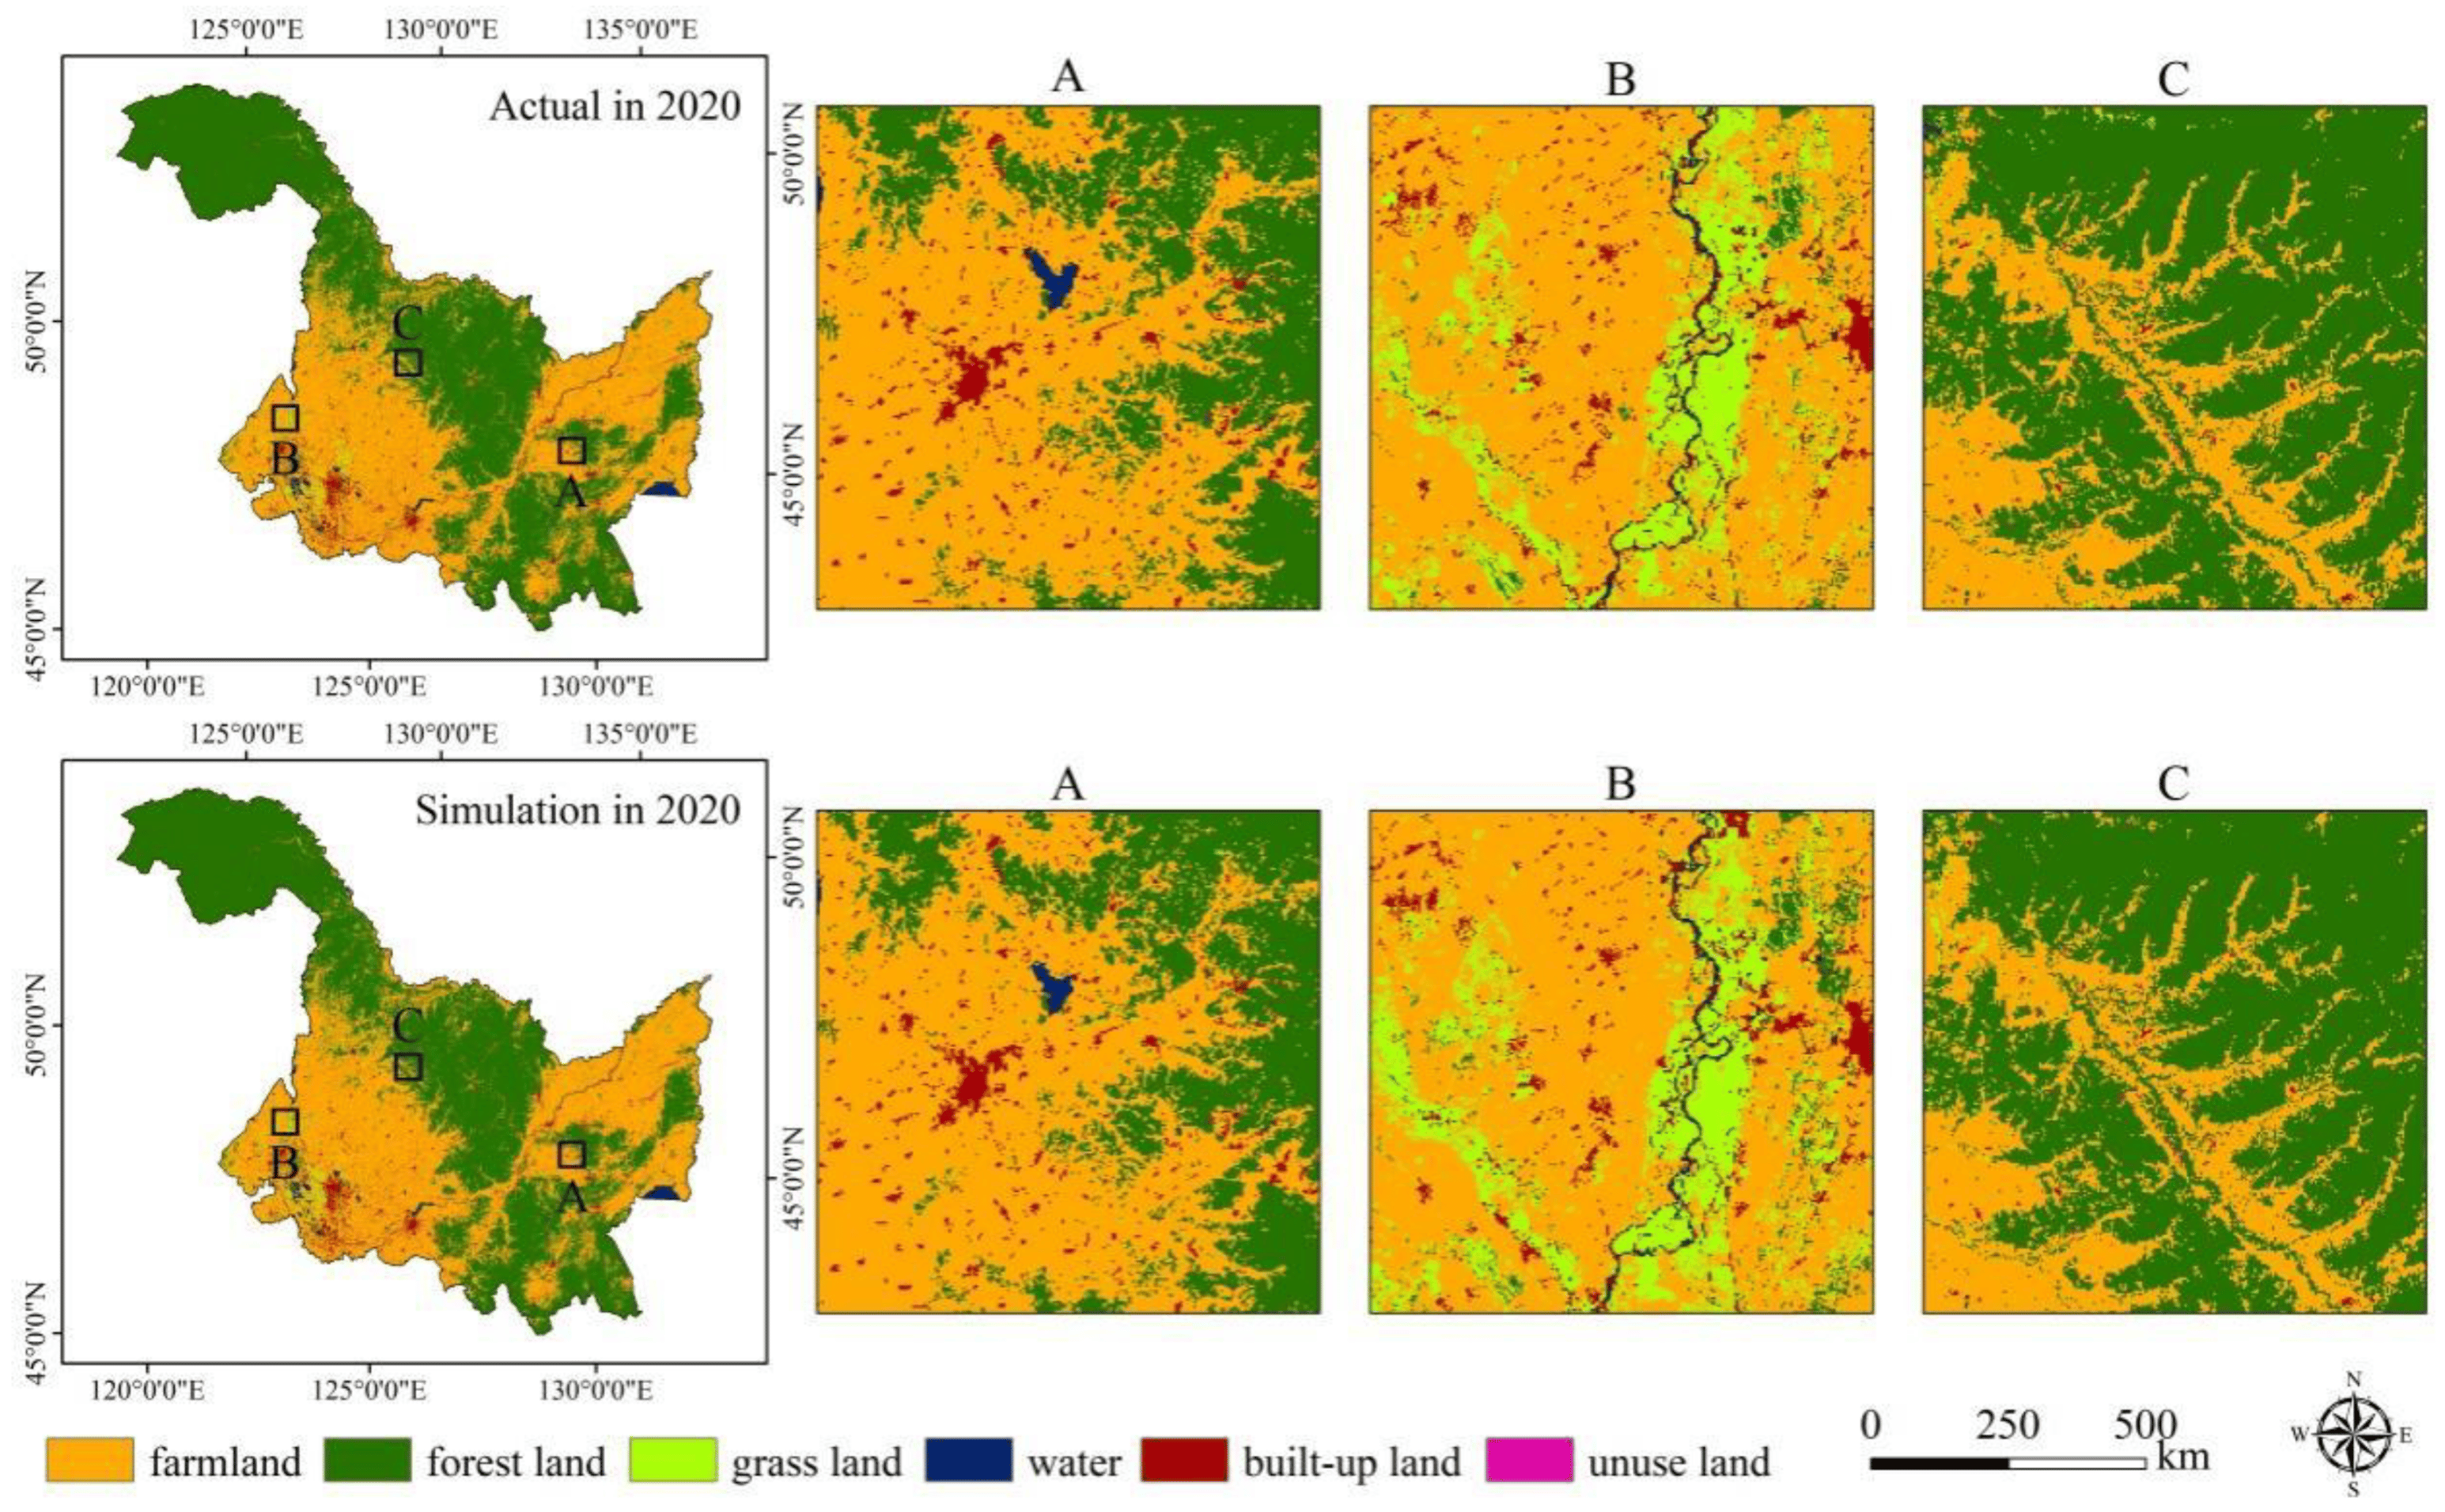
3.3. Simulation of Multi-Scenario Land Use Change in Heilongjiang Province

Comparing the actual land use map in 2020 with the simulated land use map (Figure 6), its Kappa coefficient is 0.92, indicating that the actual land use map in 2020 is closer to the simulated land use map, and the simulation accuracy is high. Simulation of future multi-scenario land use changes can be performed.
Using 2020 as the base period, the MOP model was constructed by Lingo 18.0 software to solve for the area of each land use type under different scenarios (Table 7). The land use change patterns in 2035 under natural development scenario, economic priority scenario, and ecological protection scenario were simulated, respectively (Figure 7).
Under the natural development scenario, the area of each type of land has developed naturally along the historical trend, with the area of farmland decreasing by 28,048 km2, the area of forest land increasing by 1245 km2, the area of grass land decreasing by 1189 km2, the area of water increasing by 415 km2, the area of built-up land increasing by 3915 km2, and the area of unused land decreasing by 302 km2. In the economic priority scenario, because of the higher economic coefficient of farmland, in the ERS scenario, farmland increases by 15,977 km2, forest land has a lower economic coefficient and decreases by 19,589 km2, grass land and water have the same area as in 2020, built-up land increases by 3915 km2, and unused land decreases by 302 km2. Under the ecological protection scenario, the area of farmland decreased by 35,647 km2 as the ecological efficiency coefficient was lower, the area of forest land increased by 35,276 km2 as the ecological coefficient was higher, the area of grass land decreased by 1189 km2, the area of water increased by 415 km2, the area of built-up land increased by 1446 km2, and the area of unused land decreased by 302 km2.

3.4. ESV Analysis in Different Scenarios in 2035

The ESV in 2035 for the natural development scenario, economic priority scenario, and ecological conservation scenario are 1334.3 billion, 1254.8 billion, and 1455.6 billion, respectively (Table 8). Compared to 2020, the overall ecosystem service value in Heilongjiang Province changes less under the natural development scenario, increasing by 5.9 billion. Among the land types, water ESV changed the largest, with an increase of 8.7 billion. Except for built-up land, where ESV was 0, the remaining land types had small changes in ESV and had little impact on the overall ESV change. Under the economic priority scenario, the overall ESV decreased by 73.6 billion yuan. Due to the increase in farmland area and the decrease in forest area, the ESV of farmland increased by 12.8 billion yuan, the ESV of forest land decreased by 84.4 billion yuan, and the ESV of other land types changed little. The overall ESV increased by 127.1 billion under the ecological conservation scenario. Among the land types, forest land ESV changed the largest amount with an increase of 151.9 billion, farmland ESV decreased by 28.7 billion as the farmland area decreased, water ESV increased by 8.7 billion, grassland ESV decreased by 4.8 billion, and the remaining land types had smaller changes in ESV.
In view of the spatial distribution, the ecological service value in Heilongjiang Province is unevenly distributed (Figure 8). Grade V ESV areas are only sporadically distributed in the southeastern and southwestern regions and are relatively small in area. Grade IV ESV areas are mainly distributed in the northwestern, central, and southeastern regions, within the region, the elevation is higher, and the main land type is mainly forest land. Grade III ESV areas are mainly distributed in the southeastern region. Grade II ESV areas and grade I ESV areas are mainly distributed in the east and west sides, within the region, the elevation is lower, and the land type is mainly built-up land and farmland, resulting in lower ESV in the region.

3.5. Hotspot Analysis

The ESV values of each grid were used as spatial variables for hotspot analysis (Figure 9). The spatial distribution patterns of cold spots and hot spots in 2000, 2005, 2010, 2015, and 2020 are relatively similar, with 99% confidence interval hot spot areas located in the southeast and southwest regions with small areas, 95% confidence interval hot spot areas are more concentrated, and mainly distributed in the central and northwest regions, and cold spot areas are dominated by 95% confidence interval and mainly distributed in the east and west regions. Compared with the spatial distribution of cold hot spots in 2020, the hot spot areas in the 95% confidence interval under the natural development scenario and the economic priority scenario are reduced, mainly due to the change in the spatial pattern of cropland and forest land. In the natural development scenario, the cold spot areas in the 95% confidence interval are slightly reduced compared to 2020, with a similar spatial distribution. In the economic priority scenario, there is a larger decrease in the cold spot areas in the 95% confidence interval, while there is an increase in the cold spot areas in the 90% confidence interval. In the ecological protection scenario, the spatial distribution pattern of cold hotspots changed significantly compared with that of 2020, the most significant change is that the hotspot areas in the 95% confidence interval decreased significantly and the hotspot areas in the 90% confidence interval increased significantly, mainly because in the ecological protection scenario, the area of farmland decreased, and the area of forest land increased; meanwhile, the expansion of built-up land was restricted and the area of water increased, which made the ESV in the central and northwestern regions has decreased compared with other regions, so there is a significant decrease in hotspot areas in the 95% confidence interval, and a significant decrease in cold spot areas in the 95% confidence interval in the province, especially in the eastern region.

4. Discussion

4.1. Spatial Response of ESV for LUCC

Land use change can significantly change the provision of ecosystem services, which in turned can affect changes in ESV. Rapid urban expansion can lead to a further decrease in the ecological service value. However, under the influence of significant urbanization, the overall ESV of Heilongjiang Province showed an “increase-decrease-increase” trend during 2000–2020, with the largest ESV of 1342.11 billion yuan in 2010. This is consistent with the research results of Wang et al. [50]. In 2020, the ecosystem services value in Heilongjiang Province did not decrease significantly, but increased slightly compared with 2000, and the overall ESV change range in the whole province was not obvious.
In terms of land use change characteristics, farmland always accounted for more than 43% of the total area of Heilongjiang Province during the study period, and the largest area was transferred, with 46.39% transferred out to forest land and 30.36% transferred out to built-up land, it performed a certain role in promoting the increase in ESV. The proportion of forest land in the total area of Heilongjiang province has been the largest during the study period, always above 48%, showing an “increasing-decreasing-increasing” trend, which is consistent with the overall ESV trend, and the proportion of forest land in the overall ESV is the largest, indicating that forest land is the main land type affecting ESV changes. The area of grassland and unused land continued to decline during 2000–2020, with grassland mainly converted to farmland and forest land, leading to a gradual decrease in ESV. Unused land was mainly converted to forest land and built-up land, promoting the change in ESV. Water performs a crucial role in ecosystem services and can effectively relieve drought, further enrich species diversity in the study area, improve habitat quality, and significantly improve the surrounding ecological environment [63]. During the research period, the water area has been increasing continuously. In the past 20 years, the water area has increased by 1180 km2, which has increased the water ESV by 156.6 billion yuan and performed a significant role in promoting the overall ESV change. During the study period, the built-up land gradually increased, mainly from the transfer of farmland. Due to the continuous occupation of other land types, the change of ESV was inhibited. However, due to the continuous increase in water area and the continuous decrease in unused land area, it performs a certain compensation role for the decline of ESV caused by the expansion of built-up land.
To further clarify the future ESV situation in Heilongjiang Province, this study determines the area of each land type under different future scenarios through the MOP model and simulates its spatial distribution based on the PLUS model. The quantitative and spatial patterns of land use types are simultaneously optimized from bottom-up and top-down perspectives. Three scenarios are set up for the future development of Heilongjiang Province, (natural development, economic priority, and ecological protection) in order to explore the trend of ESV changes under different scenarios.
In the natural development scenario, land use evolves according to historical trends and its ecosystem service value does not change significantly, increasing by 5.9 billion from 2020. In the economic priority scenario, the area of farmland has increased, and the area of forest land has decreased significantly in pursuit of maximizing economic benefits, resulting in a significant decrease of 73.6 billion in the ecological service value under the economic priority scenario. In the ecological protection scenario, due to the large eco-efficiency coefficient of forest land, under the aim of maximizing ecological benefits, the area of farmland decreased significantly, and the area of forest land increased significantly, leading to an increase in ESV of 151.9 billion yuan in the province. Although the farmland area has already met the future development needs under the constraints of the MOP model, the reduction in food production due to a significant decline in farmland area still needs attention, considering the adverse effects of natural disasters and climatic conditions.

4.2. Development of Future Land Use Policy

With the depth of research on the value of ecosystem services, it is gradually recognized that ESVs are important for ecological conservation, food production security, and healthy agricultural development, and are closely related to human well-being and sustainable development [64,65]. The assessment of ecosystem service values can further enhance people’s awareness of ecological protection and highlight the importance of natural capital, in addition to providing a reference basis for ecological compensation and helping the optimization of land use patterns [66,67]. Therefore, enhancing the value of ecosystem services in the region has become an urgent issue nowadays.
Different development stages of society correspond to different land use patterns. In response to development issues, such as climate change and food security, policy makers should propose policies that are more conducive to sustainable land development. In the future development of Heilongjiang Province, built-up land will be further expanded and land use changes due to increasing human activities will be the main driving factor affecting ESV changes. Under different future development scenarios, the ecosystem protection scenario has the highest ESV, but may cause some impact on economic benefits. The economic priority scenario has the lowest ESV, but the highest economic benefit. The natural development scenario ESV has a slight increase from 2020 and represents a natural development trend for the future that is not affected by the policy. The future land use policy should revolve around the gradual improvement of ESV and sustainable land use development.
Determine the optimal pattern of land use to enhance the value of ecosystem services in the study area and achieve the goal of maximizing ESV. First, the disorderly expansion of construction land should be restricted. Coordinate the spatial relationship between urban development boundary, ecological protection red line and permanent basic farmland, strengthen the rigid constraint on urban construction activities, and guide the orderly development and construction of cities. Second, under different future scenarios, the hotspot areas for ESV are mainly located in the northwestern, central, and southwestern parts of Heilongjiang Province, and their land types are mainly forestland, these areas should strengthen the protection of forest resources and orderly implement the return of farmland to forestland to enhance the stability and biodiversity of the ecosystem in the region; Finally, the cold spot area of ESV is mainly located in the eastern and western regions, and its land type is mainly farmland. This region should strictly adhere to the red line of farmland protection, strengthen centralized protection and comprehensive management of farmland in black soil, and improve the quality of farmland to ensure food production safety. In addition, the government should also uphold the development concept of planning first and ecological priority, focus on solving a series of problems caused by the decline of ecosystem services, and conduct regular assessments of ESVs to guide future development and construction.

4.3. Limitations and Future Work Focus

There are some limitations in this study. ESV assessment is closely related to land use change patterns and, in this study, land use types are classified into only six categories (farmland, forest land, grass land, water, built-up land, and unused land). Not assessing ESV at a more refined site type may lead to some discrepancy between the ESV assessment and the actual situation. Additionally, although the equivalence factor method is more concise and effective, setting the service value coefficient of built-up land to 0 may cause some uncertainty in the assessment of ESV [7]. A more accurate assessment of the ecological service value in Heilongjiang Province using more refined land use types and reasonable equivalence coefficient tables will be the focus of future work. In addition, we have included climate change impacts on ecosystem services in our future work plans.

5. Conclusions

This study assessed the ecological service value in Heilongjiang Province based on the equivalence coefficient method, predicted the area of future land use types under different scenarios using the Markov model and MOP model, simulated the land use pattern of Heilongjiang Province in 2035 based on the PLUS model and assessed the ESV under different scenarios. The main conclusions are as follows:
1. During 2000–2020, the built-up land in Heilongjiang Province continued to grow, with a total increase of 5076 km2 during the 20-year period, the area of water continued to grow, the area of unused land gradually decreased, and the area of farmland and forest land changed less.
2. During the study period, the ESVs in 2000, 2005, 2010, 2015, and 2020 were 1320.8 billion, 1334.5 billion, 1342.1 billion, 1327.6 billion, and 1328.4 billion, respectively. The overall trend is fluctuating.
3. Three scenarios are set for the land use pattern of Heilongjiang Province in 2035, and the ESVs of natural development scenario (NPS), economic priority scenario (ERS), and ecological protection scenario (EPS) are 13,343 billion yuan, 1254.8 billion yuan, and 1455.6 billion yuan, respectively, with large differences in ESVs under different scenarios. It can provide a reference basis for the future sustainable development and ecological security pattern construction in Heilongjiang Province.
4. The spatial distribution of ESVs generally shows a spatial pattern of higher in the northwest, central and southeast, and lower in the east and west. Cold and hot spots of ESVs are widely distributed and have a high degree of aggregation.

Author Contributions

Conceptualization, Y.J. and J.W.; methodology, J.W., G.D., and H.T.; software, H.T.; validation, Y.J., J.W., and H.T.; formal analysis, H.L.; investigation, Y.J. and H.L.; resources, Y.J. and G.D.; data curation, H.T.; writing—original draft preparation, Y.J. and H.T.; writing—review and editing, Y.J., G.D. and J.W.; visualization, J.W.; supervision, J.W.; project administration, Y.J.; funding acquisition, Y.J. All authors have read and agreed to the published version of the manuscript.

Funding

This research was funded by State Key Laboratory of Geo-Information Engineering and Key Laboratory of Surveying and Mapping Science and Geospatial Information Technology of MNR, CASM, grant number 2021-03-10 and the National Key R&D Program of China, grant number 2021YFD1500101.

Data Availability Statement

Not applicable.

Acknowledgments

We would like to express our gratitude to the professionals of the Northeast Agricultural University who encouraged us to make this project a success. We also thank the reviewers and editors for the suggestions and comments for improving the manuscript.

Conflicts of Interest

The authors declare no conflict of interest.

References

  1. Braat, L.C.; de Groot, R. The ecosystem services agenda:bridging the worlds of natural science and economics, conservation and development, and public and private policy. Ecosyst. Serv. 2012, 1, 4–15. [Google Scholar] [CrossRef]
  2. Lu, Q.; Zhao, C.; Huang, H. Comparative Study on the Temporal and Spatial Evolution of the Ecosystem Service Value of Different Karst Landform Types: A Case Study in Guizhou Province, China. Appl. Sci. 2022, 12, 12801. [Google Scholar] [CrossRef]
  3. Niu, H.; An, R.; Xiao, D.; Liu, M.; Zhao, X. Estimation of Ecosystem Services Value at a Basin Scale Based on Modified Equivalent Coefficient: A Case Study of the Yellow River Basin (Henan Section), China. Int. J. Environ. Res. Public Health 2022, 19, 16648. [Google Scholar] [CrossRef]
  4. Ma, Q.; Zhou, M.; Liu, J.; Zhao, J.; Xi, M. Coupling Relationship between Ecosystem Service Value and Socioeconomic Development in the Qinba Mountains, China. Diversity 2022, 14, 1105. [Google Scholar] [CrossRef]
  5. Cai, G.; Lin, Y.; Zhang, F.; Zhang, S.; Wen, L.; Li, B. Response of Ecosystem Service Value to Landscape Pattern Changes under Low-Carbon Scenario: A Case Study of Fujian Coastal Areas. Land 2022, 11, 2333. [Google Scholar] [CrossRef]
  6. Fu, B. Promoting Geography for Sustainability. Geogr. Sustain. 2020, 1, 1–7. [Google Scholar] [CrossRef]
  7. Li, C.; Wu, Y.; Gao, B.; Zheng, K.; Wu, Y.; Li, C. Multi-scenario simulation of ecosystem service value for optimization of land use in the Sichuan-Yunnan ecological barrier, China. Ecol. Indic. 2021, 132, 108328. [Google Scholar] [CrossRef]
  8. Costanza, R.; de Groot, R.; Braat, L.; Kubiszewski, I.; Fioramonti, L.; Sutton, P.; Farber, S.; Grasso, M. Twenty years of ecosystem services: How far have we come and how far do we still need to go? Ecosyst. Serv. 2017, 28, 1–16. [Google Scholar] [CrossRef]
  9. Yu, D.; Lu, N.; Fu, B. Establishment of a comprehensive indicator system for the assessment of biodiversity and ecosystem services. Landsc. Ecol. 2017, 32, 1563–1579. [Google Scholar] [CrossRef]
  10. Zhao, Y.; Han, Z.; Yan, X.; Wang, X. Integrating Spatial Heterogeneity into an Analysis between Ecosystem Service Value and Its Driving Factors: A Case Study of Dalian, China. Int. J. Environ. Res. Public Health 2022, 19, 17055. [Google Scholar] [CrossRef]
  11. Yang, Y.; Song, G.; Lu, S. Study on the ecological protection redline (EPR) demarcation process and the ecosystem service value (ESV) of the EPR zone: A case study on the city of Qiqihaer in China. Ecol. Indic. 2020, 109, 105754. [Google Scholar] [CrossRef]
  12. Hong, W.; Jiang, R.; Yang, C.; Zhang, F.; Su, M.; Liao, Q. Establishing an ecological vulnerability assessment indicator system for spatial recognition and management of ecologically vulnerable areas in highly urbanized regions: A case study of Shenzhen, China. Ecol. Indic. 2016, 69, 540–547. [Google Scholar] [CrossRef]
  13. Stefanidis, S.; Chatzichristaki, C. Response of soil erosion in a mountainous catchment to temperature and precipitation trends. Carpathian J. Earth Environ. Sci. 2017, 12, 35–39. [Google Scholar]
  14. Zarrineh, N.; Abbaspour, K.C.; Holzkämper, A. Integrated assessment of climate change impacts on multiple ecosystem services in Western Switzerland. Sci. Total Environ. 2020, 708, 135212. [Google Scholar] [CrossRef]
  15. Ouyang, Z.; Zheng, H.; Xiao, Y.; Polasky, S.; Liu, J.; Xu, W.; Wang, Q.; Zhang, L.; Xiao, Y.; Rao, E.; et al. Improvements in ecosystem services from investments in natural capital. Science 2016, 352, 1455–1459. [Google Scholar] [CrossRef] [PubMed]
  16. Li, J.; Wang, W.; Hu, G.; Wei, Z. Changes in ecosystem service values in Zoige Plateau, China. Agric. Ecosyst. Environ. 2010, 139, 766–770. [Google Scholar] [CrossRef]
  17. Obeng, E.A.; Aguilar, F.X. Value orientation and payment for ecosystem services: Perceived detrimental consequences lead to willingness-to-pay for ecosystem services. J. Environ. Manag. 2018, 206, 458–471. [Google Scholar] [CrossRef] [PubMed]
  18. Egoh, B.; Rouget, M.; Reyers, B.; Knight, A.T.; Cowling, R.M.; van Jaarsveld, A.S.; Welz, A. Integrating ecosystem services into conservation assessments: A review. Ecol. Econ. 2007, 63, 714–721. [Google Scholar] [CrossRef]
  19. Wainger, L.A.; King, D.M.; Mack, R.N.; Price, E.W.; Maslin, T. Can the concept of ecosystem services be practically applied to improve natural resource management decisions? Ecol. Econ. 2010, 69, 978–987. [Google Scholar] [CrossRef]
  20. Costanza, R.; d’Arge, R.; de Groot, R.; Farber, S.; Grasso, M.; Hannon, B.; Limburg, K.; Naeem, S.; O’Neill, R.V.; Paruelo, J.; et al. The value of the world’s ecosystem services and natural capital. Nature 1997, 387, 253–260. [Google Scholar] [CrossRef]
  21. Deng, Y.J.; Hou, M.Y.; Xie, Y.F.; Gao, Q.; Yao, S.B.; Gong, Z.W.; Lu, Y.N.; Jia, L.; Li, Y.Y. Impact of the Grain for Green Project on the temporal and spatial evolution of ecosystem service value in northern Shaanxi. Acta Ecol. Sin. 2020, 40, 6597–6612. [Google Scholar] [CrossRef]
  22. Fang, L.L.; Xu, D.H.; Wang, L.C.; Niu, Z.G.; Zhang, M. The study of ecosystem services and the comparison of trade-off and synergy in Yangtze River Basin and Yellow River Basin. Geogr. Res. 2021, 40, 821–838. [Google Scholar] [CrossRef]
  23. Shrestha, B.; Ye, Q.; Khadka, N. Assessment of Ecosystem Services Value Based on Land Use and Land Cover Changes in the Transboundary Karnali River Basin, Central Himalayas. Sustainability 2019, 11, 3183. [Google Scholar] [CrossRef]
  24. Zhang, B.; Li, L. Evaluation of ecosystem service value and vulnerability analysis of China national nature reserves: A case study of Shennongjia Forest Region. Ecol. Indic. 2023, 149, 110188. [Google Scholar] [CrossRef]
  25. Friess, D.A.; Yando, E.S.; Wong, L.-W.; Bhatia, N. Indicators of scientific value: An under-recognised ecosystem service of coastal and marine habitats. Ecol. Indic. 2020, 113, 106255. [Google Scholar] [CrossRef]
  26. Sun, C.; Wang, Y.; Zou, W. The marine ecosystem services values for China based on the emergy analysis method. Ocean Coast. Manag. 2018, 161, 66–73. [Google Scholar] [CrossRef]
  27. Estoque, R.C.; Myint, S.W.; Wang, C.; Ishtiaque, A.; Aung, T.T.; Emerton, L.; Ooba, M.; Hijioka, Y.; Mon, M.S.; Wang, Z.; et al. Assessing environmental impacts and change in Myanmar’s mangrove ecosystem service value due to deforestation (2000–2014). Glob. Chang. Biol. 2018, 24, 5391–5410. [Google Scholar] [CrossRef]
  28. Zhang, M.; Dilinuer, A.J. Evaluation of ecosystem service value of constructed wetland on the west bank of the Bosten Lake. Trans. Oceanol. Limnol. 2021, 43, 169–174. [Google Scholar] [CrossRef]
  29. Guo, H.Y.; Wang, Y.R.; Lu, Q.; Zhou, J.X.; Wei, Q.Z. Assessment on the eco-service value in karst rocky desert: A case study in Jinsha County. Carsologica Sin. 2013, 32, 211–217. [Google Scholar] [CrossRef]
  30. Zhao, N.; Wang, H.; Zhong, J.; Sun, D. Assessment of Recreational and Cultural Ecosystem Services Value of Islands. Land 2022, 11, 205. [Google Scholar] [CrossRef]
  31. Petway, J.R.; Lin, Y.-P.; Wunderlich, R.F. A Place-Based Approach to Agricultural Nonmaterial Intangible Cultural Ecosystem Service Values. Sustainability 2020, 12, 699. [Google Scholar] [CrossRef]
  32. Xie, G.D.; Lu, C.X.; Leng, Y.F.; Zheng, D.U.; Li, S.C. Ecological assets valuation of the Tibetan Plateau. J. Nat. Resour. 2003, 18, 189–196. [Google Scholar] [CrossRef]
  33. Xie, G.; Zhang, C.; Zhen, L.; Zhang, L. Dynamic changes in the value of China’s ecosystem services. Ecosyst. Serv. 2017, 26, 146–154. [Google Scholar] [CrossRef]
  34. Zhang, M.; Ao, Y.; Liu, M.; Zhao, Y.; Lin, K.; Cheng, T. Ecological security assessment based on ecosystem service value and ecological footprint in the Pearl River Delta urban agglomeration, China. Ecol. Indic. 2022, 144, 109528. [Google Scholar] [CrossRef]
  35. Wang, Y.; Pan, J. Building ecological security patterns based on ecosystem services value reconstruction in an arid inland basin: A case study in Ganzhou District, NW China. J. Clean. Prod. 2019, 241, 118337. [Google Scholar] [CrossRef]
  36. Zhou, X.; Ma, M.; Chen, Q.; Qi, W.; Gao, Y.; Cui, J. Uneven Distribution of Ecosystem Services along the Yarlung Zangbo River Basin in Tibet Reveals the Quest for Multi-Target Policies of Rural Development in Less-Favored Areas. Land 2022, 11, 1961. [Google Scholar] [CrossRef]
  37. Luo, Q.; Zhou, J.; Li, Z.; Yu, B. Spatial differences of ecosystem services and their driving factors: A comparation analysis among three urban agglomerations in China’s Yangtze River Economic Belt. Sci. Total Environ. 2020, 725, 138452. [Google Scholar] [CrossRef] [PubMed]
  38. Cai, T.; Luo, X.; Fan, L.; Han, J.; Zhang, X. The Impact of Cropland Use Changes on Terrestrial Ecosystem Services Value in Newly Added Cropland Hotspots in China during 2000–2020. Land 2022, 11, 2294. [Google Scholar] [CrossRef]
  39. Lin, W.; Sun, Y.; Nijhuis, S.; Wang, Z. Scenario-based flood risk assessment for urbanizing deltas using future land-use simulation (FLUS): Guangzhou Metropolitan Area as a case study. Sci. Total Environ. 2020, 739, 139899. [Google Scholar] [CrossRef] [PubMed]
  40. Wei, Q.; Abudureheman, M.; Halike, A.; Yao, K.; Yao, L.; Tang, H.; Tuheti, B. Temporal and spatial variation analysis of habitat quality on the PLUS-InVEST model for Ebinur Lake Basin, China. Ecol. Indic. 2022, 145, 109632. [Google Scholar] [CrossRef]
  41. Shi, Q.; Gu, C.-J.; Xiao, C. Multiple scenarios analysis on land use simulation by coupling socioeconomic and ecological sustainability in Shanghai, China. Sustain. Cities Soc. 2023, 95, 104578. [Google Scholar] [CrossRef]
  42. Liang, X.; Guan, Q.; Clarke, K.C.; Liu, S.; Wang, B.; Yao, Y. Understanding the drivers of sustainable land expansion using a patch-generating land use simulation (PLUS) model: A case study in Wuhan, China. Comput. Environ. Urban Syst. 2021, 85, 101569. [Google Scholar] [CrossRef]
  43. Saxena, A.; Jat, M.K. Capturing heterogeneous urban growth using SLEUTH model. Remote Sens. Appl. Soc. Environ. 2019, 13, 426–434. [Google Scholar] [CrossRef]
  44. Hemati, T.; Pourebrahim, S.; Monavari, M.; Baghvand, A. Species-specific nature conservation prioritization (a combination of MaxEnt, Co$ting Nature and DINAMICA EGO modeling approaches). Ecol. Model. 2020, 429, 109093. [Google Scholar] [CrossRef]
  45. Liu, X.; Liang, X.; Li, X.; Xu, X.; Ou, J.; Chen, Y.; Li, S.; Wang, S.; Pei, F. A future land use simulation model (FLUS) for simulating multiple land use scenarios by coupling human and natural effects. Landsc. Urban Plan. 2017, 168, 94–116. [Google Scholar] [CrossRef]
  46. Wang, Y.; Li, X.; Zhang, Q.; Li, J.; Zhou, X. Projections of future land use changes: Multiple scenarios-based impacts analysis on ecosystem services for Wuhan city, China. Ecol. Indic. 2018, 94, 430–445. [Google Scholar] [CrossRef]
  47. Verburg, P.H.; Overmars, K.P. Combining top-down and bottom-up dynamics in land use modeling: Exploring the future of abandoned farmlands in Europe with the Dyna-CLUE model. Landsc. Ecol. 2009, 24, 1167–1181. [Google Scholar] [CrossRef]
  48. Verburg, P.H.; Koomen, E.; Hilferink, M.; Pérez-Soba, M.; Lesschen, J.P. An assessment of the impact of climate adaptation measures to reduce flood risk on ecosystem services. Landsc. Ecol. 2012, 27, 473–486. [Google Scholar] [CrossRef]
  49. Deal, R.L.; Cochran, B.; LaRocco, G. Bundling of ecosystem services to increase forestland value and enhance sustainable forest management. For. Policy Econ. 2012, 17, 69–76. [Google Scholar] [CrossRef]
  50. Wang, L.-J.; Ma, S.; Zhao, Y.-G.; Zhang, J.-C. Ecological restoration projects did not increase the value of all ecosystem services in Northeast China. For. Ecol. Manag. 2021, 495, 119340. [Google Scholar] [CrossRef]
  51. Ramankutty, N.; Mehrabi, Z.; Waha, K.; Jarvis, L.; Kremen, C.; Herrero, M.; Rieseberg, L.H. Trends in Global Agricultural Land Use: Implications for Environmental Health and Food Security. Annu. Rev. Plant Biol. 2018, 69, 789–815. [Google Scholar] [CrossRef] [PubMed]
  52. Laurance, W.F.; Sayer, J.; Cassman, K.G. Agricultural expansion and its impacts on tropical nature. Trends Ecol. Evol. 2014, 29, 107–116. [Google Scholar] [CrossRef] [PubMed]
  53. Zhang, X.; Ren, W.; Peng, H. Urban land use change simulation and spatial responses of ecosystem service value under multiple scenarios: A case study of Wuhan, China. Ecol. Indic. 2022, 144, 109526. [Google Scholar] [CrossRef]
  54. Costanza, R.; de Groot, R.; Sutton, P.; van der Ploeg, S.; Anderson, S.J.; Kubiszewski, I.; Farber, S.; Turner, R.K. Changes in the global value of ecosystem services. Glob. Environ. Chang. 2014, 26, 152–158. [Google Scholar] [CrossRef]
  55. Niu, Y.; Xie, G.; Xiao, Y.; Liu, J.; Wang, Y.; Luo, Q.; Zou, H.; Gan, S.; Qin, K.; Huang, M. Spatiotemporal Patterns and Determinants of Grain Self-Sufficiency in China. Foods 2021, 10, 747. [Google Scholar] [CrossRef] [PubMed]
  56. Luan, C.; Liu, R. A Comparative Study of Various Land Use and Land Cover Change Models to Predict Ecosystem Service Value. Int. J. Environ. Res. Public Health 2022, 19, 16484. [Google Scholar] [CrossRef]
  57. Jia, W.; Gu, X.; Mi, X.; Yang, J.; Zang, W.; Liu, P.; Yan, J.; Zhu, H.; Zhang, X.; Zhang, Z. Multi-Scale Spatiotemporal Pattern Analysis and Simulation (MSPAS) Model with Driving Factors for Land Cover Change and Sustainable Development Goals: A Case Study of Nepal. Remote Sens. 2022, 14, 6295. [Google Scholar] [CrossRef]
  58. Bashir, O.; Bangroo, S.A.; Guo, W.; Meraj, G.; TAyele, G.; Naikoo, N.B.; Shafai, S.; Singh, P.; Muslim, M.; Taddese, H.; et al. Simulating Spatiotemporal Changes in Land Use and Land Cover of the North-Western Himalayan Region Using Markov Chain Analysis. Land 2022, 11, 2276. [Google Scholar] [CrossRef]
  59. Han, J.; Hu, Z.; Wang, P.; Yan, Z.; Li, G.; Zhang, Y.; Zhou, T. Spatio-temporal evolution and optimization analysis of ecosystem service value—A case study of coal resource-based city group in Shandong, China. J. Clean. Prod. 2022, 363, 132602. [Google Scholar] [CrossRef]
  60. Long, X.; Lin, H.; An, X.; Chen, S.; Qi, S.; Zhang, M. Evaluation and analysis of ecosystem service value based on land use/cover change in Dongting Lake wetland. Ecol. Indic. 2022, 136, 108619. [Google Scholar] [CrossRef]
  61. Wang, L.; Chen, C.; Xie, F.; Hu, Z.; Zhang, Z.; Chen, H.; He, X.; Chu, Y. Estimation of the value of regional ecosystem services of an archipelago using satellite remote sensing technology: A case study of Zhoushan Archipelago, China. Int. J. Appl. Earth Obs. Geoinf. 2021, 105, 102616. [Google Scholar] [CrossRef]
  62. Huang, Y.; Lin, T.; Zhang, G.; Jones, L.; Xue, X.; Ye, H.; Liu, Y. Spatiotemporal patterns and inequity of urban green space accessibility and its relationship with urban spatial expansion in China during rapid urbanization period. Sci. Total Environ. 2022, 809, 151123. [Google Scholar] [CrossRef] [PubMed]
  63. Grizzetti, B.; Liquete, C.; Pistocchi, A.; Vigiak, O.; Zulian, G.; Bouraoui, F.; De Roo, A.; Cardoso, A.C. Relationship between ecological condition and ecosystem services in European rivers, lakes and coastal waters. Sci. Total Environ. 2019, 671, 452–465. [Google Scholar] [CrossRef] [PubMed]
  64. Wang, Y.; Zhang, Z.; Chen, X. Spatiotemporal change in ecosystem service value in response to land use change in Guizhou Province, southwest China. Ecol. Indic. 2022, 144, 109514. [Google Scholar] [CrossRef]
  65. Zheng, D.; Wang, Y.; Hao, S.; Xu, W.; Lv, L.; Yu, S. Spatial-temporal variation and tradeoffs/synergies analysis on multiple ecosystem services: A case study in the Three-River Headwaters region of China. Ecol. Indic. 2020, 116, 106494. [Google Scholar] [CrossRef]
  66. Small, N.; Munday, M.; Durance, I. The challenge of valuing ecosystem services that have no material benefits. Glob. Environ. Chang. 2017, 44, 57–67. [Google Scholar] [CrossRef]
  67. Huang, C.; Zhao, D.; Deng, L. Landscape pattern simulation for ecosystem service value regulation of Three Gorges Reservoir Area, China. Environ. Impact Assess. Rev. 2022, 95, 106798. [Google Scholar] [CrossRef]
Figure 1. Geographical location and topography of Heilongjiang Province. (A) Location of the research area, (B) Location and topography of the study area, (C) Land use in 2000, and (D) Land use in 2020.
Land 12 00962 g001
Figure 2. Technical route.
Land 12 00962 g002
Figure 3. Driving factor data. (A)DEM, (B) Slope, (C) Pre, (D) Tem, (E) Soil Type, (F) NPP, (G)NDVI, (H) POP, (I) GDP, (J) Night Light, (K) Dis_Gov, (L) Dis_Railway, (M) Dis_Highway, (N) Dis_Road, (O) Dis_Cityroad, and (P) Constraint.
Land 12 00962 g003
Figure 4. Land use transfer Sankey map, 2000–2020.
Land 12 00962 g004
Figure 5. ESV distribution map from 2000 to 2020.
Land 12 00962 g005
Figure 6. Map of actual land use and simulated land use change in 2020. (A) Partial display of region A, (B) Partial display of region B, (C) Partial display of region C.
Land 12 00962 g006
Figure 7. Land use in 2035 under different scenarios. (A)Partial display of region A, (B) Partial display of region B, (C) Partial display of region C.
Land 12 00962 g007
Figure 8. Spatial distribution of ESV in different scenarios.
Land 12 00962 g008
Figure 9. Spatial distribution of hotspot analysis, 2000–2035.
Land 12 00962 g009
Table 1. Data details and sources.
Data NameData TypeResolutionTimeData Source
Land use dataRaster30 m2000, 2005, 2010, 2015, 2020https://zenodo.org/record/5816591 access on 17 October 2022
DEM, SlopeRaster90 m2000https://www.gscloud.cn/ access on 6 October 2022
Precipitation Raster1000 m2020https://www.resdc.cn/ access on 12 December 2022
TemperatureRaster1000 m2020
Net primary productivity Raster1000 m2010
NDVI Raster1000 m2018
PopulationRaster1000 m2019
GDP Raster1000 m2019
Nighttime light dataRaster1000 m2020
Soil dataRaster1000 m2010http://webarchive.iiasa.ac.at access on 12 December 2022
Administrative centerVector2020https://lbs.amap.com/ access on 19 October 2022
RailVector2020https://www.openstreetmap.org access on 15 April 2022
HighwayVector2020
RoadVector2020
City roadVector2020
ConstraintVector2020
Socio-economic data2000, 2005, 2010, 2015, 2020http://tjj.hlj.gov.cn/tjj/c106782/common_zfxxgk.shtml access on 8 December 2022
Table 2. The market prices, acreage, and production of food crops.
TypePrice (Yuan/kg)Area (×104 ha)Yield (kg/ha)
Wheat2.27 4.87 3839
Corn2.20 548.07 6654
Soybean4.63 483.21 1905
Rice2.83 387.20 7480
Table 3. MOP model constraints.
Constraint TypeConstraint (km2)Description
Total area constraint x 1 + x 2 + x 3
+ x 4 + x 5 + x 6
= 452538.44
Total area of land type remains unchanged.
Farmland constraint x 1 166622 According to “Heilongjiang Province 2035 Territorial Spatial Planning”, the target of the province’s farmland by 2035 is 166,622 km2.
Forest land constraint x 2 201925 According to the “Heilongjiang Province 2035 Land Spatial Plan” proposed strict control of forest land protection and policies, by 2035, the province’s forest coverage rate should reach 44.26%
Grass land constraint 4775   km 2 x 3 5964 From 2010 to 2020, the grassland area shows a decreasing trend, taking the 2020 grassland area as the lower limit and the Markov predicted grass land area as the upper limit.
Water constraint 7423   km 2 x 4 7839 The area of water bodies showed a slow increasing trend during the study period. In order to further promote the optimization of the pattern of blue-green space and improve the deployment of water resources in the region, the area of water bodies in 2020 was taken as the lower limit and the area of water bodies predicted by Markov as the upper limit.
Built-up land constraint 16038   km 2 x 5 18507 Built-up land shows a continuous trend of expansion, with the area increasing year by year. In order to further improve the efficiency of land space utilization and optimize the spatial development pattern of cities and towns, 1.1 times the construction land in 2020 will be used as the lower limit, and the predicted area of Markov will be used as the upper limit.
Unused land constraint x 6 473 Setting unused land should not be less than the Markov predicted area.
Farmland and ecological land constraints x 1 + x 2 + x 3 + x 4 362035 To further implement the national food security strategy, and the construction of ecological space protection pattern, set the area of farmland, forest land, grass land, and water not less than 80% of the province’s area.
Reserved land constraint x 3 + x 6 4525.38 To reserve space for the sustainable development of construction land and the construction of public space within the city, the area of grass land and unused land is set at no less than 1% of the province’s area.
Table 4. Land use change statistics from 2000–2020.
Farmland
(km2)
Forest
(km2)
Grass
(km2)
Water
(km2)
Built-Up
(km2)
Unused
(km2)
2000202,155 224,613 7833 6244 9516 2029
proportion44.69%49.65%1.73%1.38%2.10%0.45%
2005198,198 226,149 9256 6425 10,630 1732
proportion43.81%49.99%2.05%1.42%2.35%0.38%
2010197,188 226,678 8613 6771 11,913 1228
proportion43.59%50.11%1.90%1.50%2.63%0.27%
2015203,142 221,007 6992 7291 13,178 929
proportion44.89%48.84%1.55%1.61%2.91%0.21%
2020202,269 221,514 5964 7424 14,592 776
proportion44.70%48.95%1.32%1.64%3.22%0.17%
Table 5. Land use transfer matrix (km2), 2000–2020.
FarmlandForestGrassWaterBuilt-UpUnuseTotalTransfer
Farmland181,583 9544 3071 1517 6245 194 202,155 20,572
Forest13,411 209,904 598 188 394 118 224,613 14,708
Grass3520 1422 2011 95 731 54 7833 5822
Water515 262 25 5107 312 23 6244 1137
Built-up2200 144 169 306 6664 33 9516 2852
Unuse1015 203 88 129 241 354 2029 1676
Total202,243 221,479 5962 7342 14,587 776 452,538
Transfer20,661 11,574 3951 2235 7924 422 46,767
Table 6. ESV in different land use types, 2000–2020 (×108).
FarmlandForestGrassWaterBuilt-UpUnuseTotal
20001623.24 9676.84 314.151593.430.00 0.82 13,208.49
20051591.52 9742.98 370.51 1639.17 0.00 0.71 13,344.88
20101583.57 9765.97 344.02 1727.04 0.00 0.50 13,421.10
20151631.32 9518.04 280.18 1846.12 0.00 0.38 13,276.04
20201624.26 9540.34 238.69 1880.60 0.00 0.32 13,284.20
Table 7. Area of each land type under different scenarios.
Farmland
(km2)
Forest
(km2)
Grass
(km2)
Water
(km2)
Built-Up
(km2)
Unused
(km2)
NDS174,185 222,758 4775 7839 18,507 474
ERS218,246 201,925 5964 7423 18,507 474
EPS166,622 256,790 4775 7839 16,038 474
Table 8. ESV in 2020 and 2035 under different scenarios (Billion).
FarmlandForestGrassWaterBuilt-UpUnusedTotal
20201624 9540 239 1881 0 0.32 13,284
NPS1591 9593 191 1967 0 0.19 13,343
ERS1752 8696 239 1861 0 0.19 12,548
EPS1338 11,059 191 1968 0 0.19 14,556
Disclaimer/Publisher’s Note: The statements, opinions and data contained in all publications are solely those of the individual author(s) and contributor(s) and not of MDPI and/or the editor(s). MDPI and/or the editor(s) disclaim responsibility for any injury to people or property resulting from any ideas, methods, instructions or products referred to in the content.

