Abstract
Improving the coupling coordination degree between water and land resources matching (WLRM) and cultivated land use eco-efficiency (CLUE) is crucial to ensuring national food security and constructing an ecological civilization. This study is based on the data of 71 prefecture-level cities in the major grain-producing areas in the middle and lower reaches of the Yangtze River from 2008 to 2020. The unit area water resource method, the slacks-based measurement (SBM)-undesirable, the Theil–Sen median analysis, the Mann–Kendall trend test, the coupling coordination degree model, and the spatial autocorrelation model are adopted to measure and analyze the WLRM, the CLUE, and the coupling and coordination level, and their spatial–temporal evolution characteristics quantitatively. Results show the following: (1) From 2008 to 2020, the average value of WLRM in the study areas is 18,200 m3/hm2, which is at a medium level, and the provinces show the characteristics of “high in the south and low in the north, with decreasing gradients”. (2) The annual average of CLUE is 0.777, which is in the medium level, and each province has the remarkable characteristics of “one high and four low”. (3) The coupling coordination degree of WLRM and CLUE is in the primary coordination level, which shows a significant positive correlation in space. In the local perspective, it shows the agglomeration characteristics of “high in the south and low in the north, nodule distribution”. In the future, the neighboring prefecture-level cities should actively build a synergistic mechanism for agricultural development, strengthen the reasonable use of water and land resources and pollution control techniques, drive the transformation of low–low aggregation areas to high–high aggregation areas, and improve the overall coordination of the study areas. This approach aims to promote the construction of ecological civilization and guarantee grain security and sustainable development of agriculture in China.
1. Introduction
Ensuring grain production security is a key agricultural policy goal in China [1]. The major grain-producing areas in the middle and lower reaches of the Yangtze River are the important net grain transfer areas in China. These areas have abundant agricultural resources, and its total grain production output accounts for approximately 1/5 of the total grain output in China, making an important contribution to China’s food security. Grain production is inseparable from the support of water and land resources, and the WLRM is related to food security [2] and the sustainable use of cultivated land. If water and land resources are mismatched, then farmers will increase the application of pesticides and fertilizers to ensure soil fertility and healthy crop growth, thereby ensuring grain production [3]. The residues caused by the heavy use of pesticides and fertilizers, on the one hand, aggravate ecological issues, including contamination of cultivated land, which leads to the decrease of CLUE; on the other hand, they pollute water bodies, affect the quality of regional water, change the characteristics of WLRM, and cause certain effects on food security and regional ecological environment [4]. China’s Second National Pollution Source Census Bulletin shows that in 2017, the number of water pollutants discharged (lost) from China’s cultivation industry included 83,000 tons of ammonia nitrogen and 1,149,300 tons of mulch use, with a multi-year cumulative residual amount of up to 1,184,800 tons. Therefore, promoting the coordinated development of WLRM and CLUE is crucial to ensuring national food security and improving the sustainability of agricultural development.
In terms of WLRM, much research focuses on the characteristics and spatial–temporal patterns of WLRM [5] and the relationship between WLRM and economic growth or carbon emission [6]. The research objects include areas in the national [7], regional [8], and provincial [9,10] levels. Among them, the Yellow River basin [11], the northeastern region [12], and typical mountainous areas have substantial research results. The measurement methods mainly include the unit area water resource method [13], the Gini coefficient method [5], and the water footprint method [14]. Among these methods, the unit area water resource method is widely used because it can intuitively reflect the matching degree of regional agricultural water and land resource endowment. It is the mainstream method to measure the degree of WLRM. In terms of CLUE, existing studies focus on the spatial–temporal characteristics and patterns of ecological efficiency of cropland use [15,16], influencing factors [17], and spatial spillover analysis [18] and then slowly expand to the relationship between the ecological efficiency of cropland use and urbanization [19]. Research scales include national scale, regional scale [20], and provincial scale. The research methods include data envelopment analysis (DEA) [21], ecological footprint, stochastic frontier analysis, and the SBM-Undesirable model [22]. The SBM-Undesirable model can measure the ecological efficiency of cropland use accurately due to the consideration of undesirable outputs.
In summary, studies on the relationship between WLRM and CLUE are limited. Exploring the coupling and coordination relationship and its characteristics between the two systems can further assist in the healthy development of the area. Therefore, according to the data from 71 prefecture-level cities in the major grain-producing areas in the middle and lower reaches of the Yangtze River from 2008 to 2020, this study expounded on the coupling mechanism between WLRM and CLUE. The unit area water resource method was used to measure the WLRM. Moreover, CLUE was measured using the improved SBM-Undesirable model. The coupling coordination model and spatial autocorrelation model were used to analyze the coupling coordination level between WLRM and CLUE. In addition, the Theil–Sen median analysis and the Mann–Kendall trend test were used to analyze the trend of coupling coordination between the two systems.
The possible contributions of this study are as follows. First, a coupling coordination mechanism between WLRM and CLUE was provided, and their coupling coordination relationship and the spatial–temporal characteristics were explored, the shortage of existing literature on the relationship between the two systems was filled. Second, the SBM-Undesirable model was improved, the index system was optimized, and the error was reduced, making it applicable to the major grain-producing areas in the study area. Third, this study considered the major grain-producing areas in the middle and lower reaches of the Yangtze River, which is rich in water resources but has a large difference in the degree of WLRM, as the object of study, whereas the previous academics mainly studied arid or semi-arid areas with poor water and land resources.
This paper is structured as follows: Section 2 describes the coupling mechanism; Section 3 introduces the study area and methodology; Section 4 presents the research results; Section 5 discusses the research results, recommendations, and research shortcomings; and Section 6 draws conclusions from the results.
2. Coupling Mechanism
The coefficients of WLRM refer to the number of water resources occupied per unit of the cultivated land area, which is usually used to characterize the WLRM. The CLUE refers to the degree of maximizing output and minimizing pollution produced by certain resource factor inputs [23,24]. The coupling and coordination of WLRM and CLUE refer to the global optimization and common development that can be achieved between the two systems through mutual influence and interaction.
The WLRM and the CLUE promote and constrain each other (Figure 1).
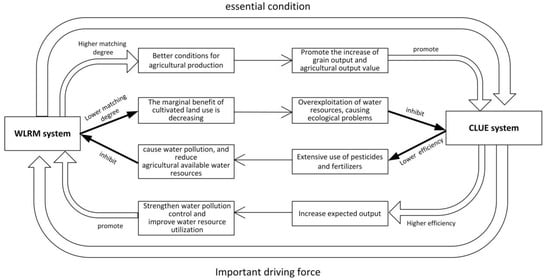
Figure 1.
Coupling mechanism diagram.
On the one hand, the two systems promote each other. First, water resource endowment is the essential condition for cultivated land resource development and utilization [25]. Higher regional WLRM indicates good agricultural production status [12], which is conducive to the increase in food production and total agricultural output. Second, the CLUE is an important driving force to improve WLRM. The improvement of CLUE increases the expected output, provides certain economic benefits and additional financial support to strengthen water pollution control, and improves water resource utilization, thus promoting the optimization of WLRM system.
On the other hand, the two systems inhibit each other. First, the lower degree of WLRM causes the diminishing marginal benefit of cultivated land use, leading to the overexploitation of groundwater resources, causing a series of ecological problems [26], reducing CLUE, and creating a suppressive effect on its system. To ensure the grain output and the output value of agriculture, farmers increase the input and use of pesticides and fertilizers, thereby polluting water bodies, reducing agricultural available water resources, changing the characteristics of WLRM [4], and reducing the WLRM.
3. Materials and Methods
3.1. Study Area
The major grain-producing areas in the middle and lower reaches of the Yangtze River include five provinces, namely, Hunan, Anhui, Hubei, Jiangxi, and Jiangsu, which are located in southeastern China and are important grain-producing regions and ecological barriers. However, with the rapid socioeconomic development, farmers neglect the preservation of the natural environment in favor of increasing the economic output of their cultivated land, resulting in the accumulation of “reverse ecological” benefits of cultivated land, the intensification of water and land resource pollution, and the increasing ecological pressure on the region, which is not conducive to the coordinated growth of regional WLRM and CLUE. Therefore, this study aims to investigate the coupling and coordination characteristics of WLRM and CLUE in the major grain-producing areas and to provide policy suggestions in order for the coordinated development of the two systems (Figure 2).
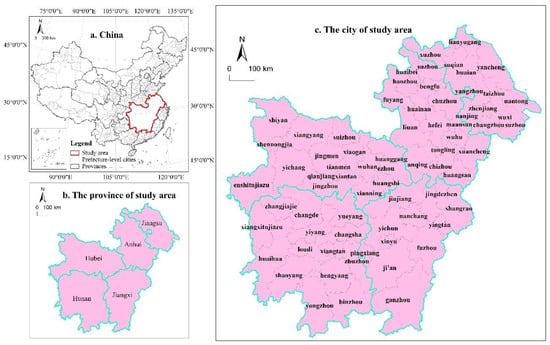
Figure 2.
Study area.
3.2. Index Construction and Data Sources
The assessment index system of the CLUE should consider three factors, including the input, expected output, and unexpected output, of the three systems of resources, socioeconomics, and environment, according to relevant research findings [27]. Therefore, total sown areas of farm crops, the converted number of employees in the primary industry, the net amount of chemical fertilizer application, pesticide application, consumption of agricultural films, and the converted total power of agricultural machinery were selected as cropland input indicators to characterize the resource dimension. Among them, the number of employees in the primary industry and the total power of agricultural machinery were converted by the output value of farming and gross output value of farming, forestry, animal husbandry, and fishery for the following reasons: They include various industries, such as agriculture, forestry, animal husbandry, and fishery, which can better reflect the labor and agricultural machinery inputs in the cultivation industry after conversion. The output value of farming and the total grain output were selected as output indicators to characterize the socioeconomic dimension. As for carbon emissions, they were selected as non-desired output indicators to characterize the environmental dimension. In accordance with the relevant literature [28,29,30], the carbon emission coefficients of various carbon sources were determined, and the specific index system is displayed in Table 1.

Table 1.
Evaluation index system of CLUE.
Data for measuring the CLUE were mainly obtained from the China Statistical Yearbook, the China Rural Statistical Yearbook, the National Economic and Social Development Statistical Bulletin, and the provincial and municipal statistical yearbooks and rural statistical yearbooks. Data relating to WLRM mainly came from the water resource bulletins of each province and city in the study time domain in previous years. Some missing or individual abnormal data were filled in by applying for public disclosure or interpolation method. The data of each province were calculated by averaging the data from all the cities at the prefecture level in that province every year. Data were standardized because of the inconsistency in the statistical caliber of the data on the correlation coefficient of WLRM and CLUE.
3.3. Methods
3.3.1. Unit Area Water Resource Method
The unit area water resource method is one of the most common methods to measure WLRM. The larger the coefficients of WLRM, the more beneficial to agricultural production activities, and vice versa. With reference to the measurement model proposed by Liu et al. [12] and combined with the actual agricultural production activities, the model is as follows:
where (104 m3/hm2) is the coefficient of WLRM in city in year; (108 m3) is the total water resources in city in year; is the proportion of agricultural water consumption in the total water consumption in city in year; (104 hm2) is the annual cultivated land area in city in year; is the average value of annual WLRM of each prefecture-level city in year; is the number of prefecture-level cities, and = 71.
3.3.2. SBM-Undesirable Model
The SBM-Undesirable model based on non-expected outputs was proposed by Tone [31]; it has an advantage over the traditional DEA model because it considers the slack variable case of inputs and non-expected outputs and is widely used in various efficiency measurements and evaluations. The basic principle is as follows [32]:
Assuming that is the number of decision-making units (DMU), each DMU includes input indicators , desired output indicators , and non-desired output indicators . Then matrices , and can be defined as , , and are greater than zero. The production possibility set can be defined as . The SBM-Undesirable model with non-desired output and variable size is as follows:
where is the CLUE in each prefecture-level city, and . denote the slack variable of input, desired output, and non-desired output, respectively, and are all greater than or equal to 0. denotes the weight vector.
3.3.3. Time Series Analysis Method
The Theil–Sen median analysis and the Mann–Kendall trend test were utilized to evaluate the trends of WLRM and coupling coordination in the study area. The Theil–Sen median analysis can robustly estimate the slope of the trend in the original data sample and is insensitive to outliers [28]; Using the rank order of the initial time series as its foundation, the Mann-Kendall trend test is a nonparametric statistical technique [33], which can be used in the Theil–Sen median analysis to analyze further the significance of the trend of data changes using the following formula [34]:
If > 0, then the trend in the data is upward; otherwise, it is downward. At a 95% confidence level, a trend is significant if ≤ 1.96; otherwise, it is not.
3.3.4. Coupling Coordination Degree Model
Coupling coordination degree is a metric that reflects the level of coordinated development of two or more systems [35]. The WLRM and CLUE act as two independent and interacting systems. In addition, on the basis of their coupling mechanism, the coupling coordination degree model of WLRM and CLUE is constructed as follows [36]:
where is the coupling degree of WLRM and CLUE. The value of ranges from 0 to 1, and the larger value indicates stronger interaction between the two systems. indicates the value of WLRM; indicates the CLUE value; is the adjustment coefficient, , and this study takes . represents the comprehensive coordination index. and are the parameters to be determined, and . This study considers that the two systems are equally important; therefore, . is the coupling coordination degree. The coupling coordination degree between the two systems of the WLRM and CLUE was classified into five levels [37] (Table 2).
Table 2.
Classification of coupling coordination degree.
3.3.5. Spatial Autocorrelation Model
The global Moran index is used to verify whether spatial correlation characteristics are observed between WLRM and CLUE from a global perspective. The calculation principle is as follows [38,39]:
where and are the coupling coordination degree of the WLRM and CLUE in prefecture-level cities (states) and , respectively. is the sample size. is the average degree of coupling coordination between the two systems. is the sample variance. is the spatial weight matrix. The value of ranges from 0 to 1, and if , then spatial positive autocorrelation exists. indicates the existence of spatial negative correlation, and indicates spatial irrelevance. The local Moran index is utilized for validation and is calculated as follows to study the clustering and dispersion properties of the coupling coordination between the two systems in the local space further:
The value of ranges from −1 to 1. When is significantly positive or negative, the two systems with similar or dissimilar coupling coordination are adjacent to each other, and the larger absolute value means a higher degree of proximity.
4. Results
4.1. Analysis of WLRM
In Table 3, the average value of WLRM in the study area is 1.82, which is higher than the national average (1.33). This finding indicates that the agricultural water and land conditions in the study area are better. However, large differences in the spatial–temporal evolution characteristics of WLRM are observed among provinces and cities.
Table 3.
Coefficients of WLRM.
The WLRM of each province in the study area from 2008 to 2020 is compared to reflect the spatial–temporal evolution. As shown in Figure 3, the WLRM shows a spatial–temporal evolution characteristic of “overall small growth, local differences in development” In general, the study area shows an overall growth trend ( = 0.055), but the growth is insignificant ( = 1.40), and the value of WLRM increases from 1.60 in 2008 to 2.77 in 2020, with a growth rate of 72.56%. Locally, the differences in the growth rate of WLRM of each province and city are remarkable. The most evident growth of WLRM is in Hunan ( = 2.14), whereas the growth trend of Jiangxi ( = 1.16), Anhui ( = 0.92), Jiangsu ( = 0.31), and Hubei ( = 0.06) is not evident. The highest growth rate is in Anhui with 97.58%; the lowest growth rate is in Hubei with only 49.80%; the middle growth rates are in Hunan, Jiangsu, and Jiangxi at 79.70%, 72.98%, and 64.72%, respectively. Hubei has the slowest growth rate because the total water resources grow the slowest, with the total water resources increasing from 103.395 billion cubic meters in 2008 to 175.471 billion cubic meters in 2020, with a growth rate of 69.71%. Anhui has the highest growth rate of WLRM, due to its decreasing arable land area and the fastest growth in total water resources (the growth rate is 94.54%), which increased from 65.8 billion cubic meters in 2008 to 128 billion cubic meters in 2020. The total amount of water resources in Anhui increased remarkably, mainly because it was hit by multiple rounds of heavy rainfall in 2020. Precipitation increased considerably in comparison with 2008, with a growth rate of 45.34%. Studies have shown that climate change affects the intensity, time, and quantity of precipitation, etc., affecting the availability of agricultural water resources [40]. In the face of heavy rainfall weather, Anhui scientifically dispatched large and medium-sized reservoirs in the province, effectively increasing the water storage capacity of reservoirs. Therefore, it is an important means of rational management of agricultural water consumption to develop the construction of water conservancy facilities vigorously, store water resources in the period of precipitation, and improve irrigation technology to cope with the shortage of agricultural water in the drought period.
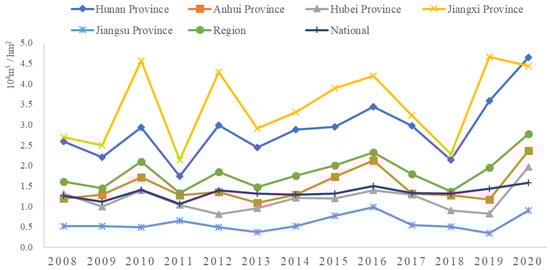
Figure 3.
Trend of the value of WLRM.
To understand further the spatial distribution pattern of WLRM, this study referred to the research method of Sun et al. [41] and selected the year-by-year arithmetic mean of the study period, using the natural breakpoint method (Jenks) to classify the coefficients of WLRM into the following five levels: I, high matching degree (4.041 < R ≤ 10.330); II, higher matching degree (2.151 < R ≤ 4.040); III, medium matching degree (0.941 < R ≤ 2.15); IV, lower matching degree (0.561 < R ≤ 0.940); V, low matching degree (0.190 ≤ R ≤ 0.560). Figure 4 shows that the spatial distribution pattern of WLRM in the provinces is “high in the south and low in the north, with decreasing gradients.” Geographically, the study area can be divided into two regions: the southern region includes Jiangxi and Hunan, and the northern region includes Anhui, Jiangsu, and Hubei. The mean annual value of the WLRM coefficient in the southern region is 3.17, which is higher than that in the northern region (1.08). A total of 10 prefecture-level cities have a high matching degree, including eight in the southern region, for example, Ganzhou, Fuzhou, Zhangjiajie, and Huaihua, accounting for 80.00%. A total of 11 prefecture-level cities have the higher matching degree, including eight in the southern region, for example, Yichun, Jiujiang, and Shaoyang, accounting for 72.73%. The total number of prefecture-level cities with a lower matching degree and low matching degree is 35, and all of them are distributed in the northern region. The higher matching degree of water and land resources in the southern region is mainly because it coordinates the water use in urban and rural areas and strictly controls the proportion of water use in industry, life, and agriculture. In the research time domain, the proportion of agricultural water in Jiangxi and Hunan was 61.68% and 60.16%, respectively, which was higher than that in Jiangsu, Anhui, and Hubei (58.00%, 53.78%, and 47.50%); thus, agricultural water consumption is effectively guaranteed, thereby supporting food production and a healthy ecosystem.
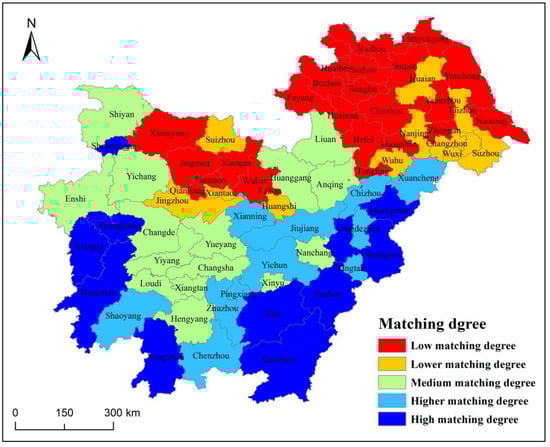
Figure 4.
Spatial distribution pattern of WLRM.
4.2. Analysis of CLUE
Through DEA-SOLVER, the expected output-to-unexpected output weight ratio was set to 1:1 (variable scale) to measure CLUE from 2008 to 2020 in the major grain-producing areas in the middle and lower reaches of the Yangtze River (Figure 5). In reference to related research results [42], the CLUE values were divided into high efficiency, higher efficiency, medium efficiency, lower efficiency, and low efficiency zones according to (0.9, 1], (0.8, 0.9], (0.7, 0.8], (0.6, 0.7], and (0, 0.6], respectively.
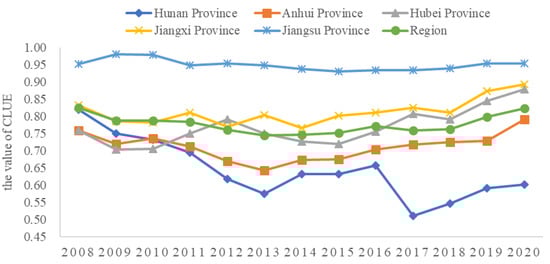
Figure 5.
The value of CLUE.
Based on the global perspective, the mean value of CLUE is 0.777. The efficiency value fluctuates within the range of 0.744–0.825, which is between the middle and the higher efficiency level, with a small change ( = −0.305), indicating that CLUE can still be improved. From the local perspective, the CLUE of each province varies remarkably, showing the characteristics of “one high and four low.”, that is, the value of CLUE in Jiangsu (0.949) is higher than those in Jiangxi, Hubei, Anhui, and Hunan (0.813, 0.768, 0.712, and 0.644, respectively).
The higher value of CLUE in Jiangsu could be ascribed to its greater degree of economic development [43]. Previous research has suggested that areas with a high level of economic development can improve regional agricultural production conditions through increased financial investment, agricultural science and technology, and policy support, thereby increasing CLUE. From 2008 to 2020, Jiangsu’s financial support for agriculture increased by 81.509 billion yuan, ranking first in the region, higher than Hunan, Anhui, Hubei, and Jiangxi (81.133 billion yuan, 78.754 billion yuan, 69.103 billion yuan, and 59.245 billion yuan). However, Jiangxi has a lower financial expenditure on agriculture and science and technology, but the value of CLUE is 0.813, which is the second highest in the region, probably because Jiangxi has actively changed its cultivated land use in recent years and increased its ecological environmental protection, resulting in the lowest undesirable output. Jiangxi has a carbon emission per unit of a grain of 0.084 tons, whereas those of Jiangsu, Anhui, Hunan, and Hubei provinces are 0.105, 0.107, 0.110, and 0.139 tons, respectively.
4.3. Analysis of the Spatial–Temporal Evolution Characteristics of the Coupling Coordination Degree
4.3.1. Analysis of Spatiotemporal Evolution Characteristics
(1) Based on the analysis of the time scale, Figure 6 shows that the coupling coordination degree of WLRM and CLUE in the study area from 2008 to 2020 is between 0.461 and 0.505, which is in the primary coordination stage. Each province shows the remarkable characteristics of “one high and four low, one drop and four increase”.
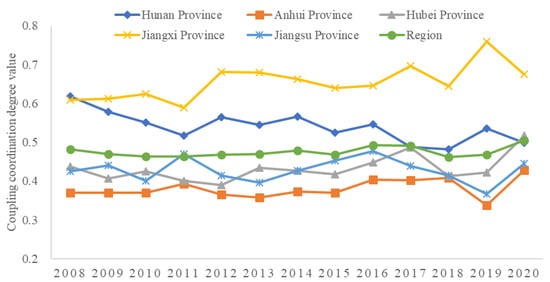
Figure 6.
Regional coupling coordination.
“One high and four low” refers to the coupling coordination level of WLRM and CLUE in Jiangxi being higher than Hunan, Hubei, Jiangsu, and Anhui. From 2008 to 2020, the mean annual average value of the coupling coordination of Jiangxi is 0.655, whereas the annual average values of Hunan, Hubei, Jiangsu, and Anhui are 0.540, 0.432, 0.428, and 0.381, respectively. The annual average value of coupling coordination in Jiangxi is in the medium level of coordination, which is the leading level in the entire region, indicating that it focuses on the reasonable matching of water and land resources and ecological environmental protection while elevating cultivated land use level. The high value of WLRM in Jiangxi is attributed to its total water resources ranking first in the region, whereas its high value of CLUE is attributed to its low-pollution cultivated land use, with 0.084 tons of unit grain carbon emissions in the region at the time of the study, which is the lowest in the region area. The annual average coupling coordination values in Hunan, Hubei, and Jiangsu are at the primary coordination level. Hunan has a high value of WLRM, but its CLUE is the lowest in the entire region, thereby pulling down the coupling coordination grade in the province. Hubei and Jiangsu have a low annual average of WLRM, but their CLUE levels are high; thus, their coupling coordination grades still reach the primary coordination grade. Anhui has the lowest annual average coupling coordination value in the entire region and is in the primary incoordination level mainly because it has the lowest CLUE value in the entire region. Moreover, a large amount of cropland, labor, and farm machinery inputs in Anhui are ineffectively transformed into the “economic–social–ecological” output of cropland during the study period.
“One drop and four increase” means that in terms of the evolution tendency of the coupling coordination degree, Hunan shows a downward trend ( = −0.008), whereas Hubei, Jiangxi, Anhui, and Jiangsu show an increasing tendency. From 2008 to 2020, the growth rate of coupling coordination degree in Hunan is −19.41%, and the growth rates of Jiangsu, Anhui, Jiangxi, and Hubei are 4.67%, 15.55%, 10.84%, and 18.25%, respectively. Hubei shows an increasing trend of coupling coordination value mainly due to the growth rate of 15.58% of its value of CLUE, which is the highest in the region. Meanwhile, the growth rate of its CLUE is mainly due to the growth rate of 161.81% of the expected output (Output value of farming), which is the highest in the region. Moreover, its growth rate of unexpected output (carbon emission) is −15.00%, which is the fourth in the region. Hunan shows a decreasing trend mainly because its value of CLUE decreases remarkably, and the growth rate of its total grain output in the expected output is 2.95%, which is the lowest in the region. Moreover, the growth rate of the unexpected output (carbon emission) is 24.76%, which is the highest in the region.
(2) Based on the spatial scale analysis, the four-time points of 2008, 2012, 2016, and 2020 are selected in this study. The coupling coordination level of the prefecture-level cities in the study time frame shows the spatial distribution characteristics of “overall coordination in the south and local disorder in the north”, indicating that the areas in the stage of high coordination and intermediate coordination are primarily in the south of the study area (Jiangxi and Hunan), whereas the areas in primary incoordination and serious incoordination are primarily in the north of the study area (Hubei, Jiangsu, and Anhui).
Specifically, as shown in Table 4, in 2008, two prefecture-level cities (states) were in the high coordination stage, making up 2.82% of the total; the number of prefecture-level cities at the intermediate coordination and the primary coordination stage was 47, accounting for 66.20%; 19 prefecture-level cities were in the primary incoordination stage with a proportion of 26.76%; three prefecture-level cities were in serious incoordination, accounting for 4.23%. In 2012, the number of prefecture-level cities in the high coordination stage was three, accounting for 4.23%; the number of prefecture-level cities in the intermediate coordination and the primary coordination level dropped to 46, accounting for 64.79%; 17 prefecture-level cities were in the primary incoordination level accounting for 23.94%; five prefecture-level cities were in serious incoordination, accounting for 7.04%. In 2016, no prefecture-level cities belonged to the high coordination level; the number of prefecture-level cities at the intermediate coordination and the primary coordination level increased by eight, with a total of 54, accounting for 76.06%; 14 prefecture-level cities were in the primary incoordination level accounting for 19.72%; the number of prefecture-level cities in the serious incoordination level dropped to three, accounting for 4.23%. In 2020, no prefecture-level cities had high coordination stage; the number of prefecture-level cities in the intermediate coordination and the primary coordination levels increased by four, totaling 58, accounting for 81.69%; the number of prefecture-level cities in the primary incoordination stage decreased remarkably totaling 11 and accounting for 15.49%; Two prefecture-level cities were in serious incoordination, accounting for 2.82%.
Table 4.
Number and proportion of coupling coordination degree levels.
4.3.2. Spatial Correlation Pattern Analysis
On the basis of the spatial analysis module in GeoDa software, the spatial autocorrelation of the coupling coordination degree between WLRM and CLUE is explored from the global and local perspectives, and its spatial–temporal evolution characteristics are further revealed.
From a global perspective, the global Moran’s I of the coupling coordination degree of WLRM and CLUE in the study area were all positive, and all passed the 1% significance test, indicating the existence of positive spatial autocorrelation. In Table 5, the overall coupling coordination degree of the two systems showed a slightly increasing tendency from 2008 to 2020, and the global Moran’s value increased from 0.324 to 0.416.
Table 5.
Global Moran’s I for the coupling coordination.
From a local perspective, the coupling coordination degree of WLRM and CLUE in the study area shows the agglomeration characteristics of “high in the south and low in the north, nodule distribution”, but the agglomeration benefits are gradually weakened. In this study, a local spatial autocorrelation model was used to draw the local indicators of spatial association (LISA)cluster diagram for 2008, 2014, and 2020 at a 10% significance level. Figure 7 shows that the High–High (H–H) aggregation areas are mainly distributed in Hunan, Anhui, and Jiangxi, showing nodule distribution characteristics. However, the number of the H–H aggregation areas was decreased from 17 in 2008 to 12 in 2020. The Low–Low (L–L) aggregation areas are mainly distributed in the eastern prefecture-level cities of Jiangsu and the western prefecture-level cities of Anhui, and the number of L–L aggregation areas also decreased from 13 in 2008 to 9 in 2020. The number of Low–High (L–H) aggregation areas and High–Low (H–L) aggregation areas both decreased from four in 2008 to one in 2020.
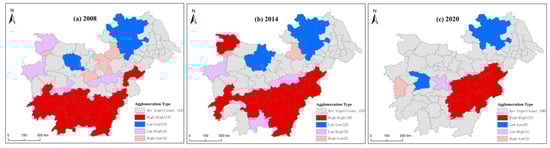
Figure 7.
LISA cluster diagram of coupling coordination degree between WLRM and CLUE.
Overall, WLRM and CLUE in the study area have formed H–H and L–L aggregation areas, the aggregation gradually weakens with the change of time, and the spatial differences between provinces and cities gradually increase. This finding may be attributed to the different levels of rapid economic development of the provinces, and the remarkable differences in the farmers’ planting technology, cultivated land input, and output in different provinces. Moreover, the enthusiasm for exchanges and cooperation among provinces has decreased, resulting in different agricultural policies in different regions, thereby increasing the differences among regions.
5. Discussion
5.1. Analysis of the Results
The research results indicate that the coupling coordination degree of WLRM and CLUE in the study area is at the primary coordination level and has a positive spatial autocorrelation. However, with the growth years, it changes from a strong correlation to a weak correlation, and the agglomeration gradually decreases, indicating that the regional differences among provinces and cities gradually expand. On the one hand, a spatial–temporal mismatch of water and soil resources is exhibited in China [12], which to some extent exacerbates the substitution benefits of pesticides and chemical fertilizers and causes certain ecological problems. On the other hand, as industrialization and urbanization developed faster, increasingly frequent human activities affect the sustainable development of resources, leading to the rough use of land resources and causing a series of ecological problems [44]. In 2021, the state promulgated the Opinions of the State Council of the Central Committee of the Communist Party of China on comprehensively promoting rural revitalization and accelerating modernization of agriculture and rural areas, which vigorously promoted the reduction and efficiency of chemical fertilizers and pesticides, strengthened the resource utilization of livestock and poultry feces pollution, and developed and promoted biodegradable agricultural films so as to encourage the growth of green agriculture. On this basis, the ecological problems of the use of cultivated land have been alleviated to some extent, but the unbalanced problem of coupling coordination between WLRM and CLUE still exists and needs to be further addressed.
5.2. Policy Recommendations
These findings and analysis clearly indicate that farmer behavior and policy support are the main reasons affecting the coupling coordination of WLRM and CLUE in the study area. Therefore, the following policy recommendations are made in this study.
- (1)
- The available amount of agricultural water resources should be guaranteed, and the WLRM in each region should be optimized. Local governments should first focus on the protection of regional water resources to avoid the ecological environment from being harmed by the over-exploitation of groundwater. Second, the construction of water conservancy facilities must be increased, water-saving irrigation technology must be enhanced, regional water storage capacity and water resource utilization efficiency must be improved, and the impact of weather changes (such as precipitation and drought) on the total amount of water resources must be overcome. Moreover, the capital investment in water pollution control must be increased to increase the number of agricultural water resources available, and the WLRM must be optimized. Farmers should also enhance their awareness of the rational use of resources and improve the efficiency of water and land use;
- (2)
- The amount of pesticide and chemical fertilizer inputs should be controlled, and CLUE should be improved. The use of policy tools should be strengthened, the propaganda of sustainable development mechanism of cultivated land should be increased, and the cultivation technology of cultivated land should be improved while focusing on ecological environmental protection and matching of regional water and land resources. Meanwhile, chemical fertilizer and pesticide inputs should be reduced, the reduction of pesticide and chemical fertilizer should be truly realized to increase efficiency, carbon emission should be controlled, environmental pollution ought to be reduced, and the ecological utilization of cultivated land must be effectively improved;
- (3)
- The coordinated development of WLRM and CLUE should be strengthened, and the overall regional coordination should be enhanced. At present, 18.31% of the coupling coordination degree of WLRM and CLUE in the study area is still at the stage of disorder, indicating that the WLRM system has not yet reached the optimal level. The regions should realize the rational allocation of industrial water, domestic water, and agricultural water, ensure the proportion of agricultural water, and focus on the coordinated development of WLRM, cultivated land utilization, and ecological protection to guarantee grain production and ecological security;
- (4)
- Overall development should be coordinated, and local cooperation should be strengthened. The H–H aggregation areas should play an exemplary leading role and actively share advanced ecological protection and cultivated land planting technologies with other regions, driving the transformation of the L–L aggregation areas to the H–H aggregation areas, in order to improve CLUE and the regional ecological environment, and promoting the coordinated development of WLRM and CLUE.
5.3. Research Shortcomings and Outlook
In this study, the spatial–temporal evolution characteristics of the coupling coordination degree of WLRM and CLUE in the major grain-producing areas in the middle and lower reaches of the Yangtze River were explored using the coupling coordination degree model, but the following shortcomings still exist:
- (1)
- The unexpected output in the CLUE index only considers carbon emissions due to the difficulty in determining some data and correlation coefficients of surface source pollution. Subsequent studies can add the surface source pollution index as the unexpected output index to quantify the CLUE further;
- (2)
- This study focuses on the spatial–temporal evolution characteristics of the coupling coordination degree of WLRM and CLUE. At a later stage, the influencing factors, driving mechanisms, and spillover effects of the coupling and coordinated development of the two systems can be analyzed and explored to broaden the research content further;
- (3)
- This study considers the major grain-producing areas in the middle and lower reaches of the Yangtze River as the research object, and the subsequent study can compare the study area with other regions horizontally and vertically to provide a reference for the coupling and coordinated development of WLRM and CLUE in other regions.
6. Conclusions
Based on the panel data from 71 prefecture-level cities in the major grain-producing areas in the middle and lower reaches of the Yangtze River from 2008 to 2020 and by measuring WLRM and CLUE and analyzing the spatial–temporal evolution characteristics of their coupling coordination, this study draws the following four major conclusions:
- (1)
- In terms of WLRM, the overall matching degree of the study area is at the medium matching degree level and shows a more evident development trend of inter-provincial differentiation, with Jiangxi and Hunan provinces outperforming other provinces. Local governments should pay attention to the protection of regional water and land resources, increase the financial investment in water pollution control, and improve the degree of regional WLRM;
- (2)
- In terms of CLUE, the average value of CLUE in the study area is at the medium efficiency level, but remarkable regional differences are still found, among which Jiangsu is considerably higher than the other provinces. Controlling the amount of pesticide and chemical fertilizer input use and focusing on matching water and land resources with ecological environmental protection are the keys to improving CLUE;
- (3)
- With regard to the degree of coupling coordination and the pattern of spatial association of the two systems, the regional coupling coordination degree is at the primary coordination level, but a weakening of aggregation in the H–H and L–L aggregation areas is still observed, and the gap between provinces and cities is gradually widening. Strengthening the cooperation of the neighboring regions, playing the leading role of H–H aggregation areas, and reducing the number of L–L aggregation areas are important measures to promote the coordinated development of regional WLRM and CLUE.
Author Contributions
Z.F. and Q.L. collected and analyzed the data and wrote most of the manuscript; H.Y. provided the research direction and conception for the research; J.L. and W.X. provided advice and check the manuscript; All authors have read and agreed to the published version of the manuscript.
Funding
This research was funded by the Special Project for Type-A Strategic and Leading Technologies under the CAS: No. XDA20020302; The National Natural Science Foundation of China: 41701164.
Data Availability Statement
The data presented in this study are available on request from the first author.
Conflicts of Interest
The authors declare no conflict of interest.
References
- Zou, J.L.; Wu, Q. Spatial Analysis of Chinese Grain Production for Sustainable Land Management in Plain, Hill, and Mountain Counties. Sustainability 2017, 9, 348. [Google Scholar] [CrossRef]
- Zhu, L.J.; Bai, Y.P.; Zhang, L.J.; Si, W.Y.; Wang, A.N.; Weng, C.Y.; Shu, J.Y. Water–Land–Food Nexus for Sustainable Agricultural Development in Main Grain-Producing Areas of North China Plain. Foods 2023, 12, 712. [Google Scholar] [CrossRef]
- Liu, L. Grasp the construction of national food security strategy under the new situation. Financial News, 27 January 2014; 9. [Google Scholar]
- He, K.; Song, H.Y. China’s food security under the constraints of resources and environment: Connotation, challenges and policy orientation. J. Nanjing Agric. Univ. (Soc. Sci. Ed.) 2021, 21, 45–57. [Google Scholar]
- Yang, G.Y.; Li, S.Y.; Wang, H.; Wang, L. Study on agricultural cultivation development layout based on the matching characteristic of water and land resources in North China Plain. Agric. Water Manag. 2022, 259, 107272. [Google Scholar] [CrossRef]
- Zhao, R.Q.; Liu, Y.; Tian, M.M.; Ding, M.L.; Cao, L.H.; Zhang, Z.P.; Chuai, X.W.; Xiao, L.G.; Yao, L.G. Impacts of water and land resources exploitation on agricultural carbon emissions: The water-land-energy-carbon nexus. Land Use Policy 2018, 72, 480–492. [Google Scholar] [CrossRef]
- Geng, Q.L.; Liu, H.L.; He, X.H.; Tian, Z.H. Integrating Blue and Green Water to Identify Matching Characteristics of Agricultural Water and Land Resources in China. Water 2022, 14, 685. [Google Scholar] [CrossRef]
- Liu, D.; Liu, C.L.; Fu, Q.; Li, M.; Faiz, M.A.; Khan, M.I.; Li, T.X.; Cui, S. Construction and application of a refined index for measuring the regional matching characteristics between water and land resources. Ecol. Indic. 2018, 91, 203–211. [Google Scholar] [CrossRef]
- Du, J.; Yang, Z.H.; Wang, H.; Yang, G.Y.; Li, S.Y. Spatial–temporal matching characteristics between agricultural water and land resources in Ningxia, Northwest China. Water 2019, 11, 1460. [Google Scholar] [CrossRef]
- Shi, L.Z.; Zhou, Y.C.; Cui, L.J. Liaoning province agricultural water and soil resources matching analysis. Adv. Mater. Res. 2015, 1073, 1706–1709. [Google Scholar] [CrossRef]
- Zhou, Y.J.; Li, W.F.; Li, H.H.; Wang, Z.; Zhang, B.; Zhong, K.Y. Impact of water and land resources matching on agricultural sustainable economic growth: Empirical analysis with spatial spillover effects from Yellow River Basin, China. Sustainability 2022, 14, 2742. [Google Scholar] [CrossRef]
- Liu, Y.S.; Gan, H.; Zhang, F.G. Analysis of the matching patterns of land and water resources in Northeast China. Acta Geographica Sinica. 2006, 61, 854. [Google Scholar]
- Gao, Y.; Li, P.; Hou, H.Y.; Liang, Z.J.; Zhang, Y.; Qi, X.B. Evaluation of agricultural water and soil resource matching characteristics considering increased precipitation-derived “green water”: A case study in the Yellow River Basin, China. Mitig. Adapt. Strateg. Glob. Chang. 2023, 28, 6. [Google Scholar] [CrossRef]
- Zhao, D.; Chen, X.W.; Han, Y.L.; Zhao, Y.K.; Men, X.L. Study on the matching method of agricultural water and land resources from the perspective of total water footprint. Water 2022, 14, 1120. [Google Scholar] [CrossRef]
- Cao, W.; Zhou, W.; Wu, T.; Wang, X.C.; Xu, J.H. Spatial-temporal characteristics of cultivated land use eco-efficiency under carbon constraints and its relationship with landscape pattern dynamics. Ecol. Indic. 2022, 141, 109140. [Google Scholar] [CrossRef]
- Fan, Z.G.; Deng, C.; Fan, Y.Q.; Zhang, P.W.; Lu, H. Spatial-temporal pattern and evolution trend of the cultivated land use eco-efficiency in the National Pilot Zone for ecological conservation in China. Int. J. Environ. Res. Public Health 2022, 19, 111. [Google Scholar] [CrossRef]
- Yang, B.; Wang, Z.Q.; Zou, L.; Zou, L.L.; Zhang, H.W. Exploring the eco-efficiency of cultivated land utilization and its influencing factors in China’s Yangtze River Economic Belt, 2001–2018. J. Environ. Manag. 2021, 294, 112939. [Google Scholar] [CrossRef]
- Zou, X.Q.; Xie, M.H.; Li, Z.Y.; Duan, K.F. Spatial Spillover Effect of Rural Labor Transfer on the Eco-Efficiency of Cultivated Land Use: Evidence from China. Int. J. Environ. Res. Public Health 2022, 19, 9660. [Google Scholar] [CrossRef]
- Hou, X.H.; Liu, J.M.; Zhang, D.J.; Zhao, M.J.; Xia, C.Y. Impact of urbanization on the eco-efficiency of cultivated land utilization: A case study on the Yangtze River Economic Belt, China. J. Clean. Prod. 2019, 238, 117916. [Google Scholar] [CrossRef]
- Yin, Y.Q.; Hou, X.H.; Liu, J.M.; Zhou, X.; Zhang, D.J. Detection and attribution of changes in cultivated land use ecological efficiency: A case study on Yangtze River Economic Belt, China. Ecol. Indic. 2022, 137, 108753. [Google Scholar] [CrossRef]
- Zhao, Z.; Bai, Y.P.; Wang, G.F.; Chen, J.C.; Yu, J.L.; Liu, W. Land eco-efficiency for new-type urbanization in the Beijing-Tianjin-Hebei Region. Technol. Forecast. Soc. Chang. 2018, 137, 19–26. [Google Scholar] [CrossRef]
- Xiao, P.N.; Xu, J.; Yu, Z.P.; Qian, P.; Lu, M.Y.; Ma, C. Spatiotemporal Pattern Differentiation and Influencing Factors of Cultivated Land Use Efficiency in Hubei Province under Carbon Emission Constraints. Sustainability 2022, 14, 7042. [Google Scholar] [CrossRef]
- Liu, M.B.; Zhang, A.L.; Wen, G.H. Regional differences and spatial convergence in the ecological efficiency of cultivated land use in the main grain producing areas in the Yangtze Region. J. Nat. Resour. 2022, 37, 477–493. [Google Scholar] [CrossRef]
- Wu, Y.L.; Zhang, P.; Li, J.; Hou, J. Spatial Distribution Evolution and Optimization Path of Eco-Efficiency of Cultivated Land Use: A Case Study of Hubei Province, China. Sustainability 2022, 14, 11417. [Google Scholar] [CrossRef]
- Zhu, L.J.; Lu, Q.Y. The use efficiency of cultivated land and irrigation water and the spatial correlation analysis of its coupling coordination in China. J. China Agric. Univ. 2022, 27, 297–308. [Google Scholar]
- Li, W.J.; Xu, W.Q.; Bao, A.M.; Lü, Y. Analysis of cultivated land change and water-land matching characteristics in Amu Darya River Basin. Water Resour. Prot. 2021, 37, 80–86. [Google Scholar]
- Shen, W.T.; Hu, Q.G.; Li, J.L.; Chen, Q. Spatio-temporal evolution and spatial interaction of regional eco-efficiency in China. J. Nat. Resour. 2020, 35, 2149–2162. [Google Scholar] [CrossRef]
- Post, W.M.; Kwon, K.C. Soil carbon sequestration and land-use change: Processes and potential. Glob. Chang. Biol. 2000, 6, 317–327. [Google Scholar] [CrossRef]
- West, T.O.; Marland, G. A synthesis of carbon sequestration, carbon emissions, and net carbon flux in agriculture: Comparing tillage practices in the United States. Agric. Ecosyst. Environ. 2002, 91, 217–232. [Google Scholar] [CrossRef]
- Dubey, A.; Lal, R. Carbon footprint and sustainability of agricultural production systems in Punjab, India, and Ohio, USA. J. Crop Improv. 2009, 23, 332–350. [Google Scholar] [CrossRef]
- Tone, K. Slacks-based measure of efficiency. Handb. Data Envel. Anal. 2011, 164, 195–209. [Google Scholar]
- Zheng, J.H.; Liu, X.X.; Bigsten, A. Ownership structure and determinants of technical efficiency: An application of data envelopment analysis to Chinese enterprises (1986–1990). J. Comp. Econ. 1998, 26, 465–484. [Google Scholar] [CrossRef]
- Mann, H.B. Nonparametric tests against trend. Econom. J. Econom. Soc. 1945, 13, 245–259. [Google Scholar] [CrossRef]
- Achite, M.; Caloiero, T.; Toubal, A.K. Rainfall and runoff trend analysis in the Wadi Mina Basin (Northern Algeria) using non-parametric tests and the ITA method. Sustainability 2022, 14, 9892. [Google Scholar] [CrossRef]
- Li, R.R.; Ding, Z.Y.; An, Y. Examination and Forecast of Relationship among Tourism, Environment, and Economy: A Case Study in Shandong Province, China. Int. J. Environ. Res. Public Health 2022, 19, 2581. [Google Scholar] [CrossRef] [PubMed]
- Hu, Y.C.; Liu, Y.; Yan, Z.Y. Research Regarding the Coupling and Coordination Relationship between New Urbanization and Ecosystem Services in Nanchang. Sustainability 2022, 14, 15041. [Google Scholar] [CrossRef]
- Lu, X.H.; Cui, H.Y.; Ke, S.J.; Kuang, B. Coupling Coordination and Driving Mechanism of Green Transition of Farmland Use and Total Factor Productivity of Grain in Hubei Province. China Land Sci. 2022, 36, 75–84. [Google Scholar]
- Guo, H.P.; Yi, X.; Pan, C.L.; Yang, B.M.; Li, Y. Analysis on the temporal and spatial features of the coupling and coordination of industrialization and agricultural green development in China during 1990–2019. Int. J. Environ. Res. Public Health 2021, 18, 8320. [Google Scholar] [CrossRef]
- Yuan, J.F.; Bian, Z.F.; Yan, Q.W.; Pan, Y.Q. Spatio-temporal distributions of the land use efficiency coupling coordination degree in mining cities of western China. Sustainability 2019, 11, 5288. [Google Scholar] [CrossRef]
- Li, M.; Cao, X.X.; Liu, D.; Fu, Q.; Li, T.X.; Shang, R.C. Sustainable management of agricultural water and land resources under changing climate and socio-economic conditions: A multi-dimensional optimization approach. Agric. Water Manag. 2022, 259, 107235. [Google Scholar] [CrossRef]
- Sun, C.Z.; Jiang, K.; Zhao, L.S. Measurement of green efficiency of water utilization and its spatial pattern in China. J. Nat. Resour. 2017, 32, 1999–2011. [Google Scholar]
- Tu, Z.G. The coordination of industrial growth with environment and resource. Econ. Res. J. 2008, 2, 431–445. [Google Scholar]
- Zhang, L.X.; Zhu, D.L.; Xie, B.P.; Du, T.; Wang, X. Spatiotemporal pattern evolvement and driving factors of cultivated land utilization efficiency of the major grain producing area in China. Resour. Sci. 2017, 39, 608–619. [Google Scholar]
- Chen, H.J.; Yang, Q.Y.; Peng, L.X.; Su, K.C.; Zhang, H.Z.; Liu, X.Y. Spatiotemporal evolution characteristics and scenario simulation of production-living-ecoloaical space at county leve in Three Gorges reservoir areas. Trans. Chin. Soc. Agric. Eng. 2022, 38, 285–294. [Google Scholar]


Disclaimer/Publisher’s Note: The statements, opinions and data contained in all publications are solely those of the individual author(s) and contributor(s) and not of MDPI and/or the editor(s). MDPI and/or the editor(s) disclaim responsibility for any injury to people or property resulting from any ideas, methods, instructions or products referred to in the content. |
© 2023 by the authors. Licensee MDPI, Basel, Switzerland. This article is an open access article distributed under the terms and conditions of the Creative Commons Attribution (CC BY) license (https://creativecommons.org/licenses/by/4.0/).