Article

Disentangling the Complexity of Regional Ecosystem Degradation: Uncovering the Interconnected Natural-Social Drivers of Quantity and Quality Loss

1
College of Horticulture & Forestry Sciences, Huazhong Agricultural University, Wuhan 430070, China
2
Research Center for Territorial Spatial Governance and Green Development, Huazhong Agricultural University, Wuhan 430070, China
*
Author to whom correspondence should be addressed.
Land 2023, 12(7), 1280; https://doi.org/10.3390/land12071280
Submission received: 28 May 2023 / Revised: 19 June 2023 / Accepted: 21 June 2023 / Published: 23 June 2023

Abstract

:
In the face of the combined effects of economic development and climate change, ecosystems are experiencing unprecedented pressures. It is imperative to diagnose changes in the quantity and quality of ecosystems, as well as identify the integrated natural and social driving mechanisms that underlie these changes, in order to facilitate ecosystem restoration and maintenance. In this study, we analyzed the changes in forest, grassland, farmland, and water ecosystems in Hubei Province, China from 2000 to 2020. We examined the changes in ecosystem quantity by assessing their area, and for evaluating ecosystem quality, we utilized an ecosystem quality index (EQI). To further understand the integrated natural–social driving mechanisms behind the degradation of different types of ecosystems, we selected four natural factors and fifteen socio-economic factors, based on the influences of climate change and human activities. We employed stepwise regression models for analysis. Our study reveals significant degradation of farmland and grassland ecosystems in Hubei Province from 2000 to 2020, reducing by 5.16% and 82.46%, respectively. The water ecosystems have slightly decreased by 1.08%, while and the forest ecosystems has increased by 2.64%. The analysis further highlights that the total area of ecosystem quality degradation in Hubei Province reached 5.34%. Additionally, our findings indicate that human activities have a greater impact on the quantitative degradation of ecosystems, while climate change has a greater impact on the quality degradation of ecosystems. Specifically, the forestry output value has a significant negative impact on the area of farmland and grassland ecosystems, while rural per capita net income and fishery output value have a significant negative impact on water area. Annual precipitation and annual average temperature have a significant positive effect on the quality of ecosystems in the good-quality level, while ecosystems in the low-quality level are mainly influenced by annual evaporation. Our results provide valuable insights for policymakers seeking to restore and manage ecosystems effectively in order to promote regional sustainable development.

1. Introduction

Over the past half-century, the global economy and population have experienced substantial growth, leading to a more than 200% increase in the amount of biomaterials extracted from nature by humans [1]. As a result of intense human activities, and the increasingly severe impact of climate change, ecosystems have undergone significant alterations. For example, from 2000 to 2016, the global loss of mangroves amounted to 3363 km2, with 62% attributable to anthropogenic causes and 38% to natural factors [2]. According to the comprehensive report of the IPCC Sixth Assessment Report [3], global climate change has exerted additional pressures on land, exacerbating existing risks related to livelihoods, biodiversity, human and ecosystem health, infrastructure, and food systems. For instance, in arid regions, climate change and desertification are expected to result in decreased crop and livestock productivity, altered plant species composition, and reduced biodiversity [4]. The degradation of such ecosystems has attracted significant attention from countries and societies worldwide [5]. The IPCC (2023) [3] predicts that, by 2050, in a 1.5 °C global warming scenario, the population in drought-prone areas vulnerable to water resource stress, drought intensity, and habitat degradation is projected to reach 178 million people, increasing to 220 million people at 2 °C warming, and 277 million people at 3 °C warming. The survival of humans and other life on Earth may be at unprecedented risk, making ecosystem restoration an urgent priority. The diagnosis and rehabilitation of damaged and degraded ecosystems have become critical priorities in global initiatives.
The health of ecosystems determines their ability and quality to provide services [6]. Ecosystem services refer to the various material and non-material benefits provided by natural ecosystems to human society, such as water supply, climate regulation, soil conservation, food production, and natural landscapes [7]. When the quality of ecosystems degrades, the services they provide are also affected [8]. For example, when the quality of aquatic ecosystems declines, the supply of water may be contaminated and reduced, leading to decreased reliability and availability of water resources [9]. Similarly, when the quality of forest ecosystems declines, the services they provide, such as climate regulation, soil conservation, and biodiversity preservation, also diminish [10]. Therefore, understanding the direct impact of ecosystem quality degradation on the supply of ecosystem services is crucial. Numerous studies have focused on the diagnosis of ecosystem quantitative degradation. For example, Matricardit et al. [11] employed remote sensing data analysis to determine that the degraded area of forest ecosystems in the Brazilian Amazon between 1992 and 2014 amounted to 337,427 km2. Lang et al. [12] investigated ecosystem dynamics and reported that the loss of wetland area in Dongting Lake from 1995 to 2020 was 294.94 km2. However, most of these studies primarily concentrated on changes in the transformation and area of different ecosystem types, with few investigations into the diagnosis of ecosystem quality degradation. Recent research has started to focus on this topic. Xu et al. [13] utilized the relative biomass density approach to diagnose the ecosystem quality of forests, scrubs, and grasslands in the Beijing–Tianjin–Hebei region, and found that the grassland ecosystem had the highest quality, followed by forests and shrubs. Nevertheless, knowledge of ecosystem quality degradation and its impact on ecosystem services remains limited, due to the absence of a universally accepted assessment method for ecosystem quality. In general, comprehensive diagnostic research that integrates both ecosystem quantity and quality remain poorly understood.
The impact of climate change and human activities on ecosystem degradation has been widely documented in the literature [14,15,16]. Climate change has been shown to alter the hydrological processes of ecosystems by changing the precipitation-to-evaporation ratio [17]. Research has shown that, in highland areas, warmer temperatures can extend the growing season and increase vegetation productivity [18]. However, rising temperatures will accelerate permafrost thawing, resulting in the degradation of highland marshes and meadows [19], as well as increasing soil dryness in arid areas, thereby adversely affecting vegetation [20]. Changes in precipitation patterns can also impact ecosystems. In arid areas, rainfall had a positive effect on vegetation growth [21]. Conversely, in humid regions with abundant water, excessive precipitation can lead to lower temperatures and solar radiation, which can hinder vegetation growth [22]. Extreme rainfall and drought events can also exacerbate ecosystem degradation. It is apparent that climate change impacts on ecosystems vary across different regions.
The impacts of human activities on ecosystems are primarily manifested in urban expansion [23,24], deforestation [11,25], overgrazing [26], and industrial development [27,28]. For example, Prăvălie et al. [29] found that population growth accelerated agricultural expansion and sacrificed a large amounts of forest land, which has affected the entire ecosystem. During the period from 2001 to 2010, 21,178.8 km2 of forest ecosystems in Myanmar degraded due to human deforestation [30].
In recent years, research has shown that ecosystem degradation is primarily driven by the combined effects of climate change and human activities. For example, Shi et al. [31] found that 28.11% of vegetation degradation on the Loess Plateau was caused by climate change, while 72.89% was caused by human activities. Similarly, Yi et al. [32] found that vegetation degradation in the Yangtze River Basin was influenced by both natural and anthropogenic factors, with human activities contributing 79.29% and climate change contributing 20.71% to vegetation degradation. This knowledge is critical for the restoration and sustainable development of local ecosystems. However, most studies to date have only examined a limited number of natural and socio-economic factors, and our understanding of the integrated nature–social drivers of ecosystem degradation remains limited. Additionally, due to significant differences in socio-economic factors across regions, the mechanisms by which socio-economic factors affect ecosystem degradation may differ in different areas. As regional socio-economic differentiation continues to evolve, integrated analyses of natural and social factors driving ecosystem degradation can help diagnose the health status and evolutionary mechanisms of regional ecosystems objectively, and provide a reference for regional ecosystem restoration and management decisions.
Over the past three decades, rapid urbanization and industrialization in China have caused severe damage to the ecosystem. A considerable number of studies have focused on ecosystem degradation in important ecological functional areas [15,33] and ecologically fragile areas [16,34] in China, revealing the status of ecosystem degradation and its driving mechanisms. For example, Wang et al. [35] found that rapid urbanization in the middle and lower reaches of the Yangtze River Basin led to forest degradation. However, at the provincial scale, there are significant spatial variations in natural conditions, ecosystem characteristics, socio-economic disparities, and management levels, leading to exceptionally complex driving mechanisms of ecosystem degradation [36]. These factors include both the macroscopic impacts of climate change and a wide range of intricate human activities, with complex interactions among different driving factors [37]. As a result, our understanding of the relative contributions and interactions of these factors to ecosystem degradation at the provincial scale remains limited. Additionally, the lack of unified datasets and standardized assessment methods further restricts our comprehensive understanding of provincial-scale ecosystem degradation [38,39].
In recent years, Hubei Province, located in central China, has witnessed significant soil erosion due to climate change and excessive socio-economic activities [40]. This has endangered or caused the extinction of important species such as the Yangtze River white sturgeon and crucian [41,42]. Understanding the integrated nature–social driving mechanism of ecosystem degradation in Hubei Province not only provides a necessary scientific basis for restoring the ecosystem from its source but also encourages more local stakeholders to participate in ecological restoration.
The purpose of this study is to understand the dynamics of ecosystem degradation, in terms of quantity and quality, at a regional scale, as well as the integrated nature–social driving mechanisms, in order to guide local ecosystem restoration efforts. Hubei province, China was chosen as the research area, with two specific objectives: (1) to assess the degree and spatial distribution of ecosystem degradation in terms of quality and quantity in Hubei province; and (2) to investigate the nature–social driving mechanism behind ecosystem degradation in terms of quantity and quality.

2. Materials and Methods

2.1. Study Area

Hubei Province covers an area of 185,900 km2. With a population of 59 million and a developed economy, the province had a GDP (Gross Domestic Product) of 43,443.46 billion yuan in 2020. The province has a subtropical monsoon climate, with an average temperature of 15~17 °C, and an average annual precipitation of 800~1600 mm (Figure 1). There are abundant ecosystem types in the area, including forest, agricultural, and water ecosystems, which, respectively, account for 48.68%, 43.84%, and 4% of the total area of the province. Over the past two decades, the farmland ecosystem in Hubei Province has shown a rapid trend of degradation, and water environment problems are becoming increasingly prominent [43], with significant shrinkage of lakes and wetlands in the Jianghan Plain and a decline in aquatic biodiversity [44]. These ecological challenges highlight the urgency of conducting a comprehensive assessment of the mechanisms driving ecosystem degradation to ensure the ecological security of Hubei Province.

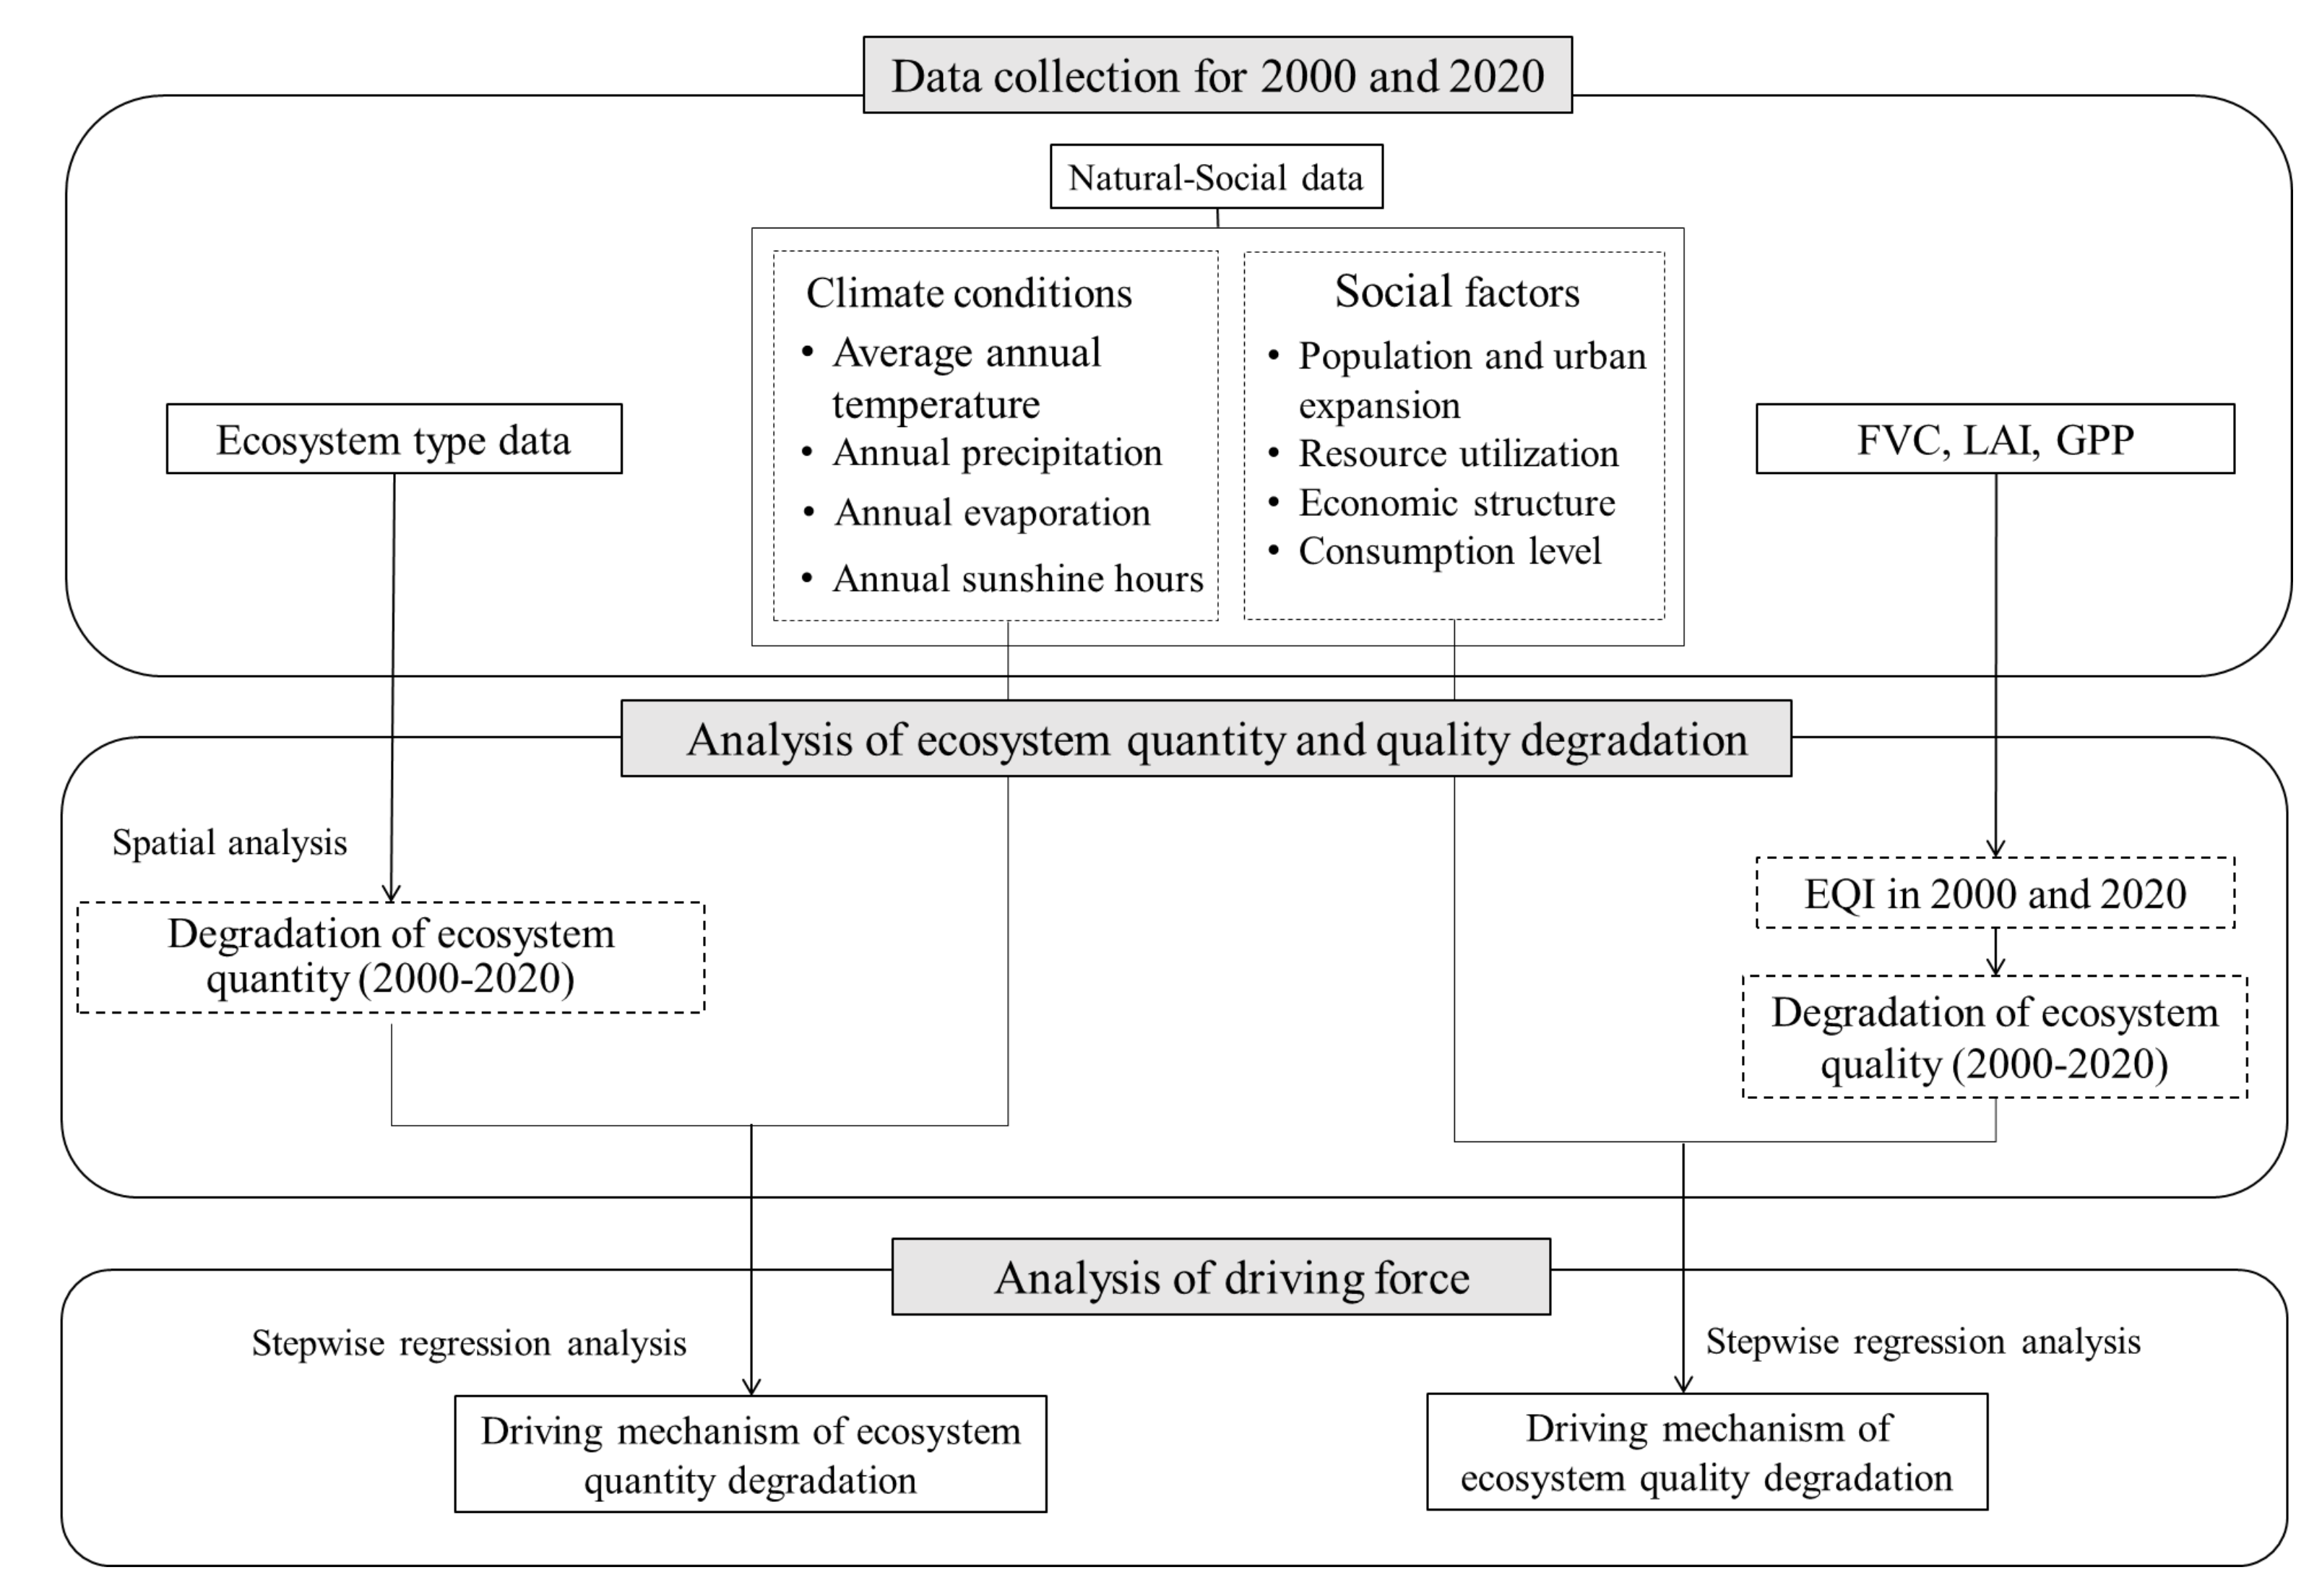
2.2. Research Framework

To systematically assess ecosystem degradation in Hubei Province, we analyzed changes in the quantity and quality of forest, wetland, grassland, and farmland ecosystems from 2000 to 2020. It is important to note that the forest ecosystem assessed in our study refers to ecosystems containing trees, shrubs, bamboo, etc., including both natural forests and planted forests. We chose 2000 to 2020 as the study period primarily because, based on our understanding, there have been noticeable ecosystem degradation changes in Hubei Province between 2000 and 2020, mainly due to rapid urbanization. Additionally, the 20-year interval from 2000 to 2020 provides a longer observation period, which helps capture trends and patterns in ecosystem changes. Moreover, data availability was also an important consideration. Data for the years 2000 to 2020 were more easily accessible in the study area, particularly regarding ecosystem quantity and quality indicators.
Firstly, we collected spatial distribution data of forest, wetland, grassland, and farmland ecosystems in Hubei Province in the years 2000 and 2020, along with data on fractional vegetation cover (FVC), leaf area index (LAI), and gross primary productivity (GPP). We analyzed changes in the quantity of ecosystems by examining changes in their area. This approach allows us to obtain visual information on the degradation of ecosystems, such as wetland filling and deforestation. For evaluating changes in ecosystem quality, we employed an ecosystem quality index (EQI) based on FVC, LAI, and GPP. FVC represents the proportion of surface covered by vegetation and reflects its distribution and density [45]. High FVC is usually associated with healthy and dense vegetation, while low FVC may indicate vegetation degradation or land damage. LAI measures the total leaf area of plants per unit surface area [46]. It serves as an indicator of leaf expansion and density. A higher LAI often indicates more leaves and denser vegetation, indicating better growth conditions and productivity of the ecosystem. Thus, LAI can be used to assess the growth status and quality of the ecosystem. GPP refers to the total energy converted by plants through photosynthesis in an ecosystem [47]. It is a key indicator of ecosystem productivity. Higher GPP indicates higher biomass accumulation and energy conversion efficiency in the ecosystem, which is typically associated with better ecosystem quality. By considering FVC, LAI, and GPP, we can assess the quality of ecosystems from different perspectives. These indicators reflect crucial factors such as vegetation distribution, plant growth status, and ecosystem energy conversion, providing information on ecosystem structure, function, and health. By simultaneously considering changes in ecosystem area and quality index, we can obtain a more comprehensive and accurate assessment of ecosystem degradation.
Based on climate change and human activities, we identified four natural factors and fifteen socio-economic factors to analyze the comprehensive driving mechanisms of ecosystem degradation in the region. By considering the average annual temperature, annual precipitation, annual evaporation, and annual sunshine hours, we can understand the direct and indirect impacts of climate change on ecosystems. Previous studies have also indicated that excessively high or abnormal average temperatures can be one of the driving factors of ecosystem degradation [19]. Decreased annual precipitation or increased variability can lead to phenomena such as drought, soil drying, and vegetation degradation, thus accelerating the process of ecosystem degradation. In water-deficient areas during drought seasons, higher annual evaporation may have a negative impact on water supply to ecosystems and biodiversity [20]. Excessive sunlight is one of the energy sources for photosynthesis in plants, and can have a negative effect on plant growth and ecosystem health [48].
On the other hand, human activities are also major drivers of ecosystem degradation. Population growth, urban expansion, and economic development have direct or indirect impacts on land use, resource utilization, and ecosystem functioning, leading to wetland degradation, river and lake shrinkage, deforestation, grassland degradation, and farmland occupation [27,28]. Specifically, population growth and urban expansion increase the demand for land and resource consumption [24], while economic development and increased consumption levels raise the demand for resources [49]. Unsustainable economic structures and industrial activities can result in ecosystem destruction and pollution [50]. Therefore, in this study, we identified fifteen socio-economic indicators to better understand the socio-economic drivers of ecosystem degradation.
To avoid collinearity among these factors, we used stepwise regression models to analyze their impact on the degradation of both ecosystem quantity and quality (Figure 2).

2.3. Data Collecting and Processing

The datasets of ecosystem types used in this study were obtained from Yang and Huang (2021) [51], which was synthesized from the China Land Use Dataset (CLUD), satellite time series data, and visual images extracted from Google Earth and Google Maps. The dataset includes four ecosystems: forests, grasslands, water bodies, and farmlands, as well as two other land cover types: unused land and impervious surfaces. The data were collected for two periods, 2000 and 2020, with a spatial resolution of 30 m. For the analysis of ecosystem quality, data on FVC and LAI for both periods were obtained from the MOD16A3 product of National Aeronautics and Space Administration (NASA), while GPP was obtained from the Global Land Surface Satellite (GLASS). Temperature data were sourced from the National Environmental Information Center (NCEI) under the National Oceanic and Atmospheric Administration (NOAA) of the United States. Rainfall and sunshine hours were obtained from the National Weather Science Data Center of China Meteorological Data Network (http://data.cma.cn/), and evaporation data were obtained from MOD16A3 of NASA. All data were processed to a uniform spatial resolution of 500 m.
The socio-economic data used in this study for 2000 and 2020 were sourced from the Hubei Provincial Statistical Yearbook. The data was collected from 17 prefecture-level cities in Hubei Province and comprised of 14 indicators, including population, gross national product, agricultural output value, forestry output value, livestock output value, fishery output value, industrial output value, construction output value, total sales of consumer goods, primary industry output value, secondary industry output value, tertiary industry output value, urban per capita disposable income, and rural per capita net income.

2.4. Data Analysis

2.4.1. Diagnosis of Ecosystem Degradation

To diagnose the degradation of ecosystem quantity, we used ArcGIS 10.7 software to analyze the spatial distributions of changes in forest, grassland, water body, and farmland ecosystems in Hubei Province from 2000 to 2020. We then examined the area and proportion of changes in each ecosystem type.
The evaluation of ecosystem quality was carried out in accordance with the Technical Specification for Ecosystem Quality Assessment (HJ-1172-2021) [52], a standard issued by the Chinese government in 2021. This standard employes the ratio of FVC, LAI, and GPP values of each pixel in the study area to their reference values as the relative quality of each ecological parameter. The relative value of a pixel’s ecological parameter to the reference value is an indicator of its ecological quality, with a value closer to 1 indicating better quality. In this study, a common method was employed, which involved selecting the top 10% of FVC, LAI, and GPP values in the study area as reference values for good quality, based on the distribution characteristics of the data. These values represent the optimal state of the ecosystems within the study area, and reflect their robust ecological functioning. The relative densities of these parameters were calculated using Equation (1).
RVI j = F j / F max  
where RVIi is the relative density of ecological parameter i; i refers to FVC, LAI, and GPP, respectively. Fj is the value of ecological parameter i in pixel j, and Fmax is the maximum value of ecological parameter i.
We then calculated the ecosystem quality index (EQI) using the relative density values of these three ecological parameters. Before calculation, the three relative density values were normalized, respectively. The EQI was calculated using Equation (2).
EQI = RVI L A I + RVI F V C + RVI G P P / 3 × 100
where EQI is the ecosystem quality index. RVILAI, RVIFVC, and RVIGPP are the relative density of LAI, FVC, and GPP, respectively.
Based on the standard (HJ-1172-2021), the results of calculated EQI were classified into five levels: excellent (EQI ≥ 75), good (55 ≤ EQI ≤ 75), medium (35 ≤ EQI ≤ 55), low (20 ≤ EQI ≤ 35), and poor (EQI < 20). The adoption of five levels is aimed at comprehensively evaluating and describing the differences in various levels of ecosystem quality. By dividing the EQI results into more levels, it provides more detailed information and helps to accurately differentiate the degree of ecosystem degradation. Such classification provides a basis for decision-makers to prioritize actions and allocate resources. It facilitates the identification of regions that require targeted interventions, protection efforts, or restoration measures. Subsequently, we used the ArcGIS spatial analysis tool to analyze the changes in ecosystem quality levels from 2000 to 2020. The improvements in ecosystem quality level by one, two, and three levels were defined as slight improvement, improvement, and significant improvement, respectively. The decrease in ecosystem quality levels by one, two, and three levels were defined as slight degradation, degradation, and significant degradation, respectively. The area of ecosystem quality changes for different levels was calculated.

2.4.2. Analysis of Natural-Social Driving Mechanism

We utilized stepwise regression models to analyze the natural–social driving mechanisms behind different types of ecosystem degradation. In this study, we selected four factors representing climate characteristics and fifteen factors representing human activities as potential drivers of ecosystem degradation, and their changes from 2000 to 2020 were used as dependent variables in the stepwise regression model (Table 1).
As mentioned earlier, in Section 2.2, several factors, such as annual average temperature, annual precipitation, annual evaporation, and annual sunshine hours, provide valuable insights into the direct and indirect impacts of climate change on ecosystems. Temperature is one of the key factors influencing the development and functioning of ecosystems, and excessively high or abnormal average temperatures can be a driving factor for ecosystem degradation [19]. Precipitation serves as an important water supply source within ecosystems. Changes in annual precipitation can directly affect soil moisture, plant growth, and ecosystem stability [21,22]. Evaporation is the process of water transfer from soil and vegetation to the atmosphere. An increase in annual evaporation may indicate an increase in water loss, leading to soil drying, reduction in vegetation, and ecosystem degradation [53]. Additionally, sunshine is one of the energy sources for photosynthesis in plants, and plays a significant role in plant growth and ecosystem health. Variations in these factors can directly or indirectly impact the water supply, vegetation growth, and ecological balance of ecosystems, thereby influencing the health and stability of ecosystems. Considering these factors when assessing ecosystem degradation can help us gain a more comprehensive understanding of the natural drivers behind ecosystem degradation.
Research has indicated that human activities, such as population growth, urbanization, resource utilization, and economic activities, can have a negative impact on the health and stability of ecosystems [24,28], thus serving as social drivers of ecosystem degradation. The increase in population size can exert pressure on ecosystems by amplifying resource demands, land development, and pollution pressures [29]. The expansion of impervious surfaces, resulting from urbanization and industrialization, can disrupt the hydrological cycle of land, increasing the risk of flooding and water resource loss [54]. The escalation of economic activities often accompanies resource exploitation, energy consumption, and environmental pollution, which can have detrimental effects on ecosystems [27]. Moreover, different industries exhibit varying levels of resource utilization and environmental impact. For instance, the primary sector, such as agriculture and forestry, may involve land clearance and fertilizer usage [55], while the secondary sector, including manufacturing and construction, may entail energy consumption and waste emissions [56]. Additionally, high levels of consumption can lead to excessive resource depletion and waste generation, further pressuring ecosystems [57]. The changes in the quantity and quality of forest, grassland, water body and farmland ecosystems were inputted as independent variables in the stepwise regression model. The stepwise regression models were run in SPSS 26.0. The variance inflation factor (VIF) was used to assess multicollinearity in regression analysis. A high VIF value indicates a strong correlation between a predictor variable and the other variables, suggesting the presence of multicollinearity [58]. Generally, a VIF value greater than 5 or 10 is considered high, and indicates a problematic level of multicollinearity.

3. Results

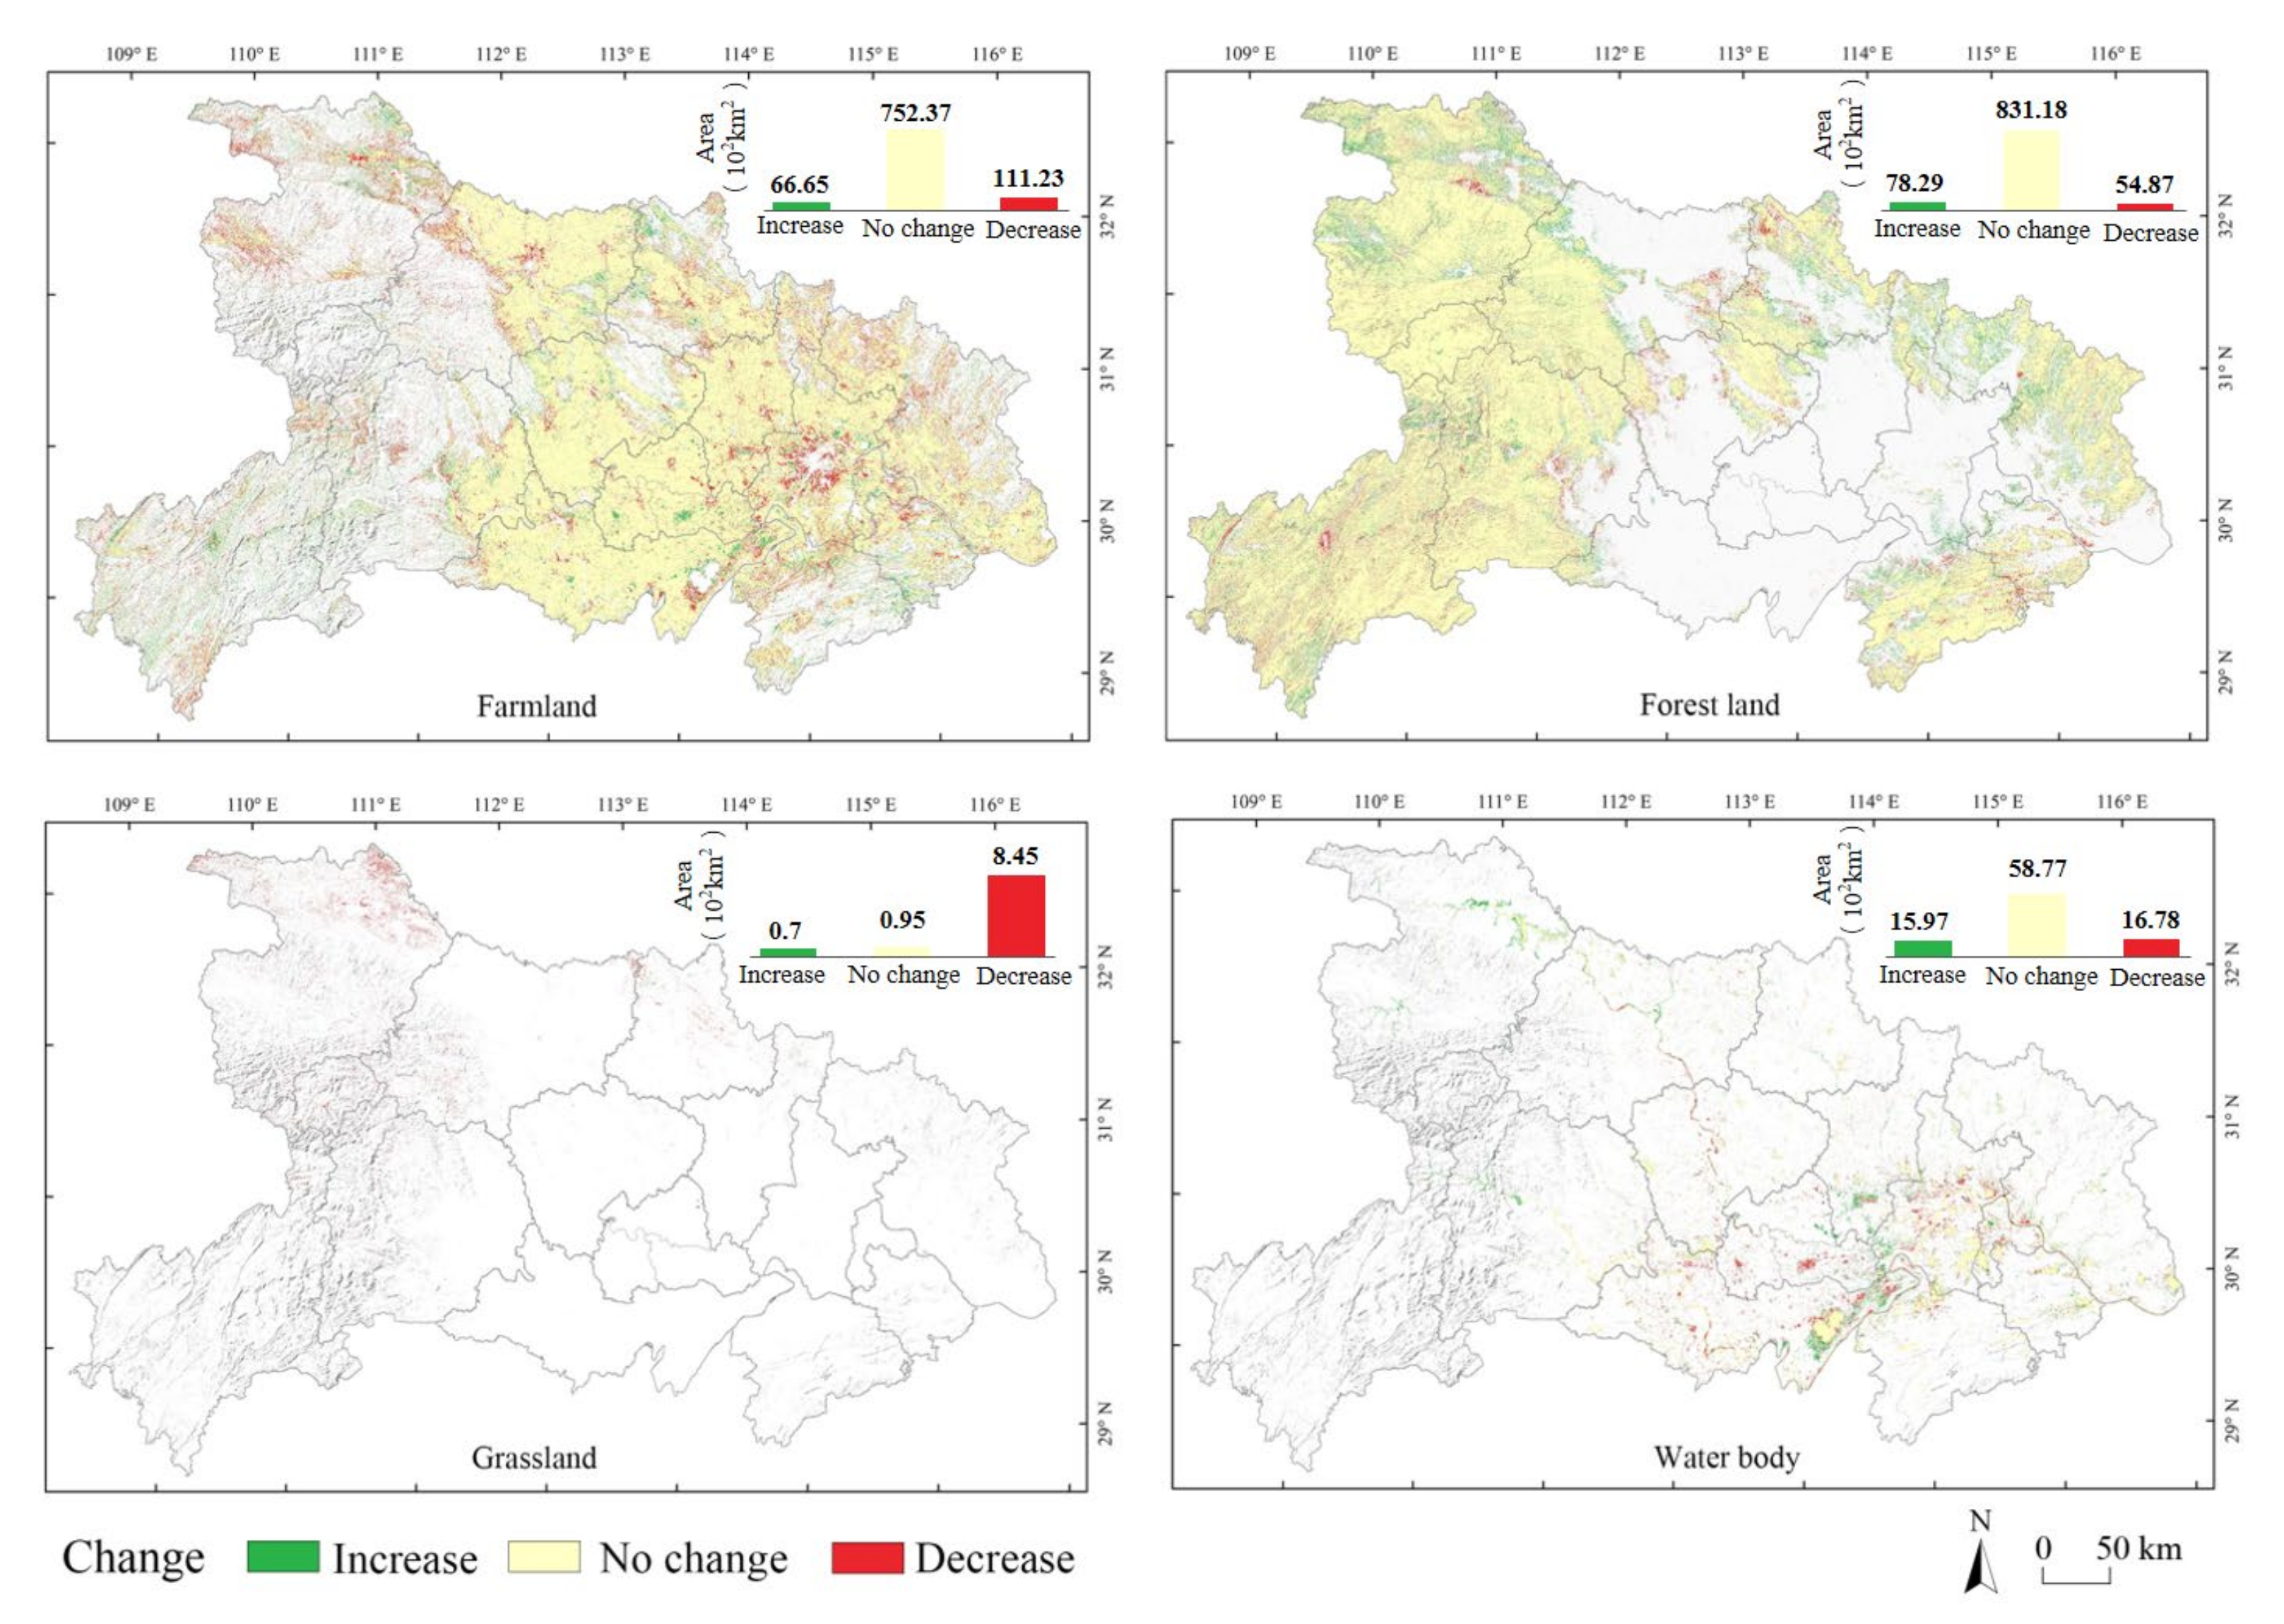
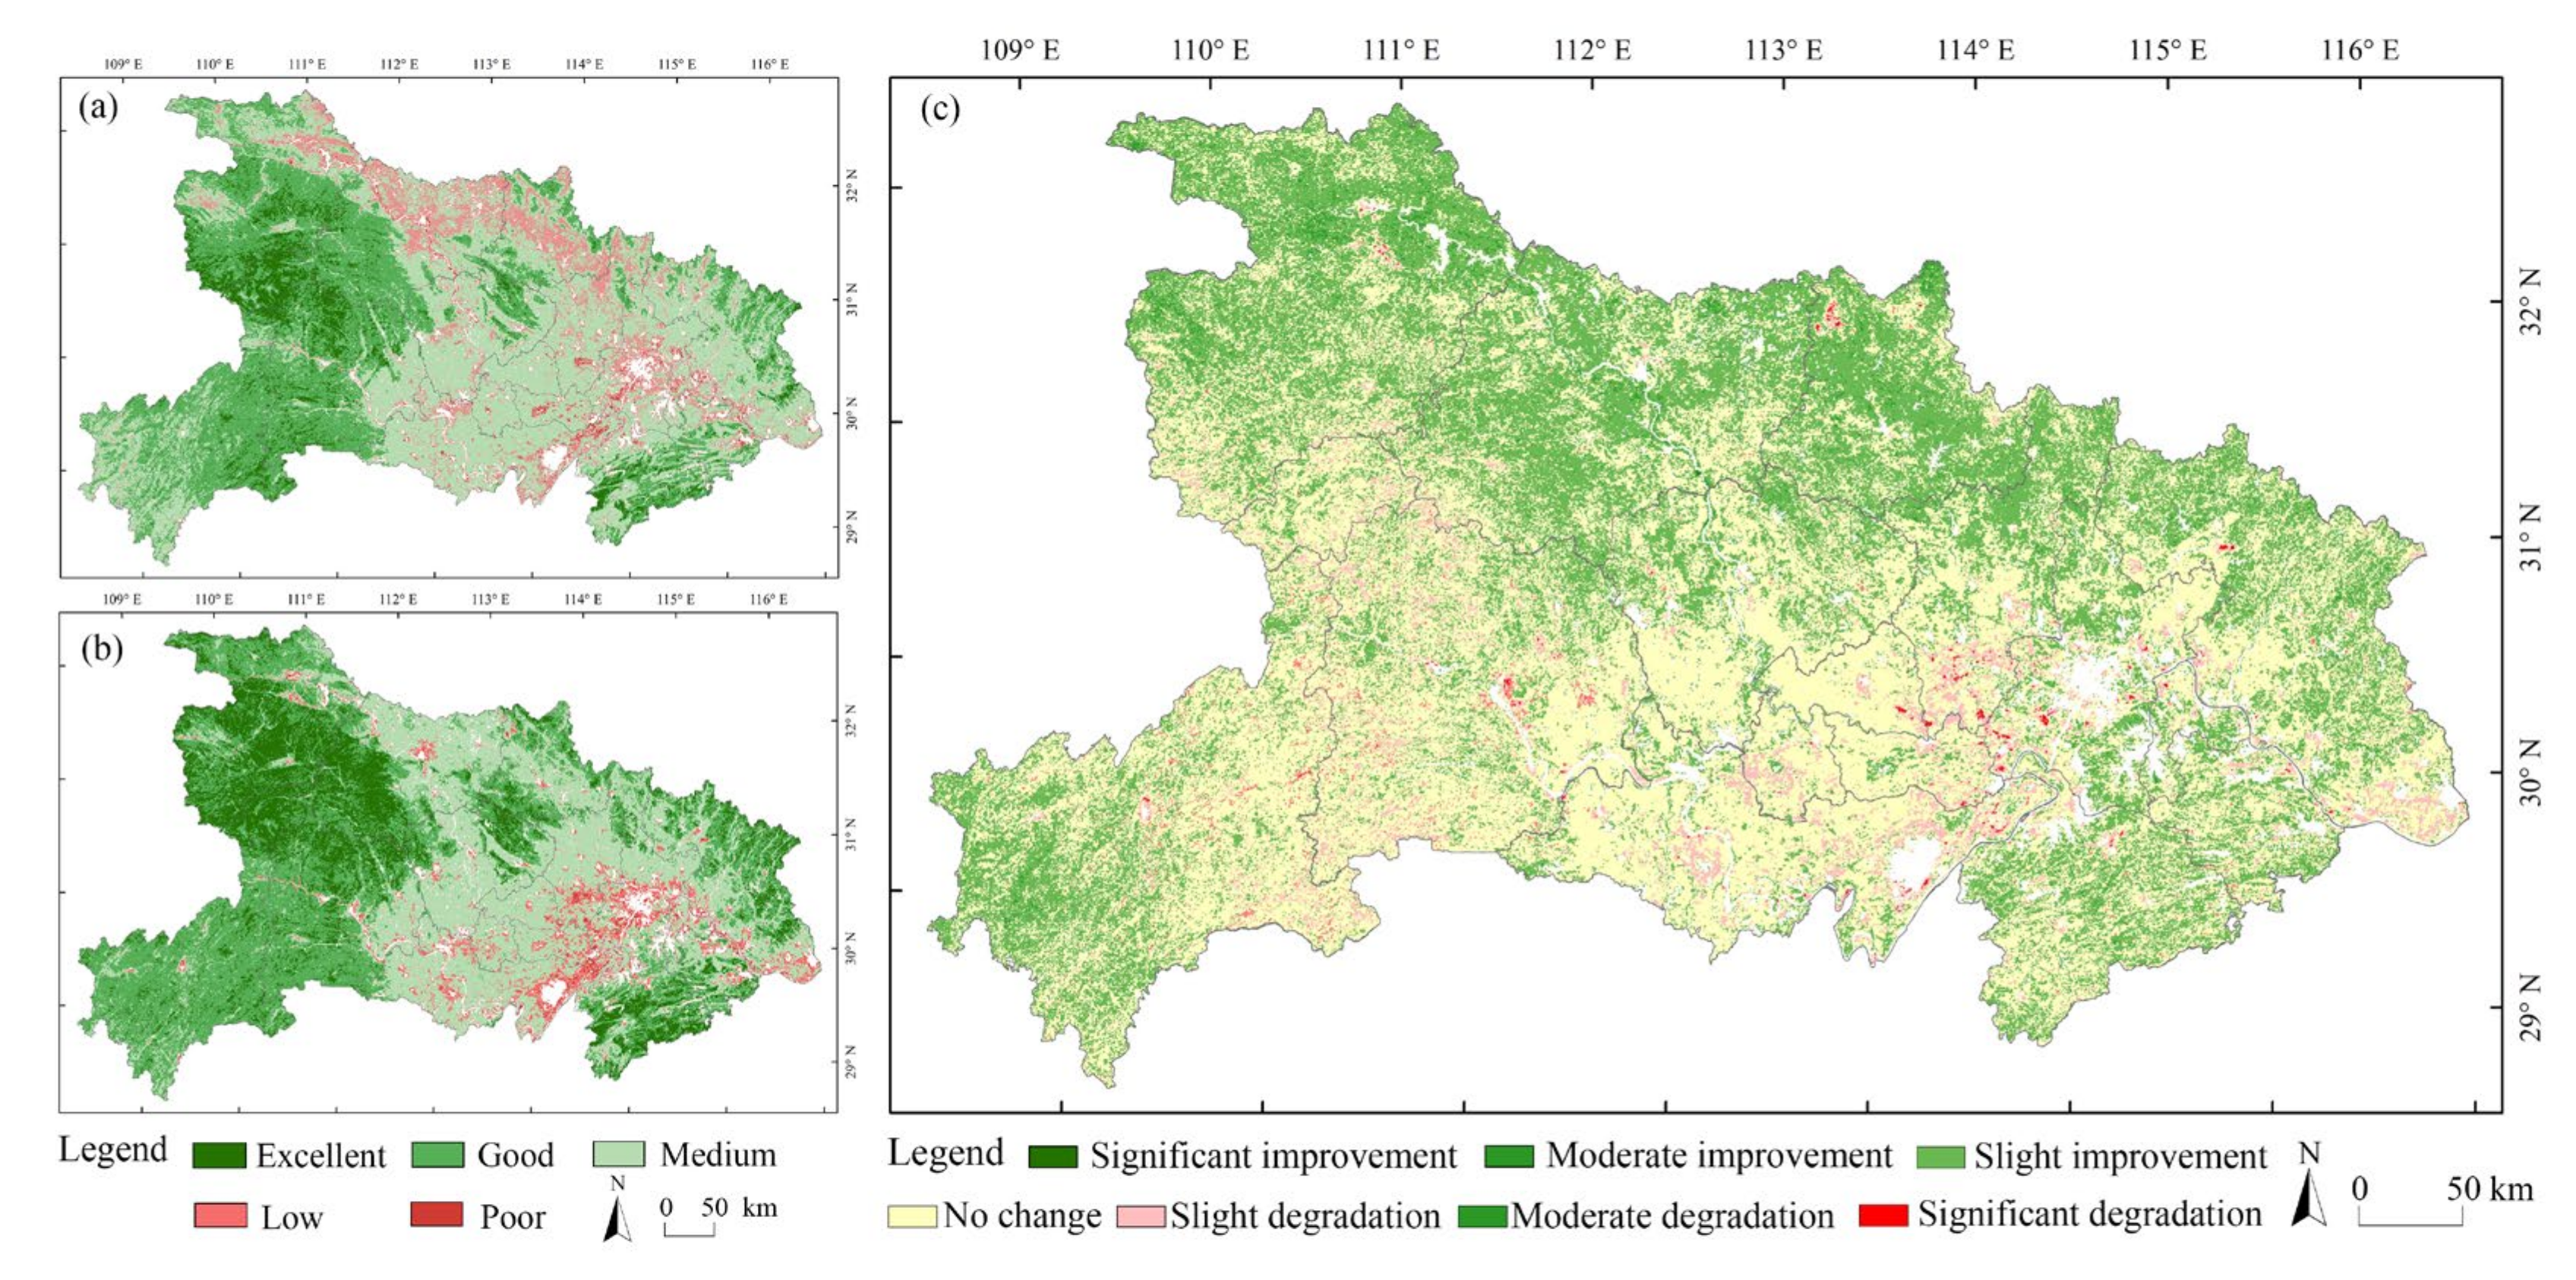
3.1. Degradation of Ecosystem Quantity and Quality

Between 2000 and 2020, the areas of farmland, grassland and water bodies in Hubei Province experienced a decrease, with forest ecosystems increasing (Figure 3). The farmland ecosystem suffered the most significant loss, decreasing by 4457.51 km2, resulting in a 2.38% reduction in its proportional area. The majority of the reduced farmland was located in the mountainous regions of the southwest and northwest of Hubei Province, as well as in the surrounding areas of various cities. During the same period, the grassland ecosystem area decreased by 774.98 km2, mainly in the northwestern and northern parts of Hubei Province. Meanwhile, the water ecosystem saw the smallest reduction, with a total decrease of 81.3 km2 from 2000 to 2020, mainly distributed in the central and southern parts of Hubei Province, where the water system is more developed.
In contrast to the three ecosystems mentioned above, the forest land in Hubei Province saw a considerable increase of 2341.29 km2 in the past two decades, with the proportional area also increased by 1.25%. The growth in forest area was primarily observed in the southeast, northeast, southwest, and northwest regions of the province. Additionally, during the same period, the unused land area decreased by 14.05 km2, while the impervious surface area increased significantly by 2986.54 km2 primarily in the surrounding areas of major cities (Figure 3).
High-quality ecosystems in Hubei Province are mainly concentrated in the mountainous regions of the western, northeastern, and southeastern parts, while the central plains exhibit comparatively lower ecosystem quality, as of 2020 (Figure 4a,b). Analysis of ecosystem quality change between 2000 and 2020 revealed that the most significant improvement occurred in the shift from medium to good quality, with an increased area of 26,404.25 km2. The second most prominent change was observed in the transition from low to medium level, with an expansion of 18,750.75 km2. Conversely, the smallest change area was in the degradation from excellent to good quality, with a reduction of 2637.75 km2 (Figure 5a).
Between 2000 and 2020, the total area of ecosystem quality degradation in Hubei Province was 9364.75 km2, primarily due to slight degradation (9114 km2), which was widely distributed throughout the central plain area, southern, and southwest regions of the province (Figure 4c and Figure 5b,c). The area with significant degradation of ecosystem quality was relatively small, only 1.5 km2, primarily distributed in the northern and northeastern regions of Hubei Province. Meanwhile, the area with moderate degradation of ecosystem quality was 249.25 km2, mainly observed in the central plain area, northeast and southwest regions of Hubei Province (Figure 4c and Figure 5b).
The total area of improved ecosystem quality in Hubei Province was 66,939.75 km2 from 2000 to 2020 (Figure 5c). The majority of the improved area was due to slight improvement in ecosystem quality, accounting for 64,677.5 km2 (96.92% of the total improved area), which was mainly distributed in the northern, southwest and southeast regions of the province. The area with moderate improvement in ecosystem quality was 2259.5 km2, primarily located in the northern, southwestern and southeastern regions of the study area. Meanwhile, the area with significant improvement was 2.75 km2, mainly distributed in northern Hubei Province (Figure 4c and Figure 5b).

3.2. Natural-Social Drivers of Ecosystem Quantitative Degradation

The regression model results for the natural–social drivers of forest, grassland, water bodies, and farmland ecosystem quantity are shown in Table 2. All four models were statistically significant (p < 0.05), and the VIF values of each factor were less than 2.2, indicating that the models had effectively controlled for multicollinearity. The results reveal the specific influences of different factors on each ecosystem type. The farmland area was primarily negatively influenced by three factors: forestry output value (XFOV-1), annual evaporation (XET), and impervious surface (XIS). Among these, the forest output value had the most significant impact on farmland area. This suggests that high forest output value, possibly indicating extensive logging activities, contributes to the reduction of farmland. Conversely, the forest ecosystem was mainly driven by forestry output value (XFOV-1) and annual evaporation (XET). Forest output value had the greatest impact on the forest area, indicating that it plays a crucial role in the expansion of forested areas. Moreover, higher levels of annual evaporation can positively affect forest ecosystems.
The natural–social driving factors affecting the grassland area were relatively complex. The most significant factors were annual precipitation (XPCP) and forestry output value (XFOV-1). However, the influence of annual precipitation on grassland area was significantly positive, suggesting that higher precipitation levels contribute to grassland expansion. On the other hand, the influence of forestry output value on grassland area was significantly negative, indicating that intensive forestry activities may lead to grassland degradation. Additionally, livestock output value (XLOV) and average annual temperature change (XTEMP) had a significant positive effect on grassland ecosystem. The natural–social driving factors of water area were also complex, and involved four factors. Rural per capita net income (XRPCNI), fishery output value (XFOV-2), and annual sunshine hours (XSH) had a significant negative effect on water body area, indicating that higher levels of these factors are associated with reduced water body area. Conversely, evaporation (XET) had a significant positive effect on water body area.

3.3. Natural-Social Drivers of Ecosystem Quality Degradation

Table 3 illustrates the results obtained from the regression models that examine the natural–social drivers of ecosystem quality categorized as excellent, good, medium, and low. All four regression models demonstrated statistically significance (p < 0.05), and the VIF values of each factor were less than 1.8, indicating effective control over multicollinearity. The findings revealed that ecosystems with excellent quality were primarily influenced by forestry output value (XFOV-1) and annual precipitation (XPCP), with forestry output value having a significant positive effect, and precipitation having a significant negative effect. This suggests that higher forestry output value is associated with improved ecosystem quality, while increased precipitation may have adverse effect on ecosystem quality. For ecosystems with good quality, the main factors influencing their quality were annual precipitation (XPCP) and average annual temperature (XTEMP), with annual precipitation having the largest effect. Higher levels of precipitation and temperature were found to have a positive effect on ecosystem quality. Ecosystems with medium quality were positively driven by rural per capita net income (XRPCNI) and fisheries output value (XFOV-2), with rural per capita income having the most significant effect. This indicates that higher levels of rural per capita income contribute to the enhancement of ecosystem quality, along with increased fisheries output value. In contrast, the degradation of ecosystems with low quality was influenced by four significant factors, among which annual evaporation (XET), annual precipitation (XPCP), and pastoral production value (XLOV) were most significant ones. The effects of annual evaporation and fisheries production value were significantly negative, indicating that higher evaporation rates and intensified fisheries production contribute to the deterioration of ecosystem quality. On the other hand, the effect of annual precipitation was significantly positive, suggesting that increased precipitation levels may mitigate the degradation of ecosystems with low quality. Furthermore, annual sunshine hours had a significantnegative effect on the area of low ecosystem quality.

4. Discussion

4.1. Integrated Natural-Social Drivers

Previous studies have shown that climate change and human activities are key drivers of ecosystem degradation. Our study builds on this finding, and provides detailed insights into how natural and social factors combine to affect changes in ecosystem quantity and quality at the regional scale. Our results indicate that human activities have a significantly greater impact on ecosystems than natural factors, particularly on farmland ecosystems and grassland ecosystems. The driving mechanism of forestry output on the degradation of these ecosystems is more significant compared to natural factors, suggesting that human demand for forestry products directly contributes to their degradation. This is partly due to the cultivation, conservation, management, and utilization of forestry resources occupying grassland and farmland with relatively low economic value, and also due to policies such as returning farmland to the forest in China to enhance ecosystem services [59]. In addition, we found a negative correlation between the area of farmland ecosystems and the impervious surface area, which may be due to the growth of population-promoting economic development, and thus promoting urban spatial expansion [60]. During this process, a large amount of farmland was encroached upon by construction land [24], and the population was excluded, due to its strong collinearity with the impermeable surface. In contrast, the positive effect of precipitation on grassland area may be attributed to the increased availability of water, which promotes grass growth and expansion. Adequate precipitation provides the necessary moisture for vegetation, including grass, to thrive and expand their coverage [21].
On the other hand, the negative effects of rural per capita net income and fishery output value on water body area may be due to the pressures and disturbances exerted by economic activities and the exploitation of fishery resources on water ecosystems [61]. Increased economic activities, urbanization, and higher income levels often lead to intensified human interventions in water bodies, such as pollution, habitat destruction, and overfishing [41,42]. These activities can negatively impact water body areas and result in a reduction in their size and ecological quality [62]. Regarding evaporation, its positive effect on water body area can be attributed to the process itself. When evaporation rates are high, more water is converted into vapor and released into the atmosphere [63]. This helps maintain the water balance in water bodies by preventing excessive water accumulation and overflow. Consequently, the water body area remains stable, or even expands as a result of increased evaporation.
The pursuit of economic gains from a particular ecosystem can significantly impact its quantitative growth, as seen with the forestry and livestock production values that drive the growth of forest and farmland, respectively. For instance, an increase in forestry output value contributes to the improvement of ecosystem quality in high-quality ecosystems [64]. This finding highlights a potential area for synergistic ecosystem conservation and economic development. However, it is important to note that the impact of climate change on ecosystem quality surpasses that of human activities, particularly through its influence on rainfall and temperature. Our study revealed that climate change had a greater impact on ecosystem quality than human activities, particularly through the effects of rainfall and temperature. In our study region, the combined effects of temperature and rainfall prolonged the growing season, resulting in increased vegetation biomass accumulation and an improvement in the quality of ecosystems rated as good [21]. Thus, a reduction in precipitation would have a negative impact on the quality of high-quality ecosystems.
The impact of socio-economic factors on ecosystem quality is primarily observed in medium-quality ecosystems. Specifically, fisheries and rural per capita income levels contribute to the expansion of medium-quality ecosystems, indicating a closer connection to human activities. This finding is in line with Wei et al.’s research [65], which suggests that rural per capita income is positively correlated with changes in medium ecosystems. This may be due to increased ecological conservationawareness and the implementation of ecological compensation mechanisms as per capita income rises. These measures encourage active participation and implementation of relevant ecological restoration activities by residents, promoting ecosystem quality. Moreover, the growth of the area of excellent-level ecosystems is positively influenced by an increase in forest output value, as high-quality forests provide more economic value and promote the expansion of excellent-level ecosystems.
The degradation of low-quality ecosystems is influenced by multiple factors. The negative effects of annual evaporation and fisheries output value on the area of low-quality ecosystems may be attributed to reduced water resources and overexploitation of fisheries resources [63]. Similarly, annual sunshine hours have a negative impact on the area of low-quality ecosystems, possibly due to excessive sunlight leading to increased water evaporation and limited vegetation growth [10]. The decline in water resources, as indicated by higher evaporation rates, can result in reduced water availability for sustaining ecosystem functions and supporting vegetation growth in low-quality ecosystems [53]. This scarcity of water resources can exacerbate the degradation process, leading to further deterioration of the ecosystem area [66]. Furthermore, the negative impact of annual sunshine hours on the area of low-quality ecosystems implies that excessive sunlight exposure may contribute to increased evaporation rates and moisture loss, limiting the growth and development of vegetation. This can further weaken the ecological resilience of low-quality ecosystems, making them more susceptible to degradation.
It is essential to recognize that while economic activities can play a role in ecosystem dynamics, the overarching influence of climate change, specifically through its effects on rainfall and temperature patterns, has a more significant impact on ecosystem quality. Therefore, sustainable management practices should consider both the economic benefits derived from ecosystems and the preservation of their quality, while also addressing the challenges posed by climate change.

4.2. Strategies for Ecosystem Management

Restoring degraded ecosystems is a crucial task in the fight against global climate change [67]. As regional socio-economic development continues to exert pressure on ecosystems, it has become urgent to explore the socio-economic driving forces behind ecosystem restoration, and consider ecosystem transformation and development to improve human well-being. By recognizing the interactions between economic activities, climate change, and ecosystem quality, decision-makers and stakeholders can formulate strategies that balance economic growth with ecological conservation. Our study highlights the synergistic effects of natural and socio-economic factors on ecosystem quantity and quality, offering a way to address ecosystem restoration at its source. For example, actively developing the forestry industry in areas with degraded forest ecosystems can promote ecosystem protection and economic development simultaneously. In farmland management, it is important to consider the impacts of forestry activities and impervious surfaces to balance agricultural land use and ecosystem protection. In mountainous areas with severe soil erosion, soil and water conservation projects should be implemented in low-quality ecosystem areas. In regions with high rural per capita income, encourage and support investment in recycling, agriculture (forestry), and clean energy, strengthen rural sewage treatment, and carry out river protection and treatment. Regarding water body management, attention should be given to the impact of rural economic development and fisheries resource utilization on water bodies, along with managing the evaporation process in a sustainable manner, to maintain the ecological functions of water bodies. These approaches to ecological restoration, based on nature and socio-economic factors, can promote the natural regeneration of regional ecosystems and the harmony between local species and human beings, providing support for the determination of the mid- and long-term goals for regional ecosystem restoration.

4.3. Limitations

This study provides valuable quantitative insights into the drivers of regional-scale ecosystem degradation, highlighting the need for informed ecosystem management decisions. However, it is important to acknowledge the limitations of this research, which focuses on a static analysis of administrative boundary units, and overlooks the dynamic interactions between geographical units, such as the impact of upstream activities on the downstream watersheds. At larger regional scales, socio-economic activities upstream may significantly contribute to both quantitative and qualitative ecosystem degradation downstream. For example, Chen et al. [68] demonstrated that irrigation development in the upper Tarim River accelerated the decline of groundwater level in the lower reaches. Without effectively managing the source drivers of ecosystem degradation upstream, achieving downstream ecosystem restoration and sustainable management will be challenging. Future research should therefore explore the natural–social driving mechanism of ecosystem degradation from a system correlation perspective.
In this study, a stepwise regression model was used to analyze the driving forces of ecosystem degradation. However, it is important to acknowledge that the relationship between social and economic factors and ecosystems can be more complex than assumed in this model. Further research is needed to investigate and verify the multiple causal relationships that exist. Additionally, the socioeconomic drivers selected in this study were limited to the indicators available in the statistical yearbook, which may hinder a deeper understanding of the mechanism behind ecosystem degradation. In future studies, more refined and comprehensive data should be collected and analyzed to provide a more accurate and comprehensive understanding of the issue.

5. Conclusions

The degradation of ecosystems is a complex issue that is influenced by both natural and socio-economic factors. Our study found that both natural and socio-economic factors contribute to the degradation of ecosystems at the regional scale. Socio-economic factors have a greater impact on medium-quality ecosystems, and the level of fisheries and rural per capita income can contribute to increases in the area of medium-quality ecosystems. Furthermore, the increase in forest output value had a positive impact on the growth of the area of excellent-level ecosystems, while natural factors, especially climate change, have a significant impact on ecosystem quality. To restore degraded ecosystems, it is crucial to consider the synergistic effects of both natural and socio-economic factors, and take a holistic approach that considers ecosystem transformation and development to improve human well-being. At the regional scale, compared to land use, climate change is a relatively challenging factor to adjust and intervene in, as it is typically a global challenge. However, despite this limitation, there are still feasible measures at the regional scale to reduce the vulnerability of ecosystems to climate change. For example, improving water resources management, implementing climate-adaptive agriculture, establishing disaster risk reduction system, and promoting natural restoration can enhance the resilience and recovery capacity of ecosystems, helping them better adapt to changing climatic conditions. Overall, our study provides strong support for ecosystem management decisions at the regional scale, and highlights the need for a holistic approach that considers both natural and socio-economic factors in ecosystem restoration and management. By doing so, we can ensure the long-term sustainability of ecosystems and promote the well-being of human societies in a mutually beneficial way.

Author Contributions

Conceptualization, W.L. and M.Z.; methodology, M.Z. and W.L.; software, M.Z.; formal analysis, M.Z.; investigation, M.Z. and S.C; data curation, M.Z.; writing—original draft preparation, M.Z. and W.L.; writing—review and editing, M.Z., W.L. and S.C.; visualization, M.Z. and W.L.; funding acquisition, W.L. All authors have read and agreed to the published version of the manuscript.

Funding

This research was funded by the Fundamental Research Funds for the Central Universities (Grant No. 2662022YLYJ004) and the Hubei Research Station of Ecological Restoration and Comprehensive Management of Territorial Space in Jianghan Plain.

Data Availability Statement

All data that support the findings of this study are included within the article.

Conflicts of Interest

The authors declare no conflict of interest.

References

  1. Diaz, S.; Settele, J.; Brondizio, E.S.; Ngo, H.T.; Agard, J.; Arneth, A.; Balvanera, P.; Brauman, K.A.; Butchart, S.H.M.; Chan, K.M.A.; et al. Pervasive human-driven decline of life on Earth points to the need for transformative change. Science 2019, 366, eaax3100. [Google Scholar] [CrossRef] [PubMed] [Green Version]
  2. Goldberg, L.; Lagomasino, D.; Thomas, N.; Fatoyinbo, T. Global declines in human-driven mangrove loss. Glob. Chang. Biol. 2020, 26, 5844–5855. [Google Scholar] [CrossRef] [PubMed]
  3. Intergovernmental Panel on Climate Change (IPCC). Globa Warming of 1.5 ◦C. Available online: https://www.ipcc.ch/sr15/ (accessed on 6 April 2023).
  4. Jia, Q.; Li, M.F.; Dou, X.C. Climate Change Affects Crop Production Potential in Semi-Arid Regions: A Case Study in Dingxi, Northwest China, in Recent 30 Years. Sustainability 2022, 14, 12. [Google Scholar]
  5. Strassburg, B.B.N.; Iribarrem, A.; Beyer, H.L.; Cordeiro, C.L.; Crouzeilles, R.; Jakovac, C.C.; Braga Junqueira, A.; Lacerda, E.; Latawiec, A.E.; Balmford, A.; et al. Global priority areas for ecosystem restoration. Nature 2020, 586, 724–729. [Google Scholar] [CrossRef] [PubMed]
  6. Costanza, R. Social Goals and the Valuation of Ecosystem Services. Ecosystems 2000, 3, 4–10. [Google Scholar] [CrossRef]
  7. Zhang, Y.; Zhao, Z.; Yang, Y.; Fu, B.; Ma, R.; Lue, Y.; Wu, X. Identifying ecological security patterns based on the supply, demand and sensitivity of ecosystem service: A case study in the Yellow River Basin, China. J. Environ. Manag. 2022, 315, 115158. [Google Scholar] [CrossRef]
  8. Ding, Z.; Xiao, N.; Gao, X.; Zheng, H.; Xiao, Y.; Kong, L.; Ouyang, Z.; Li, R. Changes of Ecosystem Quality and Services between 2000 and 2015 in Yangtze River Basin. Res. Environ. Sci. 2020, 33, 1308–1314. [Google Scholar]
  9. Klimaszyk, P.; Gołdyn, R. Water Quality of Freshwater Ecosystems in a Temperate Climate. Water 2020, 12, 2643. [Google Scholar] [CrossRef]
  10. Sultana, F.; Arfin-Khan, M.A.S.; Karim, M.R.; Mukul, S.A. Rainfall Modifies the Disturbance Effects on Regulating Ecosystem Services in Tropical Forests of Bangladesh. Forests 2023, 14, 272. [Google Scholar] [CrossRef]
  11. Matricardi, E.A.T.; Skole, D.L.; Costa, O.B.; Pedlowski, M.A.; Samek, J.H.; Miguel, E.P. Long-term forest degradation surpasses deforestation in the Brazilian Amazon. Science 2020, 369, 1378–1382. [Google Scholar] [CrossRef]
  12. Long, X.R.; Lin, H.; An, X.X.; Chen, S.D.; Qi, S.Y.; Zhang, M. Evaluation and analysis of ecosystem service value based on land use/cover change in Dongting Lake wetland. Ecol. Indic. 2022, 136, 108619. [Google Scholar] [CrossRef]
  13. Xu, K.; Chi, Y.; Wang, J.; Ge, R.; Wang, X. Analysis of the spatial characteristics and driving forces determining ecosystem quality of the Beijing-Tianjin-Hebei region. Environ. Sci. Pollut. Res. Int. 2021, 28, 12555–12565. [Google Scholar] [CrossRef]
  14. Yin, F.; Deng, X.Z.; Jin, Q.; Yuan, Y.W.; Zhao, C.H. The impacts of climate change and human activities on grassland productivity in Qinghai Province, China. Front. Earth Sci. 2014, 8, 93–103. [Google Scholar] [CrossRef]
  15. Zheng, K.; Wei, J.Z.; Pei, J.Y.; Cheng, H.; Zhang, X.L.; Huang, F.Q.; Li, F.M.; Ye, J.S. Impacts of climate change and human activities on grassland vegetation variation in the Chinese Loess Plateau. Sci. Total Environ. 2019, 660, 236–244. [Google Scholar] [CrossRef]
  16. Li, Q.; Zhang, C.; Shen, Y.; Jia, W.; Li, J. Quantitative assessment of the relative roles of climate change and human activities in desertification processes on the Qinghai-Tibet Plateau based on net primary productivity. Catena 2016, 147, 789–796. [Google Scholar] [CrossRef]
  17. Gribovszki, Z.; Kalicz, P.; Palocz-Andresen, M.; Szalay, D.; Varga, T. Hydrological role of Central European forests in changing climate—Review. Időjárás 2019, 123, 535–550. [Google Scholar] [CrossRef]
  18. Ma, L.; Xu, M.-H.; Zhai, D.-T.; Jia, Y.-Y. Response of alpine meadow vegetation-soil system to climate change: A review. Shengtaixue Zazhi 2017, 36, 1708–1717. [Google Scholar]
  19. Jin, X.-Y.; Jin, H.-J.; Iwahana, G.; Marchenko, S.S.; Luo, D.-L.; Li, X.-Y.; Liang, S.-H. Impacts of climate-induced permafrost degradation on vegetation: A review. Adv. Clim. Chang. Res. 2021, 12, 29–47. [Google Scholar] [CrossRef]
  20. Choat, B.; Brodribb, T.J.; Brodersen, C.R.; Duursma, R.A.; Lopez, R.; Medlyn, B.E. Triggers of tree mortality under drought. Nature 2018, 558, 531–539. [Google Scholar] [CrossRef] [PubMed]
  21. Zhao, X.; Tan, K.; Zhao, S.; Fang, J. Changing climate affects vegetation growth in the arid region of the northwestern China. J. Arid. Environ. 2011, 75, 946–952. [Google Scholar] [CrossRef]
  22. Nemani, R.R.; Keeling, C.D.; Hashimoto, H.; Jolly, W.M.; Piper, S.C.; Tucker, C.J.; Myneni, R.B.; Running, S.W. Climate-Driven Increases in Global Terrestrial Net Primary Production from 1982 to 1999. Science 2003, 300, 1560–1563. [Google Scholar] [CrossRef] [Green Version]
  23. Zhou, Y.; Xing, B.; Ju, W. Assessing the Impact of Urban Sprawl on Net Primary Productivity of Terrestrial Ecosystems Using a Process-Based Model—A Case Study in Nanjing, China. IEEE J. Sel. Top. Appl. Earth Obs. Remote Sens. 2015, 8, 2318–2331. [Google Scholar] [CrossRef]
  24. He, C.; Liu, Z.; Xu, M.; Ma, Q.; Dou, Y. Urban expansion brought stress to food security in China: Evidence from decreased cropland net primary productivity. Sci. Total Environ. 2017, 576, 660–670. [Google Scholar] [CrossRef]
  25. Bebber, D.P.; Butt, N. Tropical protected areas reduced deforestation carbon emissions by one third from 2000-2012. Sci. Rep. 2017, 7, 14005. [Google Scholar] [CrossRef] [Green Version]
  26. Staddon, P.L.; Faghihinia, M. Grazing intensity is key to global grassland carbon sequestration potential. Sustain. Environ. 2021, 7, 1895474. [Google Scholar] [CrossRef]
  27. Ji, S.; Ma, S. The effects of industrial pollution on ecosystem service value: A case study in a heavy industrial area, China. Environ. Dev. Sustain. 2021, 24, 6804–6833. [Google Scholar] [CrossRef]
  28. Clarke Murray, C.; Agbayani, S.; Ban, N.C. Cumulative effects of planned industrial development and climate change on marine ecosystems. Glob. Ecol. Conserv. 2015, 4, 110–116. [Google Scholar] [CrossRef] [Green Version]
  29. Siren, A.H. Population growth and land use intensification in a subsistence-based indigenous community in the Amazon. Hum. Ecol. 2007, 35, 669–680. [Google Scholar] [CrossRef]
  30. Wang, C.; Myint, S. Environmental Concerns of Deforestation in Myanmar 2001–2010. Remote Sens. 2016, 8, 728. [Google Scholar] [CrossRef] [Green Version]
  31. Shi, S.; Yu, J.; Wang, F.; Wang, P.; Zhang, Y.; Jin, K. Quantitative contributions of climate change and human activities to vegetation changes over multiple time scales on the Loess Plateau. Sci. Total Environ. 2021, 755, 142419. [Google Scholar] [CrossRef]
  32. Yi, L.; Sun, Y.; Ouyang, X.; Yin, S. Identifying the Impacts of Climate Change and Human Activities on Vegetation Cover Changes: A Case Study of the Yangtze River Basin, China. Int. J. Environ. Res. Public Health 2022, 19, 6239. [Google Scholar] [CrossRef] [PubMed]
  33. Wang, C.; Jiang, Q.o.; Engel, B.; Mercado, J.A.V.; Zhang, Z. Analysis on net primary productivity change of forests and its multi–level driving mechanism—A case study in Changbai Mountains in Northeast China. Technol. Forecast. Soc. Chang. 2020, 153, 119939. [Google Scholar] [CrossRef]
  34. Jiang, H.; Xu, X.; Guan, M.; Wang, L.; Huang, Y.; Jiang, Y. Determining the contributions of climate change and human activities to vegetation dynamics in agro-pastural transitional zone of northern China from 2000 to 2015. Sci. Total Environ. 2020, 718, 134871. [Google Scholar] [CrossRef] [PubMed]
  35. Wang, J.; Delang, C.O.; Hou, G.; Gao, L.; Lu, X. Net primary production increases in the Yangtze River Basin within the latest two decades. Glob. Ecol. Conserv. 2021, 26, e01497. [Google Scholar] [CrossRef]
  36. Lu, N.; Tian, H.; Fu, B.; Yu, H.; Piao, S.; Chen, S.; Li, Y.; Li, X.; Wang, M.; Li, Z.; et al. Biophysical and economic constraints on China’s natural climate solutions. Nat. Clim. Chang. 2022, 12, 847–853. [Google Scholar] [CrossRef]
  37. Gao, W.; Zheng, C.; Liu, X.; Lu, Y.; Chen, Y.; Wei, Y.; Ma, Y. NDVI-based vegetation dynamics and their responses to climate change and human activities from 1982 to 2020: A case study in the Mu Us Sandy Land, China. Ecol. Indic. 2022, 137, 108745. [Google Scholar] [CrossRef]
  38. Wang, J.; Dun, Y. A review on the effects of land use change on ecosystem services. Resour. Environ. Yangtze Basin 2015, 24, 798–808. [Google Scholar]
  39. Peng, J.; Hu, X.; Zhao, M.; Liu, Y.; Tian, L. Research progress on ecosystem service trade-offs: From cognition to decision-making. Acta Geogr. Sin. 2017, 72, 960–973. [Google Scholar]
  40. Yuanyun, X.I.E.; Changan, L.I.; Qiuliang, W.; Hongfu, Y.I.N. Sediment Records on Climate Change and Human Activities since the Holocene in Jiangling Area, Hubei Province, China. Geogr. Geo-Inf. Sci. 2008, 24, 85–90. [Google Scholar]
  41. Luo, M.; Zhuang, P.; Zhang, H.; Zhang, T.; Hou, J.; Wang, Y. Community characteristics of macrobenthos in waters around the Nature Reserve of the Chinese sturgeon Acipenser sinensis and the adjacent waters in Yangtze River Estuary. J. Appl. Ichthyol. 2011, 27, 425–432. [Google Scholar] [CrossRef]
  42. Liu, X.; Qin, J.; Xu, Y.; Ouyang, S.; Wu, X. Biodiversity decline of fish assemblages after the impoundment of the Three Gorges Dam in the Yangtze River Basin, China. Rev. Fish Biol. Fish. 2019, 29, 177–195. [Google Scholar] [CrossRef]
  43. Chen, L.; Zhao, X.; Zhu, Y. Impact of public participation in the River Chief System on river governance: An empirical study in Jiangsu and Hubei provinces. Resour. Sci. 2021, 43, 1077–1087. [Google Scholar] [CrossRef]
  44. Mao, D.; Wang, Z.; Wu, J.; Wu, B.; Zeng, Y.; Song, K.; Yi, K.; Luo, L. China’s wetlands loss to urban expansion. Land Degrad. Dev. 2018, 29, 2644–2657. [Google Scholar] [CrossRef]
  45. Sprintsin, M.; Karnieli, A.; Sprintsin, S.; Cohen, S.; Berliner, P. Relationships between stand density and canopy structure in a dryland forest as estimated by ground-based measurements and multi-spectral spaceborne images. J. Arid Environ. 2009, 73, 955–962. [Google Scholar] [CrossRef]
  46. Sexton, J.O.; Noojipady, P.; Anand, A.; Song, X.-P.; McMahon, S.; Huang, C.; Feng, M.; Channan, S.; Townshend, J.R. A model for the propagation of uncertainty from continuous estimates of tree cover to categorical forest cover and change. Remote Sens. Environ. 2015, 156, 418–425. [Google Scholar] [CrossRef] [Green Version]
  47. Badgley, G.; Anderegg, L.D.L.; Berry, J.A.; Field, C.B. Terrestrial gross primary production: Using NIR(V) to scale from site to globe. Glob. Chang. Biol. 2019, 25, 3731–3740. [Google Scholar] [CrossRef]
  48. Strain, E.M.; Thomson, R.J.; Micheli, F.; Mancuso, F.P.; Airoldi, L. Identifying the interacting roles of stressors in driving the global loss of canopy-forming to mat-forming algae in marine ecosystems. Glob. Chang. Biol. 2014, 20, 3300–3312. [Google Scholar] [CrossRef]
  49. Murshed, M.; Alam, M.S. Estimating the macroeconomic determinants of total, renewable, and non-renewable energy demands in Bangladesh: The role of technological innovations. Environ. Sci. Pollut. Res. Int. 2021, 28, 30176–30196. [Google Scholar] [CrossRef]
  50. Yang, Y.; Cai, Y.; Bai, Y.; Chen, W.; Yang, X. A dynamic evaluation of regional ecosystem health using a multiple index system: A case study of Maoji Biosphere Reserve. Acta Ecol. Sin. 2016, 36, 4279–4287. [Google Scholar]
  51. Yang, J.; Huang, X. The 30 m annual land cover dataset and its dynamics in China from 1990 to 2019. Earth Syst. Sci. Data 2021, 13, 3907–3925. [Google Scholar] [CrossRef]
  52. Ministry of Ecology and Environment of the People’s Republic of China; Technical Specification for Investigation and Assessment of National Ecological Status—Ecosystem Quality Assessment (HJ 1172—2021). Available online: https://www.mee.gov.cn/ywgz/fgbz/bz/bzwb/stzl/202106/W020210910456717871866.pdf (accessed on 21 May 2021).
  53. Zhang, L.; Chen, Z.; Zhang, X.; Zhao, L.; Li, Q.; Chen, D.; Tang, Y.; Gu, S. Evapotranspiration and Its Partitioning in Alpine Meadow of Three-River Source Region on the Qinghai-Tibetan Plateau. Water 2021, 13, 2061. [Google Scholar] [CrossRef]
  54. Hao, L.; Sun, G.; Liu, Y.; Wan, J.; Qin, M.; Qian, H.; Liu, C.; Zheng, J.; John, R.; Fan, P.; et al. Urbanization dramatically altered the water balances of a paddy field-dominated basin in southern China. Hydrol. Earth Syst. Sci. 2015, 19, 3319–3331. [Google Scholar] [CrossRef] [Green Version]
  55. Smethurst, P.J. Forest fertilization: Trends in knowledge and practice compared to agriculture. Plant Soil 2010, 335, 83–100. [Google Scholar] [CrossRef]
  56. Rabbat, C.; Awad, S.; Villot, A.; Rollet, D.; Andrès, Y. Sustainability of biomass-based insulation materials in buildings: Current status in France, end-of-life projections and energy recovery potentials. Renew. Sustain. Energy Rev. 2022, 156, 111962. [Google Scholar] [CrossRef]
  57. Warren-Rhodes, K.; Koenig, A. Ecosystem appropriation by Hong Kong and its implications for sustainable development. Ecol. Econ. 2001, 39, 347–359. [Google Scholar] [CrossRef]
  58. Hamzehpour, N.; Shafizadeh-Moghadam, H.; Valavi, R. Exploring the driving forces and digital mapping of soil organic carbon using remote sensing and soil texture. Catena 2019, 182, 104141. [Google Scholar] [CrossRef]
  59. Notice of the People’s Government of Hubei Province on Implementing the Policy of Returning Farmland to Forests. Available online: http://www.hubei.gov.cn/zfwj/ezf/201112/t20111208_1711355.shtml (accessed on 25 October 2007).
  60. Dehghan, F.; Uribe, G.V. Analysing Mexican population concentration: A model with empirical evidence. Urban Stud. 1999, 36, 1269–1281. [Google Scholar] [CrossRef]
  61. Parris, K. Impact of Agriculture on Water Pollution in OECD Countries: Recent Trends and Future Prospects. Int. J. Water Resour. Dev. 2011, 27, 33–52. [Google Scholar] [CrossRef] [Green Version]
  62. Peters, N.E.; Meybeck, M. Water Quality Degradation Effects on Freshwater Availability: Impacts of Human Activities. Water Int. 2000, 25, 185–193. [Google Scholar] [CrossRef]
  63. Ma, H.; Townsend, H.; Zhang, X.; Sigrist, M.; Christensen, V. Using a fisheries ecosystem model with a water quality model to explore trophic and habitat impacts on a fisheries stock: A case study of the blue crab population in the Chesapeake Bay. Ecol. Model. 2010, 221, 997–1004. [Google Scholar] [CrossRef]
  64. Hao, Y.; Xu, Y.; Zhang, J.; Hu, X.; Huang, J.; Chang, C.-P.; Guo, Y. Relationship between forest resources and economic growth: Empirical evidence from China. J. Clean. Prod. 2019, 214, 848–859. [Google Scholar] [CrossRef]
  65. Wei, X.; Khachatryan, H.; Zhu, H. Poyang lake wetlands restoration in China: An analysis of farmers’ perceptions and willingness to participate. J. Clean. Prod. 2021, 284, 125001. [Google Scholar] [CrossRef]
  66. Davidsen, C.; Pereira-Cardenal, S.J.; Liu, S.; Mo, X.; Rosbjerg, D.; Bauer-Gottwein, P. Using Stochastic Dynamic Programming to Support Water Resources Management in the Ziya River Basin, China. J. Water Resour. Plan. Manag. 2015, 141, 04014086. [Google Scholar] [CrossRef] [Green Version]
  67. Harris, J.A.; Hobbs, R.J.; Higgs, E.; Aronson, J. Ecological Restoration and Global Climate Change. Restor. Ecol. 2006, 14, 170–176. [Google Scholar] [CrossRef]
  68. Chen, Y.; Li, W.; Xu, C.; Ye, Z.; Chen, Y. Desert riparian vegetation and groundwater in the lower reaches of the Tarim River basin. Environ. Earth Sci. 2014, 73, 547–558. [Google Scholar] [CrossRef]
Figure 1. Location of study area.
Land 12 01280 g001
Figure 2. Research framework.
Land 12 01280 g002
Figure 3. Changes of different ecosystems between 2000 and 2020.
Land 12 01280 g003
Figure 4. Ecosystem quality of Hubei Province in 2000 (a) and 2020 (b), and changes from 2000 to 2020 (c).
Land 12 01280 g004
Figure 5. Transition of ecosystems across different quality levels between 2000 and 2020. (a) Transition relationships among ecosystems of different quality levels. (b) The change in area of ecosystem quality at different levels. (c) Proportion of the area with no change, degradation, and improvement in ecosystem quality.
Land 12 01280 g005
Table 1. Natural and social driving factors.
Driving FactorsIndicatorsCodes
NaturalClimate conditionsAverage annual temperatureXTEMP
Annual precipitation XPCP
Annual evaporationXET
Annual sunshine hoursXSH
SocialPopulation and urban expansionPopulation quantityXPOP
Impervious surface areaXIS
Resource utilizationAgricultural output valueXAOV
Forestry output valueXFOV-1
Livestock output valueXLOV
Fishery output valueXFOV-2
Industrial output valueXIOV
Construction output valueXCOV
Economic structureGross national productXGNP
Primary industry output valueXPOV
Secondary industry output valueXSOV
Tertiary industry output valueXTOV
Consumption levelUrban per capita disposable incomeXUPCDI
Rural per capita net incomeXRPCNI
Total sales of consumer goodsXSTROCG
Table 2. Results of the analysis of driving forces of ecosystem type degradation in Hubei Province, 2000–2020.
ModelVariableStand. Coeff.R2Adj. R2p-ValueCollinearity Statistics
Tol.VIF
FarmlandXFOV-1−0.388 *0.6900.619<0.050.7731.294
XET−0.3760.7711.297
XIS−0.3080.7791.283
Forest landXFOV-10.4280.4490.370<0.050.8371.195
XET0.3710.8371.195
GrasslandXPCP0.980 ***0.8210.762<0.0010.5231.913
XFOV-1−0.938 ***0.4682.139
XLOV0.546 **0.5031.989
XTEMP0.417 *0.4972.014
Water bodyXRPCNI−0.559 **0.7920.723<0.0010.7591.318
XFOV-2−0.411 *0.7881.269
XET0.392 *0.9831.018
XSH−0.298 *0.9701.031
Note: *** means p < 0.001, ** means p < 0.01, * means p < 0.05.
Table 3. Driving forces of ecosystem quality degradation.
ModelVariablesStand. Coeff.R2Adj. R2p-ValueCollinearity Statistics
Tol.VIF
ExcellentXFOV-10.628 ***0.7340.696<0.0010.9991.001
XPCP−0.567 **0.9991.001
GoodXPCP0.908 **0.4980.426<0.050.5811.720
XTEMP0.726 *0.5811.720
MediumXRPCNI0.3900.4040.319<0.050.7891.267
XFOV-20.3540.7891.267
LowXET−0.529 **0.8620.816<0.0010.7821.279
XPCP0.433 **0.9461.058
XLOV−0.395 **0.7191.391
XSH−0.269 *0.9061.104
Note: *** means p < 0.001, ** means p < 0.01, * means p < 0.05.
Disclaimer/Publisher’s Note: The statements, opinions and data contained in all publications are solely those of the individual author(s) and contributor(s) and not of MDPI and/or the editor(s). MDPI and/or the editor(s) disclaim responsibility for any injury to people or property resulting from any ideas, methods, instructions or products referred to in the content.

