Article

Detecting Long-Term Series Eco-Environmental Quality Changes and Driving Factors Using the Remote Sensing Ecological Index with Salinity Adaptability (RSEISI): A Case Study in the Tarim River Basin, China

1
College of Geographical and Remote Science, Xinjiang University, Urumqi 830017, China
2
Xinjiang Key Laboratory of Oasis Ecology, Xinjiang University, Urumqi 830017, China
3
Key Laboratory of Smart City and Environment Modelling of Higher Education Institute, Xinjiang University, Urumqi 830017, China
*
Author to whom correspondence should be addressed.
These authors contributed equally to this work.
Land 2023, 12(7), 1309; https://doi.org/10.3390/land12071309
Submission received: 31 May 2023 / Revised: 25 June 2023 / Accepted: 27 June 2023 / Published: 28 June 2023

Abstract

:
Ecological challenges resulting from soil salinization in the Tarim River Basin (TRB), exacerbated by climate change and human activities, have emphasized the need for a quick and accurate assessment of regional ecological environmental quality (EEQ) and driving mechanisms. To address this issue, this study has developed a remote-sensing ecological index with salinity adaptability (RSEISI) for EEQ assessment in the Tarim River Basin by integrating the comprehensive salinity index (CSI) into the remote-sensing ecological index (RSEI). The RSEISI enhances the sensitivity of soil salinity and characterizes the surface features of arid regions, thus expanding the applicability. Then, we used time-series analysis methods and a geodetector to quantify the spatial temporal trends and driving factors of EEQ in the TRB from 2000 to 2022. The results show that the RSEISI with salinity adaptation effectively monitors the EEQ of the TRB. The EEQ of the TRB displayed the situation of oasis expansion, desert deterioration, and glacier melting, and the multiyear average EEQ grades were dominated by medium and poor grades in desert and saline areas, while medium, good, and excellent grades were concentrated in oasis and mountainous areas. Looking at the trend of change in conjunction with land-use types, the EEQ of the TRB showed a mild degradation trend mainly in unused land, followed by a mild improvement trend in cropland and grassland. The Hurst index indicated that the EEQ of most areas of the TRB will improve in the future. Soil type, land use, precipitation, and temperature were considered to be key factors affecting the EEQ across the TRB, and changes in the EEQ were found to be the interaction of multiple factors. This study may provide innovative concepts and methodologies, scientific and technological support for ecological management, and green development models in the northwest arid zone.

1. Introduction

As climate warming and human activities intensify, ecological and environmental problems have been gradually threatening regional ecological security and sustainable socio-economic development [1,2,3]. Ecological environmental quality (EEQ) is a comprehensive manifestation of ecological elements, structures, and functions, serving as an indicator of the ecosystem’s suitability for human survival and socio-economic development [4,5]. High-quality ecological environments represent a prerequisite for human survival and a tangible requirement for socio-economic development [6]. Given the northwestern arid region’s ecological fragility, there is an urgent need to carry out comprehensive EEQ monitoring research that identifies spatial temporal trends and patterns. This monitoring aims to develop policies and actions that protect, restore, and enhance the ecosystem’s carbon sequestration capacity [7].
Remote-sensing technology has emerged as a pivotal tool for both monitoring and conducting research on EEQ [8]. Previous studies have sought to characterize distinct aspects of ecological environments by relying solely on individual indicators, such as the normalized difference vegetation index (NDVI) [9], surface temperature (LST) [10], and others. The ecosystem is complex and is influenced by multiple factors. Remote-sensing evaluation methods based on a single monitoring indicator cannot fully capture systematic changes in EEQ. The Ministry of Ecology and Environment has proposed an ecological index (EI) for evaluating EEQ levels in China, based on five distinct aspects: biology, vegetation, hydrology, land, and pollution. However, the EI only provides an overview of the ecological status of an area, lacking detailed descriptions of the local distribution of different environmental conditions.
Xu et al. developed a remote-sensing ecological index (RSEI) by combining EI with remote-sensing data and implementing principal component analysis (PCA) to incorporate measurements of vegetation vigor, soil moisture, aridity, and temperature [2]. The RSEI has shown an ability to surmount the difficulties in the spatial visualization of environmental indices and mitigate the impact of human factors on evaluation precision. The indicators used by the RSEI can be obtained and calculated easily without arbitrary weighting or threshold settings, making it an efficient and effective method for monitoring EEQ, as demonstrated by successful applications in many studies [11,12,13]. However, the preliminary development of the RSEI focused on assessing urban ecological conditions, which may not be fully applicable to the EEQ monitoring of arid regions. Arid environments have distinct characteristics, including limited precipitation, a dry ground surface with relatively low vegetation cover, significant temperature fluctuations, expanded saline land areas, and the irrational use of water resources. Wang et al. [14] constructed a drought remote-sensing index for EEQ monitoring in the Central Asia Aral Sea Basin by incorporating land-degradation indicators. Bai et al. [15] developed an enhanced ecological index for remote-sensing applications in arid areas by integrating desertification and salinity indicators. These studies have shown that the improved index is more applicable to arid regions. Researchers tend to suggest enhancements to the RSEI based on practical needs, meeting the real needs of practical usage.
Since the 1950s, the reckless exploitation of water and soil resources in the TRB has caused significant degradation in the ecological environment. As a result, the downstream section of the TRB has been plagued by a range of ecological and environmental issues, such as river breaches, deforestation in arid regions, and soil salinization [16,17,18,19]. Even in regions with abundant water resources, unsuitable irrigation practices and inadequate infiltration-regulation measures have caused secondary soil salinization, further exacerbating ecological instability in the TRB. To address these issues, the Ecological Water Diversion Project (EWDP) was initiated in 2001, with the aim of rehabilitating the ecological habitat of the lower Tarim River. This ambitious endeavor is a rare example of ecological restoration under human intervention, and it has the potential to bring far-reaching positive effects to the area [20,21]. The implementation of these measures and policies has shed light on the dynamic interplay between ecological instability and its underlying causes in the TRB, capturing the attention of national and local authorities. Current efforts are focused on identifying the changing patterns in the ecological environment of the TRB and determining their underlying drivers [22,23,24]. Wang et al. [25] studied EEQ changes over the last two decades by calculating the RSEI at five time points. Zhang et al. [23] analyzed the changes in oasis dynamics in the TRB of northwestern China during 2018–1990. At present, information on ecological indicators in the TRB is not yet abundant, and a site-specific and systematic evaluation system is needed.
Against the background that the evaluation system of EEQ in the TRB requires improvement, this study uses the Google Earth Engine (GEE) to develop a remote-sensing ecological index with salinity adaptability (RSEISI). The primary objectives are (i) to widen the applicability of the original RSEI in the northwest arid region, (ii) to fully consider the significant impact of soil salinization on EEQ by utilizing the RSEISI to examine the spatiotemporal variations of EEQ in the TRB region from a plateau-oasis-desert perspective, and (iii) to determine the drivers of EEQ evolution. Through the RSEISI, we propose a method to identify the ecological condition dynamics more finely and provide a theoretical basis and methodological reference for ecological management and restoration in the northwest arid region.

2. Materials and Methods
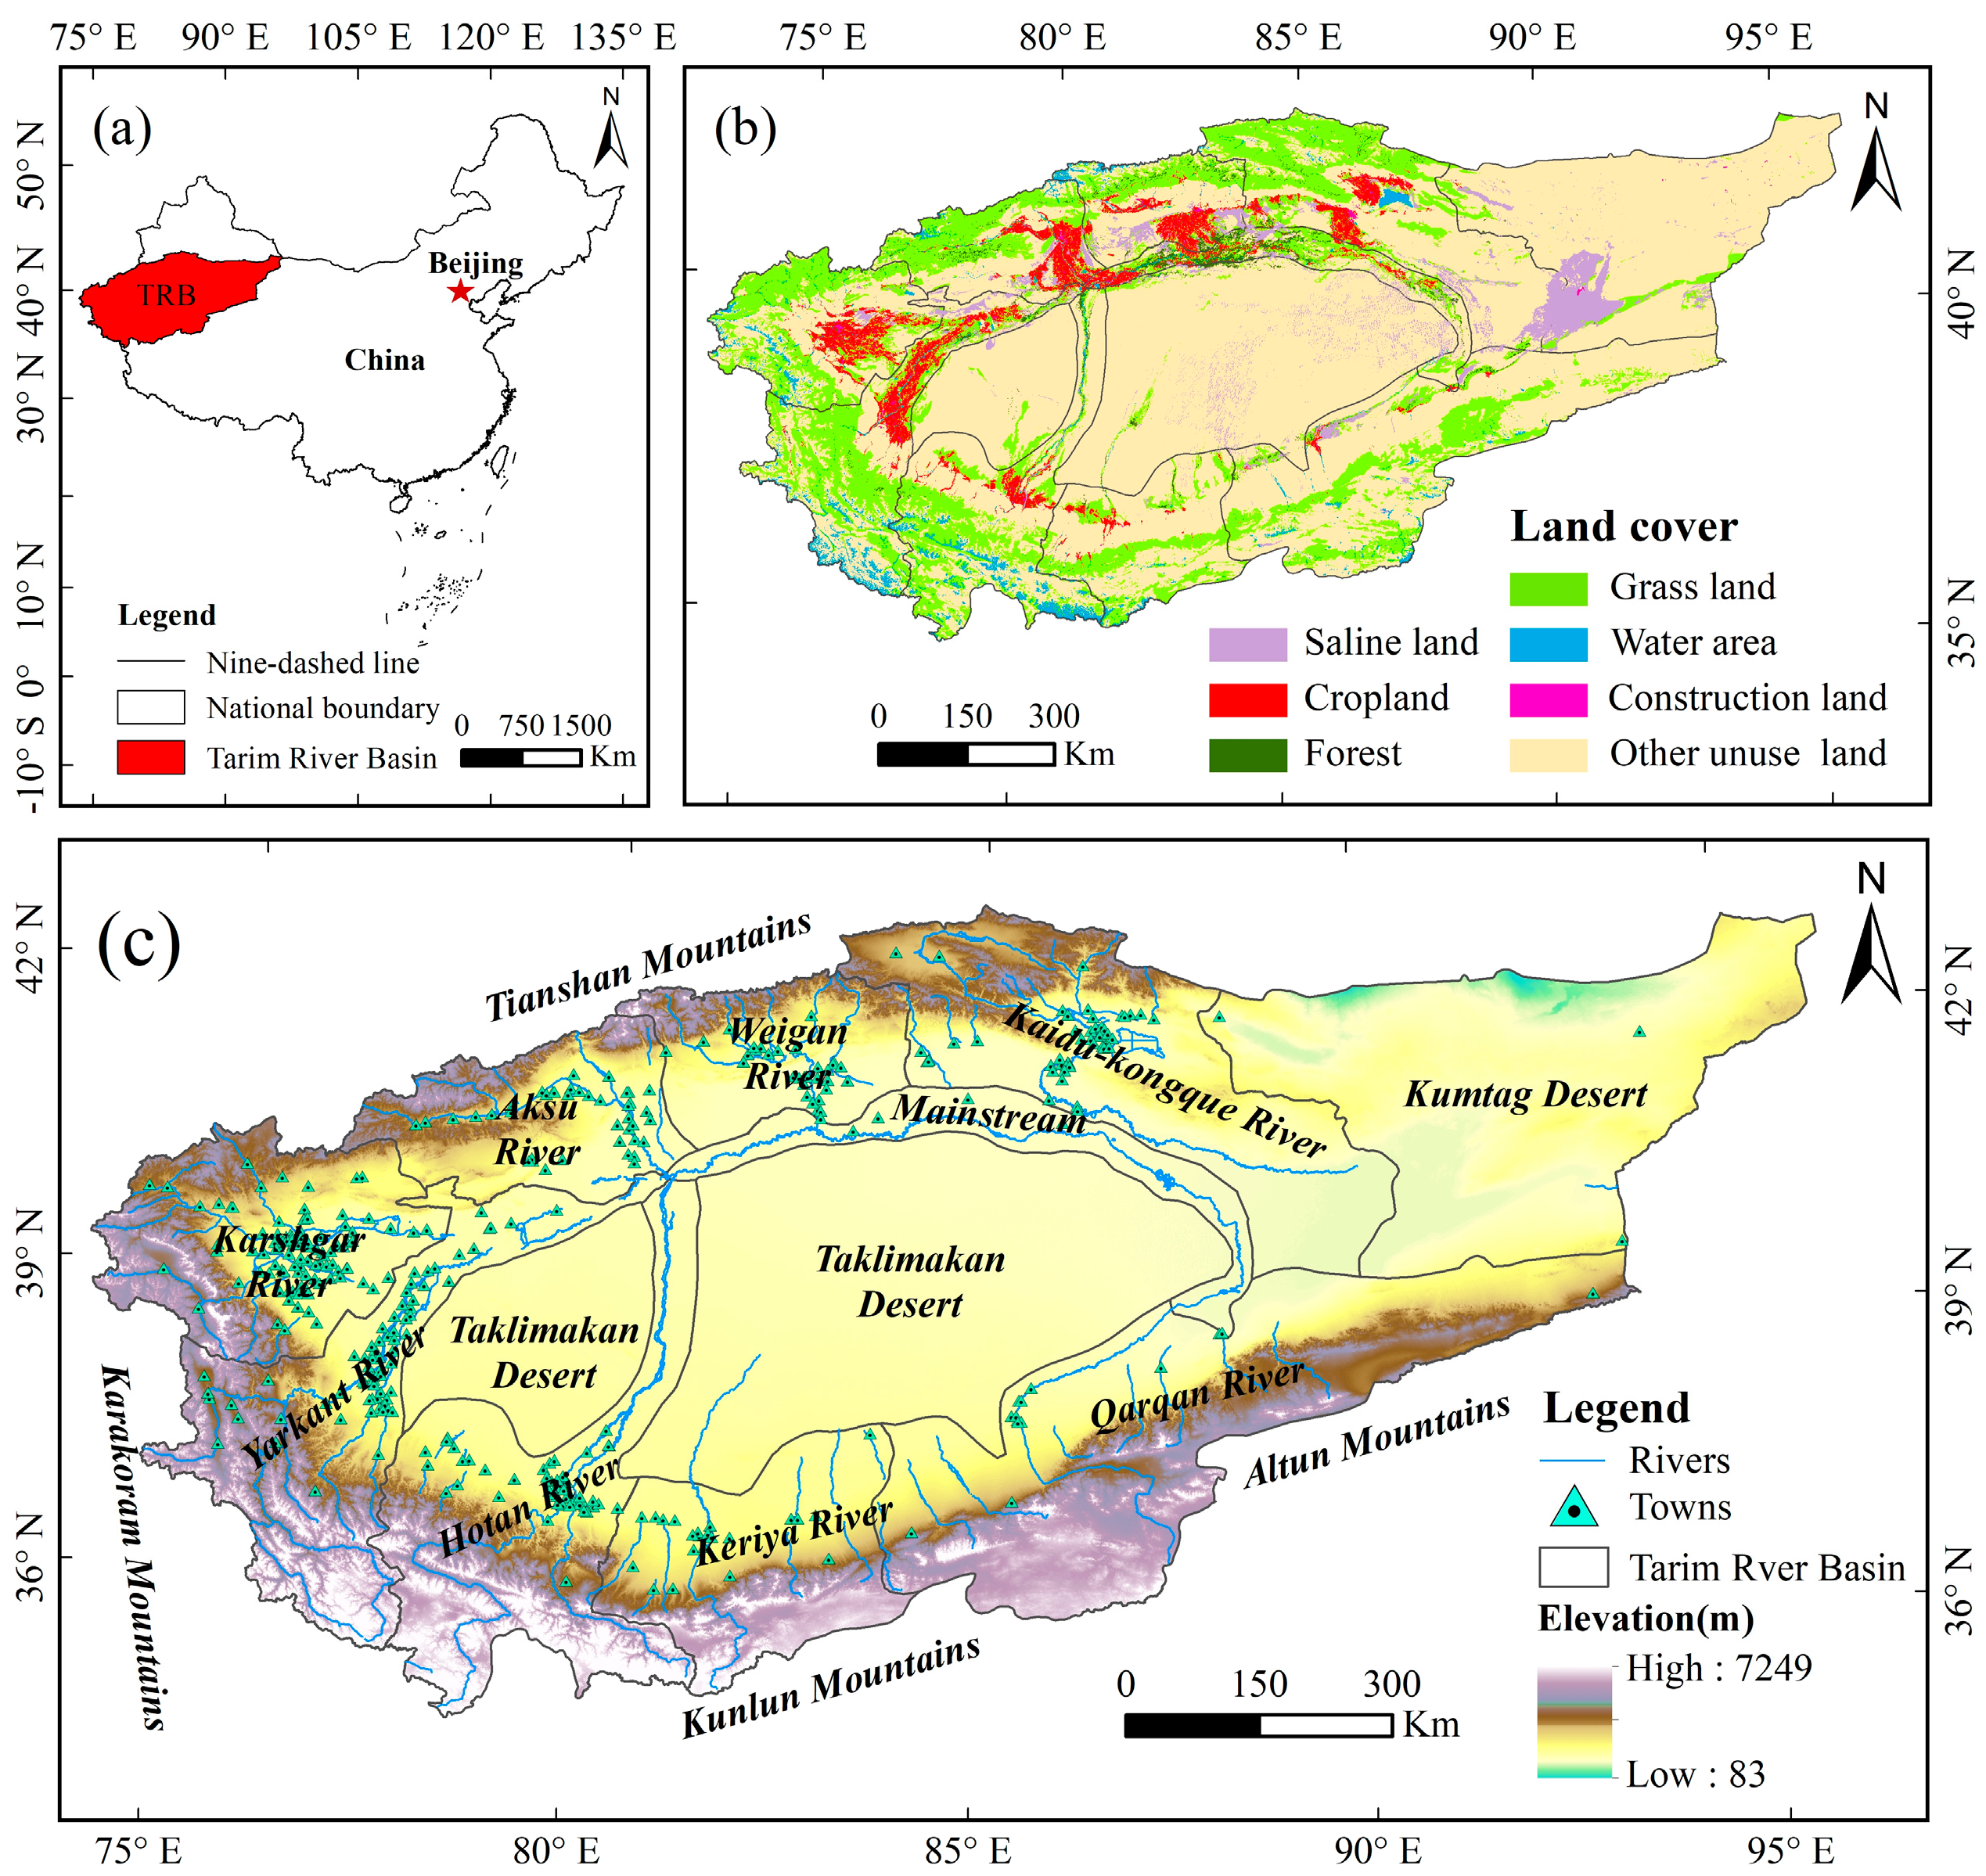
2.1. Study Area

The TRB, located in the southern part of China’s Xinjiang Uyghur Autonomous Region, is the largest inland river basin in China (Figure 1a). The topography and geographical location of the TRB contribute to its dry and arid nature, with an average annual precipitation of lower than 60 mm, an evaporation potential of up to 2000–3000 mm, and a typical temperate arid continental climate [22]. As a consequence, it experiences a gradually deteriorating ecological state and sluggish urbanization dynamics. In the TRB, the dominant land-use types are unused land (grassland and cropland) (Figure 1b), with vegetation densely distributed in oasis areas and elevated mountains, as well as in narrow riparian regions. Vegetation is an important indicator of environmental stress, and poplar is widely distributed in the northwestern arid region due to its strong drought- and salt-tolerance characteristics. The extremely arid background of the TRB and the extensive distribution of saline lands determine that the basin is currently the largest natural poplar forest distribution area in the world, comprising 55% and 90% of the world’s and China’s poplar forests, respectively [26].
The study area comprises mountains, oases, and deserts, located between the Tianshan Mountains, the Karakoram Mountains, the Kunlun Mountains, and the Altun Mountains. The sub-basins include nine water systems, including the Aksu River, the Kashgar River, the Yarkant River, the Hotan River, the Kaidu–Kongque River, the Weigan River, the Keriya river, the Qarqan river, and the main stream (Figure 1c). The TRB is a crucial component in the construction of the Silk Road in China, and monitoring its ecological and environmental quality is vital for China’s western development strategy [20,27].

2.2. Data Resource and Pre-Processing

This study employed the relevant standard products from the MODIS product library as the primary data source. The NASA Land Processes Distributed Active Archive Center (LPDAAC) collections of the USGS provided standard data products for the different application scenarios based on Level 1B data. The RSEISI incorporated several components, such as the enhanced vegetation index (EVI), the wet component (WET), the normalized differential build-up and bare soil index (NDBSI), the surface temperature (LST), and the comprehensive salinity index (CSI). The EVI was extracted from the MOD13A1 V6 image set in the vegetation indices product. The LST was extracted from the MOD11A2 V6 image set in the land-surface temperature and EMISS product. The WET, NDBSI, and CSI indicators were derived from the MOD09A1 image set in the land-surface reflectance product; of these, the WET and NDBSI equations are referenced by Zheng et al. [28], and the CSI equation is proposed by Zhang et al. [29].
The data were pre-processed in two stages: cloud elimination and water-body masking. Firstly, cloud elimination was performed using the quality-assessment band (QA) obtained from MODIS images and the cloud, fire, and smoke mask (CFMASK) algorithm. Secondly, water-body masking was then conducted based on the modified normalized difference water index (MNDWI), introduced by Xu et al. [2]. The RSEISI was calculated using MODIS median synthetic imagery from the 2000–2021 growing season (April–October), and these data were pre-processed and calculated on the GEE platform.
Climate data were obtained from the National Earth System Science Data Center, including precipitation and temperature data (http://www.geodata.cn (accessed on 2 December 2022)). Terrain data including elevation data and land-use and cover data (LUCC), respectively, were obtained from the Geospatial Data Cloud (https://www.gscloud.cn/ (accessed on 1 December 2022)) and the China Land Cover Dataset (https://www.resdc.cn/ (accessed on 14 December 2022)). In accordance with the Current Land Use Classification standard, an evaluation was conducted to categorize the land-use types in the TRB into six distinct categories, namely grassland, forest, cropland, water area, construction land, and unused land. Soil data were obtained from the Harmonized World Soil Database (https://www.fao.org/soils-portal/data-hub/soil-maps-and-databases/harmonized-world-soil-database-v12/en/ (accessed on 28 December 2022)). Urbanization data including gross domestic product (GDP) data and population data (POP) were obtained from the Resource and Environmental Science and Data Center (https://www.resdc.cn/ (accessed on 1 December 2022)) and LandScan Global Population Data (https://landscan.ornl.gov/ (accessed on 2 December 2022)). To facilitate analysis, these data were resampled to a 1 km × 1 km resolution.

2.3. Methodology

2.3.1. Calculation of the RSEISI

The unique geography of the arid region restricts the applicability of the RSEI due to the high exposure of the surface and the severe water scarcity, low vegetation density, extensive bare soil and sandy land types, and significant soil salinization in the TRB. To address these limitations and enhance the accuracy of the RSEI in monitoring the EEQ of the TRB, a salinity indicator was added to the RSEI in this study. This modification enables the RSEI to provide a more comprehensive evaluation of the spatial temporal evolution of the EEQ in the TRB of the northwest arid region.
In choosing the indices, we used the EVI as the greenness ecological component to improve the algorithm and synthesis method of the vegetation index to compensate for the deficiency of the NDVI’s easy saturation [28]; in previous studies, the wetness component of the RSEI was characterized using the wet component of the Kauth Thomas (K–T) algorithm to transform multispectral images [2,30]; the MODIS surface-temperature product was used to obtain a stable surface temperature (LST) and was suitable for characterizing the ecological component of heat over a large area [29]. The bare soil index (BI) and the building index based on urban building conditions (IBI) were averaged to synthesize the NDBSI, which is a good representation of the dryness component [13,28]. In order to accurately reflect the salinity component on a large scale, the CSI was applicable in arid areas; the CSI has a high degree of universality and was selected by referring to relevant studies [29]. The EVI, WET, LST, the NDBSI, and the CSI were used to characterize the five ecological components (greenness, wetness, heat, dryness, and salinity), respectively, to construct the RSEISI [28,29]. The process of RSEISI calculation involves the following: (i) standardizing the four indicators; (ii) calculating the principal components of the five indexes and selecting the first principal component (PC1) as the initial RSEISI (RSEISI0); and (iii) standardizing the initial RSEISI (RSEISI0). The RSEISI was calculated according to Equations (1) and (2) as follows:
RSEI SI = 1 RSEI SIO
RSEI SIO = PC 1 f EVI , NDBSI , WET , LST , CSI
The RSEISI serves as an ultimate indicator of ecological health, with values ranging from 0 to 1. In the RSEISI model, higher values indicate better EEQ levels, while lower values indicate poorer EEQ levels. This helps to provide an accurate picture of the ecological status of the TRB. The RSEISI values were further categorized into five grades spanning 0.2 intervals each, including poor (0 < RSEISI ≤ 0.2), fair (0.2 < RSEISI ≤ 0.4), moderate (0.4 < RSEISI ≤ 0.6), good (0.6 < RSEISI ≤ 0.8), and excellent (0.8 < RSEISI ≤ 1) [2]. To further obtain the dynamics of the RSEISI using change vector analysis [12,13,30], the RSEISI values for different years were comparatively analyzed and divided into five categories: significantly degraded, mild degraded, unchanged, mild improved, and significantly improved.

2.3.2. Mann-Kendall Mutation Test

The Mann–Kendall mutation test is a well-established non-parametric statistical method that is widely utilized to analyze trends in hydrological and meteorological station data. One of the strengths of this test is that it is less sensitive to outliers, contributing to its popularity. Mean RSEISI values are often used to determine the general trend of regional ecological changes; thus, this study conducted a non-parametric test on the mean series of the RSEISI for 23 years of the TRB to obtain the ecological mutation points for long-term series data [30].

2.3.3. Time-Series Variation in Annual Average RSEISI Values

In this study, three distinct time-series analysis approaches were employed to investigate the stability, trends, and sustainability of the EEQ in the TRB from 2000 to 2022. These methods include the coefficient of variation (CV), temporal information entropy (E), and the Hurst exponent (H).
(i) The CV was used to assess the stability of the EEQ, as it indicates the variability in the time-series data. A low CV value suggests that the data are relatively stable, while a high CV value indicates greater variability and instability in the data [31]. To access the interannual fluctuations in the RSEISI, we utilized the CV and categorized values exceeding 0.20 as a “high variation”, 0.150–0.200 as a “relatively high variation”, 0.100–0.150 as a “medium variance”, 0.050–0.100 as a “relatively low variance”, and 0.000–0.050 as a “low variance” [29,32].
(ii) Information entropy serves as a quantitative metric for evaluating the diversity and volume of information generated from a source of either discrete or continuous information [33]. This analytical tool is commonly employed within the fields of ecology and geography [34]. In this study, both temporal information entropy (E) and time-series information entropy (E’) were utilized to capture the spatial and temporal characteristics of the ecological environment. E was leveraged to gauge the intensity of change, while E’ was employed to ascertain the trend of change. Together, these metrics highlighted the degree of fluctuation and the direction of change exhibited by environmental elements over the study period. We combined the characteristics of MODIS remote-sensing data sources and used the E and E’ methods to quantitatively and objectively characterize the intensity and trend information of the spatial temporal variation in the EEQ of the TRB by using the RSEISI for long-term series data. A higher value of E reflects a greater intensity of change in the EEQ over the period, while the opposite is true for a lower intensity of change. The calculations and explanations, given in Equations (3)–(5), are as follows [35]:
E = 1 n i = 1 n l o g 2 y i + m y i m c i × m × Δ n
c i = 1 + i 1 m , 1 i m 2 , m + 1 i n m 1 + n i m , n m + 1 i n
y i m = y 1 , i m y i + m = y n , i n m
In the above formulae, y 1 y 2 y n is the observed value of the image element at different times x 1 , , x n in descending order ( x i is the RSEISI value of any year of the image element). m is the “temporal frequency” factor; choosing different values of m (where m is a positive integer not exceeding n 2 ) can reflect the changes in the object of study on different time scales. Δ is the “scaling factor” which represents the standardization of different data sources to ensure the calculated results are comparable.
Referring to the classification standard of Zhao et al. [36], the EEQ trend results obtained by superimposing E and E’ were classified into five classes using the natural break-point method: strong improvement, weak improvement, unchanged, weak degradation, and strong degradation, as shown in Table 1.
(iii) The Hurst exponent, which captures the autocorrelation patterns within a time series, presents an effective tool for predicting future trends in the EEQ of the TRB [37]. Its value ranges from 0 to 1. When 0 < H < 0.5, the time series exhibits anti-sustainability characteristics, and the smaller the value, the stronger the anti-sustainability. When H = 0.5, there is no long-term correlation for the EEQ. When 0.5 < H < 1, the time series exhibits a persistent long-term correlation, and the higher the value, the stronger the persistence [7,29]. The future trend of the EEQ was analyzed by superimposing the trend levels of the Hurst index and the RSEISI. We classified the future trends of the EEQ according to the classification criteria of Zhang et al. [38] as shown in Table 1.

2.3.4. Geographical Detector

Geodetectors, a statistical technique utilized to identify and assess spatial heterogeneity, have been widely adopted to uncover the underlying factors and mechanisms driving spatial patterns [39]. In this paper, we used a geodetector to quantify the driving mechanisms of EEQ variability, and Wang et al. [40] have published a detailed description of the geodetector.

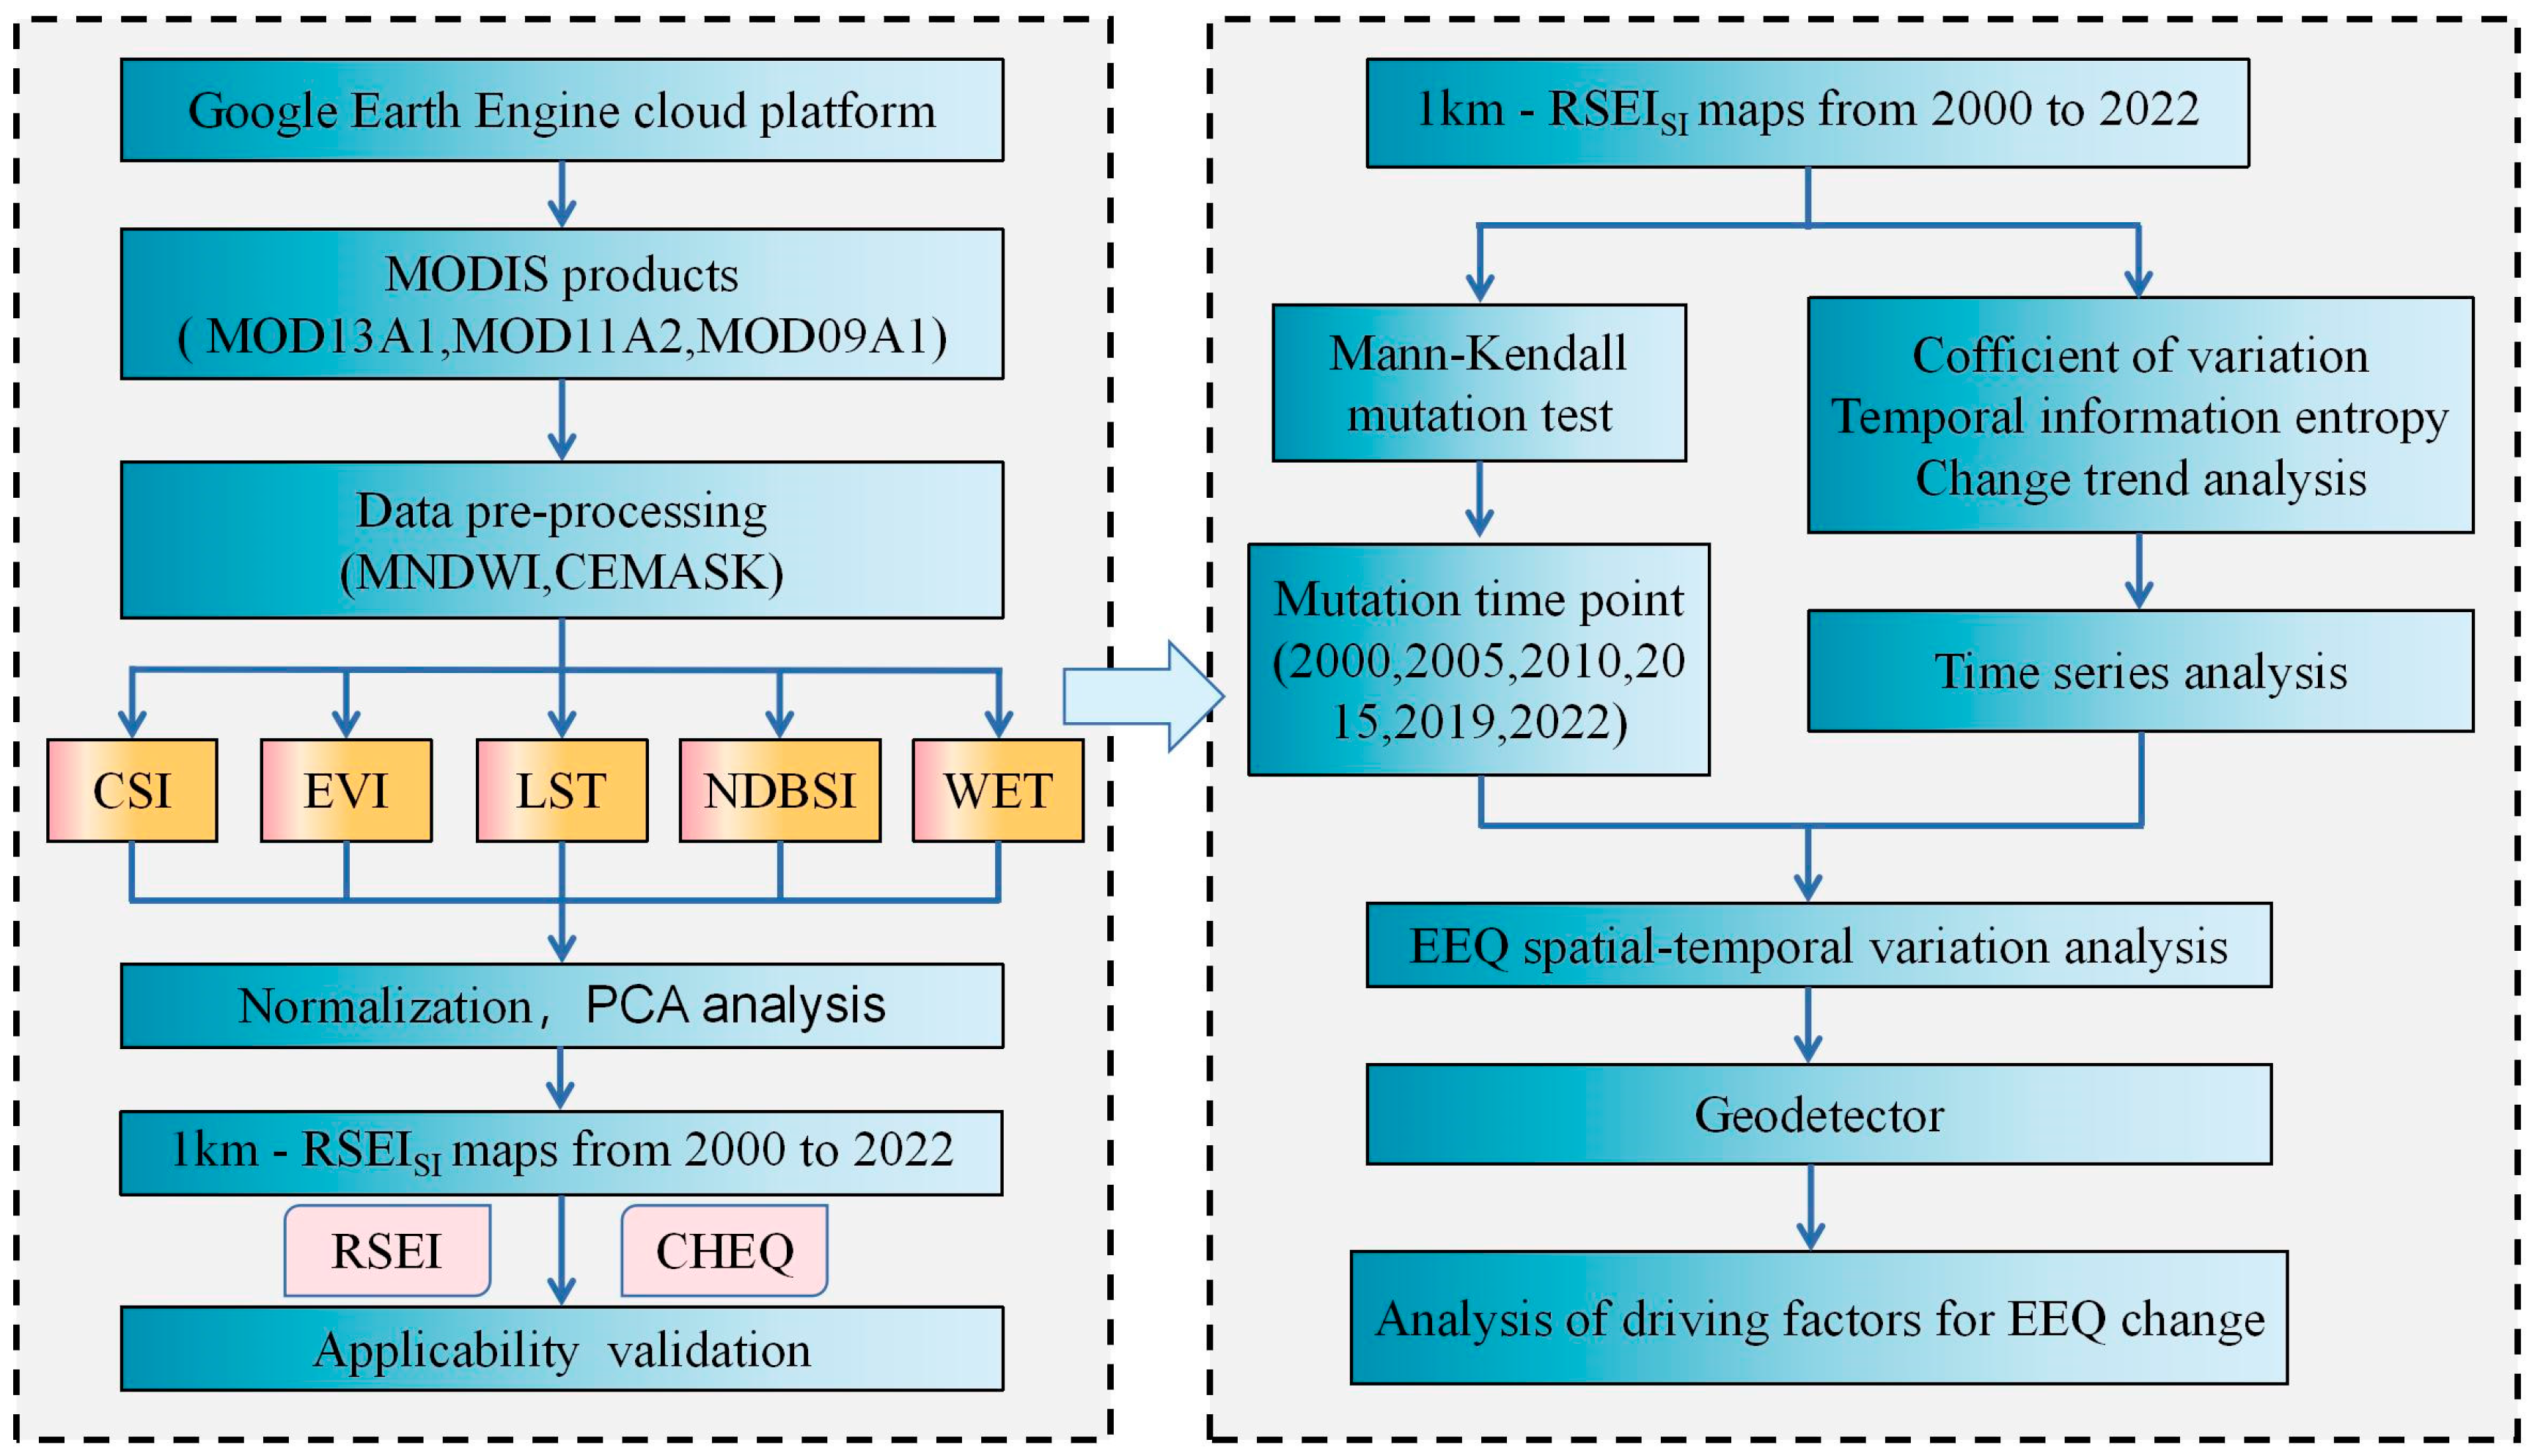
2.3.5. Processing Flow

A flow chart of the ecological environment dynamic monitoring and driver analysis is shown in Figure 2.

3. Results

3.1. RSEISI Construction and Representative Validation

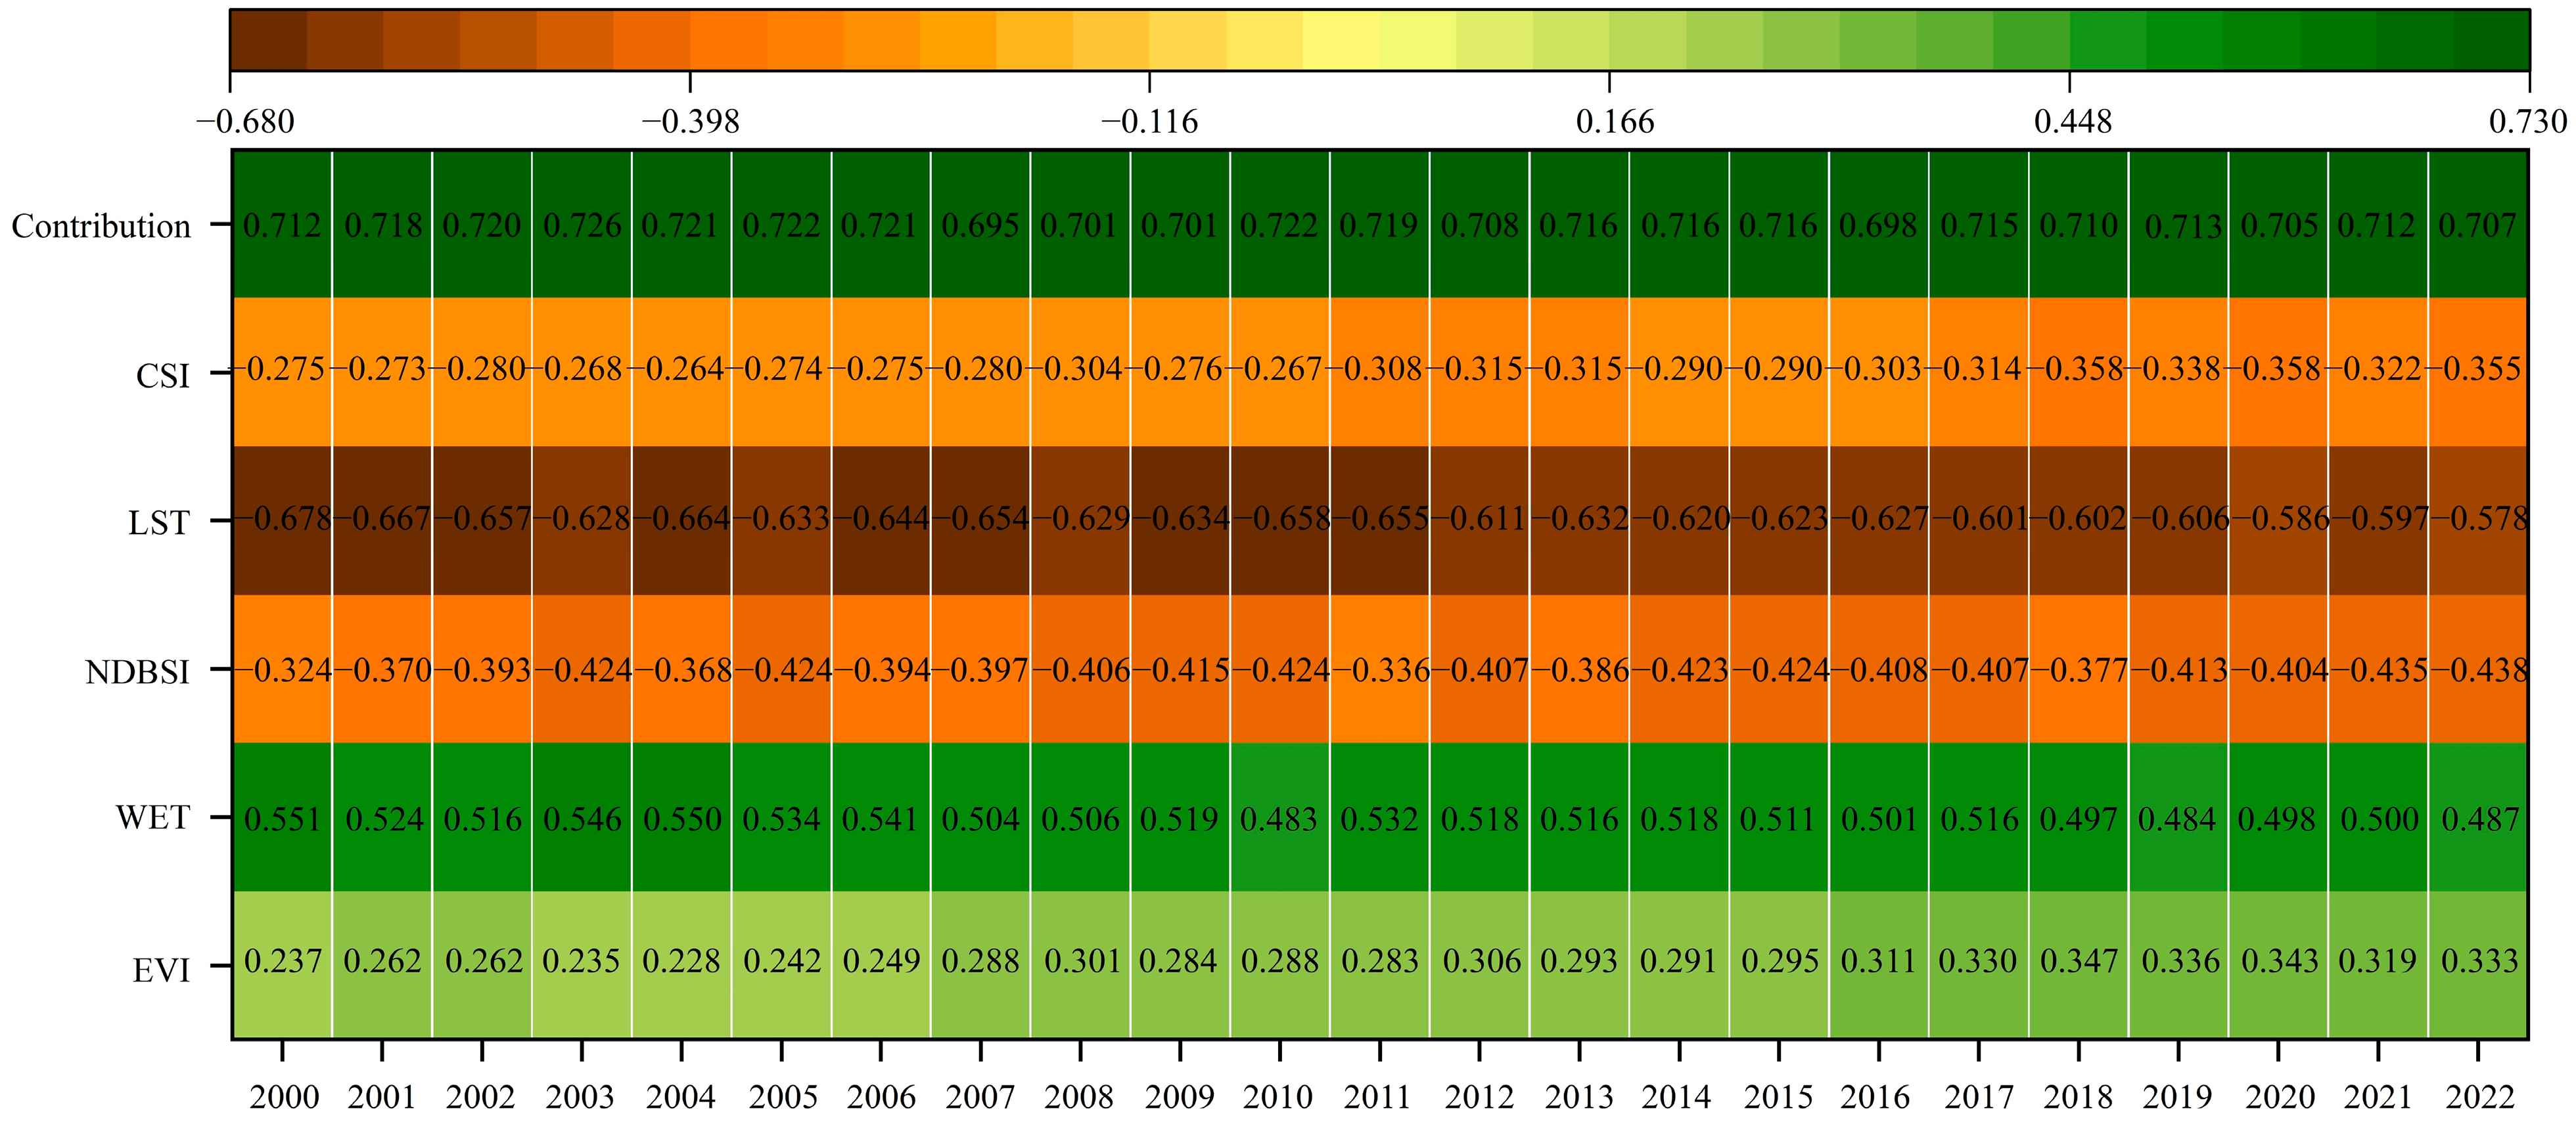
3.1.1. Principal Component Analysis of Five Indicators

The normalized values of five ecological indicators, including the EVI, WET, NDBSI, LST, and CSI from 2000 to 2022, were subjected to principal component analysis (PCA). The analysis revealed that the first principal component, PC1, made a significantly greater contribution than the subsequent components. The loading values of the other principal components for each indicator did not show any specific pattern. Therefore, only results related to PC1 are presented (Figure 3).
(i) In terms of its contribution to the EEQ, the multiyear average of PC1 was 0.713 (71.276%), indicating that PC1 integrates most of the characteristics of the five indicators.
(ii) In terms of the loading values for each indicator in PC1, the EVI and WET had positive loading values, indicating their positive impact on the EEQ. Conversely, the NDBSI, LST, and CSI had negative loading values, suggesting their negative impact on the EEQ. Thus, higher EVI and WET values reflect better vegetation cover and soil moisture, contributing to a better ecological environment. Conversely, higher LST, NDBSI, and CSI values indicate more severe problems such as soil salinization and surface exposure, aligning with objective principles.
(iii) In terms of the ranking of the absolute loading values for each indicator, the five indicators were ranked as follows: LST (|−0.630|) > WET (|−0.515|) > NDBSI (|−0.400|) > CSI (|−0.300|) > EVI (|−0.290|). The total absolute loading values for the LST, NDBSI and CSI were greater than the sum of the WET and EVI. This suggests that an impervious surface heat balance, land exposure, and soil salinity have a more damaging effect than the optimization of vegetation and soil moisture, in line with the fact that about half of the study area consists of hot exposed deserts.

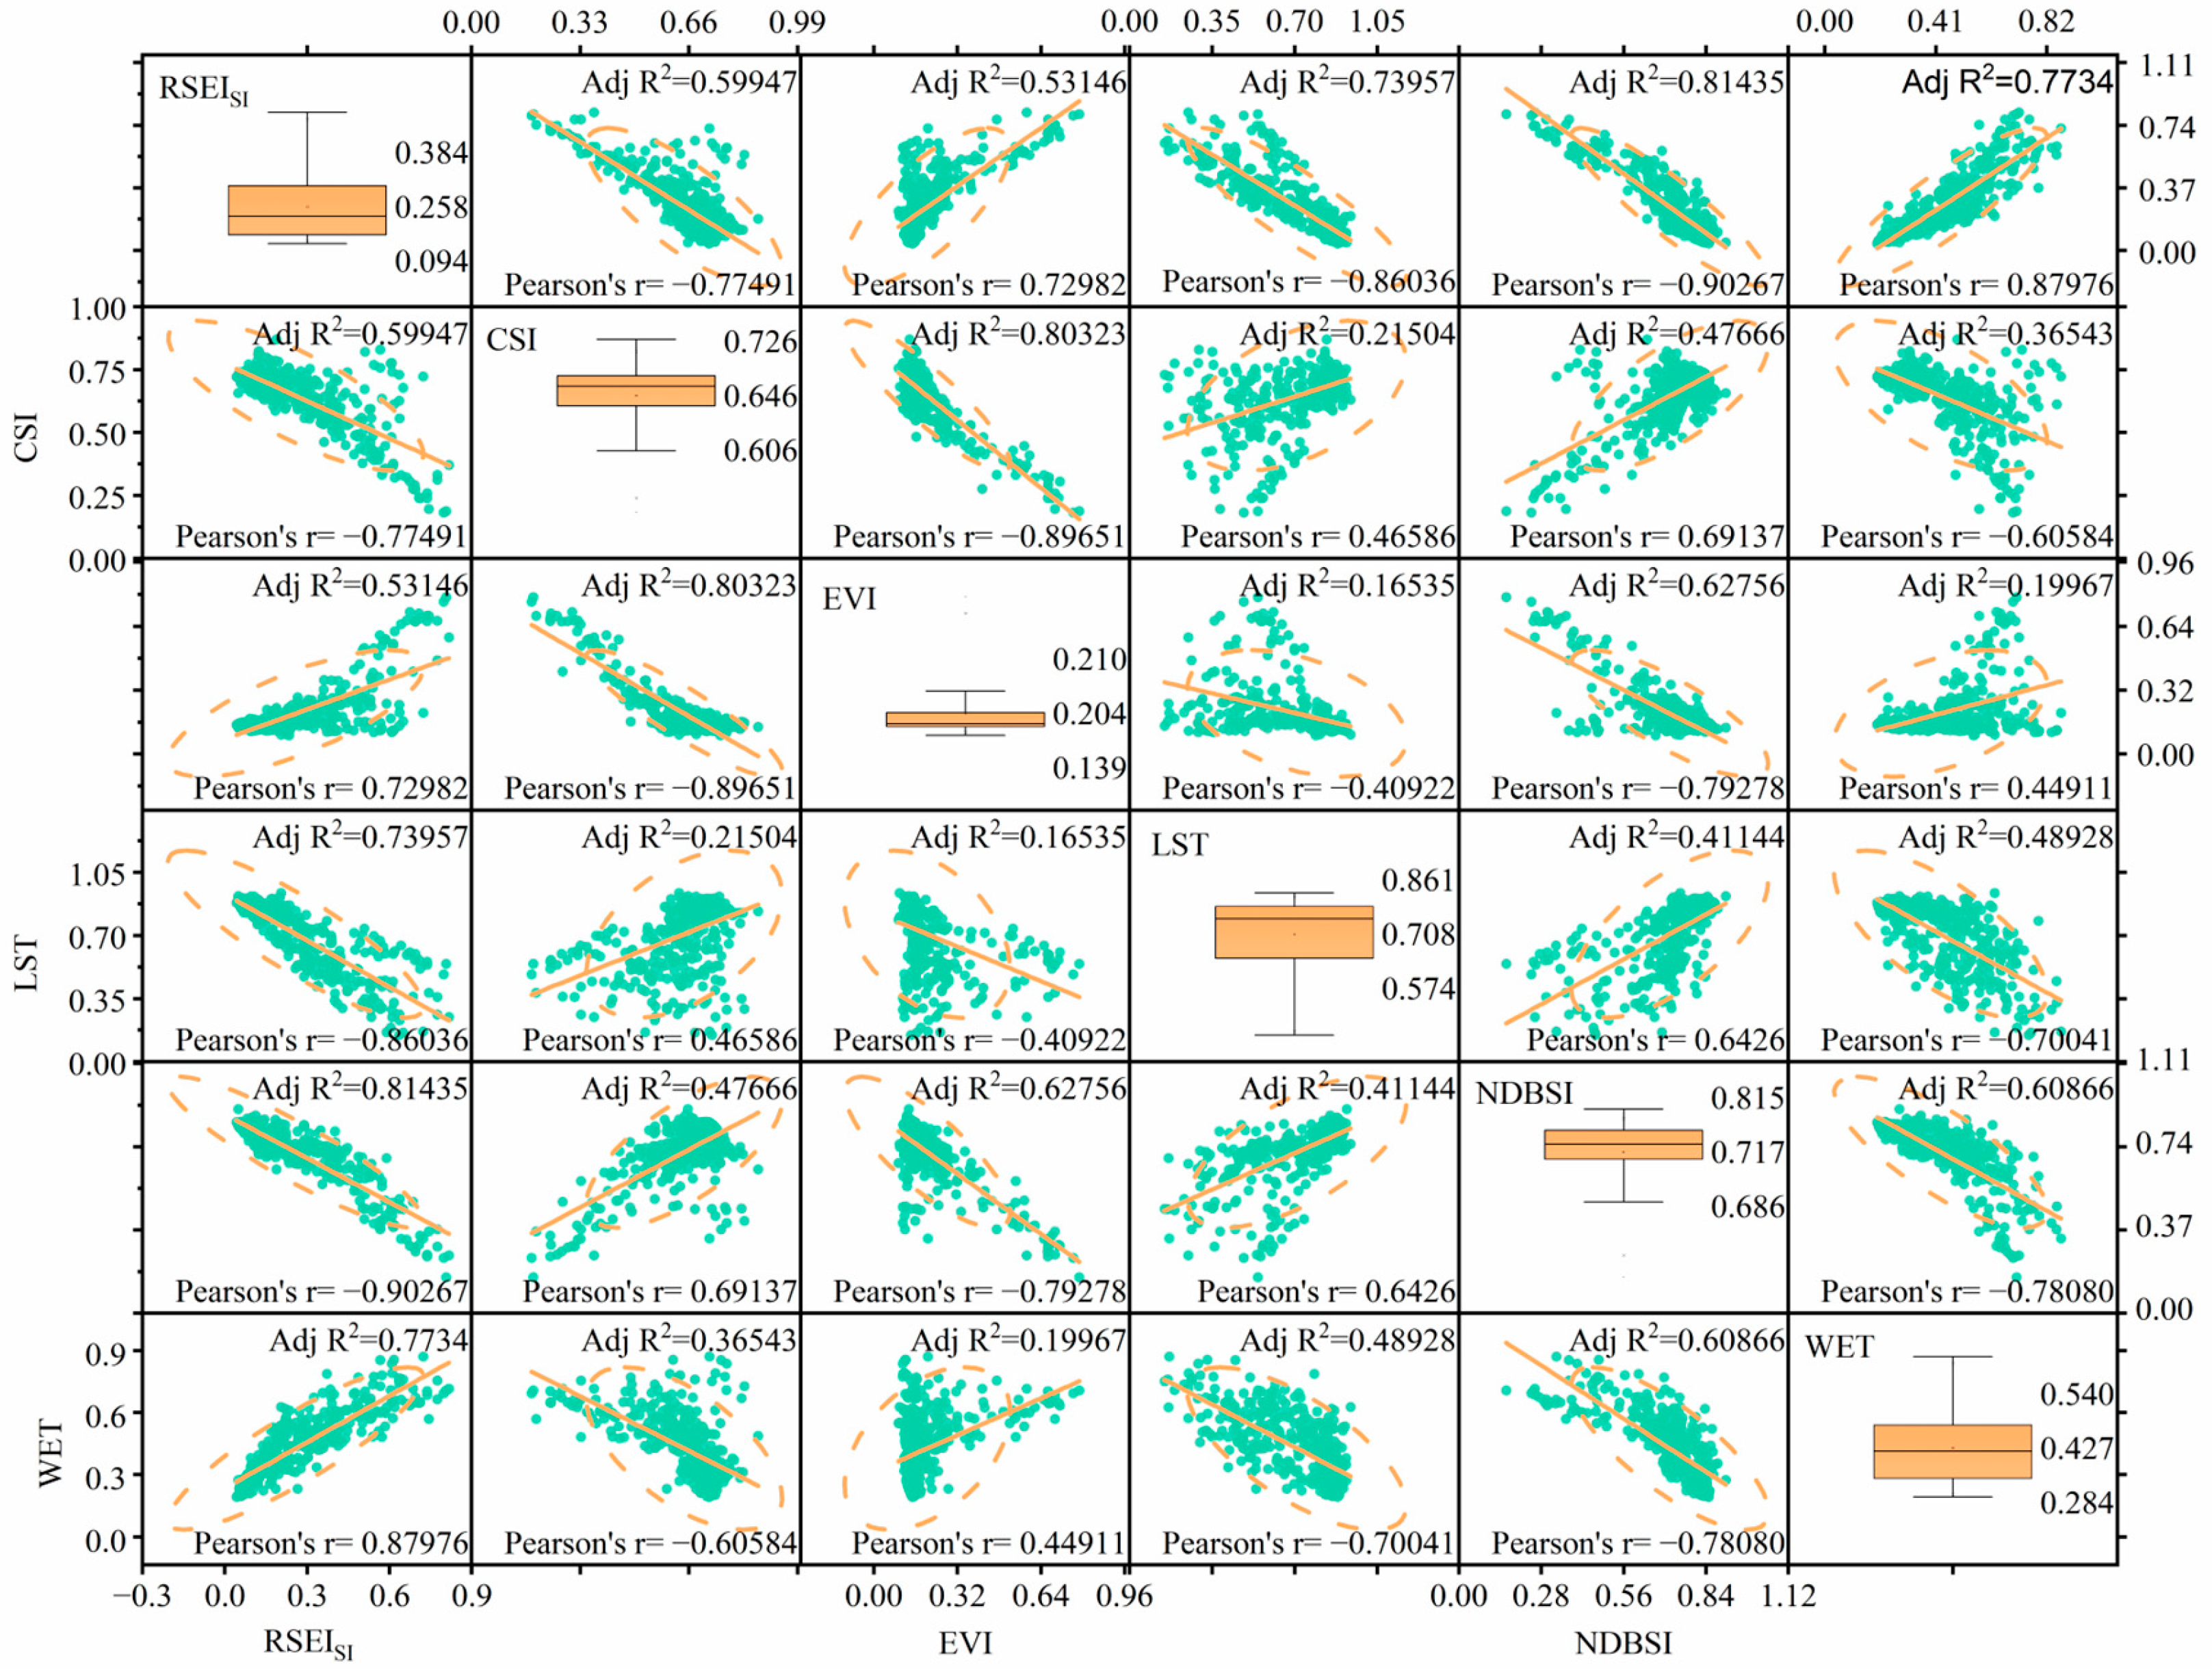
3.1.2. Correlation Analysis between Ecological Indicators

The correlation coefficient measures the closeness of the relationship between variables, and the composite representativeness of the RSEISI based on PC1 can be analyzed using its Pearson correlation with each indicator. As the correlation coefficient approaches one, the magnitude of correlation strengthens, indicating a stronger correlation and the greater composite representation of the RSEISI. The results of the correlation analysis between the RSEISI and each indicator (Figure 4) demonstrate that: (i) the RSEISI was positively correlated with the WET and EVI, and negatively correlated with the NDBSI, LST, and CSI; (ii) the absolute values of the correlation coefficients among the ecological indicators ranged from 0.409 to 0.987, and the absolute correlation between the RSEISI and each indicator varied from 0.730 to 0.903; (iii) among the individual ecological indicators, the NDBSI secured the highest average correlation coefficient of 0.727 among the five indicators. However, the average correlation coefficient between the RSEISI and each individual indicator was calculated to be 0.829, presenting a 12.304% increase in contrast to the NDBSI’s highest correlation co-efficient. This suggests that the RSEISI efficiently integrated the diverse information from each individual indicator. In summary, PC1 can reasonably explain the EEQ of the TRB, and the RSEISI based on PC1 is a reasonable and integrally representative indicator.

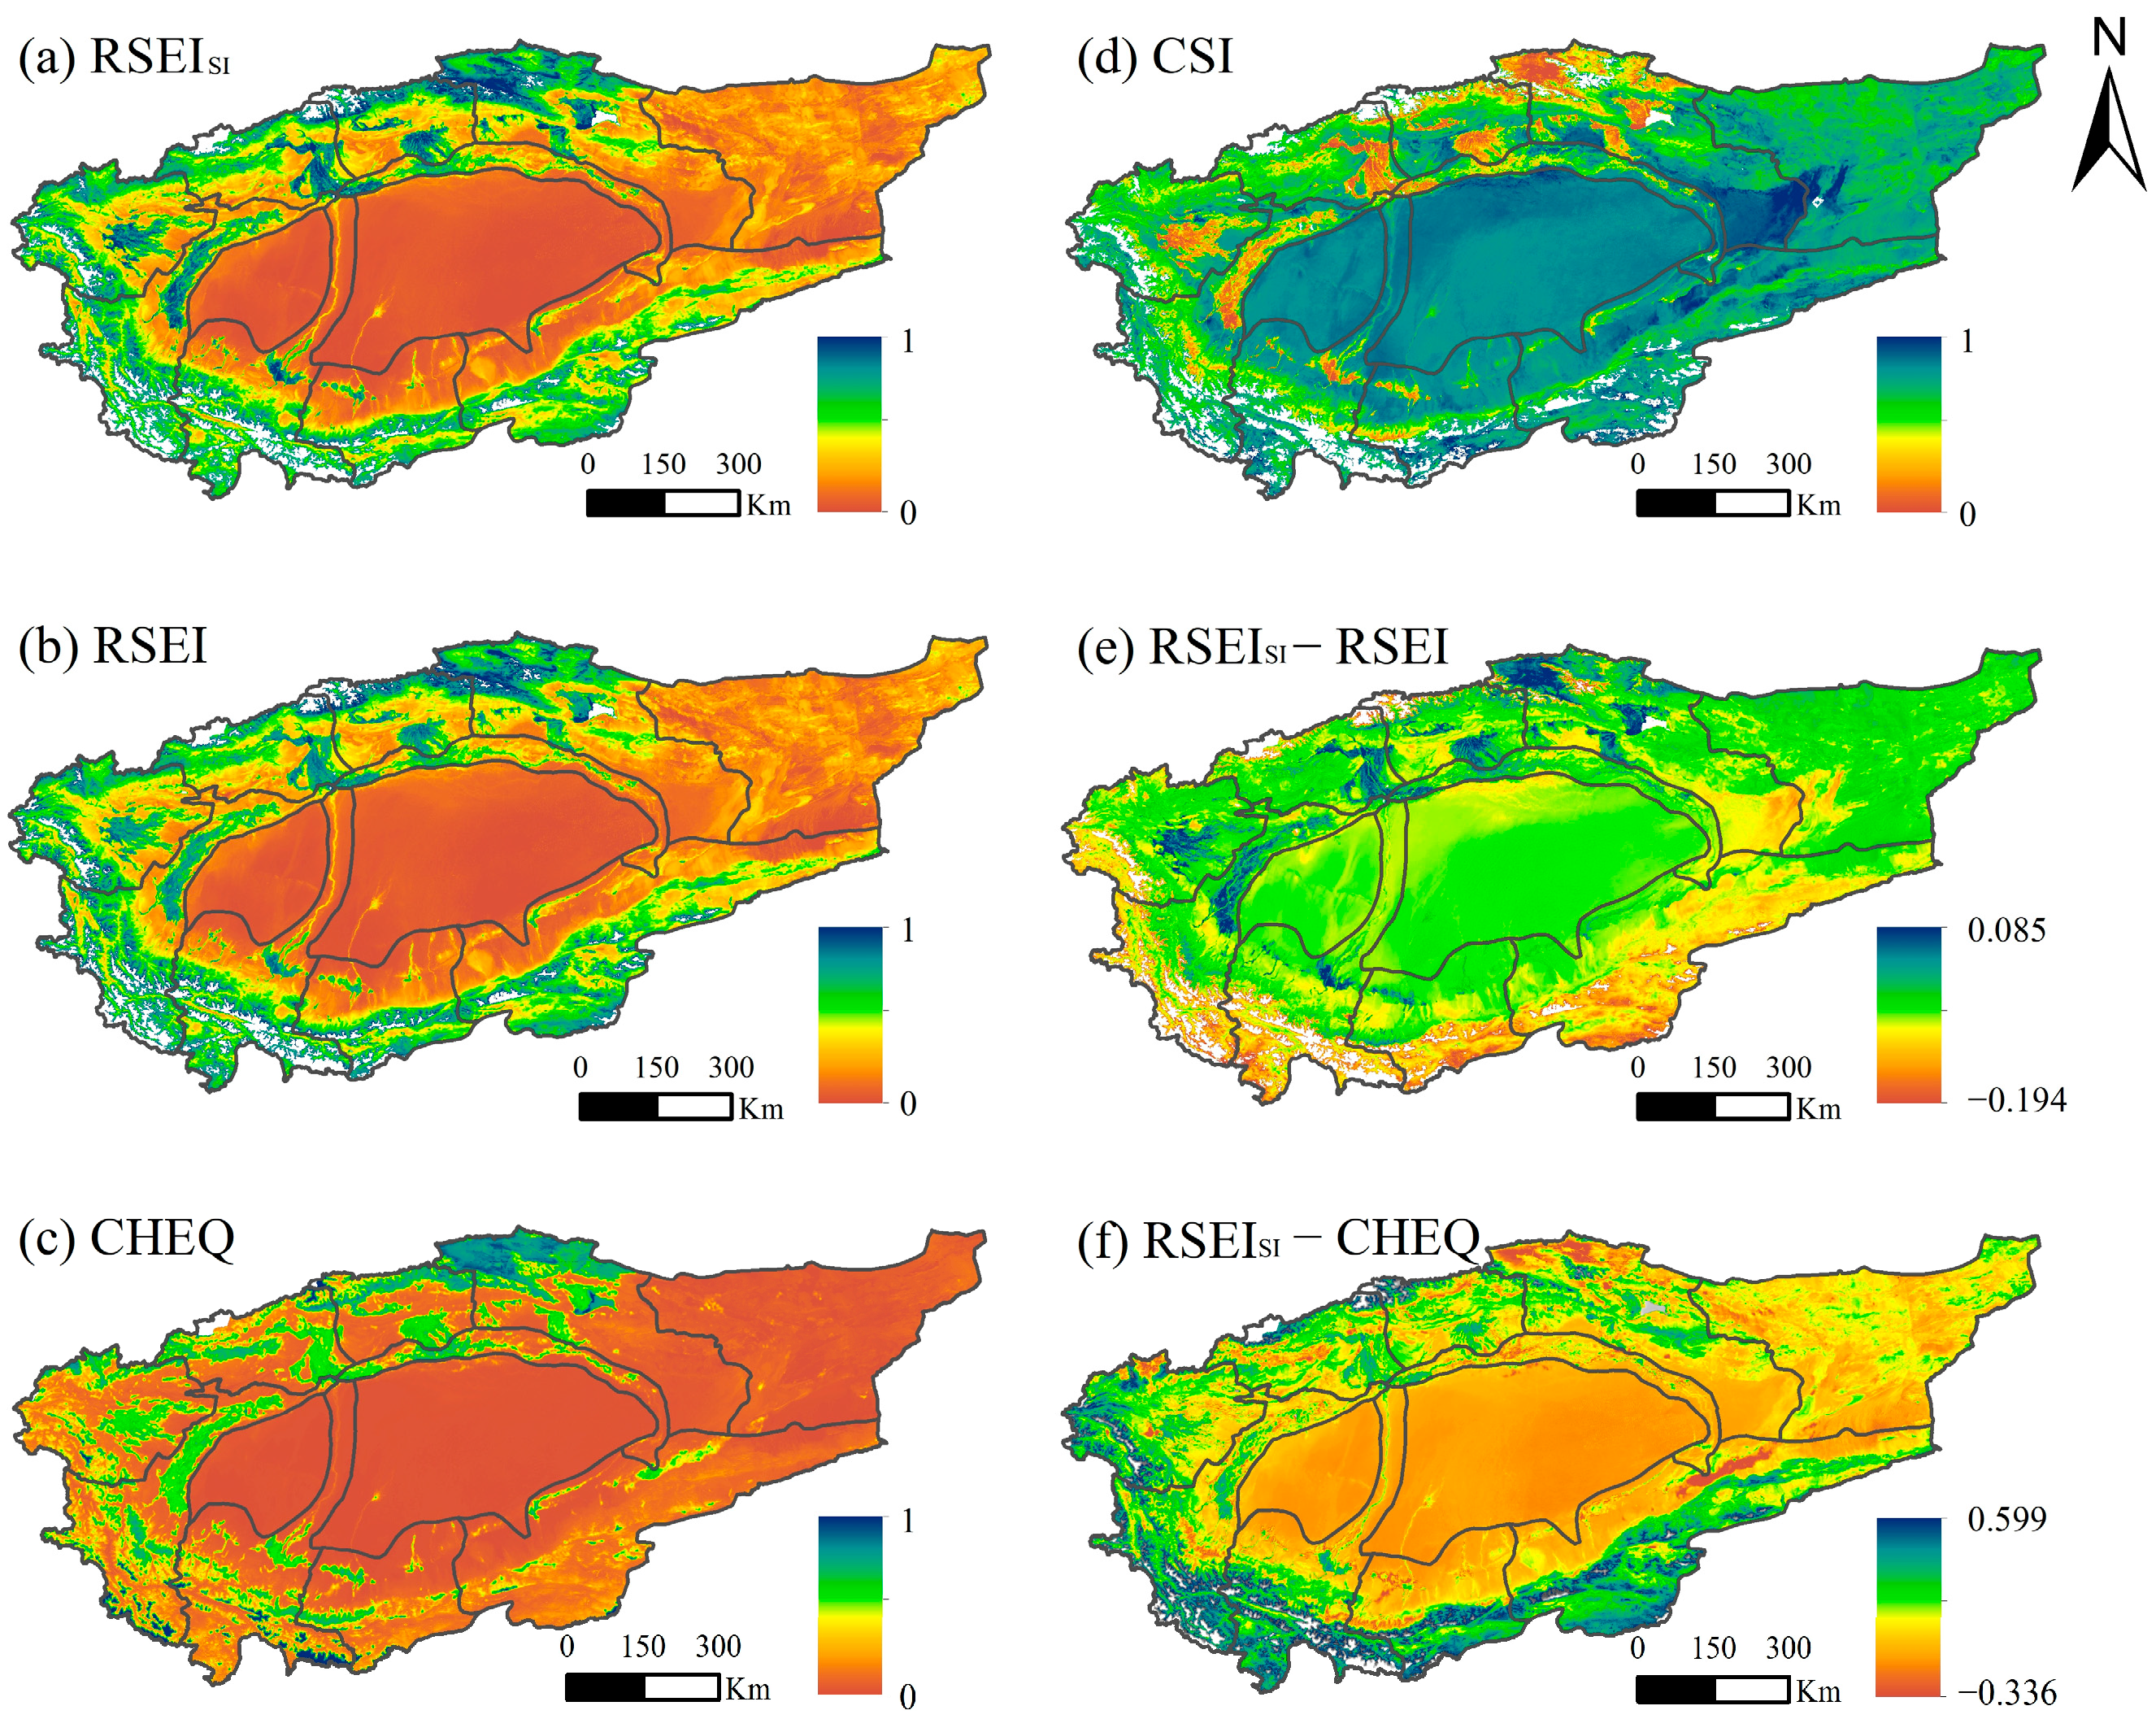
3.1.3. Comparison of RSEISI, CHEQ Datasets, and RSEI

This study utilized China’s high-resolution eco-environmental quality (CHEQ) dataset and the RSEI to perform a comparative analysis of the spatial temporal advantages of the RSEISI. Multiyear mean images of the three datasets from 2001 to 2019 were analyzed and are presented in Figure 5a–c, respectively. Our observations indicate that compared to the CHEQ, the RSEI and the RSEISI exhibit finer texture features in the images. This is because the land-cover classes used by CHEQ for the computation of the abundance index AI are Class I, which cannot accurately determine the differences between the various land-cover classes, such as Gobi and bare rocky gravelly land. Therefore, the differences in EEQ between different classes cannot be adequately represented in the TRB. Given the widespread prevalence of these classes in the TRB, it is imperative to factor in their distinctions for a more precise evaluation of the EEQ.
To illustrate these differences, we estimated the differences between the RSEISI, the RSEI, and CHEQ separately. The results are represented in Figure 5e,f, where positive values indicate that the EEQ of the TRB assessed by the RSEISI is superior to that determined by RSEI and CHEQ. Conversely, negative values indicate the opposite scenario.
Figure 5e shows the distribution of the differences between the RSEISI and the RSEI. The spatial distribution of negative values is consistent with the spatial distribution of the CSI (Figure 5d), which is mainly concentrated in the lower Tarim River, deserts, and saline areas embedded in and around oases. The differences between the two datasets were mainly concentrated in areas of severe salinization, indicating that the combined salinity indicator has a more significant impact on the EEQ of the TRB. In contrast, the RSEI, which does not take salinity into account, produced a significant overestimation for extreme environments with severe salinization.
Figure 5f presents the distribution of the difference between the RSEISI and the CHEQ. The spatial distribution of the positive values was mainly concentrated in elevated mountainous areas, such as the Kunlun Mountains and Altun Mountains, indicating that the EEQ evaluated by the RSEISI in elevated mountains was better than that evaluated by CHEQ. Combined with the actual situation of the TRB, elevated mountainous areas experience more precipitation and a relatively higher vegetation cover, such as grassland, and thus the EEQ is relatively better. However, CHEQ rated the elevated mountains’ EEQ at the same level as the deserts, resulting in an underestimation of the EEQ of the elevated mountains. Conversely, the spatial distribution of negative values was consistent with the spatial distribution of the severity of the CSI (Figure 5d), indicating that the evaluation results were poorer in areas with severe salinization. This suggests that CHEQ also produces a significant overestimation for areas with severe salinization. Therefore, the proposed RSEISI can better reflect the EEQ of the TRB.

3.2. Eco-Environmental Quality Characteristics in the Tarim River Basin

3.2.1. Characteristics of the Total Tarim River Basin

Figure 6 depicts the spatial temporal dynamics of the RSEISI over the past two decades (2000–2022) across the TRB, illustrating that the composite EEQ in this region is temporally unstable and spatially heterogeneous.
Figure 6a–w show that regions exhibiting elevated RSEISI levels (RSEISI > 0.5) are chiefly concentrated within agricultural oases and elevated mountainous areas, whereas regions featuring reduced RSEISI levels (RSEISI < 0.5) are mainly located in deserts, with a comprehensive decreasing tendency. Moreover, the folded line chart in Figure 6 demonstrates the temporal alteration in mean RSEISI values throughout the entire TRB during the period of 2000–2022. It is worth noting that the RSEISI varied between 0.258 and 0.301, with an overall decline from 0.292 to 0.264, signifying a 9.589% decrease. Within the time spans of 2000–2005 and 2010–2015, the EEQ showed an upward trend, with the RSEISI ascending to a maximum value of 0.301 in 2005. Subsequent to 2005, there was a downward shift in the RSEISI for the time periods of 2005–2010 and 2015–2022, resulting in a minimal value of 0.262 being recorded in 2021. This was followed by a pickup.

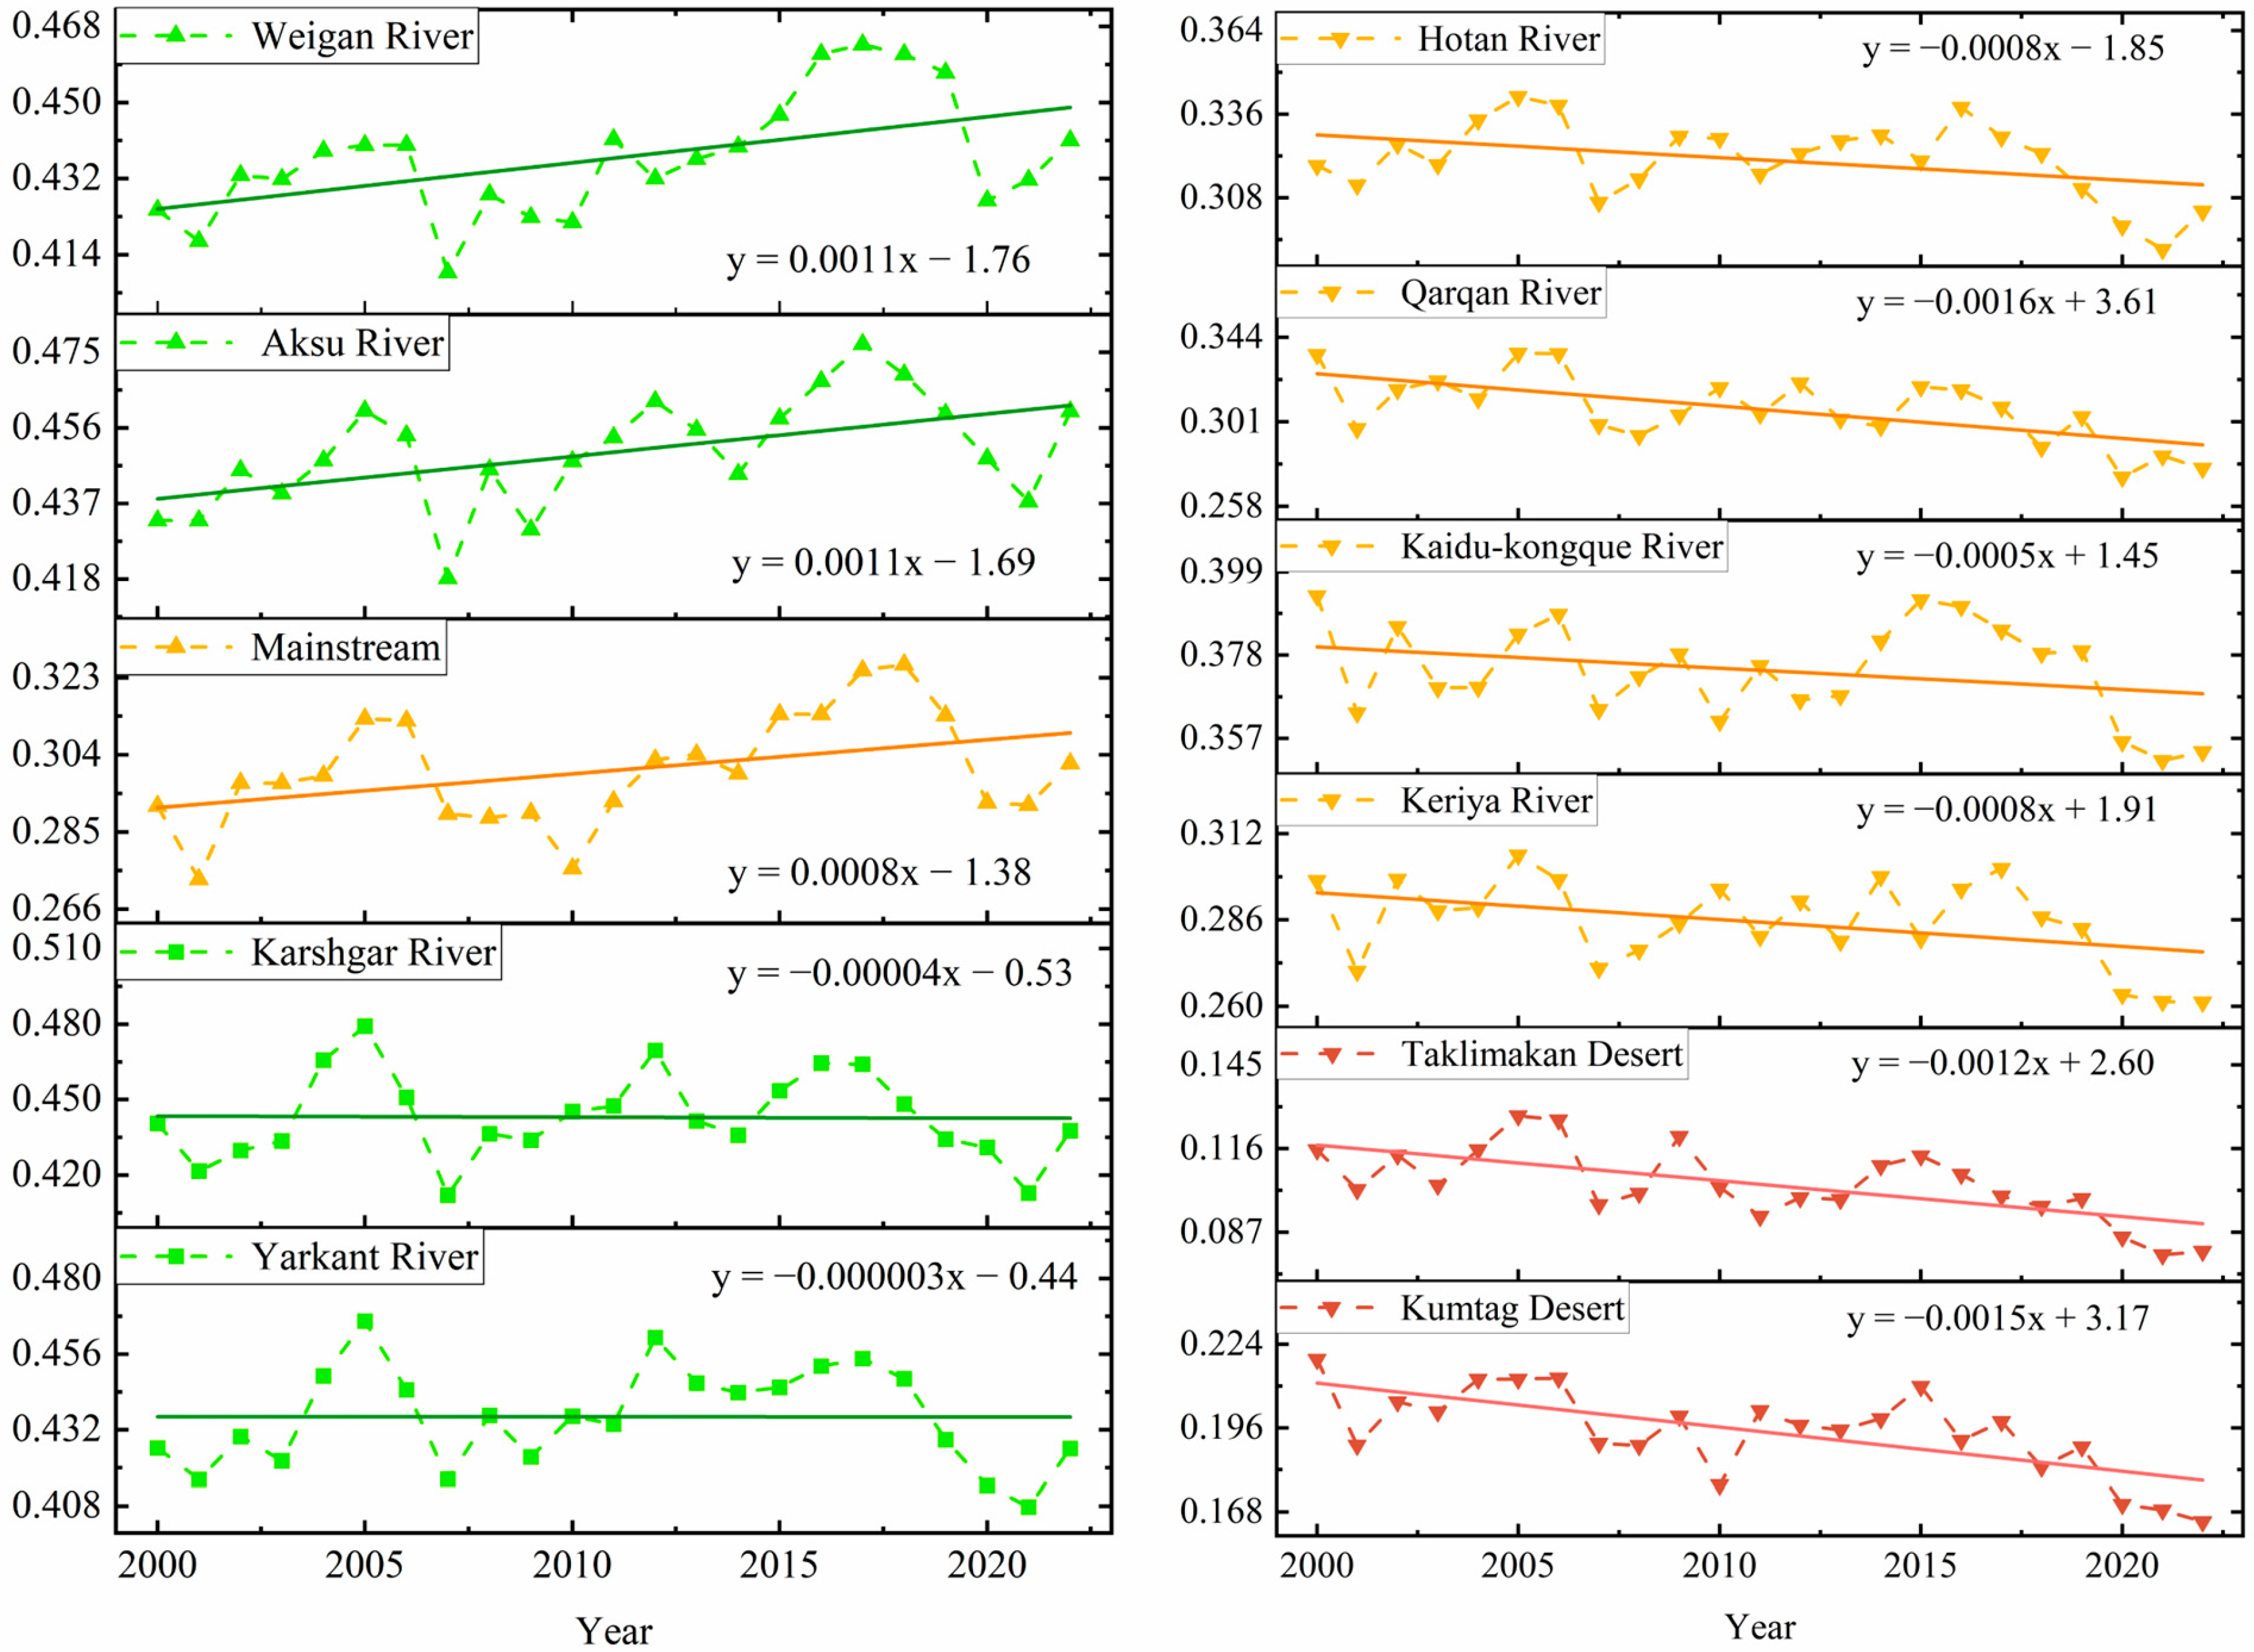
3.2.2. Characteristics of the Nine Sub-Basins and Two Deserts

To obtain a more comprehensive understanding of the spatial heterogeneity of the EEQ, we conducted further analysis on the annual mean RSEISI trends of individual sub-basins within the TRB and the two desert regions, as shown in Figure 7.
Firstly, the annual mean RSEISI values varied significantly across the sub-basins and deserts, with the Aksu River, Kashgar River, Weigan River, and Yarkant River exhibiting higher annual mean RSEISI values, with multiyear averages of 0.450, 0.443, 0.437, and 0.436, respectively. In contrast, the annual mean RSEISI values of the Taklamakan Desert and Kumtag Desert were relatively low, with multiyear averages of 0.104 and 0.195, respectively. Secondly, there was a notable increasing trend in the annual mean RSEISI values of the Aksu River, the Weigan River, and the main stream, with an increase of 6.333%. Thirdly, the Taklamakan Desert and Kumtag Desert exhibited a considerable decrease in the mean annual RSEISI values, with declines of 30.426% and 24.738%, respectively. Overall, the trends observed in the RSEISI values of each sub-basin and desert region highlight the co-occurrence of both enhancements and deteriorations in the EEQ of the TRB, while also emphasizing the spatially heterogeneous nature of EEQ changes throughout the region.

3.3. Spatial Temporal Evolution of Eco-Environmental Quality Grades

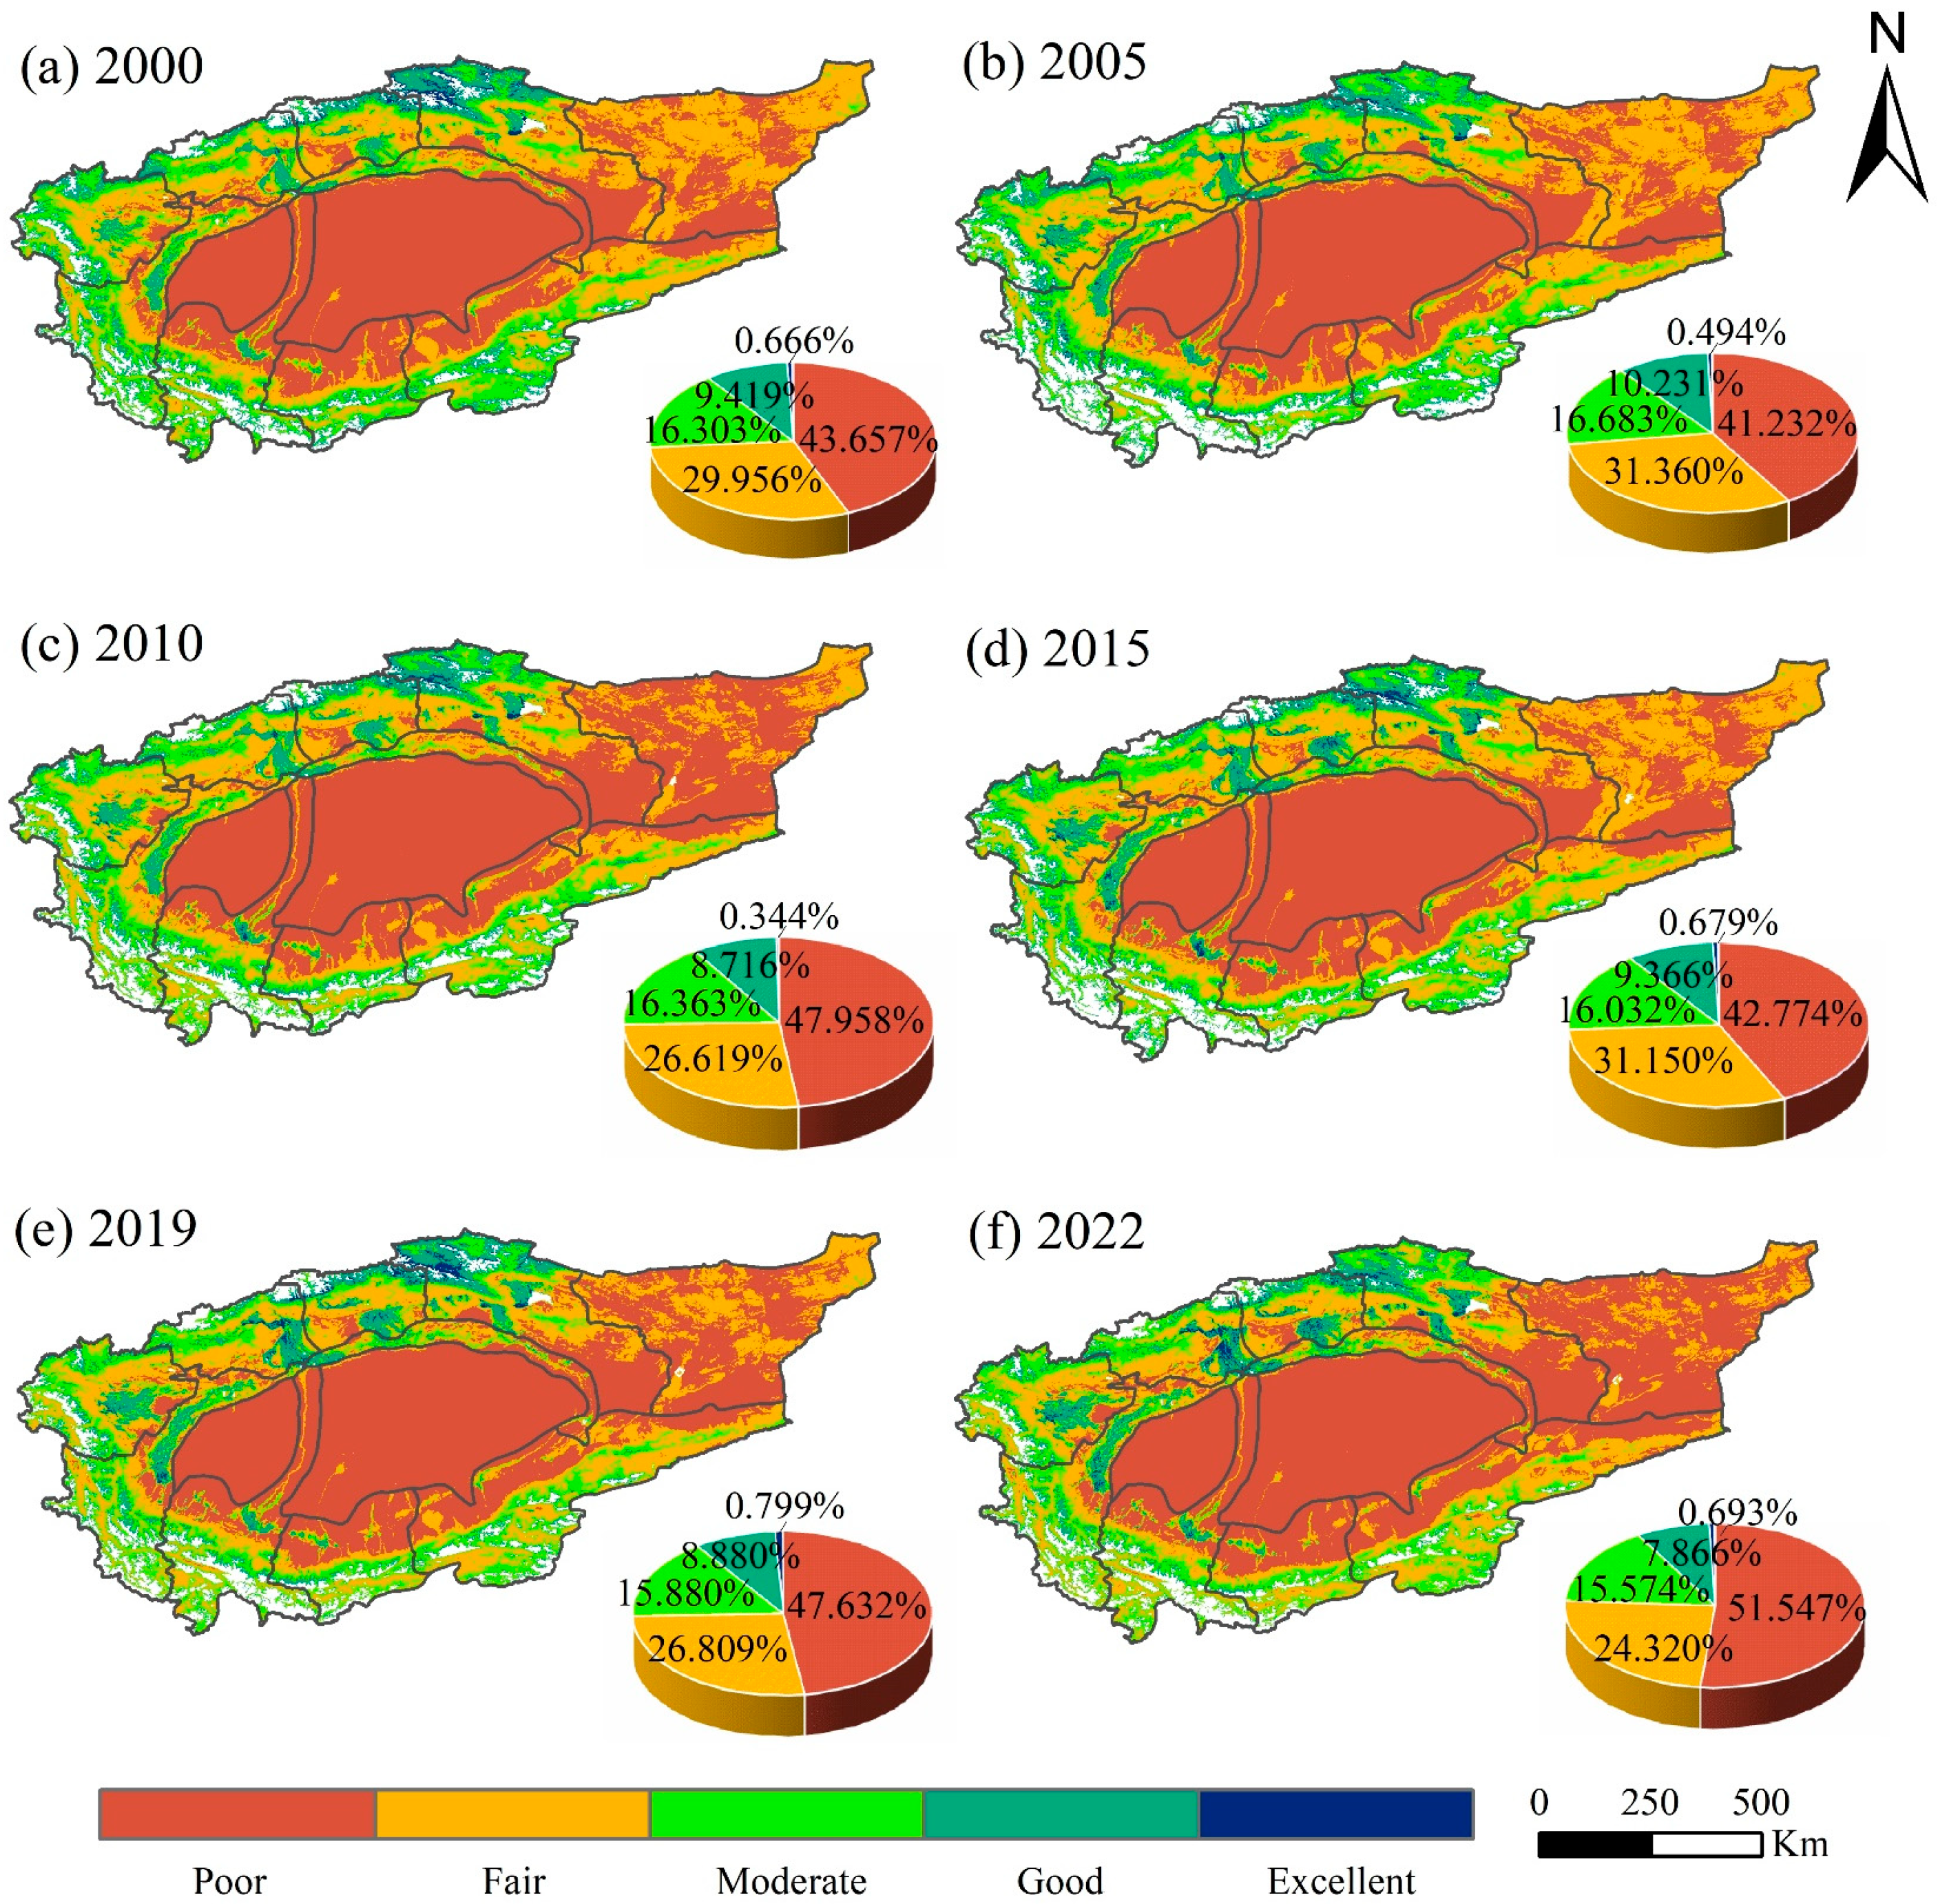
3.3.1. Spatial Temporal Distribution Pattern of EEQ Grades

The Mann–Kendall mutation test was performed in conjunction with the mean RSEISI values for the 2000–2022 period. The results reveal that the time inflection points of change occurred in 2000, 2005, 2010, 2015, 2019, and 2022. The distribution of EEQ grades at each of these inflection points is demonstrated in Figure 8.
On a temporal scale (Figure 8), the multiyear average EEQ grades of the TRB over the period 2000–2022 were as follows: poor (45.800%) > fair (28.369%) > moderate (16.139%) > good (9.080%) > excellent (0.613%). The extreme EEQ grades were predominant, consistent with the fact that approximately half of the study area is desert. The percentage of the area with EEQ in the poor grade increased by 7.890% from 43.657% to 51.547%. The percentage of the area with an EEQ in the fair, moderate, and good grades decreased by 5.636%, 0.729%, and 1.553%, respectively.
On a spatial scale (Figure 8), positive EEQ grades (excellent, good, and moderate) were mainly found in the oasis areas of the northern Kaidu–Kongque River, the Weigan River, the Aksu River, and the Yarkant River, as well as in the elevated areas of the Tianshan Mountains, the Kunlun Mountains, and the Altun Mountains, where water and heat conditions are good and vegetation cover is high. In contrast, the Kumtag Desert and the saline areas in and around the oases are dry and windy, lacking flowing water and with sparse vegetation.

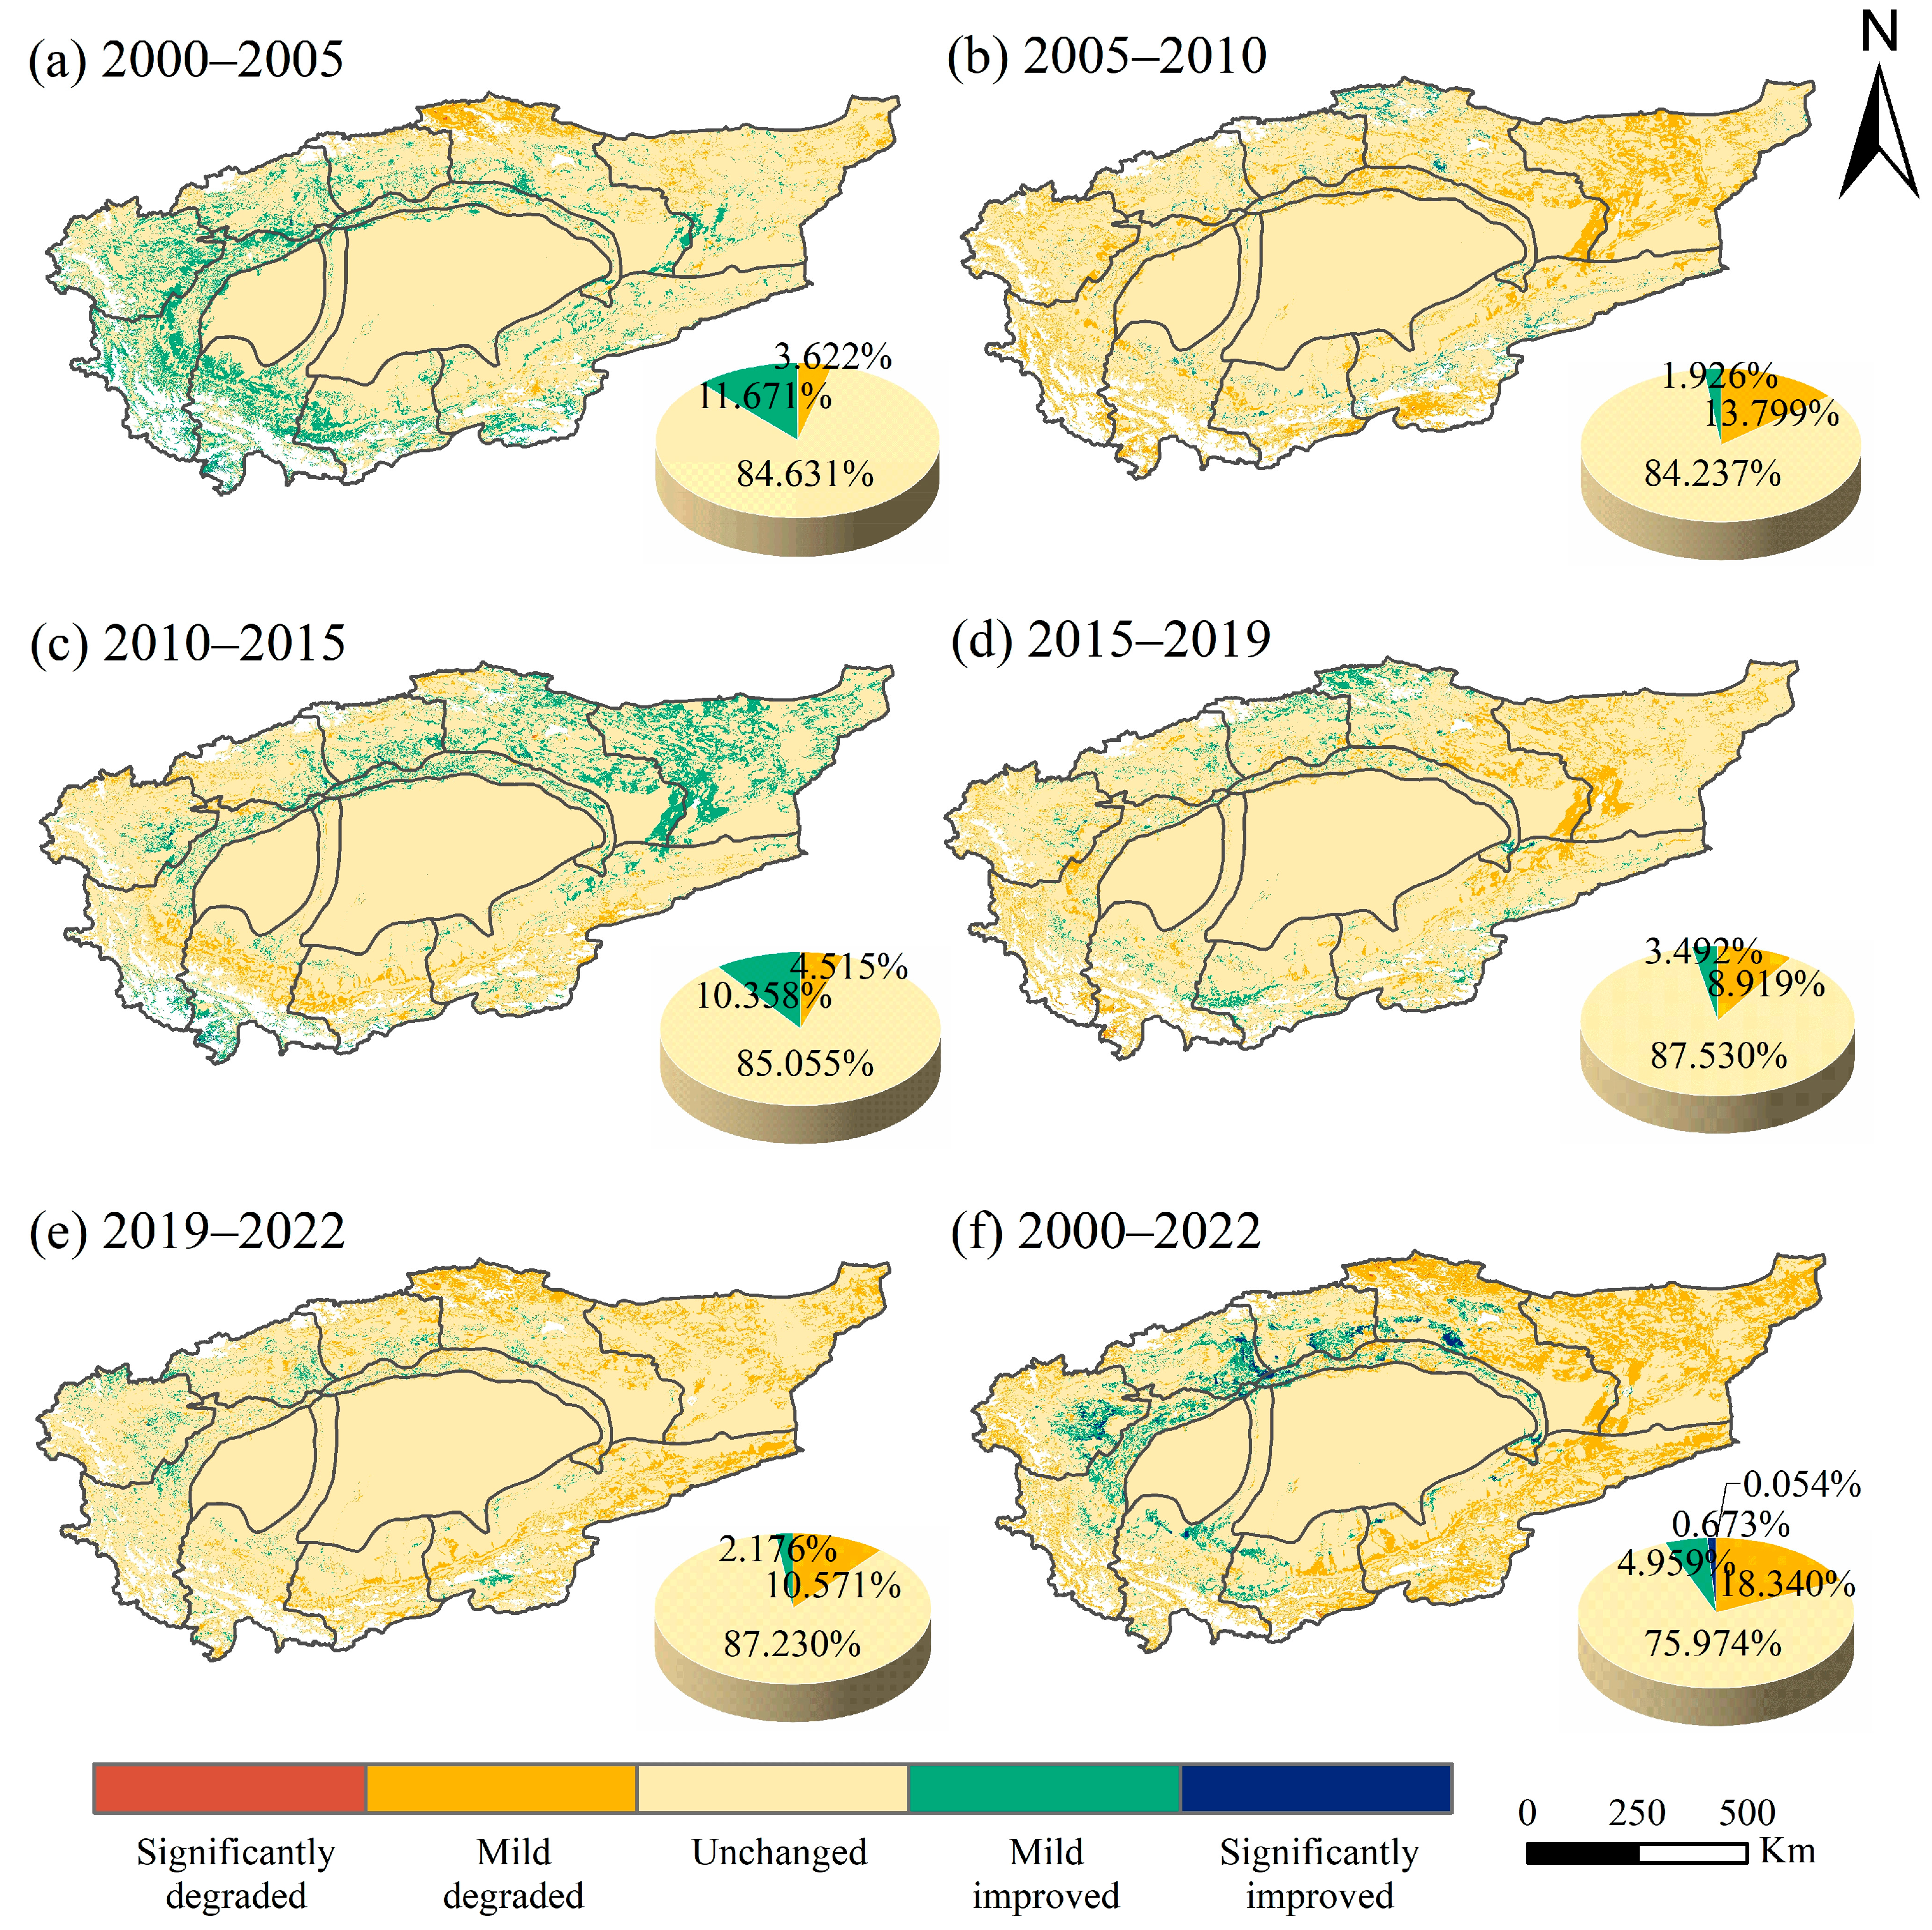
3.3.2. Spatial Temporal Variation Detection of EEQ Grades

Figure 9 and Figure 10 present difference images of the RSEISI grades using a Sankey plot and the RSEISI variation detection for the TRB during the periods 2000–2005, 2005–2010, 2010–2015, 2015–2019, 2019–2022, and 2000–2022. The variation detection analysis yielded five classification grades: significantly degraded, slightly degraded, unchanged, mildly improved, and significantly improved.
From an overall perspective, an alteration in the EEQ grade of the TRB between 2000 and 2022 was primarily characterized by the unchanged category (75.974%), along with certain indications of mild degradation (18.340%) and a mild increase (4.959%) in some areas. Specifically, areas demonstrating a mild improvement in the EEQ class were primarily situated in the Aksu River, Hotan River, and Weigan River, as well as the southwestern part of the Kaidu–Kongque River and the mainstream. Additionally, areas exhibiting mild degradation were predominantly located in the northern and central regions of the Kaidu–Kongque River, the Kumtag Desert, the southeastern part of the Kunlun mountain ranges, and the Qarqan River.
On a temporal scale, as presented in Figure 10, it is observed that during the periods of 2000–2005 and 2010–2015, the percentage of improvement in the EEQ rating surpassed the percentage of degradation, suggesting an overall improvement in the EEQ during these intervals. However, for the time span of 2005–2010, 2015–2019, and 2019–2022, the percentage degradation in the EEQ rating was found to be greater than the percentage of improvement. This indicates that the EEQ of the TRB witnessed degradation during these intervals, with a gradually increasing percentage of degradation in the EEQ rating. Notably, the percentage of degradation in the EEQ rating was found to be 3.799%, 8.919%, and 10.571% for the three corresponding periods, highlighting a trend of increasing degradation in the recent past.
On the spatial scale, as presented in Figure 10, a mild increase in the EEQ rating during the interval of 2000–2005 was found to be predominantly concentrated in the western part of the TRB, specifically in the Kashgar River, the Yarkant River, and the Hotan River. Conversely, areas with a mild decrease in EEQ rating were largely observed in the Tianshan Mountains and Kumtag Desert in the northern part of the Kaidu–Kongque River. For the period of 2010–2015, areas with a mild improvement in the EEQ rating were primarily situated in the northeastern part of the TRB, including the oasis north of the Taklamakan Desert, the Kaidu–Kongque River, and Kumtag Desert. Conversely, areas with a mild degradation in the EEQ rating were mainly detected in the Yarkant River, the Hotan River, and the central part of the Keriya River in the southwestern part of the TRB. Importantly, the three remaining periods (i.e., 2005–2010, 2015–2019, and 2019–2022) exhibited declining EEQ grades over a large proportion of the TRB, except for the Taklamakan Desert. Furthermore, areas with improving EEQ grades during these periods were mostly sporadic and relatively small in size.

3.4. Time-Series Analysis of Eco-Environmental Quality

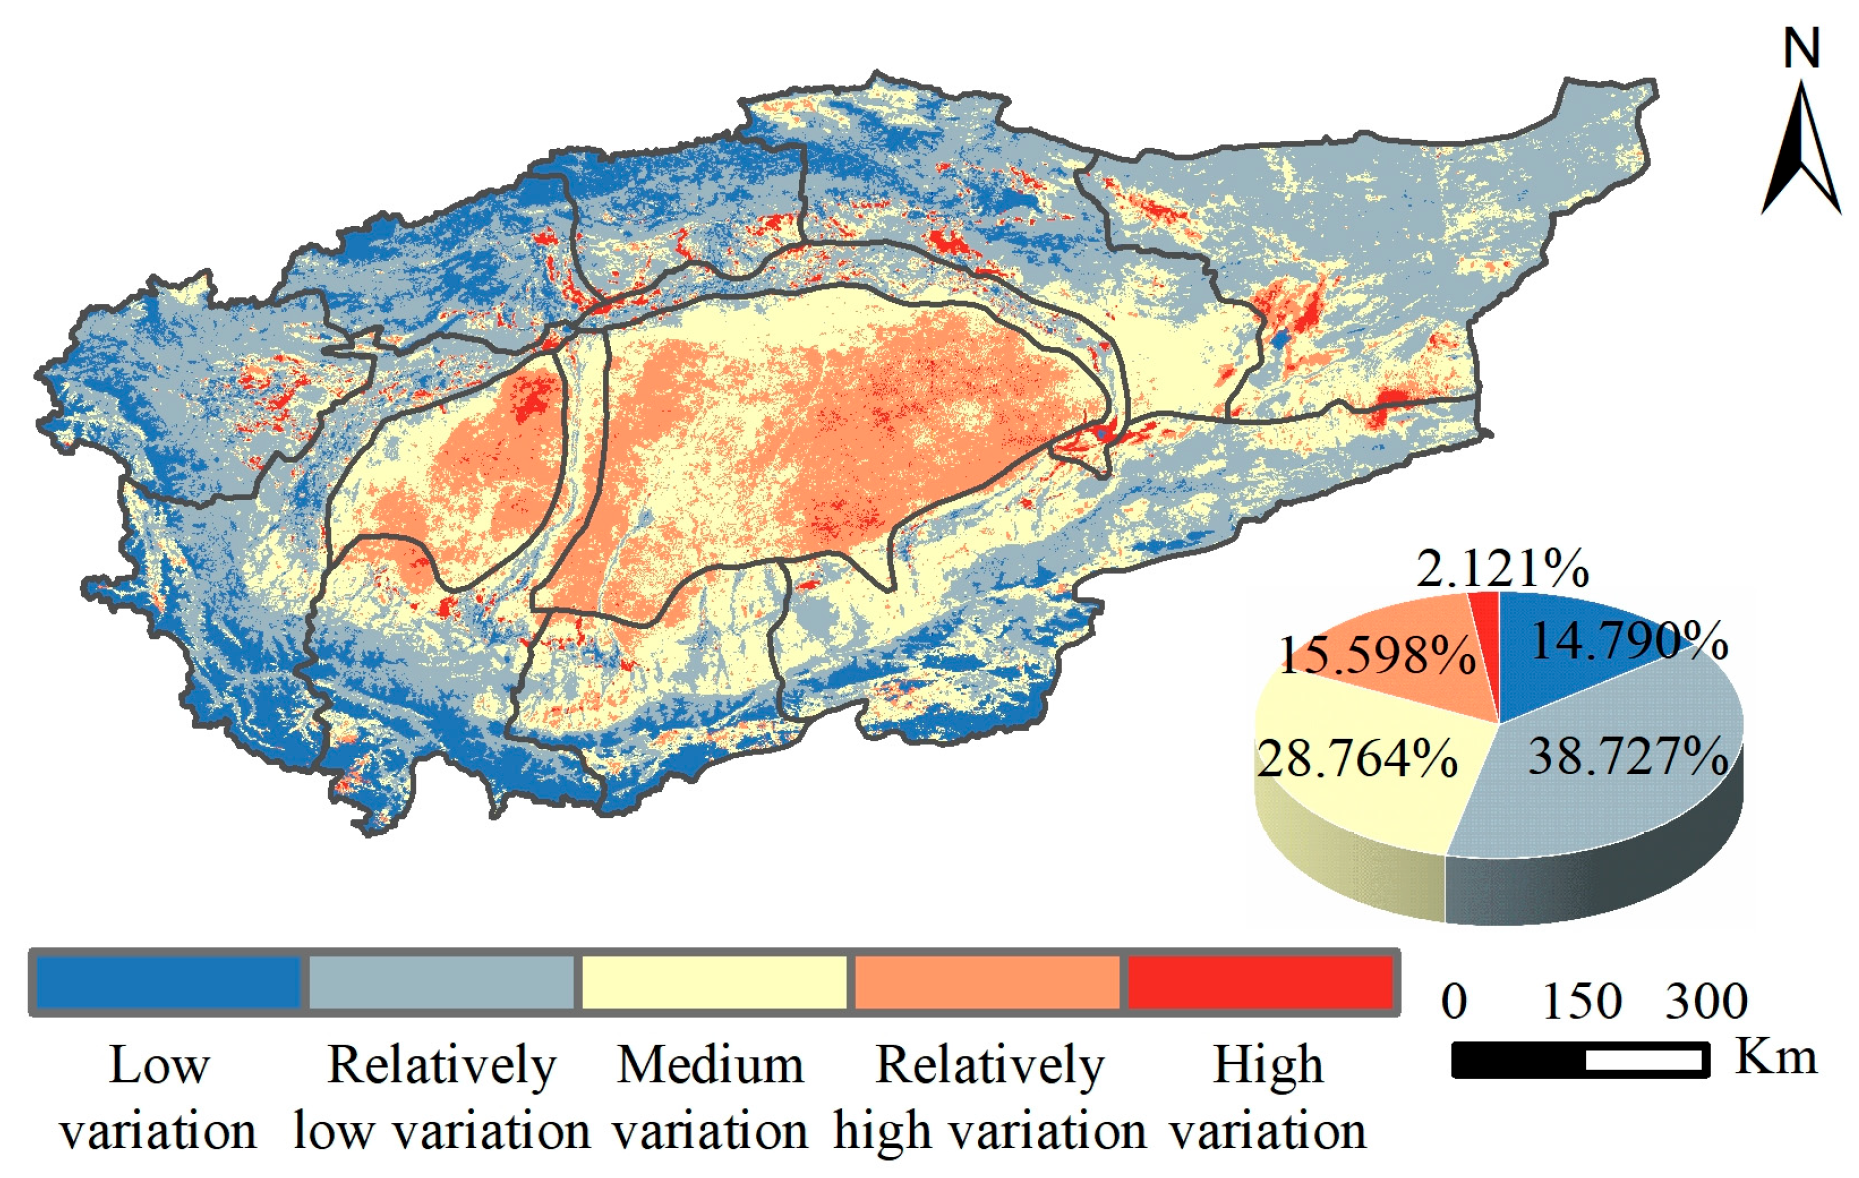
3.4.1. Stability Analysis of Eco-Environmental Quality

The CV spatial distribution of the RSEISI is depicted in Figure 11, ranging from 0 to 0.697. Regions with “low variance” (14.790%) and “relatively low variance” (38.727%) were mainly present in the elevated mountains and the northern areas of the Kumtag Desert. The “medium variation” (28.764%) was predominantly detected in the southern saline areas of the Kaidu–Kongque River, the oasis-bordering region between the Taklamakan Desert and the oasis, and the Tianshan Mountains in the northern part of the Kaidu–Kongque River. Conversely, a “relatively high variation” (15.598%) was primarily concentrated in the interior Taklamakan Desert region. Finally, a “high variation” (2.121%) in the RSEISI was mostly found in the interior of each basin’s oases and the southern Kumtag Desert.
Notably, the Taklamakan Desert showed consistently low basin-wide RSEISI values, decreasing from 0.116 to 0.080 from 2000 to 2022, indicating a significant decline of approximately 30.426%. Nevertheless, characterizing the precise spatial variation in the Taklamakan Desert’s EEQ remains challenging due to frequent fluctuations within the 0–0.200 restriction of the EEQ grading system. Despite this limitation, CV inspection revealed vast and significant fluctuations within the 0–0.2 range, highlighting the pronounced variance observed in the Taklamakan Desert’s EEQ. This also suggests that the change detection for grades may prove to be ineffective at times.

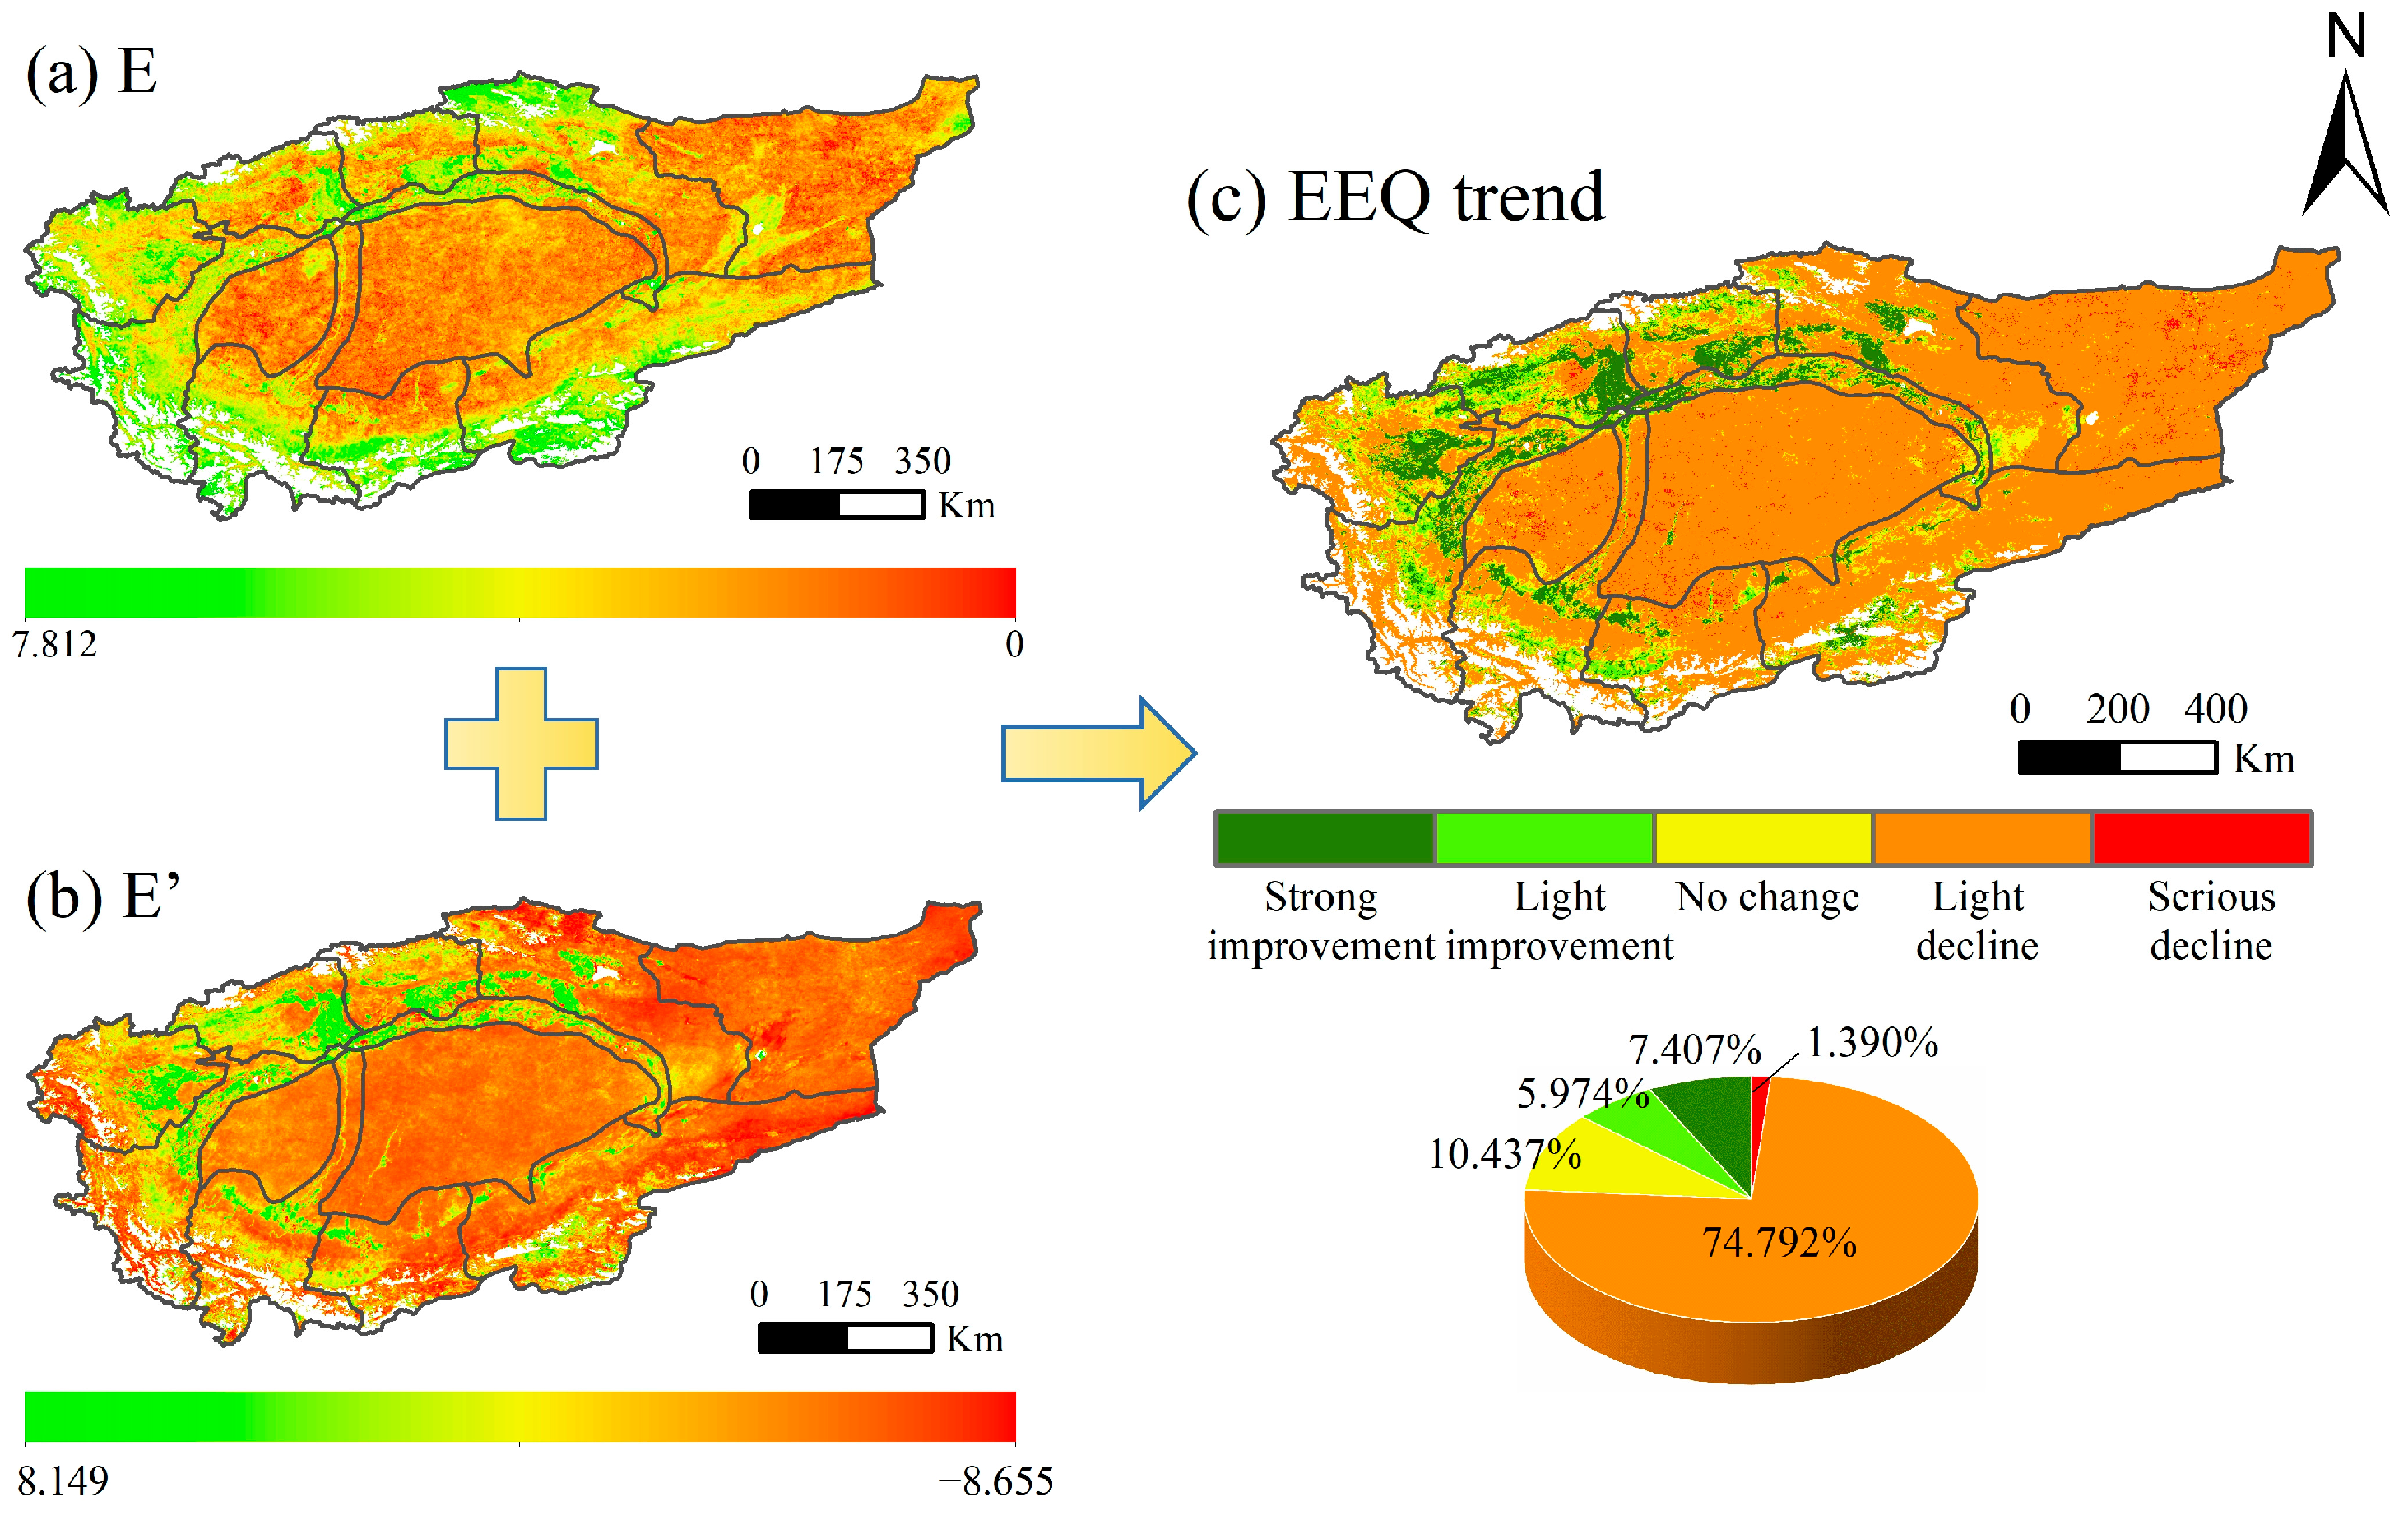
3.4.2. Trend Analysis of Eco-Environmental Quality

We applied temporal information entropy (E) to quantify the intensity of EEQ change in the TRB during 2000–2022, as shown in Figure 12a. The intensity of the EEQ variation was higher across oases and elevated mountains than in the two deserts and saline areas within and around oases. We used time-series information entropy (E’) to assess the EEQ pattern from 2000 to 2022, as presented in Figure 12b. Our results depict an increasing trend in EEQ for the oasis region, while a decreasing trend was noticed for most of the elevated mountains and desert regions.
Based on these findings, we bifurcated the two histograms portraying the entropy distribution of Figure 12a,b to establish the hierarchical distribution of the EEQ trend (Figure 12c). Our detailed examination revealed a dominant declining EEQ trend (74.792%), mainly in the two major deserts, along with scattered locations in diverse sub-basins. Moreover, Figure 12c highlights the unique geospatial pattern concerning different land-cover types, demonstrating a slight downward trend of EEQ primarily confined to unused land. We also identified an upward EEQ trend (13.381%) primarily related to arable and grassland land use in oases and elevated mountain areas, indicating a restorative role for human activities. Additionally, the northern section of the Kaidu-Kongque River reflected a mild declining trend in the EEQ, where grassland was the primary land use.

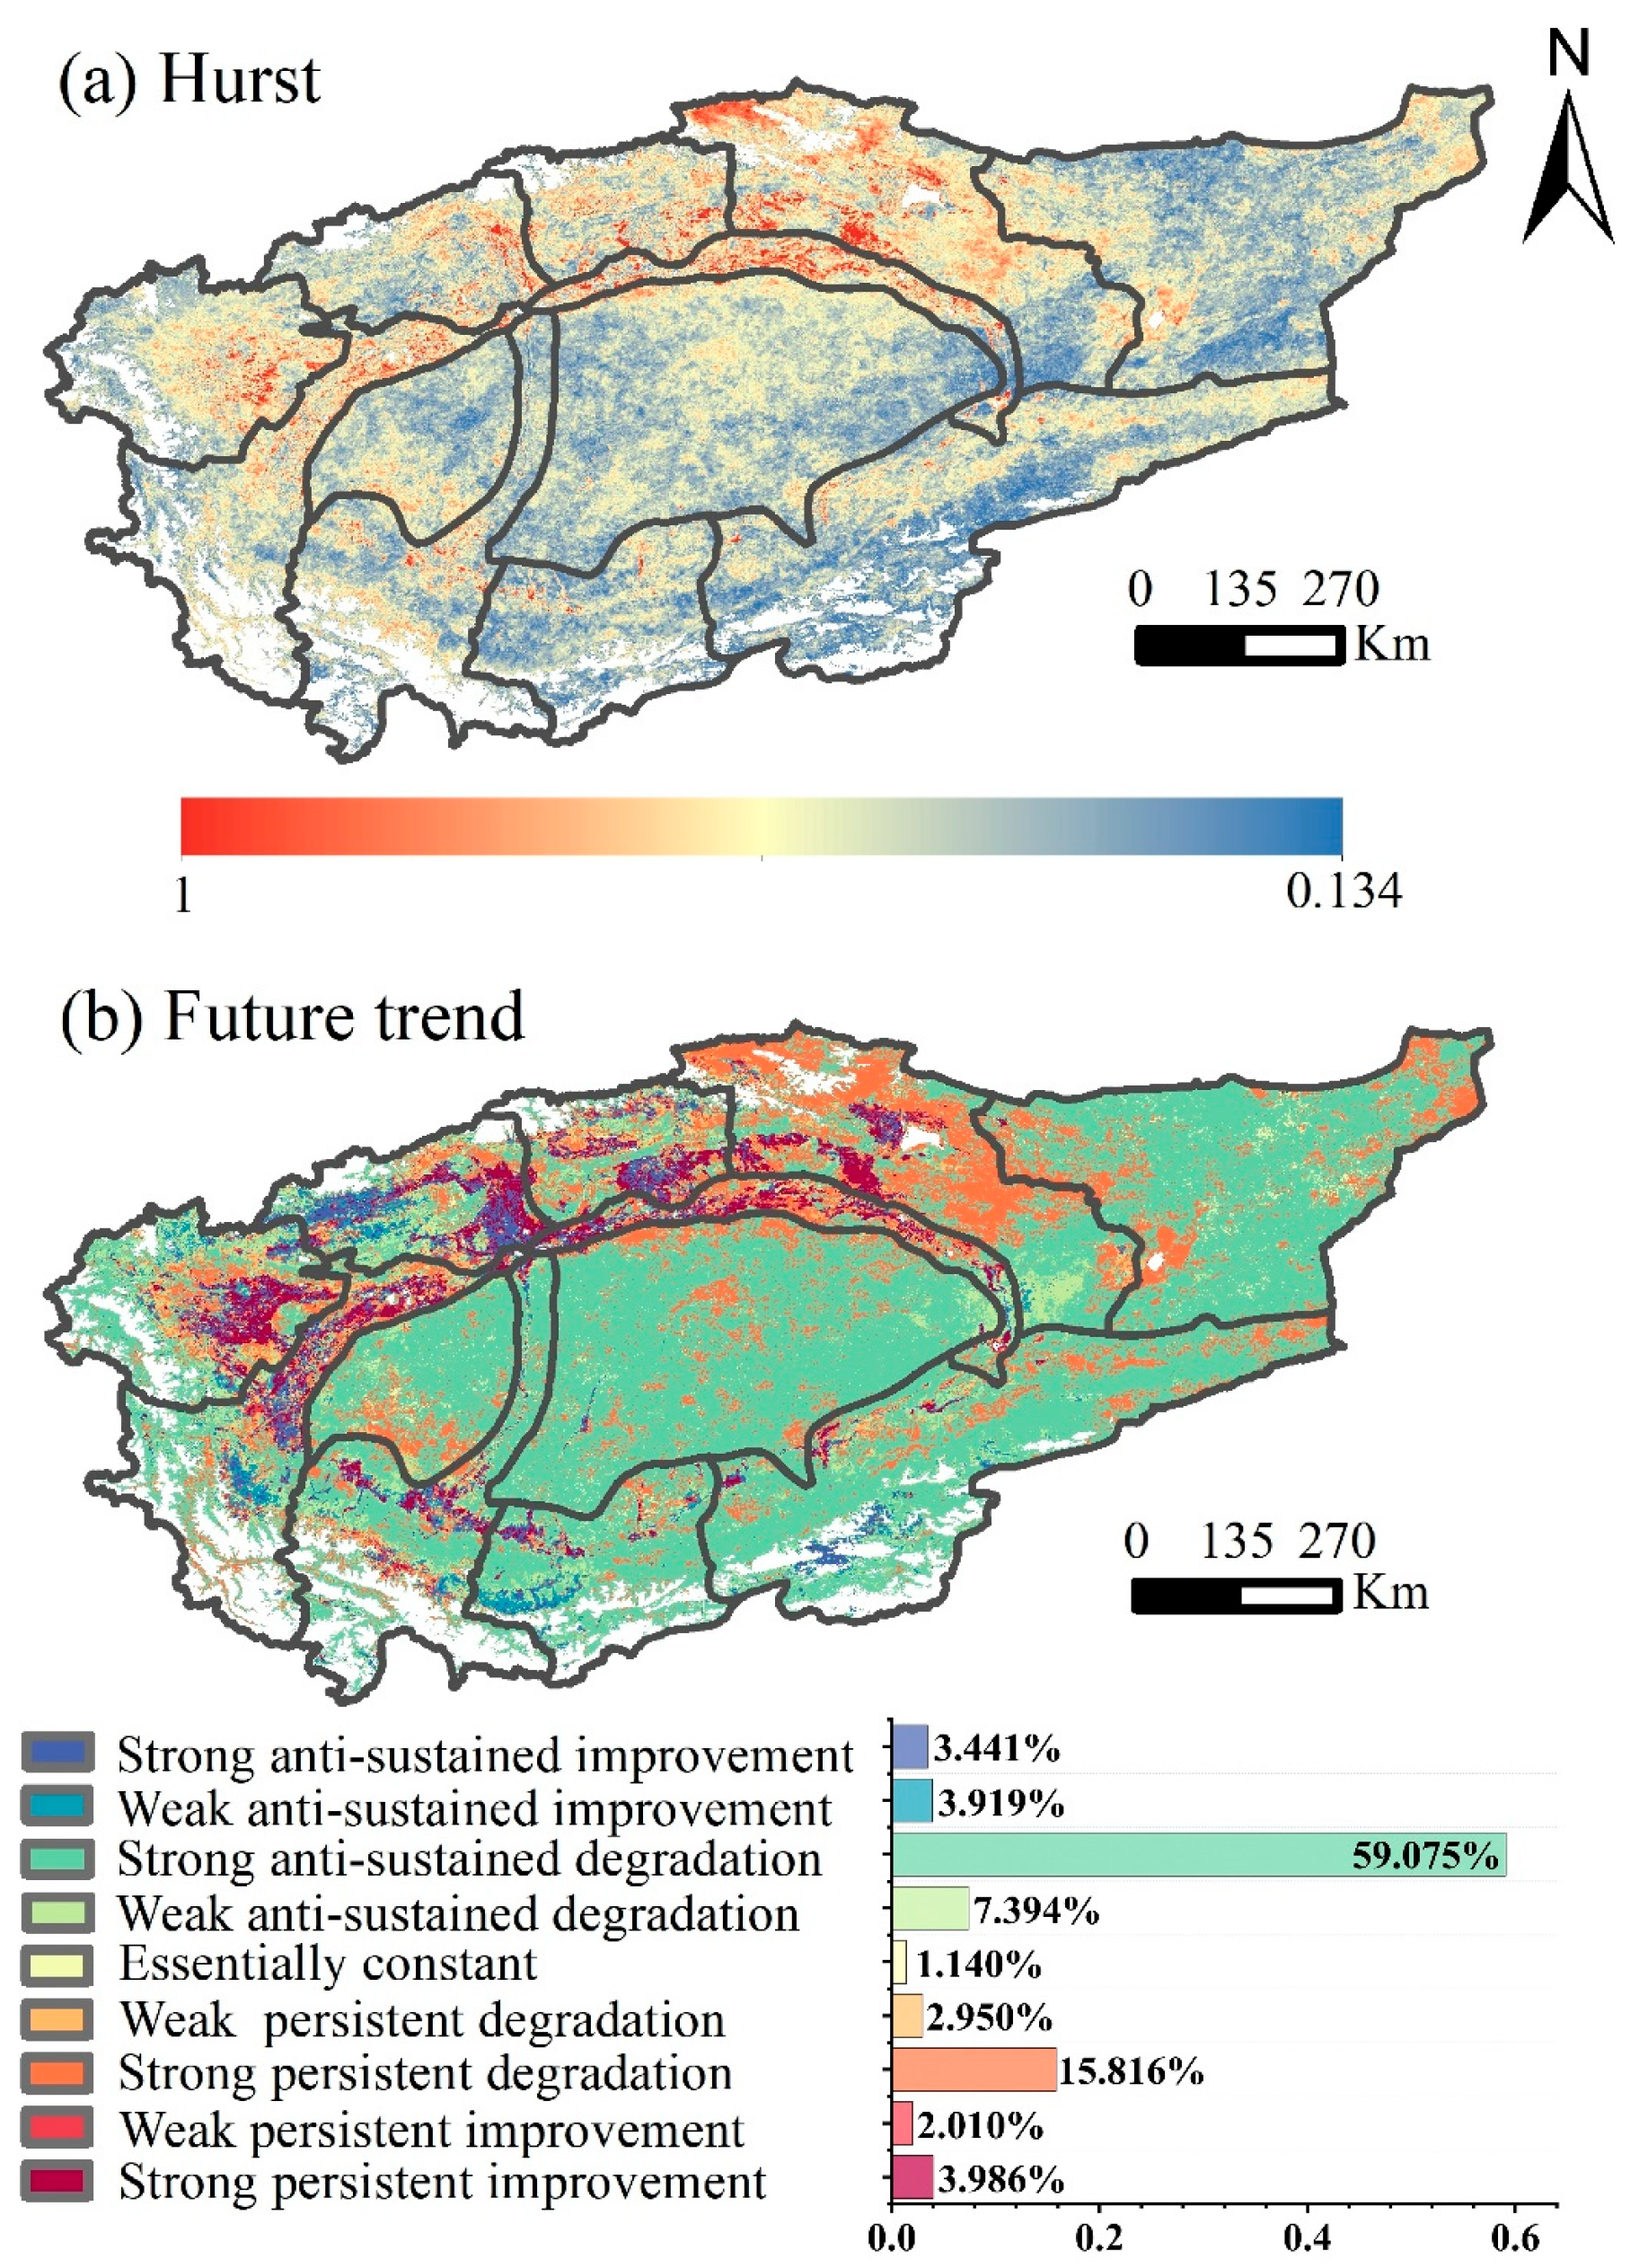
3.4.3. Sustainability Analysis of Eco-Environmental Quality

The mean Hurst exponent value (H) calculated for the RSEISI was 0.448, with 24.900% of the regions exhibiting H values within 0.5 < H < 1 and 75.100% of the regions exhibiting H values within 0 < H < 0.5. This suggests that the future EEQ of the TRB is primarily characterized by non-sustainability, with 75.100% indicating anti-sustainability. To gain a nuanced understanding of the forthcoming EEQ trends, we generated the Hurst exponent in Figure 13a and overlaid it onto the EEQ change trend in Figure 13b. The outcomes indicate that 66.469% of the TRB can expect a significant anti-sustained decline in the future, with vast desert areas and highland mountainous regions transitioning from past EEQ degradation to future EEQ improvement. Concurrently, oases are projected to maintain an improved EEQ trend.

3.5. Analysis of Driving Factors

A geodetector is commonly used to analyze the influence mechanisms of multiple factors. In this study, the RSEISI was used as the dependent variable, while soil type represented the soil factor; LUCC, DEM, slope, and aspect served as the terrain factors; the average annual temperature (TMP) and average annual precipitation (PRE) represented the climate factors; and POP and GDP represented the urbanization factors. Nine evaluation indicators were employed in the geodetector for single-factor analysis, interaction detection, and ecological detection to investigate the impact of various factors on the spatial temporal variability of the EEQ of the TRB during the 2000–2021 period.

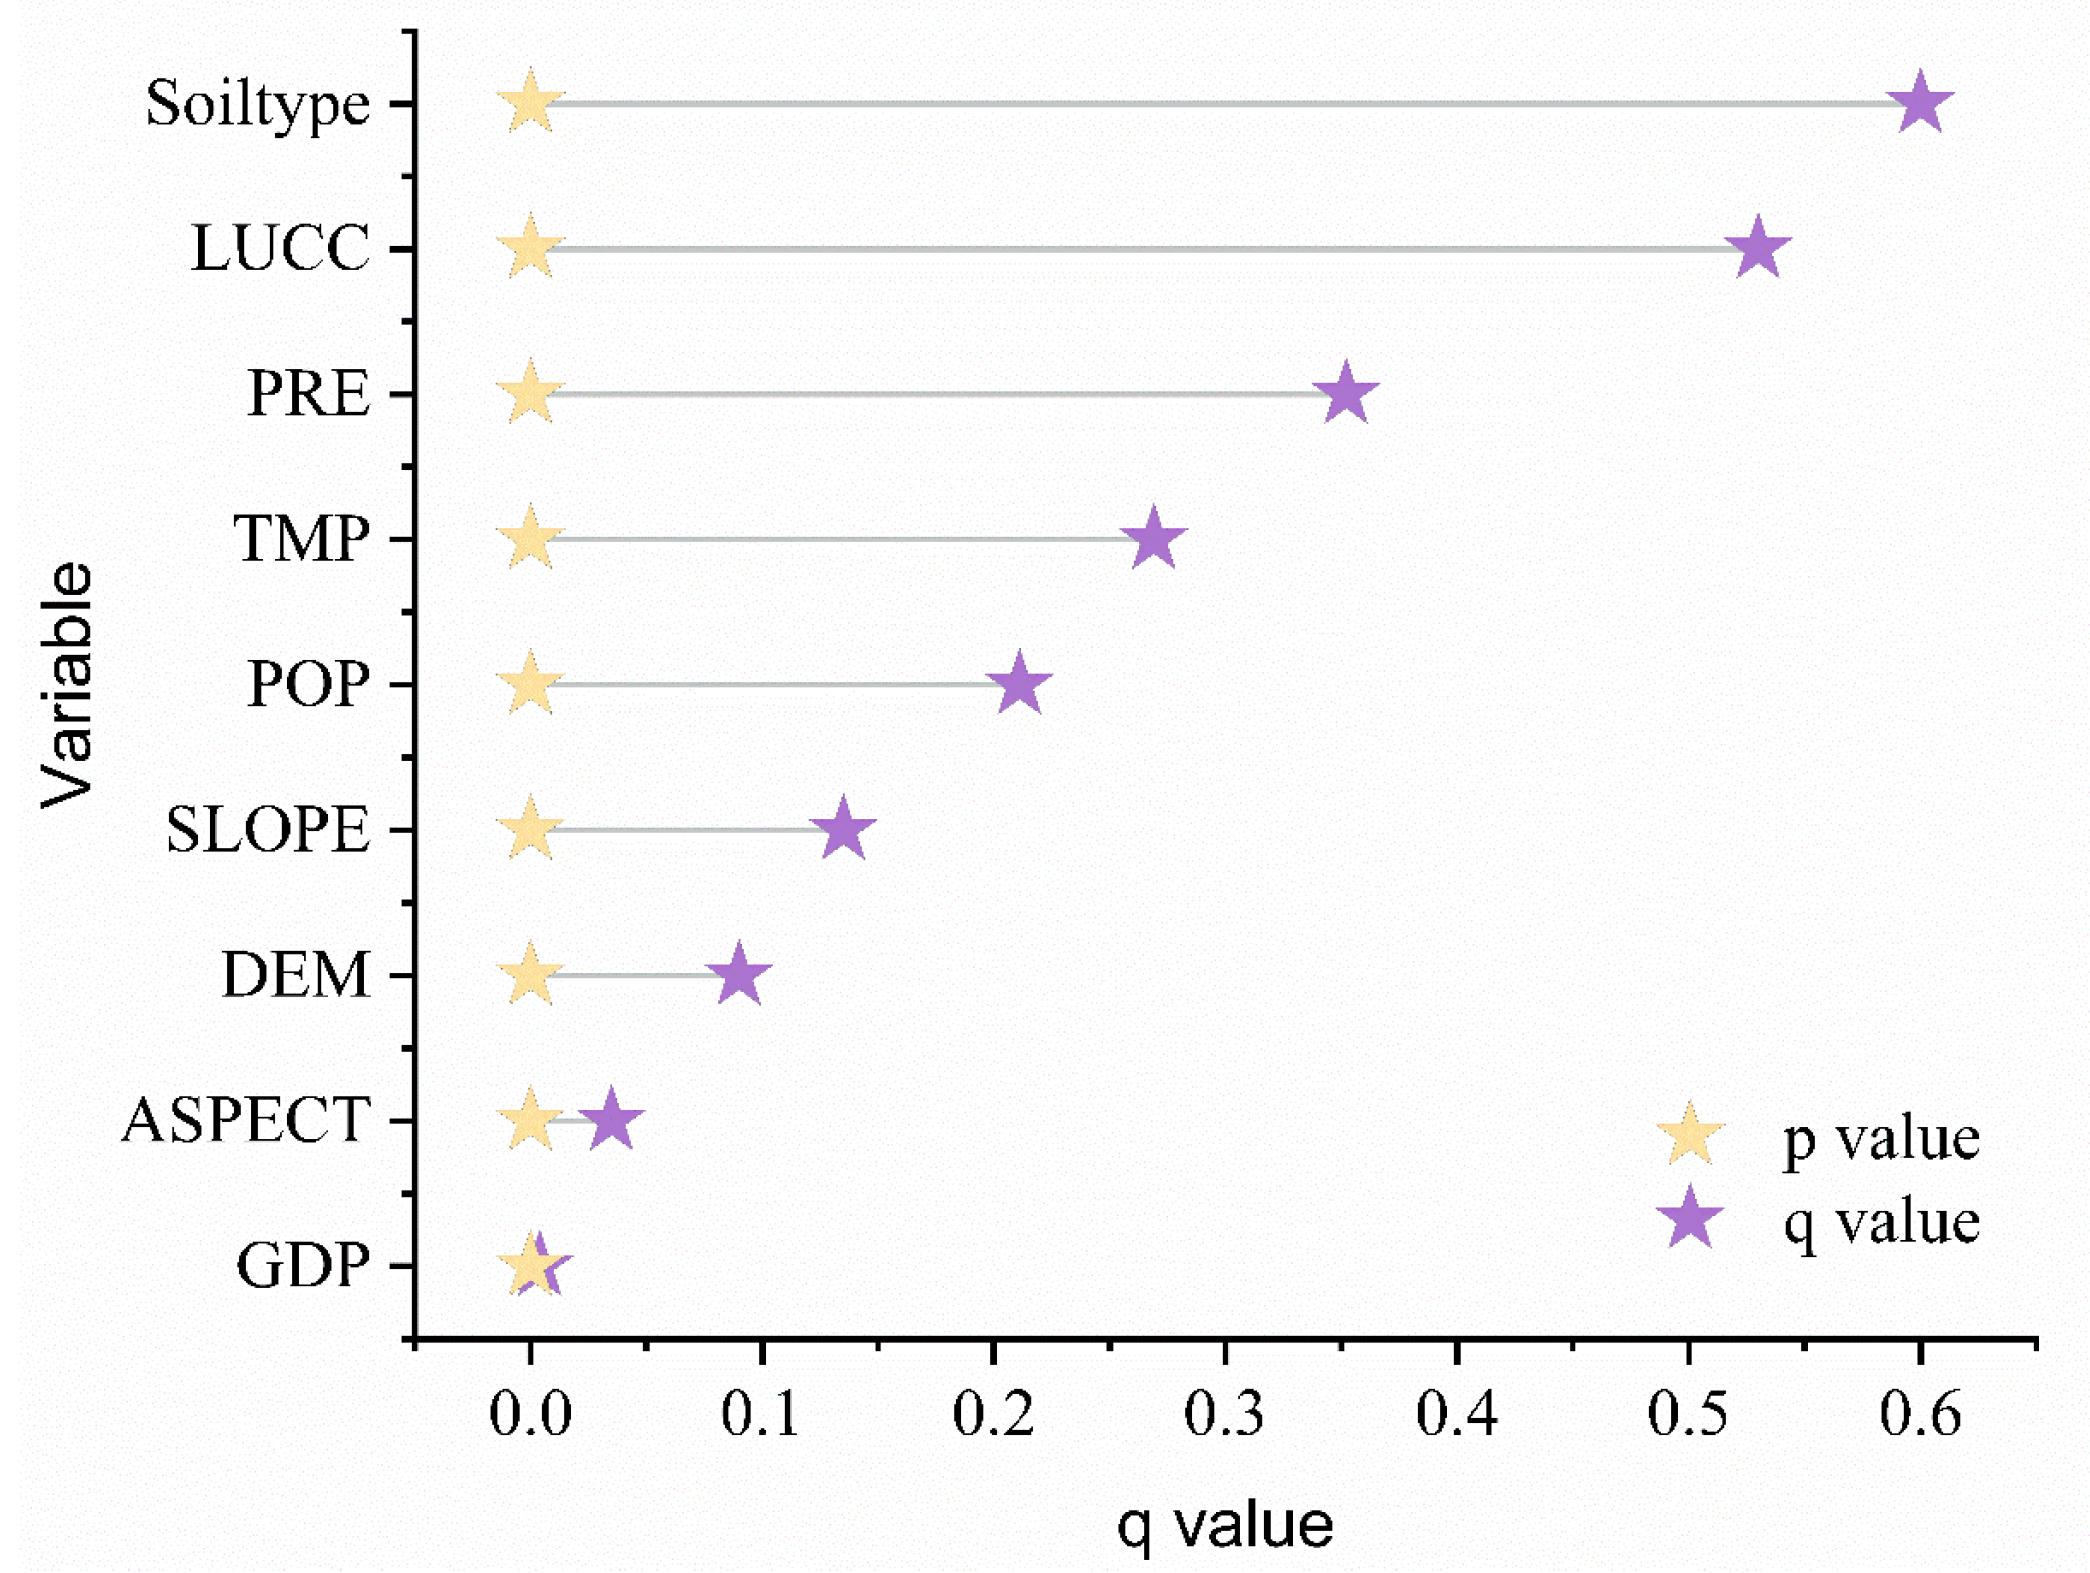
3.5.1. Single Factor Detection Analysis

The results of the single-factor detection are presented in Figure 14, where the p-value for all factors was determined to be zero, indicating that the selected factors had sufficient explanatory power for the EEQ of the TRB. The q-value was used to measure the degree of influence of each factor on the RSEISI, with the order of influence intensity as follows: soil type (0.600) > LUCC (0.530) > PRE (0.352) > TMP (0.269) > POP (0.211) > slope (0.135) > DEM (0.090) > aspect (0.035) > GDP (0.004). Notably, the q-values for both soil type and land use were over 0.500, indicating their dominant roles in affecting the changes in the EEQ of the TRB. These findings provide evidence of the crucial role played by improving soil texture and making changes to land-use types in the sustainable management and rehabilitation of arid regions.

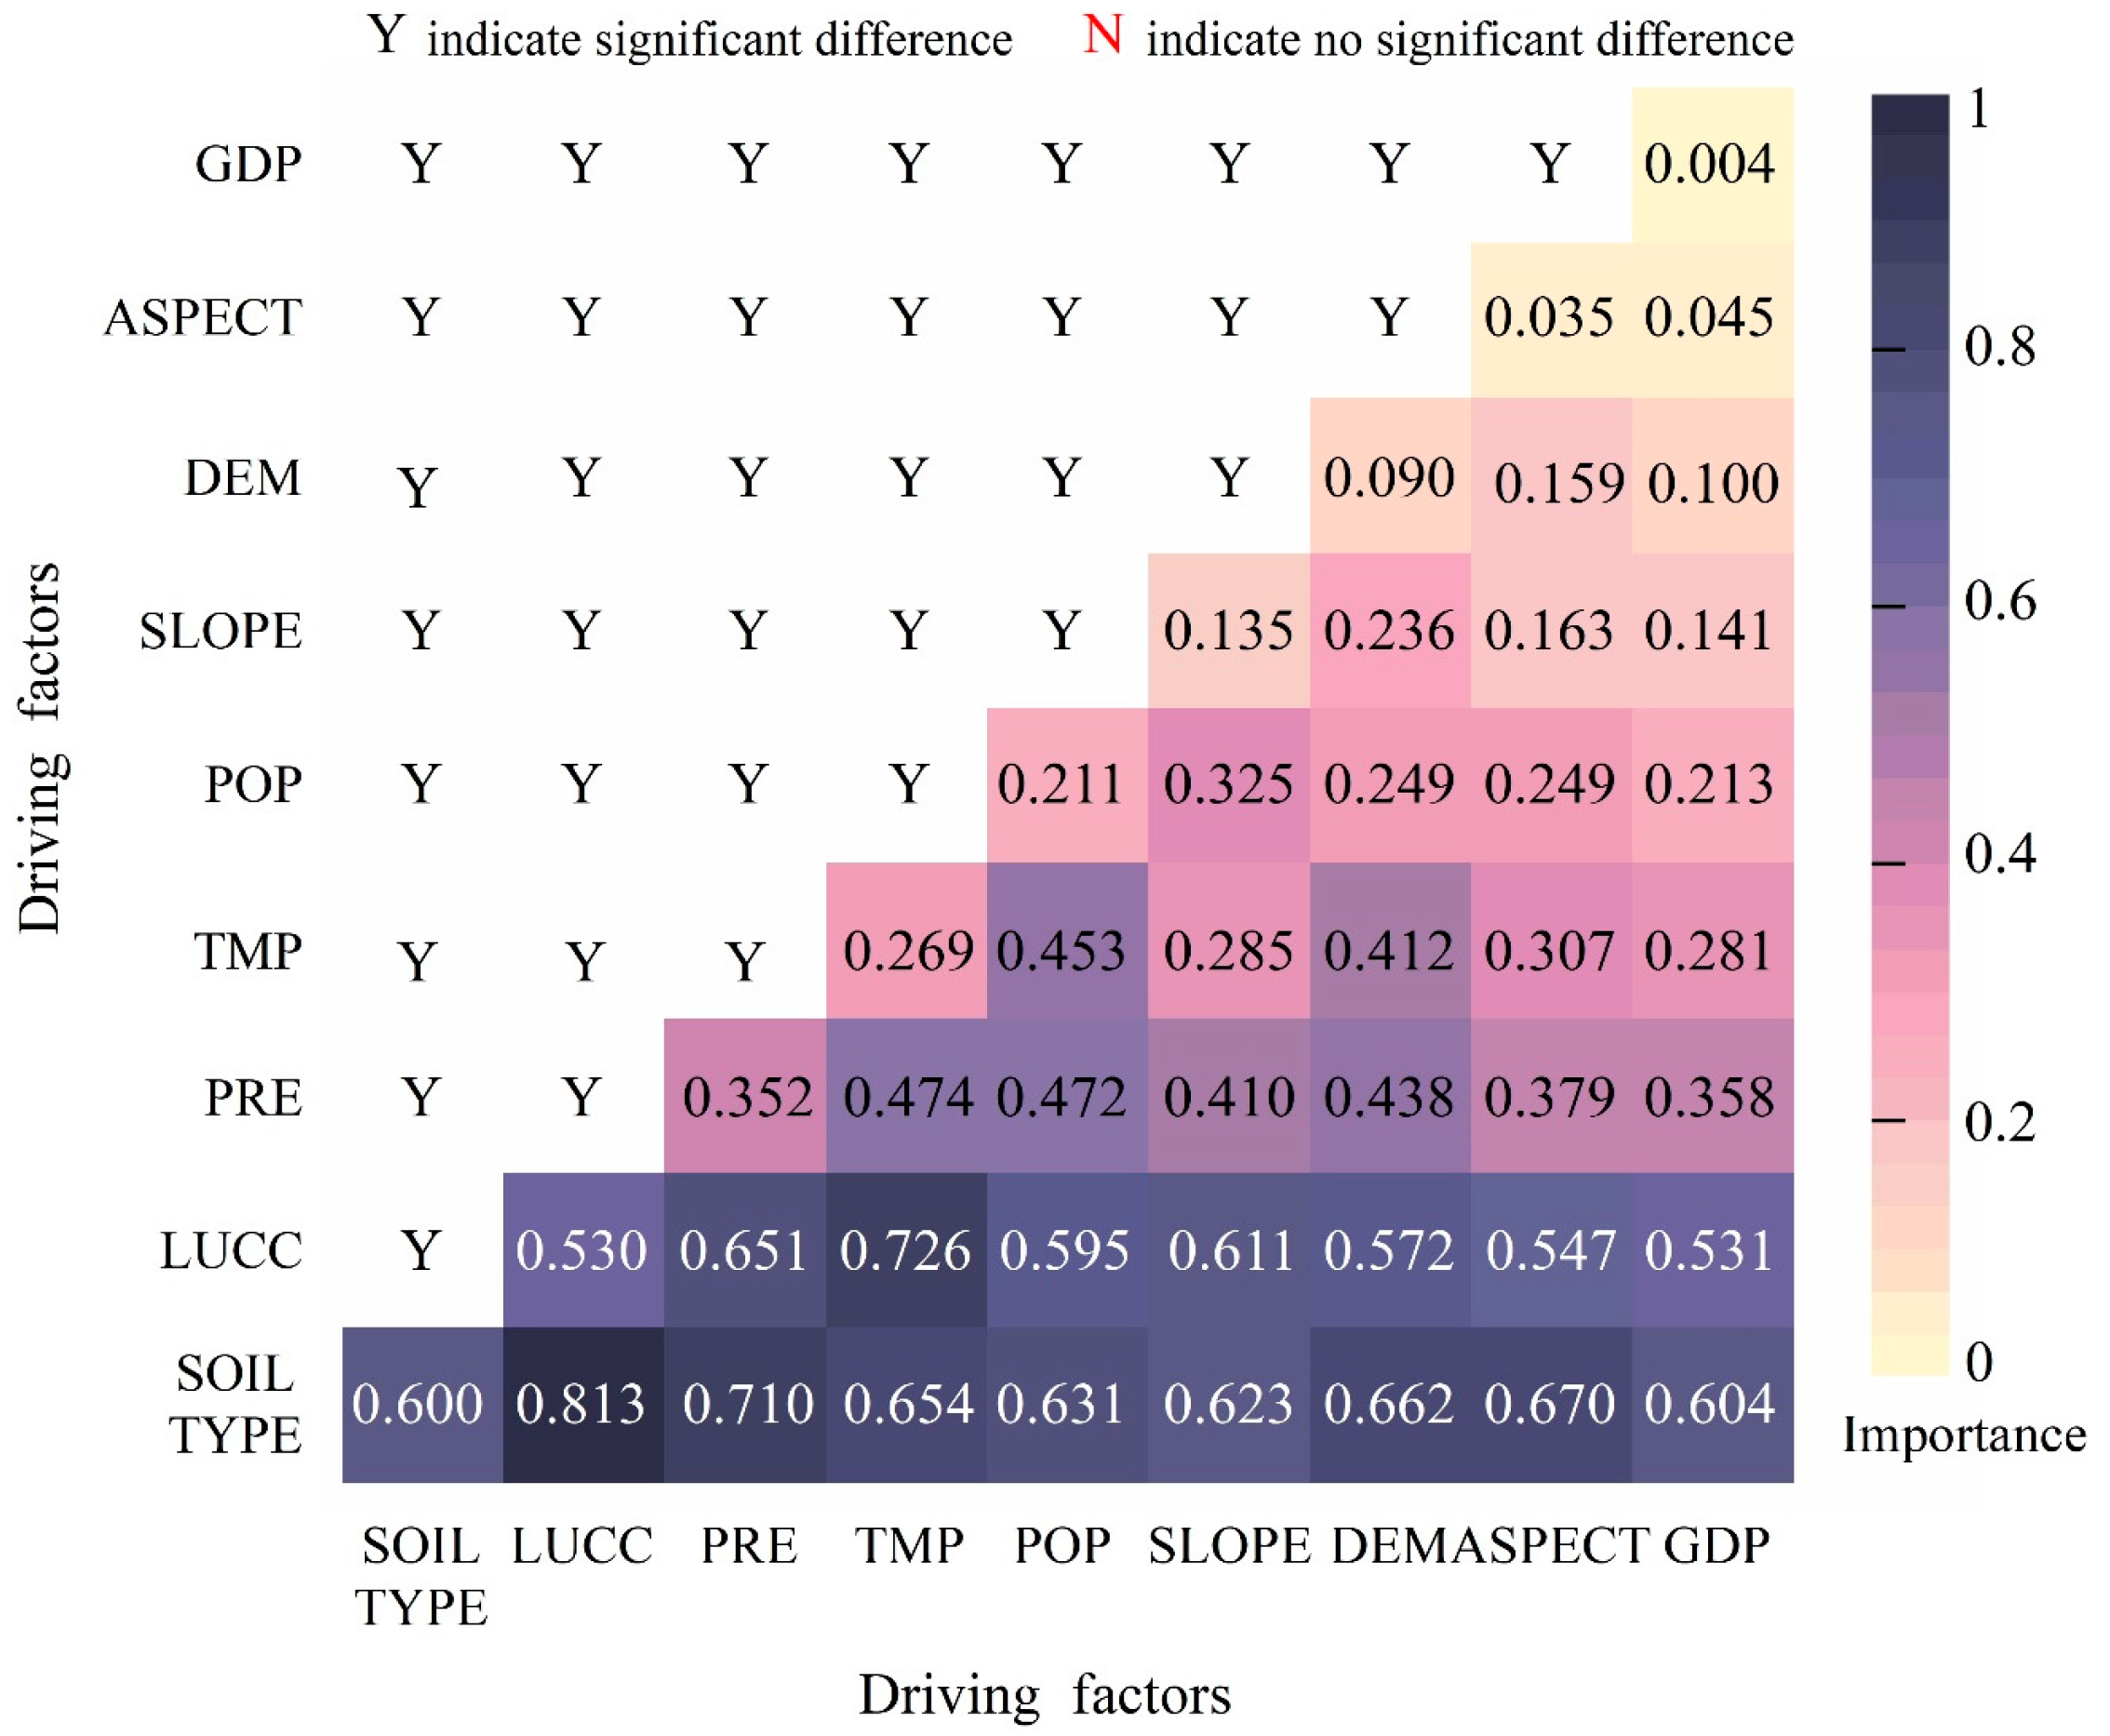
3.5.2. Multifactor Detection Analysis

The results of interaction probes and ecological probes for the period 2000–2021 are presented in Figure 15, revealing several important findings. (i) The interaction of drivers exhibited a non-linear enhancement, indicating that the influence of driver interaction was more pronounced than that of individual factors on the EEQ of the TRB. (ii) The interaction between soil type and LUCC had the most powerful explanatory capability, accounting for 0.813, suggesting that the interaction of soil type and land use had a substantial impact on EEQ. (iii) In all combinations of interaction factors, ecological test outcomes showed Y, indicating that significant differences existed among all driver combinations in influencing the spatial distribution of EEQ. These results emphasize the importance of interrelated factors in shaping EEQ variation and highlight the need for integrated management strategies that account for the complex relationships between diverse environmental drivers.

4. Discussion

4.1. The Advantages of the RSEISI on Typical Saline Areas

In this paper, the traditional RSEI was improved and an RSEISI with a CSI was constructed to monitor the dynamics of the EEQ variation in the TRB. However, in the northwest arid region, the detrimental impact of soil salinization on EEQ variation dynamics should not be overlooked. Desertification issues are predominantly attributed to land degradation due to desertification and soil salinization, as well as grassland degradation, which exacerbate the decline in soil fertility, leading to the deterioration of the ecological environment and hindering socio-economic development, particularly in agriculture [41,42]. Many scholars have incorporated salinity measures into the evaluation of EEQ; however, for basins with large areas, a single salinity index is inadequate due to diversities in soil texture and the topographical characteristics of the landform. This study computed the mean values of three conventional salinity indices to enhance the robustness and reliability of detection results and capture the comprehensive and effective soil salinization levels within large-scale basins [29,43].
Figure 3 shows that the PC1 contribution exceeds 70%, and there is a correlation higher than 0.7 with each indicator, indicating that PC1 can efficiently concentrate the information of each index and is genuinely comprehensive and representative. Additionally, the RSEISI exhibits spatial distribution and change trends equivalent to the RSEI and CHEQ, but it more effectively distinguishes the difference in EEQ among different land types and captures the ground truth better. Specifically, in extreme environmental areas of arid regions, such as those with high soil salinization, the RSEISI is more sensitive than the RSEI, producing more accurate EEQ evaluation results. Ecological issues, such as soil salinization, negatively impact EEQ and should not be overlooked. The RSEISI addresses the lack of consideration in the RSEI and CHEQ towards soil salinity by integrating soil-salinity indicators into the EEQ-assessment system, meeting the realistic needs associated with EEQ evaluation in the TRB.

4.2. Changes of EEQ in the Tarim River Basin

During the period of 2000–2022, the overall EEQ of the entire TRB presented spatial and temporal variation, with a fluctuating trend in the time series and ecological changes such as oasis expansion, glacial melting, and desert degradation, consistent with the findings of related studies [25,44,45,46,47,48]. Certain scholars exclude deserts when studying the TRB due to their extremely poor ecological conditions and the infrequent human activity present there [49]. However, in the case of arid regions, the two evolutionary trends of oasis and desertification are complementary, and deserts, Gobi lands, oasis–desert transition zones, and lower river reaches are prominently sensitive areas [18]. In recent years, the EEQ in regions of high human activity among various sub-basins has shown signs of improvement. In contrast, deserts and unused lands in several sub-basins have experienced a decline in EEQ, suggesting that the ecological environmental deterioration in most of the TRB mainly occurs in abandoned lands rather than areas of human activity [13]. Regarding glacier changes, recent studies have indicated that numerous glaciers are experiencing varied degrees of ablation due to climate warming [50,51]. For the northwest arid region, where water resources are unevenly distributed, the optimal utilization of glacial meltwater and preparation for disaster emergencies are urgent tasks.

4.3. Driving Forces of EEQ Changes in the Tarim River Basin

The geodetector results (Figure 14 and Figure 15) indicate that soil type, LUCC, PRE, and TMP are the most important drivers of the EEQ of the TRB. Terrain and climate factors have the greatest influence on the EEQ of the TRB [22]. This result is consistent with the results of the Third Scientific Expedition on Land and Agriculture in Xinjiang. In terms of climatic factors, the concept of warming and humidification has captured the attention of government agencies, academic researchers, and the general public. Both precipitation and temperature in the TRB showed a positive trend, and various studies have demonstrated climate change’s impact on the EEQ of the TRB, with different spatial precipitation and temperature variability levels, leading to impacts on different ecosystems [52,53,54]. Therefore, the specific mechanisms behind climate effects on the EEQ of the TRB will be under scrutiny in future studies [42,55].
In terms of terrain factors, the type of land utilization is significantly influenced by the characteristics of the soil, which have a significant impact on the arid region. The EEQ showed improvements mainly within the oasis situated in the northern TRB, while the EEQ of the saline lands in and around the oases was deteriorating. On the one hand, the transformation of unused land into arable and grassland has improved the EEQ of the oasis through effective agriculture promotion backed by state and policy support, causing an effective improvement in the EEQ of the oasis [21,46]. On the other hand, the encroachment of crop land on grassland and woodland and the incidence of the secondary salinization of arable soils related to improper irrigation and rising water tables were contributing factors. Over 60% of the areas converted from grassland to farmland exhibited slightly saline soil, leading to ecological degradation [18,41,56,57]. The expansion of agricultural oases has been linked to deforestation and elevated water usage for irrigation. Moreover, the overconsumption and inefficient use of water resources have sparked a water crisis and ecological degradation in the region, thereby negatively affecting the sustainable development of social-economic and natural ecosystems. Ecological restoration is a long-term and gradual process. To effectively improve the EEQ of the TRB, it is recommended that various control measures be implemented, including efficient water-resource usage, optimized land-use structure, strengthened land protection and management, soil-fertility improvement, and soil-environment enhancement [58]. The implementation of the RSEISI can provide insight into the critical ecological factors that shape EEQ dynamics in the TRB and can facilitate the development of appropriate measures to mitigate the impact of salinization on the EEQ in the region [59].

5. Conclusions

This study addressed the need for the large-scale long-term series monitoring of EEQ dynamics in arid regions, recognized the ecological problem of soil salinization in the TRB, proposed the introduction of the RSEISI with the CSI, and implemented spatial temporal monitoring of the EEQ in the TRB from 2000–2022 using the GEE cloud computing platform. The use of the coefficient of variation, temporal information entropy, the Hurst exponent for time-series EEQ change trends, and the geodetector helped to elucidate the underlying driving mechanisms that contributed to these changes. This study found the following:
(i) The RSEISI effectively integrated the combined information of five crucial ecological indicators, namely the EVI, WET, NDBSI, LST, and CSI. The correlation of the RSEISI with each ecological indicator was considerably high, exceeding 0.730. Compared to other datasets such as CHEQ and the RSEI, the RSEISI accurately assessed the significant influence of surface-salinity characteristics on the EEQ, making it an ideal tool for monitoring EEQ in large-scale, long-series arid regions.
(ii) The EEQ of the TRB displayed the situation of oasis area expansion, desert deterioration, and glacier melting. Locally, the annual mean EEQ of the Aksu River, the Kashgar River, the Weigan River, and the Yarkant River was at a high grade with a trend towards a better EEQ. In contrast, the annual mean EEQ of the Taklamakan and Kumtag Deserts was at a low grade with a trend towards a worse EEQ. The deterioration and improvement of the EEQ within the TRB coexist. The Aksu River, the Weigan River, and the main stream have shown an increasing trend in the average annual EEQ, rising by 6.333%, 3.872%, and 3.594%, respectively. Meanwhile, the Qarqan River and the Kriya River have demonstrated a decreasing trend in the average annual EEQ, with decreases of 17.279% and 12.318%, respectively. Moreover, changes in the annual mean EEQ of the remaining sub-basins have been relatively stable.
(iii) The mean value of the RSEISI of the TRB during the period from 2000 to 2022 decreased from 0.292 to 0.263, indicating an overall decrease of 9.793% in EEQ and a slight degradation over the period. Results from the trend and mutation test conducted using the RSEISI showed that the years 2000, 2005, 2010, 2015, 2019, and 2022 were the inflection points where changes occurred. The multiyear average performance of the EEQ grades at these inflection points revealed that the grades were poor (45.800%) > fair (28.369%) > moderate (16.139%) > good (9.080%) > excellent (0.613%). Spatial analysis indicated that areas with higher overall EEQ grades and improvement were mainly concentrated in regions with frequent human activity around the TRB. In contrast, areas with lower EEQ grades and deterioration were mostly located in deserts.
(iv) The overall trend of EEQ for the TRB was predominantly a light decline, comprising around 74.792% of the region, mainly located in the two major deserts and sporadically in various sub-basins. In contrast, EEQ demonstrated an improvement, accounting for 13.381% of the region, mainly in various oases and elevated mountain areas with land-use types of crop land and grassland, indicating that human activities were dominated by restoration forces. An analysis of the Hurst exponent provided insight into the future trends of the EEQ, highlighting an improvement in most areas of the TRB.
(v) The EEQ of the TRB was found to be impacted by the interplay of natural and anthropogenic factors. Soil indicators, land use, precipitation, and temperature played a critical role in the change in the EEQ of the TRB, and the interaction between any two drivers had a greater influence than a single factor. The shift towards a warmer and wetter climate in Xinjiang, in addition to the success of various ecological conservation and restoration projects, contributed to an improvement in the EEQ of the TRB.

Author Contributions

W.C.: conceptualization, methodology, software, validation, and writing—original draft; J.W.: methodology, software, supervision, project administration, and writing—review and editing; J.D.: resources, supervision, and funding acquisition; X.G.: methodology and validation; L.H.: methodology and supervision; S.Q.: methodology and software. All authors have read and agreed to the published version of the manuscript.

Funding

This research was funded by the Key Project of Natural Science Foundation of Xinjiang Uygur Autonomous Region (No. 2020D04038) and the University Scientific Research Plan of the Education Department of Xinjiang Uygur Autonomous Region (No. XJEDU2021Y009).

Data Availability Statement

Not applicable.

Acknowledgments

The authors would like to thank the reviewers for their expertise and valuable input.

Conflicts of Interest

The authors declare no conflict of interest.

References

  1. Liao, W.; Jiang, W. Evaluation of the Spatiotemporal Variations in the Eco-environmental Quality in China Based on the Remote Sensing Ecological Index. Remote Sens. 2020, 12, 2462. [Google Scholar] [CrossRef]
  2. Xu, H.; Wang, Y.; Guan, H.; Shi, T.; Hu, X. Detecting Ecological Changes with a Remote Sensing Based Ecological Index (RSEI) Produced Time Series and Change Vector Analysis. Remote Sens. 2019, 11, 2345. [Google Scholar] [CrossRef] [Green Version]
  3. Wang, R.; Ding, J.; Ge, X.; Wang, J.; Qin, S.; Tan, J.; Han, L.; Zhang, Z. Impacts of climate change on the wetlands in the arid region of Northwestern China over the past 2 decades. Ecol. Indic. 2023, 149, 110168. [Google Scholar] [CrossRef]
  4. Zhang, M.; Tan, S.; Zhang, C.; Han, S.; Zou, S.; Chen, E. Assessing the impact of fractional vegetation cover on urban thermal environment: A case study of Hangzhou, China. Sustain. Cities Soc. 2023, 96, 104663. [Google Scholar] [CrossRef]
  5. Yang, Y.; Li, H.; Qian, C. Analysis of the implementation effects of ecological restoration projects based on carbon storage and eco-environmental quality: A case study of the Yellow River Delta, China. J. Environ. Manag. 2023, 340, 117929. [Google Scholar] [CrossRef] [PubMed]
  6. Jiang, L.; Liu, Y.; Wu, S.; Yang, C. Analyzing ecological environment change and associated driving factors in China based on NDVI time series data. Ecol. Indic. 2021, 129, 107933. [Google Scholar] [CrossRef]
  7. Long, Y.; Jiang, F.; Deng, M.; Wang, T.; Sun, H. Spatial-temporal changes and driving factors of eco-environmental quality in the Three-North region of China. J. Arid Land 2023, 15, 231–252. [Google Scholar] [CrossRef]
  8. Yang, X.; Meng, F.; Fu, P.; Zhang, Y.; Liu, Y. Spatiotemporal change and driving factors of the Eco-Environment quality in the Yangtze River Basin from 2001 to 2019. Ecol. Indic. 2021, 131, 108214. [Google Scholar] [CrossRef]
  9. Yuan, F.; Bauer, M.E. Comparison of impervious surface area and normalized difference vegetation index as indicators of surface urban heat island effects in Landsat imagery. Remote Sens. Environ. 2007, 106, 375–386. [Google Scholar] [CrossRef]
  10. Li, H.; Li, Y.; Song, S.; Wu, G. Variation of the land surface temperature field in rare-Earth ore mining areas based on temperature downscaling. Adv. Space Res. 2022, 69, 3268–3282. [Google Scholar] [CrossRef]
  11. Xia, Q.-Q.; Chen, Y.-N.; Zhang, X.-Q.; Ding, J.-L. Spatiotemporal Changes in Ecological Quality and Its Associated Driving Factors in Central Asia. Remote Sens. 2022, 14, 3500. [Google Scholar] [CrossRef]
  12. Yuan, B.; Fu, L.; Zou, Y.; Zhang, S.; Chen, X.; Li, F.; Deng, Z.; Xie, Y. Spatiotemporal change detection of ecological quality and the associated affecting factors in Dongting Lake Basin, based on RSEI. J. Clean. Prod. 2021, 302, 126995. [Google Scholar] [CrossRef]
  13. Wang, J.; Ding, J.; Ge, X.; Qin, S.; Zhang, Z. Assessment of ecological quality in Northwest China (2000–2020) using the Google Earth Engine platform: Climate factors and land use/land cover contribute to ecological quality. J. Arid Land 2022, 14, 1196–1211. [Google Scholar] [CrossRef]
  14. Wang, J.; Liu, D.; Ma, J.; Cheng, Y.; Wang, L. Development of a large-scale remote sensing ecological index in arid areas and its application in the Aral Sea Basin. J. Arid Land 2021, 13, 40–55. [Google Scholar] [CrossRef]
  15. Zongfan, B.; Ling, H.; Huiqun, L.; Xuhai, J.; Liangzhi, L. Spatiotemporal change and driving factors of ecological status in Inner Mongolia based on the modified remote sensing ecological index. Environ. Sci. Pollut. Res. 2023, 30, 52593–52608. [Google Scholar] [CrossRef] [PubMed]
  16. Wang, F.; Yang, S.; Wei, Y.; Shi, Q.; Ding, J. Characterizing soil salinity at multiple depth using electromagnetic induction and remote sensing data with random forests: A case study in Tarim River Basin of southern Xinjiang, China. Sci. Total Environ. 2021, 754, 142030. [Google Scholar] [CrossRef]
  17. Ding, J.; Yang, S.; Shi, Q.; Wei, Y.; Wang, F. Using Apparent Electrical Conductivity as Indicator for Investigating Potential Spatial Variation of Soil Salinity across Seven Oases along Tarim River in Southern Xinjiang, China. Remote Sens. 2020, 12, 2601. [Google Scholar] [CrossRef]
  18. Yin, X.; Feng, Q.; Li, Y.; Deo, R.C.; Liu, W.; Zhu, M.; Zheng, X.; Liu, R. An interplay of soil salinization and groundwater degradation threatening coexistence of oasis-desert ecosystems. Sci. Total Environ. 2022, 806, 150599. [Google Scholar] [CrossRef]
  19. Fan, G.; Qiang, H.; Xiaoyi, S.; Zhenglong, Y. Study on Dynamic Changes of the Soil Salinization in the Upper Stream of the Tarim River Based On RS and GIS. Procedia Environ. Sci. 2011, 11, 1135–1141. [Google Scholar] [CrossRef] [Green Version]
  20. Ling, H.; Guo, B.; Zhang, G.; Xu, H.; Deng, X. Evaluation of the ecological protective effect of the “large basin” comprehensive management system in the Tarim River basin, China. Sci. Total Environ. 2019, 650, 1696–1706. [Google Scholar] [CrossRef]
  21. Chen, Y.; Ye, Z.; Shen, Y. Desiccation of the Tarim River, Xinjiang, China, and mitigation strategy. Quat. Int. 2011, 244, 264–271. [Google Scholar] [CrossRef]
  22. Li, W.; Huang, F.; Shi, F.; Wei, X.; Zamanian, K.; Zhao, X. Human and climatic drivers of land and water use from 1997 to 2019 in Tarim River basin, China. Int. Soil Water Conserv. Res. 2021, 9, 532–543. [Google Scholar] [CrossRef]
  23. Zhang, Z.; Xu, E.; Zhang, H. Complex network and redundancy analysis of spatial–temporal dynamic changes and driving forces behind changes in oases within the Tarim Basin in northwestern China. CATENA 2021, 201, 105216. [Google Scholar] [CrossRef]
  24. Jiao, A.; Wang, Z.; Deng, X.; Ling, H.; Chen, F. Eco-Hydrological Response of Water Conveyance in the Mainstream of the Tarim River, China. Water 2022, 14, 2622. [Google Scholar] [CrossRef]
  25. Wang, Y.; Wang, Y.; Xia, T.; Li, Y.; Li, Z. Land-use function evolution and eco-environmental effects in the tarim river basin from the perspective of production–living–ecological space. Front. Environ. Sci. 2022, 10, 1004274. [Google Scholar] [CrossRef]
  26. Xue, L.; Fu, F.; Chen, X.; Liu, Y.; Han, Q.; Liao, S.; Wei, Q. Analysis on water use efficiency of Populus euphratica forest ecosystem in arid area. Theor. Appl. Climatol. 2021, 145, 717–730. [Google Scholar] [CrossRef]
  27. Zhang, Q.; Sun, C.; Chen, Y.; Chen, W.; Xiang, Y.; Li, J.; Liu, Y. Recent Oasis Dynamics and Ecological Security in the Tarim River Basin, Central Asia. Sustainability 2022, 14, 3372. [Google Scholar] [CrossRef]
  28. Zheng, Z.; Wu, Z.; Chen, Y.; Yang, Z.; Marinello, F. Exploration of eco-environment and urbanization changes in coastal zones: A case study in China over the past 20 years. Ecol. Indic. 2020, 119, 106847. [Google Scholar] [CrossRef]
  29. Wei, Z.; Peijun, D.U.; Shanchuan, G.U.O.; Cong, L.I.N.; Hongrui, Z.; Pingjie, F.U. Enhanced remote sensing ecological index and ecological environment evaluation in arid area. J. Remote Sens. 2023, 27, 299–317. [Google Scholar]
  30. Yang, H.; Yu, J.; Xu, W.; Wu, Y.; Lei, X.; Ye, J.; Geng, J.; Ding, Z. Long-time series ecological environment quality monitoring and cause analysis in the Dianchi Lake Basin, China. Ecol. Indic. 2023, 148, 110084. [Google Scholar] [CrossRef]
  31. Wang, L.; Wang, J.; Ding, J.; Li, X. Estimation and Spatiotemporal Evolution Analysis of Actual Evapotranspiration in Turpan and Hami Cities Based on Multi-Source Data. Remote Sens. 2023, 15, 2565. [Google Scholar] [CrossRef]
  32. Yibo, Y.; Ziyuan, C.; Xiaodong, Y.; Simayi, Z.; Shengtian, Y. The temporal and spatial changes of the ecological environment quality of the urban agglomeration on the northern slope of Tianshan Mountain and the influencing factors. Ecol. Indic. 2021, 133, 108380. [Google Scholar] [CrossRef]
  33. Ebrahimi, N.; Pflughoeft, K.; Soofi, E.S. Two measures of sample entropy. Stat. Probab. Lett. 1994, 20, 225–234. [Google Scholar] [CrossRef]
  34. Zhang, Y.; Yang, Z.; Li, W. Analyses of urban ecosystem based on information entropy. Ecol. Model. 2006, 197, 1–12. [Google Scholar] [CrossRef]
  35. Wang, C.; Zhao, H.J. Analysis of remote sensing time-series data to foster ecosystem sustainability: Use of temporal information entropy. J. Remote Sens. 2019, 40, 2880–2894. [Google Scholar] [CrossRef]
  36. Zhao, H.; Liu, X.; Wang, C. Spatio-temporal information entropy for the analysis of ecological sustainability and its application in the Yanhe watershed. Acta Ecol. Sin. 2022, 42, 3749–3758. [Google Scholar]
  37. Li, J.; Wang, J.; Zhang, J.; Zhang, J.; Kong, H. Dynamic changes of vegetation coverage in China-Myanmar economic corridor over the past 20 years. Int. J. Appl. Earth Obs. Geoinf. 2021, 102, 102378. [Google Scholar] [CrossRef]
  38. Zhang, D.; Zuo, X.; Zang, C. Assessment of future potential carbon sequestration and water consumption in the construction area of the Three-North Shelterbelt Programme in China. Agric. For. Meteorol. 2021, 303, 108377. [Google Scholar] [CrossRef]
  39. Zhang, M.; Kafy, A.-A.; Ren, B.; Zhang, Y.; Tan, S.; Li, J. Application of the Optimal Parameter Geographic Detector Model in the Identification of Influencing Factors of Ecological Quality in Guangzhou, China. Land 2022, 11, 1303. [Google Scholar] [CrossRef]
  40. Wang, J.; Xu, C. Geodetector: Principle and prospective. Acta Geogr. Sin. 2017, 72, 116–134. [Google Scholar]
  41. Zhuang, Q.; Shao, Z.; Huang, X.; Zhang, Y.; Wu, W.; Feng, X.; Lv, X.; Ding, Q.; Cai, B.; Altan, O. Evolution of soil salinization under the background of landscape patterns in the irrigated northern slopes of Tianshan Mountains, Xinjiang, China. CATENA 2021, 206, 105561. [Google Scholar] [CrossRef]
  42. Guo, B.; Lu, M.; Fan, Y.; Wu, H.; Yang, Y.; Wang, C. A novel remote sensing monitoring index of salinization based on three-dimensional feature space model and its application in the Yellow River Delta of China. Geomat. Nat. Hazards Risk 2023, 14, 95–116. [Google Scholar] [CrossRef]
  43. Ge, X.; Ding, J.; Teng, D.; Xie, B.; Zhang, X.; Wang, J.; Han, L.; Bao, Q.; Wang, J. Exploring the capability of Gaofen-5 hyperspectral data for assessing soil salinity risks. Int. J. Appl. Earth Obs. Geoinf. 2022, 112, 112. [Google Scholar] [CrossRef]
  44. Jiang, N.; Zhang, Q.; Zhang, S.; Zhao, X.; Cheng, H. Spatial and temporal evolutions of vegetation coverage in the Tarim River Basin and their responses to phenology. CATENA 2022, 217, 106489. [Google Scholar] [CrossRef]
  45. Chen, Y.; Li, W.; Fang, G.; Li, Z. Review article: Hydrological modeling in glacierized catchments of central Asia—status and challenges. Hydrol. Earth Syst. Sci. 2017, 21, 669–684. [Google Scholar] [CrossRef] [Green Version]
  46. Hou, Y.; Chen, Y.; Ding, J.; Li, Z.; Li, Y.; Sun, F. Ecological Impacts of Land Use Change in the Arid Tarim River Basin of China. Remote Sens. 2022, 14, 1894. [Google Scholar] [CrossRef]
  47. Zhang, Y.; An, C.; Liu, L.; Zhang, Y.; Lu, C.; Zhang, W. High Mountains Becoming Wetter While Deserts Getting Drier in Xinjiang, China since the 1980s. Land 2021, 10, 1131. [Google Scholar] [CrossRef]
  48. Xue, L.; Wang, J.; Zhang, L.; Wei, G.; Zhu, B. Spatiotemporal analysis of ecological vulnerability and management in the Tarim River Basin, China. Sci. Total Environ. 2019, 649, 876–888. [Google Scholar] [CrossRef] [PubMed]
  49. Zhang, S.; Wang, Y.; Wang, Y.; Li, Z.; Hou, Y. Spatiotemporal Evolution and Influencing Mechanisms of Ecosystem Service Value in the Tarim River Basin, Northwest China. Remote Sens. 2023, 15, 591. [Google Scholar] [CrossRef]
  50. Su, B.; Xiao, C.; Chen, D.; Huang, Y.; Che, Y.; Zhao, H.; Zou, M.; Guo, R.; Wang, X.; Li, X.; et al. Glacier change in China over past decades: Spatiotemporal patterns and influencing factors. Earth-Sci. Rev. 2022, 226, 103926. [Google Scholar] [CrossRef]
  51. Cai, X.; Xu, C.; Li, Z. Glacier changes and its effect on water resources in the upper reaches of Aksu River, Tien Shan, China, from 1989 to 2016. Arab. J. Geosci. 2022, 15, 565. [Google Scholar] [CrossRef]
  52. Han, L.; Ding, J.; Zhang, J.; Chen, P.; Wang, J.; Wang, Y.; Wang, J.; Ge, X.; Zhang, Z. Precipitation events determine the spatiotemporal distribution of playa surface salinity in arid regions: Evidence from satellite data fused via the enhanced spatial and temporal adaptive reflectance fusion model. Int. J. Appl. Earth Obs. Geoinf. 2021, 206, 105546. [Google Scholar] [CrossRef]
  53. Ma, X.; Zhu, J.; Yan, W.; Zhao, C. Projections of desertification trends in Central Asia under global warming scenarios. Sci. Total Environ. 2021, 781, 146777. [Google Scholar] [CrossRef] [PubMed]
  54. Bai, J.; Li, J.; Bao, A.; Chang, C. Spatial-temporal variations of ecological vulnerability in the Tarim River Basin, Northwest China. J. Arid Land 2021, 13, 814–834. [Google Scholar] [CrossRef]
  55. Liu, Y.; Guo, B.; Lu, M.; Zang, W.; Yu, T.; Chen, D. Quantitative distinction of the relative actions of climate change and human activities on vegetation evolution in the Yellow River Basin of China during 1981–2019. J. Arid. Land 2023, 15, 91–108. [Google Scholar] [CrossRef]
  56. Li, Z.; Chen, Y.; Wang, Y.; Li, W. Drought promoted the disappearance of civilizations along the ancient Silk Road. Environ. Earth Sci. 2016, 75, 1116. [Google Scholar] [CrossRef]
  57. Feng, X.; Fu, B.; Piao, S.; Wang, S.; Ciais, P.; Zeng, Z.; Lü, Y.; Zeng, Y.; Li, Y.; Jiang, X.; et al. Revegetation in China’s Loess Plateau is approaching sustainable water resource limits. Nat. Clim. Change 2016, 6, 1019–1022. [Google Scholar] [CrossRef]
  58. Yu, Y.; Guo, B.; Wang, C.; Zang, W.; Huang, X.; Wu, Z.; Xu, M.; Zhou, K.; Li, J.; Yang, Y. Carbon storage simulation and analysis in Beijing-Tianjin-Hebei region based on CA-plus model under dual-carbon background. Geomat. Nat. Hazards Risk 2023, 14, 2173661. [Google Scholar] [CrossRef]
  59. Qin, S.; Ding, J.; Ge, X.; Wang, J.; Wang, R.; Zou, J.; Tan, J.; Han, L. Spatio-Temporal Changes in Water Use Efficiency and Its Driving Factors in Central Asia (2001–2021). Remote Sens. 2023, 15, 767. [Google Scholar] [CrossRef]
Figure 1. Location of the study area. (a) The Tarim River Basin is located in Xinjiang Province, China. (b) Land-use and cover (LUCC) map of the TRB from 2020, extracted from the CLCD dataset and saline land data. (c) Elevation distribution map of the TRB, including rivers, sub-basins, and town distribution.
Land 12 01309 g001
Figure 2. The flow chart.
Land 12 01309 g002
Figure 3. Results of PCA from 2000 to 2022 (loading and contribution to PC1).
Land 12 01309 g003
Figure 4. Scatter plot of the correlation matrix between the RSEISI, CSI, EVI, LST, NDBSI, and WET. The green scatter plot above and below the diagonal line shows the relationship between the data pairs, with the confidence ellipse and the fitted line shown as orange dashed lines. The box plot located on the diagonal demonstrates the distribution of the data for each indicator, with the maximum, mean, and minimum values shown in order from top to bottom.
Land 12 01309 g004
Figure 5. Multiyear (2001–2019) spatial distribution of (a) RSEISI, (b) RSEI, (c) CHEQ, (d) CSI, (e) RSEISI–RSEI, and (f) RSEI–CHEQ (all indicators were normalized to 0–1).
Land 12 01309 g005
Figure 6. Spatial and temporal distribution of the RSEISI of the total TRB from 2000 to 2022.
Land 12 01309 g006
Figure 7. Temporal trend of the RSEISI values of nine sub-basins and two deserts from 2000 to 2022. Note: The color of the line indicates the grade of the RSEISI: the green line represents RSEISI of a moderate grade, the yellow line represents RSEISI of a fair grade, and the red line represents RSEISI of a poor grade.
Land 12 01309 g007
Figure 8. Distribution of RSEISI grades in the TRB from 2000 to 2022.
Land 12 01309 g008
Figure 9. Sankey diagram of RSEISI grades within the transfer matrix of the TRB from 2000 to 2022.
Land 12 01309 g009
Figure 10. The spatial distribution of changes in the RSEISI grades of the TRB from 2000 to 2022.
Land 12 01309 g010
Figure 11. The stableness of the RSEISI.
Land 12 01309 g011
Figure 12. The RSEISI trend. (a) E is the temporal information entropy; (b) E’ is the temporal series information entropy; (c) the EEQ trend represents the RSEISI change trend grades.
Land 12 01309 g012
Figure 13. The sustainability of the RSEISI.
Land 12 01309 g013
Figure 14. Factor q value for the impact of each driver on EEQ.
Land 12 01309 g014
Figure 15. Factor q values indicating the impact of each driver on the RSEISI.
Land 12 01309 g015
Table 1. Classification standard for the future trend analysis of EEQ based on the Hurst exponent and the temporal information entropy trend.
EEQ TrendClassification StandardFuture Trend of EEQ
Strong degradation0 < H < 0.5Strong anti-sustained degradation
Weak degradation0 < H < 0.5Weak anti-sustained degradation
Strong improvement0 < H < 0.5Strong anti-sustained improvement
Weak improvement0 < H < 0.5Weak anti-sustained improvement
Unchanged-Essentially constant
Weak degradation0.5 < H < 1Weak persistent degradation
Strong degradation0.5 < H < 1Strong persistent degradation
Weak improvement0.5 < H < 1Weak persistent improvement
Strong improvement0.5 < H < 1Strong persistent improvement
Disclaimer/Publisher’s Note: The statements, opinions and data contained in all publications are solely those of the individual author(s) and contributor(s) and not of MDPI and/or the editor(s). MDPI and/or the editor(s) disclaim responsibility for any injury to people or property resulting from any ideas, methods, instructions or products referred to in the content.

