Abstract
The vulnerability of China’s rural system is becoming increasingly obvious due to the multiple pressures of geological conditions and human interference. This study selected Guizhou Province to measure the degree of vulnerability and determine a rural system’s temporal and spatial characteristics. We select the county as the unit, build the vulnerability assessment of a rural system based on the three dimensions of exposure, sensitivity, and adaptability, and employ the combination weighting method. The final development indicator of the rural vulnerability measurement model was obtained using the Technique for Order Preference by Similarity to the Ideal Solution method. Further, SatScan v10.1 software was used for spatiotemporal scanning statistical analysis, and its clustering pattern was analyzed. Finally, visual analysis was conducted using ArcGIS 10.7 software. The results showed that exposure and sensitivity have an increasing fluctuation trend, while adaptability has a decreasing trend. The combined effect resulted in an increasing trend of vulnerability. The mean values of exposure, sensitivity, adaptation, and rural vulnerability in Yunyan are 0.906, 0.894, 0.772, and 1.028 higher than those in Nanming, i.e., 0.417, 0.426, 0.687, and 0.262, respectively. The vulnerability of the rural system shows a spatial pattern of “low in the middle and high on both sides,” with spatial clustering, and Guiyang and Zunyi are the cluster centers.
1. Introduction
The rural system is a complex system composed of social, economic, and environmental factors and is the spatial carrier for residents, especially for living and working [1]. With the rapid development of the economy and urbanization, the prominent contradiction between humans and the natural environment in rural areas has made most rural systems vulnerable. This has also led residents to confront serious problems such as water and soil loss, land degradation, and environmental pollution [2]. In China, an increasing number of rural systems are experiencing the same vulnerability, while some elements of the rural system have changed to urban characteristics [3]. This growing vulnerability seriously restricts the sustainable development of rural areas. In recent years, the Chinese government has implemented a series of rural revitalization policies to balance urban and rural development. For instance, the government has focused on improving food security, developing rural industries, implementing rural construction, and strengthening rural governance. In the process of rural revitalization, the powerful attraction of industrialization and urbanization was not only a positive factor in promoting the rural industry but also a negative factor in hindering the development of the rural economy and society. Rural vulnerability still exists and needs attention. Therefore, the study of rural vulnerability is beneficial for rural areas to identify the advantages and disadvantages of development and promote rural revitalization. As an effective tool in rural vulnerability, rural vulnerability assessment is of great significance in understanding the current situation of rural systems and measuring the degree of damage to the systems under adverse impacts.
The concept of vulnerability is derived from the assessment of natural disasters. Adger established the link between vulnerability, adaptability, and resilience in natural and social systems and proposed the term “vulnerability” in 2006 [4,5]. According to the IPCC [6], vulnerability is composed of three basic elements: exposure, sensitivity, and adaptability. As these three elements are the key to determining the vulnerability of the system to climate change, they are frequently used in the literature of the European Environment agency report [7,8,9] and Swart et al. [10] and were subsequently used in climate change-related vulnerability assessments [11,12], which have now been cited in multiple research fields. In relevant studies, vulnerability is viewed as a state presented by natural environmental changes or adverse human activities, such as the high intensity of nightlight and fertilizer use. It is also considered as a collection of exposure, sensitivity, and adaptation [13,14]. Exposure reflects the state of a system when it is interfered with due to external pressure, which may come from the natural environment or human activities. On the contrary, sensitivity reflects the ability of the system to perceive external pressure sources, which depends on the natural background conditions within the research unit and the combination of economic, demographic, and other factors. Adaptability reflects the adjustment ability of a system and its resilience to external interference sources. It depends on food security, education, social welfare, income level, and other factors. Generally speaking, exposure, sensitivity, and vulnerability have positive correlations; the greater the exposure and sensitivity, the greater the vulnerability. There is a negative correlation between adaptability and vulnerability; the greater the adaptability, the smaller the vulnerability. Current research on vulnerability is mainly related to ecological [15,16,17,18], water-resource [19,20,21], social [22,23,24], socio-ecological [25], socio-economic [26,27], climate [28,29,30], urban [31,32,33], rural [14,34], drought [2,35,36], human health [37], agricultural [38,39,40], and urban heat vulnerability [41]. Some of these studies have paid attention to the inherent vulnerability of natural or social systems [42], while others have gradually involved the vital role of people in the formation and reduction of vulnerability [43]. In these studies, the study models used for evaluating vulnerability generally included ”exposure–sensitivity–adaptation (VSD)” [44,45] and “pressure–state–response (PSR)” [46,47]. The PSR model focuses on the interaction between humans and the environment, while the VSD model considers human–environment coupled ecosystems and highlights the change in vulnerability under natural and human influences [48]. Rural vulnerability assessment focuses more on the comprehensive impact of natural and human factors; hence, the VSD theoretical model is more suitable for this study. The evaluation indicator system of VSD combines social–ecological, ecological–economic, and human–land systems [49]. For the construction of a specific indicator, scholars have their own considerations. Cai and Xingran considered human disturbance, terrain conditions, environmental protection, social support, and other indicators [50]. Hong and Wuyang established an ecological vulnerability assessment indicator system containing 9 elements and 12 indicators with respect to ecological sensitivity, ecological pressure, and self-resilience [51]. Moreover, there are a series of indicator weighting methods, including the principal component method [52], which is relative to an identified distribution unit scoring method [53], entropy method [54,55], analytic hierarchy process (AHP) [56], and fuzzy comprehensive evaluation method [57]. Among them, the entropy method is commonly used because it determines the weight through the variation degree of each indicator value and avoids deviations caused by human factors. Hence, many scholars have conducted several studies on vulnerability and achieved corresponding results. Wu and Tang selected 13 indicators, including soil erosion sensitivity, population density, and development-land proportion, to construct the ecological vulnerability evaluation indicator system for Badong County. The results showed that the ecological vulnerability of Badong County was at a medium level or above; it is characterized as “high in the north and south and low in between” [58]. Hu et al. used 14 indicators, including population density, natural population growth rate, per capita water resources, and per capita cultivated land area. The results of inherent ecological vulnerability indicated that the coastal areas in the north of the study area and the high-altitude areas in the southwest are the main high-inherent ecological vulnerability areas, while the middle of the study area is the low-inherent ecological vulnerability area [16]. Boori et al. selected the satellite remote sensing ecological indicator based on four surface parameters (dryness, greenness, temperature, and humidity) for ecological vulnerability analysis and distribution [52]. However, the following deficiencies still exist: First, there are few studies on rural vulnerability, especially in areas where the local economy is relatively undeveloped due to geological conditions, e.g., fragile ecology. Second, there are few studies on the combination of subjective and objective weighting methods. A single weighting method cannot obtain good evaluation results because subjective weighting methods rely too much on human factors; for example, AHP is greatly influenced by personal cognition, values, and preferences. Objective weighting methods rely too much on the accuracy and completeness of the original data. For example, the entropy method has the following disadvantages: First, the horizontal influence between indicators cannot be considered. Second, it is highly dependent on the sample, and the weight will also change depending on the modeling sample; however, the combination of the subjective weighting AHP and the objective weighting entropy method can solve these problems well. Third, the system score is mainly based on the comprehensive scoring method, and the Technique for Order Preference by Similarity to Ideal Solution (TOPSIS) evaluation method is rarely used. TOPSIS can compare multidimensional and multiple indicators, objectively and comprehensively, reflecting the dynamic changes of each evaluation indicator. Finally, research on this topic and spatiotemporal variation have been explored in only a few studies. Therefore, this study took the rural vulnerability of 88 counties in Guizhou Province as the research subject based on the VSD theoretical model and selected 22 evaluation indicators. The combination weighting method comprising the entropy value method and AHP was used. The development indicator of exposure, sensitivity, and adaptability (ESA) in the rural vulnerability measurement model was obtained using TOPSIS. Through the statistical analysis of space–time scanning using SatScan v10.1 software and visual analysis using ArcGIS 10.7, the spatial aggregation law of rural system vulnerability in Guizhou Province is obtained.
Guizhou Province, which is located in the hinterland of southwest China, is a transportation hub and an important part of the Yangtze River Economic Belt. However, due to the fragile ecological environment and poorly developed transportation facilities, Guizhou’s economy has been underdeveloped for a long time, especially in rural areas, which are vulnerable to population loss and marked by dilapidated villages. After five years of targeted poverty alleviation, all rural areas in Guizhou have been lifted out of poverty, with great economic development and marked improvement in infrastructure. Although rural revitalization has been conducted, many rural areas are still slow to develop due to their own constraints, such as a lack of funds, water, and technology. However, most academic studies on rural areas in Guizhou focus on the ecological environment, whereas few studies focus on rural vulnerability in this region. The assessment of the rural system in Guizhou is essential to alleviating the contradiction between development and natural systems, identifying strengths and weaknesses, and promoting sustainable rural development. Therefore, this study assessed the rural vulnerability of 88 counties in Guizhou Province based on a VSD model composed of 22 indicators. The results of this study can provide scientific reference for the rural ecological environment and rural vulnerability governance in 88 counties of Guizhou Province, as well as offer corresponding measures for rural social governance.
2. Research Methods and Models
2.1. Study Area
Guizhou Province, abbreviated as “Qian” or “Gui”, is located in southwest China (103°36′–109°35′ E, 24°37′–29°13′ N) (Figure 1). Guizhou belongs to the Yunnan Guizhou Plateau, with an average altitude of 1100 m. Guizhou Province is a typical karst landform, with a total area of ~109,084 km2. The fragility of the local ecosystem has led to water and soil loss, rocky desertification, and landslides. Guizhou Province currently governs 9 prefecture-level administrative regions (including 6 prefecture-level cities and 3 autonomous prefectures), encompassing 88 counties. Due to its geographical location and geological conditions, most of Guizhou is a mountain plateau with karst landforms all over the province [59]. In some areas, rocky desertification is significant [60,61]. The economy is relatively undeveloped; the gross domestic product (GDP) accounted for 1782.656 trillion yuan in 2020, and the tertiary industry only accounts for 50.19%, which is lower than the national average (52.2%). The per capita disposable income of rural residents in Guizhou was 11,642 yuan in 2020, equivalent to 68% of the national average. The current situation of poor basic infrastructure, fragile ecological environment, and low overall income in Guizhou Province lags behind the goal of building a well-off society comprehensively. However, due to rapid urbanization in recent years, the rural system is being disturbed more frequently due to human activities, and the contradiction between the rural populace and land use has become increasingly serious, which makes the study of the rural system in Guizhou Province even more important.
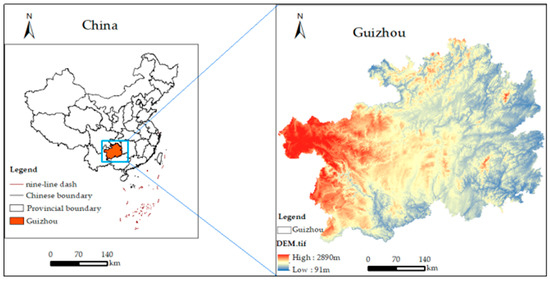
Figure 1.
Administrative divisions of the research area.
2.2. Data Source
In this study, the administrative division data was obtained from the National Basic Geographic Information System (http://ngcc.sbsm.gov.cn/, accessed on 10 July 2022), with a spatial resolution of 30 m. The annual average precipitation, average temperature with a spatial resolution of 1 km, PM2.5 concentration data with a spatial resolution of 1 km, and net primary productivity (NPP) with a spatial resolution of 500 m from 2015 to 2020 were collected from the National Earth System Science Data Center (http://www.geodata.cn/, accessed on 5 August 2022). The yearly land-use data with a spatial resolution of 30 m and the normalized vegetation indicator (NDVI) with a spatial resolution of 1 km were obtained from the Institute of Geographic Sciences and Resources, Chinese Academy of Sciences (https://www.resdc.cn/, accessed on 5 August 2022). Annual DEM data with a spatial resolution of 30 m were obtained from the Geospatial Data Cloud (http://www.gscloud.cn/, accessed on 3 August 2022). The annual nightlight data with a spatial resolution of 0.5 km were downloaded from the NOAA/National Environmental Information Center (https://ngdc.noaa.gov/, accessed on 3 August 2022). Annual road data with a spatial resolution of 30 m from 2015 to 2020 were obtained from the “Open Street Map of Geofabrik” (https://download.geofabrik.de/, accessed on 5 August 2022). The social and economic statistics were mainly collected from the China County Statistical Yearbook (2016 and 2021), Guizhou Provincial Statistical Yearbook (https://www.guizhou.gov.cn/zwgk/zfsj/tjnj/, accessed on 3 August 2022), Guizhou Provincial Macroeconomic Database (http://hgk.guizhou.gov.cn/indicator.vhtml, accessed on 3 August 2022), Government Work Reports (https://www.guizhou.gov.cn/zwgk/zfgzbg/gzsgzbg/, accessed on 3 August 2022), and other resources. Additionally, after coordinate transform and resampling, all raster data were uniformly resampled to raster data (30 m × 30 m) using ArcGIS 10.7 for research.
2.3. Indicator Construction and Normalization Method
2.3.1. Indicator Construction
Based on the relevant studies [62,63,64,65,66], this study established the evaluation indicators of rural vulnerability in Guizhou Province according to the VSD model (Table 1).

Table 1.
Rural vulnerability indicators and weights of Guizhou Province.
- Exposure: The indicators of exposure reflect the state of the rural system as interfered with by external pressure originating from the natural environment or human activities [67]. Consequently, the exposure of rural vulnerability related to the natural environment is measured by factors such as climate, air pollution, the intensity of economic activity, the proportion of construction land, cultivated land fragmentation indicator, land-use landscape fragmentation indicator, and fertilizer application intensity, which fundamentally affect agriculture and the life of the people in rural areas. The greater the exposure value, the more vulnerable the rural system. Mean annual precipitation and temperature reflect the disturbance of the natural environment in the rural system. Too high or too low precipitation and temperature will increase the exposure of the rural system. PM2.5 concentration represents the degree of air pollution, increasing the exposure of the rural system and affecting traffic travel and human health. Nightlight intensity reflects the intensity of human activities at night in the region. The greater the value, the greater the exposure. Simultaneously, considering that population size and economic vitality aggravate or delay these effects to a certain extent, regional GDP and population density are added to the indicators. The proportion of construction land, cultivated land fragmentation, land-use landscape fragmentation, and fertilizer application intensity represent the current situation of land use and the amount of fertilizer applied in the region. The larger the value is, the greater the exposure. They reflect the impact of human activities on the rural system.
- Sensitivity: The indicators of sensitivity express the ability of the rural system to perceive external pressure, which depends on geological conditions, economy, and demographic factors [63,68]. Accordingly, the sensitivity of rural vulnerability is denoted by topography and landform, vegetation cover, population density, economic strength, the structure of the industries, ecological service functions, and the development of agriculture. The greater the value, the greater the vulnerability of the rural system. Natural background conditions (topographic relief and vegetation cover) are the basis of system sensitivity. Excessive slope, elevation, and low vegetation coverage are important factors that increase system sensitivity. However, population and industrial economic factors have become the main factors affecting sensitivity to the development of the economy and society. Excessive population density will put pressure on the ecological environment, transportation, and resources. The large proportion of primary industry in the industrial structure indicates that the greater the dependence of rural systems on agriculture, the more obvious the impact of the natural environment. Additionally, the region’s economic strength, fiscal capacity, and industrial structure are negative indicators. The good economic strength, strong fiscal capacity, and reasonable industrial structure of the region can effectively resist external disturbances and reduce the system’s sensitivity.
- Adaptability: The adaptability indicator refers to the ability to adjust and the resilience of the rural system to external interference [14]. Herein, the indicators of adaptability are divided into seven primary categories: food security, level of education, social welfare, level of savings, income level, infrastructure construction, and job security. The higher the adaptability value, the lower the rural vulnerability. The per capita grain possession is selected to represent the food security in the region. The number of primary and secondary school students per 10,000 people and the number of beds per 1000 people indicate the level of education and social welfare, respectively. The per capita disposable income of rural residents and local per capita fiscal revenue reflects the income level of farmers and the local financial situation in the region. The road network density is used to characterize local traffic accessibility and infrastructure construction. Since the implementation of the rural revitalization strategy, the construction of “group access” highways has been further promoted. Currently, road construction in rural areas of China has achieved full coverage, so the railways and highways that reflect the infrastructure construction in China are selected to measure the transportation level of each rural system. The growth rate of rural employees is used to characterize the local employment security level. The greater the value of the above indicators, the more capable the residents and the government are of recovering quickly from the adverse environment and achieving sustainable development.
2.3.2. Normalization Method
The values of the indicators were normalized between 0 and 1 to eliminate the impact of the unit of the original data. There were 88 counties, and each county had 24 indicators. The indicators were classified into positive and negative. Positive indicators indicated upward or forward development and growth. The higher the value of these indicators, the better the evaluation will be. Positive indicators are also called benefit indicators or expectations of large indicators, whereas negative indicators are just the opposite. The equations for the positive and negative indicators refer to the relevant literature [63].
2.3.3. Entropy Method
Entropy is a mathematical method used to determine the dispersion degree of an indicator [69]. The higher the degree of dispersion, the greater the impact of this indicator on the comprehensive evaluation. The steps to calculate the dispersion degree refer to the literature [54].
2.3.4. AHP Model
The AHP model has become the most widely used method for spatial indicator weighting (Qij). In this study, the weight matrix was first established by the Yaahp software. Then, the weight of each indicator was obtained via the consistency test (the consistency ratio was set to 0.0812, 0.0892, and 0.894), as shown in Table 1.
2.3.5. Method for Combining Weights
The final weight of each indicator Wij was determined via multiplication synthesis, which can highlight the importance of indicators in the process of multi-indicator decision-making and obtain a relatively scientific and reasonable rural vulnerability assessment result [70].
2.4. TOPSIS
TOPSIS was first proposed by Hwang and Yoon in 1981 as a method of evaluation [71] that relied on the closeness of a limited number of evaluation objects to the ideal target. By defining metrics in the target space, the degree to which the target approaches or deviates from the positive and negative ideal solutions can be calculated [72]. This method has recently extended the process of calculating weight using the entropy method and AHP [73]. Multidimensional and multiple indicators can be compared, and the dynamic changes of each indicator can be objectively and comprehensively reflected in the whole process of TOPSIS [74]. See the references for specific steps [75].
Assessment of Rural Vulnerability
In the VSD model of rural vulnerability, exposure was positively correlated with rural vulnerability, and adaptability was negatively correlated with rural vulnerability. Moreover, sensitivity has a multiplier effect on rural vulnerability because it mostly reflects the characteristics of the assessed villages. Therefore, the rural vulnerability assessment model can be written as follows [63]:
where V represents the result of rural vulnerability, and E, S, and A represent the exposure, sensitivity, and adaptability of the VSD model, respectively.
V = E + S − A,
Subsequently, exposure, sensitivity, adaptability, and rural vulnerability were divided into five levels: lower, low, medium, high, and higher vulnerabilities (Table 2) [63].
Table 2.
Classification of exposure, sensitivity, suitability, and rural vulnerability in Guizhou Province.
To determine the categories and quantities of the leading factors of vulnerability in the counties of Guizhou Province, this study introduced the classification methods of leading factors into the classification of vulnerability types in rural production space systems. The specific formulas are shown in Equations (2)–(4) [76]. The methods are used to identify the leading factors of rural vulnerability in each county. Because vulnerability is positively correlated with exposure and sensitivity and vulnerability is negatively correlated with adaptability, the leading factors of rural vulnerability in each county are shown in Table 3.
where CE, CS, and CA represent the difference values between the exposure, sensitivity, and adaptability values and their average values, respectively. E, S, and A represent the average values of exposure, sensitivity, and adaptability of the county, respectively.
Table 3.
Dominant or auxiliary factors of rural vulnerability.
Then, vulnerability types were determined according to the types and quantities of leading factors of rural vulnerability in each county. In addition, rural vulnerability in Guizhou Province in 2015 and 2020 was divided into eight types, as shown in Table 4. If the number of leading factors is 0, it is defined as a weak, comprehensive, and fragile type of vulnerability. When the number of dominant factors is 1, the dominant factors are defined as the vulnerable types of exposure, sensitivity, and adaptability. When the number of dominant factors is 2, the types of dominant factors are defined as exposure-sensitive vulnerable type, exposure-adapted vulnerable type, and sensitive-adapted vulnerable type. If the number of dominant factors is 3, it is defined as a strong comprehensive vulnerability type.
Table 4.
Classification of rural vulnerability types.
2.5. Spatiotemporal Scanning Statistical Analysis
Spatiotemporal scanning statistics aim to detect whether the aggregation or random distribution considerably increases in a certain spatial or temporal range. This is beneficial for finding the collection of spatiotemporal events that may have abnormal aggregation [77]. Furthermore, it is essential to identify geographic regions where the number of target activities is higher than that in the surrounding areas [78]. Therefore, spatial scanning statistics have become a common method to detect and evaluate spatial clustering [79]. Kulldorff [80] proposed the first spatiotemporal scanning statistics analysis method, primarily used to detect the clustering of disaster events in time and space. Recently, scholars have applied this method to different research fields. The application scope of spatiotemporal scanning statistics analysis started with the study of epidemic infectious diseases [81] and then extended to population mortality [82] and criminal acts [83]. The spatiotemporal scanning statistics method using SatScan has been introduced into geographical [84] and related research [85]. This study used SatScan v10.1 (http://www.satscan.org, accessed on 20 August 2022) to detect the spatiotemporal aggregation of rural vulnerability in Guizhou Province.
After an in-depth analysis of the data in this study, it was found that the forward-looking spatiotemporal rearrangement scanning statistics model cannot effectively analyze negative numbers and decimal places. To ensure the accuracy of the data, the evaluation value of rural vulnerability in each county of Guizhou Province in 2015 and 2020 is added to the absolute value of its maximum negative number, which is increased by 10,000 times. The prospective spatiotemporal rearrangement scanning statistics model does not need population data, and the required file data are the vulnerability data files and geographic coordinate files of each county. In this study, the minimum period was set to 50% of the research period, with 1 year as the unit, 25% of the population risk, and 999 Monte Carlo simulations. The statistical significance test level of the spatiotemporal clustering results is p < 0.001. The research results are outputted in a shapefile format and imported into ArcGIS 10.7 software for visualization.
3. Results
3.1. Temporal and Spatial Evolution Characteristics of Rural Vulnerability in Guizhou Province
3.1.1. Exposure
The exposure of rural vulnerability in 2015 and 2020 was calculated and classified (Figure 2). Generally, the distribution of exposure in 2015 and 2020 was characterized as “low in the north and high in the south”, which exhibited a decrease from the core urban regions of Guizhou Province to the surrounding areas. In 2015, low-grade C1 was dominant in Guizhou Province, and these low-grade C1 counties were mainly distributed in northern Guizhou, while other C2 and above counties were mainly distributed in southern Guizhou, and only isolated C2 and C3 counties were distributed in northern and eastern Guizhou (Renhuai and Honghuagang are the only two counties in northern Guizhou). By 2020, C1 and C2 levels of exposure were the main levels in Guizhou Province. In 2015, C2 and above counties were mainly distributed in southern Guizhou, and the trend was more obvious in 2020. By comparing the pictures of the two periods, it can be seen that the general trend of exposure is gradually transformed from low grade to high grade, among which the conversion from C1 to C2 is the most obvious and the conversion from C2 to C3 is relatively obvious. The number of C2 and above grade counties around Guiyang increased gradually, and the growth rate was even observed in the east and west. From 2015 to 2020, the distribution of exposure showed a downward trend, concluding that some rural systems in Guizhou Province became more vulnerable.
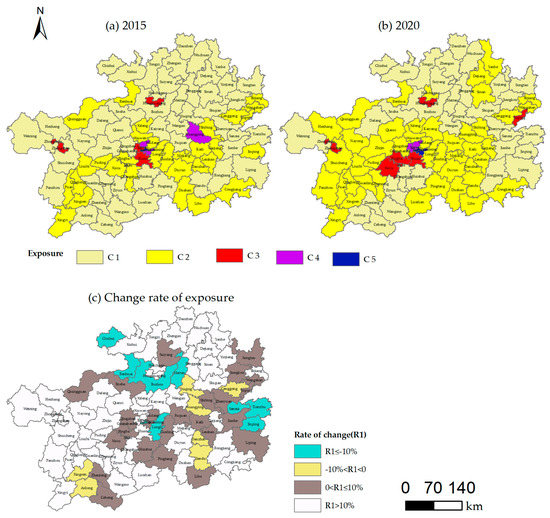
Figure 2.
Spatial and temporal distribution of rural exposure in Guizhou Province, and the change rate of exposure. (a) Spatial distribution of rural exposure in Guizhou Province in 2015. (b) Spatial distribution of rural exposure in Guizhou Province in 2020. (c) Change rate of exposure in Guizhou Province from 2015 to 2020.
The calculation of the change rate in Figure 3, Figure 4 and Figure 5 is the same. Replacing exposure with sensitivity, adaptation, and vulnerability is necessary
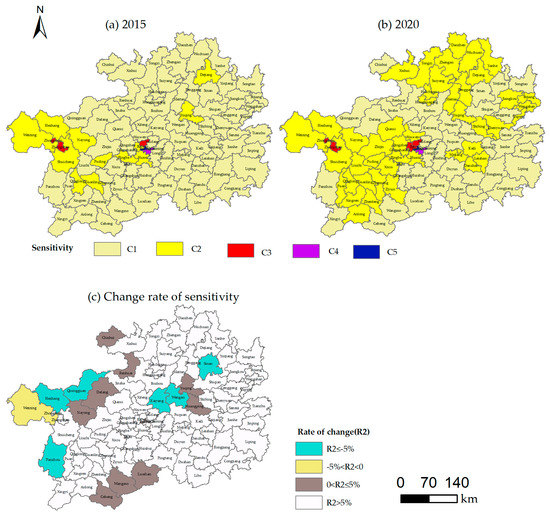
Figure 3.
Spatial and temporal distribution of rural sensitivity in Guizhou Province and the change rate of sensitivity. (a) Spatial distribution of rural sensitivity in Guizhou Province in 2015. (b) Spatial distribution of rural sensitivity in Guizhou Province in 2020. (c) Change rate of sensitivity in Guizhou Province from 2015 to 2020.
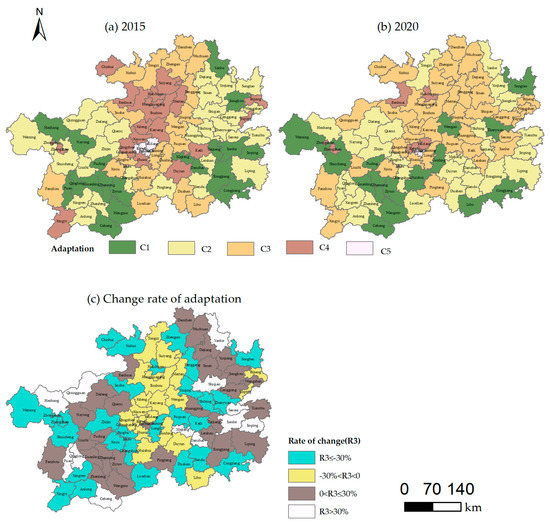
Figure 4.
Spatial and temporal distribution of rural adaptation in Guizhou Province, the rate of change in adaptation. (a) Spatial distribution of rural adaptation in Guizhou Province in 2015. (b) Spatial distribution of rural adaptation in Guizhou Province in 2020. (c) Change rate of adaptation from 2015 to 2020 in Guizhou Province.
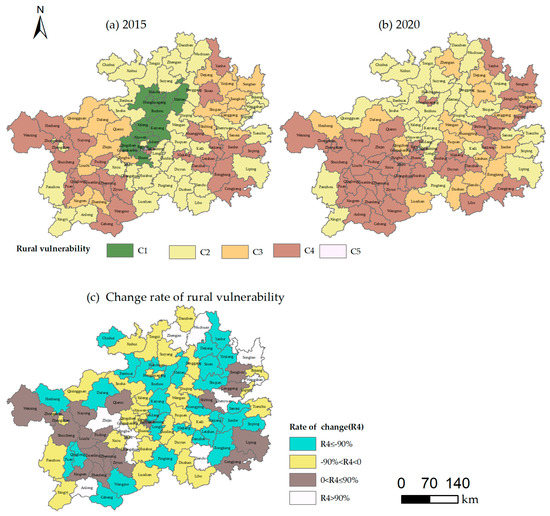
Figure 5.
Spatial and temporal distribution of rural vulnerability in Guizhou Province, and the change rate of rural vulnerability. (a) Spatial distribution of rural vulnerability in Guizhou Province in 2015. (b) Spatial distribution of rural vulnerability in Guizhou Province in 2020. (c) Change rate of rural vulnerability in Guizhou Province from 2015 to 2020.
From 2015 to 2020, 17 counties in the province experienced a decrease in exposure, whereas 71 counties experienced an increase. Among these, 10 counties had a reduction rate of 10% or less, and 7 counties had a reduction rate of 10% or more. Further, 25 counties had an increase rate of 10% or less, and 46 counties had an increase rate of 10% or more. The distributions of C1 (lower vulnerability) and C2 (low vulnerability) had significant changes. The change from C1 to C2 is the most obvious, and the number of relevant counties was reduced from 49 in 2015 to 33 in 2020, including Tongzi, Xishui, and Chishui. On the contrary, the number of counties with C2 increased from 31 in 2015 (such as Qixingguan, Renhuai, and Qinglong) to 45 in 2020, while the distributions extended and spread out from the original counties. Similarly, the number of counties with C3 (moderate vulnerability) did not change much; however, the distribution of this classification transformed from Honghuagang, Zhongshan, Huaxi, and Guanshanhu to Pingba, Xixiu, and Yuping. C4 (high vulnerability) and C5 (higher vulnerability) were mainly concentrated in the central part of Guizhou Province in Guiyang City, the capital of Guizhou, in 2015 and 2020, where urbanization brought the greatest pressure and attraction to the countryside.
It was noted that not all regions became more vulnerable; however, the exposure to rural vulnerability in a few counties improved, such as from C2 to C1 in Jinping and from C4 to C2 in Huangping. These results reflected that the intensity of nightlight and the proportion of urban land areas were the main factors for the growth of exposure, while PM2.5 concentration/regional GDP and the intensity of fertilizer application led to the diminution of exposure. Although Guizhou Province has made concerted efforts to promote urbanization, poverty alleviation, and village location, the rise in construction land and human activities caused by these policies cannot be ignored. Moreover, the intensity of chemical fertilizer application was another vital factor in the increase in exposure, showing a significant downward trend. This was because the Chinese government has achieved remarkable milestones by implementing the “Plan for Promoting the Implementation of the Action Plan for Zero Growth in Fertilizer Use by 2020” policy.
3.1.2. Sensitivity
According to the evaluation indicators and their weights, the sensitivity of rural vulnerability was determined. The average values of sensitivity were 0.1385 and 0.1582 in 2015 and 2020, respectively (Figure 3). This increasing trend indicates that the perception of the rural system in Guizhou Province toward external pressure has declined. As shown in Figure 2, the spatial transformation of sensitivity is presented as “from a single core to the dual core”. Specifically, the areas with high sensitivity in Guiyang City were mainly examined in 2015, i.e., the single core. In 2020, such areas also included Zunyi City, which has a dual core. This alternation was caused by the economic development of Zunyi City, which was driven by its unique culture and gradually narrowed the gap with Guiyang City. Accordingly, in 2015, the sensitivity of low-grade C1 was dominant in Guizhou Province and mainly distributed in the eastern part of Guizhou Province. C2 and above counties are mainly distributed in the western part of Guizhou Province, and only Dejiang and Yuqing are distributed in the eastern part of the province. By 2020, the sensitivity of Guizhou Province was mainly C1 and C2, among which C2 and above were distributed in the western and northeastern parts of Guizhou Province, while C1 counties were scattered around the province. Obviously, the county with the highest sensitivity level of C2 had the biggest change, from a single core in Guiyang in 2015 to a double core in Guiyang and Zunyi in 2020. Among the five sensitivity classifications, the counties with C1 (lower vulnerability) and C2 (low vulnerability) noticeably deteriorated during the study period. The number of counties with C1 declined by 33, while that of C2 increased by 32. Comparatively, the number of counties with C4 (high vulnerability) and C5 (higher vulnerability) barely changed.
From 2015 to 2020, only seven counties showed a decrease in sensitivity, while the rest showed an increase in sensitivity. Further, 71 counties had an increased rate of 5% or more, accounting for 80.68%. The evaluation indicators had significant impacts on the above results and were conducive to enhancing the sensitivity. On the one hand, the density of population, GDP per capita, tertiary industry output value/regional GDP, the total power of agricultural machinery, and diesel engine power, which reflected the improvement of the economy and the intensification of human activities, gradually increased and led to high sensitivity in some counties such as Yunyan, Nanming, and Baiyun. On the other hand, vegetation, agricultural development, and living conditions in the rural area of Guizhou Province, which represented sensitivity, were affected by geological conditions (e.g., altitude, slope, and water resources) for a long time. The terrain in Guizhou is high in the west and low in the east and has slopes from the middle to the north, east, and south, showing a three-tiered distribution, resulting in greater sensitivity in the west and northeast. For example, Tianzhu, Cengong, and Wengan had low sensitivity due to sufficient water resources for agriculture. Similarly, Chishui and Yuqing had low sensitivity due to abundant forest resources.
3.1.3. Adaptation
During the study period, the average value of adaptation in Guizhou Province diminished from 0.2242 to 0.1864, indicating that the adjustment and recovery ability of the rural system to cope with external interference had declined (Figure 4). The distribution of adaptation in Guizhou Province was depicted as “dual core,” i.e., Guiyang and Zunyi, in 2015 and 2020, where the values of adaptation were reduced from the center to the surrounding areas. As the first and second largest regions of the economic aggregate in Guizhou Province, Guiyang City and Zunyi City played the role of a bridge and hub connecting the east with the west and the north with the south in the economic development of Guizhou Province. Although economic development in these regions brought about relatively high exposure and sensitivity, more financial expenditures flew to social welfare and public infrastructure construction in rural areas, giving rise to a positive impact on the adaptation of the rural system. Therefore, an appropriate critical point should be identified between the protection of the ecological environment and economic development in such regions. In 2015, counties with suitability levels of C1 and C2 were scattered in the western and eastern parts of Guizhou, while counties with suitability levels of C3 and above were mainly distributed in the central part, especially in Guiyang and Zunyi. By 2020, the suitability of Guizhou Province was mainly C2, which was mainly distributed around Guiyang and Zunyi. In southern Guizhou, there was little change in suitability, whereas, in northeastern and central Guizhou, there was a great change in suitability. The counties that converted from low adaptability to high suitability have fewer people than those that converted from high adaptability to low suitability. The most obvious change was that the number of counties in central Guizhou with a suitability of C4 or above decreased considerably, with a decrease rate of 67%.
Similarly, the relevant indicators showed significant changes. The per capita share of grain, per capita local fiscal revenue, and growth rate of rural employment dropped; on the contrary, the number of primary and secondary school students per 10,000, number of hospital beds per 1000 people, balance of savings deposits of urban and rural residents, and road network density increased. With the development of the national economy and the continuous promotion of the rural revitalization strategy, education level, social welfare level, living standard of the population, and infrastructure in rural areas have improved. On the one hand, economic and social development benefits the residents. On the other hand, simple and extensive economic development will cause damage to the natural environment. Therefore, a region needs to find a suitable balance between the protection of the natural ecological environment and economic and social development, thereby providing a high-quality development roadmap featuring ecological priority and green development.
3.1.4. Rural Vulnerability
Rural vulnerability in Guizhou Province was determined according to the results of exposure, sensitivity, and adaptation (Figure 5). In 2015, the average value of rural vulnerability was 0.0002; at the same time, the maximum value was concentrated in Yunyan (1.0255) and the minimum value was distributed in Wudang (−0.3590). As shown in Figure 4, C1 (lower vulnerability) covered 12 counties, accounting for 13.64% of the total counties. These zones were mainly distributed in the central areas of Guizhou Province, such as Bozhou and Huichuan, where the rural economy and living conditions were generally superior due to their proximity to the core cities. C2 (low vulnerability) covered 35 counties (39.77%), which were located in central Guizhou (distributed around C1). C3 included 16 counties, accounting for 18.18% of the total number of counties, and were mainly located in northeast Guizhou. C4 covered 24 counties, accounting for 27.27% of the total number, and was mainly distributed in eastern and western Guizhou. C5 included only one county, Yunyan District, which is the central city of Guiyang. Thus, the areas with low rural vulnerability (C1 and C2) in 2015 were mainly distributed in the central part of Guizhou, while C3 and above levels were mainly distributed in the eastern and western parts of Guizhou (except Yunyan District).
In 2020, the average value of rural vulnerability increased to 0.0634. The maximum value was located in Yunyan (1.0306), whereas the minimum value was in Wudang (−0.1186). There were no C1 counties. In 2015, all 12 C1 counties were developed into other grades and vulnerability began to increase. C2 had 29 counties, accounting for 32.95%, that were mainly located in the north and the north-central parts of Guizhou (around Zunyi City). C3 had 17 counties, accounting for 19.32% of the total number, that were mainly distributed in eastern Guizhou. C4 had 41 counties, accounting for 46.59%, that were mainly located in the east of Guizhou. C5 had only one county (Yunyan), accounting for 1.14%. Rural vulnerability in Guizhou Province in 2015 and 2020 had a common feature of “high on both sides and low in the middle”. The reasons are as follows: First, Huichuan, Bozhou, Pingtang, and other counties located between developed cities such as Guiyang and Zunyi have “free-riding” conditions. While using the convenient and developed transportation network and abundant resources of central cities, they can also reduce the damage caused by the rampant exploitation of the ecological environment, thereby achieving green and sustainable development of cities. Second, in Kaiyang, Xiuwen, Longli, Pingtang, and other areas, the intensity of light at night is weak, population density is low, and urban construction land area is lower than the central area; thus, the exposure is low. In Huichuan, Wudang, and other areas, the per capita GDP is relatively large, and the corresponding indicators, such as the number of beds per thousand people, resident disposable income, per capita financial income, and road network density, are also relatively large; hence, suitability is also relatively large. Finally, high-vulnerability areas are located in the east and west of Guizhou Province. For example, Weining, Hezhang, and other western areas have high altitudes, large topographies, and low grain production; therefore, the vulnerability is high. However, Yanhe, Songtao, and other eastern regions are relatively backward in economic development and irrational in industrial structure, leading to low per capita fiscal income and road network density as well as high vulnerability under the combined effect of the two factors.
After an in-depth analysis of the indicators of rural vulnerability, it was found that the natural factors causing rural vulnerability in Guizhou Province mainly include climate, altitude, and slope. They determine the industrial structure, food production, and per capita income of the rural system by affecting the local vegetation coverage, agricultural farming conditions, mechanization level, and land use. Guizhou Province is one of the major agricultural provinces in China, and agricultural production has always been the economic pillar industry in most areas of Guizhou Province. Therefore, it is necessary to strengthen the protection of cultivated land, pay attention to the application intensity of fertilizers and pesticides, and ensure the quantity and quality of cultivated land. Promote the mechanization of agricultural production and raise productivity. Strengthen the competitiveness of industries with agricultural characteristics and improve their ability to cope with market risks. For some areas with superior natural environmental conditions and a pillar industry of tourism, such as Libo, Zhenyuan, etc., reinforce the protection of the ecosystem, improve infrastructure, and promote industrial transformation to attract more tourists and increase villagers ‘ income. Economic factors are mainly reflected in local economic development, financial expenditure, and the living standards of residents through rural education, social welfare, and infrastructure construction. Under the strategy of urban and rural integrated development, continuously increasing fiscal expenditure on rural areas is a favorable measure to support rural development. However, it is more important to achieve “hematogenous development” than “transfusion development” and adjust the industrial structure to increase jobs, raise incomes, and achieve sustainable development of the local economy. More detailed vulnerability analysis and governance strategies led by different factors in Guizhou Province will be discussed in the following contents.
3.2. Analysis of Spatial and Temporal Rural Vulnerability
The rural exposure, sensitivity, adaptation, and rural vulnerabilities (Figure 6) of Guizhou Province in 2015 and 2020 present different degrees of temporal and spatial aggregation. It is a combination of exposure, sensitivity, and adaptation; the spatial distribution of rural vulnerability in Guizhou Province from 2015 to 2020 is not random but a spatial aggregation. The concentration area of exposure in 2015 in Guizhou Province was mainly in Shibing, with a small scope; the gathering area in 2020 is in Guanshanhu, and the scope is also insignificant. The sensitivity-gathering areas of Guizhou Province in 2015 were Weining, Hezhang, and Zhongshan, and the sensitivity-gathering areas in 2020 were Guanshanhu, Yunyan, Nanming, Baiyun, Zheng’an, Wuchuan, and Dejiang. The adaptation gathering area of Guizhou Province in 2015 was at the junction of Guiyang and Zunyi, with a large scope and wide coverage, including Bozhou, Xifeng, Kaiyang, Wudang, and Baiyun. There were two main gathering areas in 2020, with Nanming in Guiyang and Huichuan in Zunyi as the gathering centers. The rural vulnerability areas of Guizhou Province in 2015 were mainly concentrated in the west and northeast of Guizhou, with Bijie, southwest Guizhou, Liupanshui, and Anshun as the representatives in the west and Tongren as the representative in the northeast. The gathering area in 2020 was mainly in the west of Guizhou, with the trend of extending to the east, adding Qingzhen, Huaxi, Pingba, and other counties in Guiyang. On the whole, the aggregation of rural vulnerability in Guizhou Province is most obvious in the counties of Guiyang City and Zunyi City, and the spatial aggregation in Qiannan Prefecture is the least obvious, which indicates that rural vulnerability in Guizhou Province has a regional effect and a central city radiation effect. Moreover, the changes in the cluster center and coverage indicate that this type of clustering model is unsustainable and may disappear or transfer to other regions over time. This is roughly the same as the previous spatiotemporal analysis of rural vulnerability, reflecting the reliability of spatiotemporal scanning statistical methods.
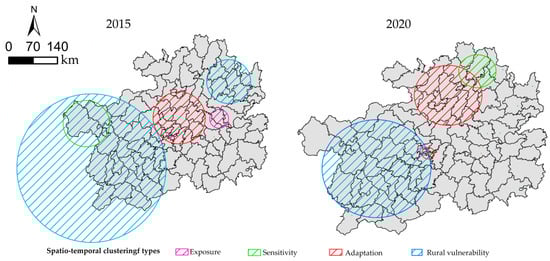
Figure 6.
Spatial-temporal clustering types of exposure, sensitivity, adaptation, and rural vulnerability in Guizhou Province in 2015 and 2020.
3.3. Rural Vulnerability Types and Differential Regulation in Guizhou Province
According to Table 3, the rural vulnerability types in Guizhou Province can be divided into “weak comprehensive vulnerability”, “exposure vulnerability”, “sensitivity vulnerability”, “adaptability vulnerability”, “exposure-adaptation vulnerability”, “sensitivity-adaptation vulnerability”, and “comprehensive vulnerability” (Figure 7). In general, in 2015 and 2020, the main type of vulnerability in Guizhou Province was “adaptability vulnerability”, accounting for 48.86% and 56.82%, respectively, and this part of the region is mainly outside Guiyang and Zunyi. The second was “weak comprehensive vulnerability”, mainly distributed in Guiyang and Zunyi of Guizhou Province. Furthermore, the spatial distribution characteristics are more obvious in the vulnerability type of sensitivity-adaptation vulnerability, which is mainly distributed in the northwest of Bijie City. The least common type of vulnerability is comprehensive vulnerability. In 2015 and 2020, only Pingba County accounted for 1.14% of comprehensive vulnerability. The reason is that between 2015 and 2020, the proportion of construction land area in Pingba, the fragmentation index of land-use landscape, and the intensity of fertilizer application were high, and the disposable income of rural residents was low; hence, exposure and sensitivity were greater than the average value, and suitability was less than the average value. The combined effect leads to the most serious type of vulnerability. In vulnerability management, it is necessary to consider exposure, sensitivity, and suitability.
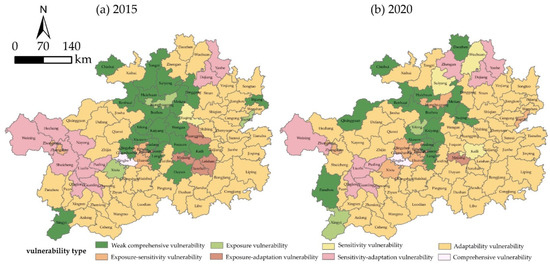
Figure 7.
Spatial distribution of rural vulnerability types in Guizhou Province in 2015 and 2020. (a) Spatial distribution of rural vulnerability types in Guizhou Province in 2015. (b) Spatial distribution of rural vulnerability types in Guizhou Province in 2020.
To understand the vulnerability types of Guizhou Province more comprehensively, different vulnerability types were placed in different rural vulnerability levels and five levels of rural vulnerability (C1, low vulnerability; C2, lower vulnerability; C3, moderate vulnerability; C4, higher vulnerability; and C5, high vulnerability) were analyzed. The classification results are shown in Figure 8. According to the classification results of 2015 and 2020, the vulnerability types C1 to C4 were mainly adaptability vulnerabilities. Therefore, the vulnerability management of C1–C4 mainly considered increasing the suitability of the region for social welfare, fiscal revenue, and traffic accessibility. Among them, the vulnerability type of C4 included adaptability vulnerability and exposure-sensitivity vulnerability, which is the same as the vulnerability type of C5. The vulnerability type of C5 was mainly exposure-sensitivity vulnerability and included only Yunyan. This type of governance mainly considers indicators such as population density and construction land area. From the perspective of reducing exposure and sensitivity, the surrounding counties were evacuated to share the pressure of the development of the central city. Based on the classification result, it can be concluded that the main types of rural vulnerability in Guizhou Province are exposure, sensitivity, and suitability, and comprehensive vulnerability is the least-affecting vulnerability. It is best to focus on vulnerability in governance and make up for the shortcomings.
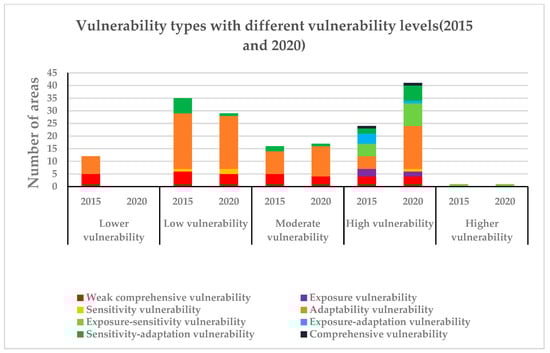
Figure 8.
Vulnerability types with different vulnerability levels (2015 and 2020).
4. Discussion
4.1. Driving Forces of Rural Vulnerability
Exposure is a key factor in the formation of rural vulnerability. The degree of exposure characterizes the degree of interference with the rural system by human activities and geological conditions. By calculating the exposure degree of Guizhou Province and the classification of vulnerability types, it can be concluded that exposure degree is the key vulnerability factor. Through time, the impact of human activities on exposure becomes greater than the role of natural systems. The expanding artificial ecosystem is eroding the natural ecosystem, and human beings are transforming and influencing the natural system through various scientific and technological developments. The annual average precipitation, temperature, and other natural environmental factors and their interactions can support the greater carrying capacity of the rural system; its ability to cope with pressure will increase, and its system exposure will weaken. However, with the advancement of science and technology, human beings can provide animals and plants with the water and temperature needed for growth through artificial rainfall, irrigation, greenhouse insulation, and other technologies; however, it is undeniable that the frequency of natural disasters, such as extreme cold, drought, and floods, is also increasing. The PM2.5 concentration per unit of GDP, nighttime light intensity, urban land area ratio, intensity of fertilizer application, and other factors characterize the intensity of human activities. In this study, these indicators vary greatly in different regions and are very regional and representative. The cultivated land fragmentation index and the land-use landscape fragmentation index reflect the formal impact of human activities on nature and provide a path for quantifying the impact of human activities on nature. Exposure is the key factor in the formation of rural vulnerability, and human disturbance is the main factor in the formation of exposure. Therefore, reducing rural vulnerability should be based on reducing human disturbance activities, supplemented by reducing natural degradation.
Sensitivity is the intrinsic motivation for rural vulnerability. The sensitivity index is mainly expressed by elevation, slope, tertiary industry output value, NPP, the total power of agricultural machinery, and diesel engine power. These indicators represent the natural endowment of the rural system and determine the development potential and space of the rural system, among which elevation and slope are the core internal motivations. First, elevation and slope determine the geological conditions and social development of a region. Relatively speaking, the higher the slope and elevation, the lower the NPP, the greater the proportion of the tertiary industry in GDP, the greater the dependence of the rural system on agriculture, the greater the impact of the natural environment, and the higher the sensitivity of the rural system. Second, elevation and slope largely determine the mechanization of rural agriculture. Due to the influence of topography and slope, it is difficult to realize mechanization in many mountainous areas of Guizhou, or the cost of mechanization is too high. The level of mechanization represents the level of local productivity. The higher the productivity, the lower the sensitivity of the rural system will be. It can be concluded that the internal motivation for rural vulnerability in Guizhou Province is the limitation of the natural geographical environment. However, this factor is difficult to change. By developing an economy based on local conditions and improving suitability, we can solve the problem of vulnerability.
Adaptation is the driving force of rural vulnerability. Improving the adaptation of the rural system will increase its sensitivity to a certain extent because economic and social development will inevitably cause damage to the natural ecosystem. However, on the whole, the improvement of adaptation will reduce the vulnerability of the system. In the era of rapid development of urbanization and industrialization, it is a key step to alleviate rural vulnerability by making the degree of economic improvement far greater than the degree of damage to the environment. This way, the system can adjust and adapt faster when dealing with external interference. As a driving force for foreign aid, adaptation is closely related to the implementation of national policies. Regional development planning determines local infrastructure, social welfare, and financial planning. For example, traffic accessibility enhances material and information exchange with the outside world. Rural areas adjacent to central cities can enjoy increased employment opportunities and social welfare due to the trickle-down effect of central cities. Convenient traffic conditions are conducive to improving the high-quality development of rural areas and reducing vulnerability. However, to a certain extent, human disturbances, such as urban pollution and traffic, will also increase the pressure on the nearby rural ecology.
4.2. Sustainable Development Implications
With the rapid development of urbanization, industrialization, and informatization, human beings continue to increase the extraction and utilization of natural resources, leading to the gradual intensification of the contradiction between humans and the natural ecological environment and the increasing pressure of human activities on the natural ecological environment. As a result, the rural system shows the characteristics of spatial compression, environmental degradation, and insufficient economic development power, which have a great impact on the productivity and life of rural people, regional, social, and economic development of rural areas, and the climate. With the enhancement of people’s awareness of ecological environment protection and the in-depth study of the relationship between humans and nature, how to promote the sustainable development of the rural system to practice the rural revitalization strategy is a key issue faced by the ongoing rural development in China, which has also become a research hotspot in academia.
Vulnerability is an important characterization of the evolution of rural systems toward unsustainable development. Its theory can not only provide an important basic scientific knowledge system for analyzing the degree, mechanism, and process of human-land interaction and sustainable development but can also be used to analyze global environmental change and sustainable development trends and to guide the rural system to accurately reduce vulnerability, enhance its own resistance, and guide the sustainable development of the system. The sustainable development of rural systems can save rural resources, reduce pollution, improve efficiency, and improve quality of life by implementing social policies and improving science and technology, which can further help coordinate the natural environment and social and economic development in rural areas, maintain the stability of production, life, and ecological functions, and realize the unity of ecological, social, and economic benefits.
To realize the sustainable development of the rural system, we must follow the three basic principles of fairness, sustainability, and commonality, i.e., they are the fairness of current and intergenerational resource allocation, the sustainable use of environmental resources, and the commonality of development goals. It is an integral part of the research on the sustainable development of rural society to study the vulnerability of the rural system and understand its current situation in the natural ecological environment, social and economic development, social education, population resources, and social welfare. This has an inestimable impact on the sustainable use of resources, the coordination of the relationship between the environment and production development, and the implementation of the national sustainable development strategy.
4.3. Limitations and Directions for Future Work
Based on fully understanding the relevant research, this study takes the county as the research unit, establishes the evaluation indicator system based on the exposure-sensitivity-suitability model, explores the spatial and temporal evolution of rural vulnerability and its clustering model, and broadens the research ideas of rural vulnerability. However, this study also has some shortcomings. On the one hand, the indicator system constructed in this study needs to be further improved. The rural system is complex and huge, and its vulnerability is caused by many factors and complex mechanisms that are difficult to quantify into indicator data. Moreover, it is affected by the availability of data and the absence of some data. The indicator system constructed in this study is not comprehensive and scientific enough, which may affect the research results and cause their deviation. In the succeeding studies, it will be necessary to explore and establish a more scientific and complete indicator system to reflect the vulnerability degree of rural systems in the study area more comprehensively. On the other hand, only two periods of data are used in this study, and the study period is not long enough to reveal profound and comprehensive evolution characteristics of rural vulnerability over time. Because vulnerability has a dimension of continuity of time, it is necessary to conduct vulnerability research over a longer period to better explore the change and interaction mechanisms of the influencing factors of vulnerability.
5. Conclusions
Taking Guizhou Province as the research area, the county as the research unit, and 2015 and 2020 as the research periods, a comprehensive indicator system for rural vulnerability measurement was constructed based on the perspectives of exposure, sensitivity, and adaptability. The comprehensive score of vulnerability and the spatiotemporal clustering characteristics of rural vulnerability were obtained using the TOPSIS method. The main conclusions are as follows:
- (1)
- Temporal and spatial characteristics of exposure, sensitivity, adaptation, and rural vulnerability: (i) Exposure: In terms of time, in 2015 and 2020, the average exposure of the rural system in Guizhou Province was 0.0860 and 0.0917, respectively. The overall exposure of the rural system showed an upward trend, indicating that the degree of interference suffered by the rural system in Guizhou Province was increasing annually. In terms of space, the exposure of the rural system in Guizhou Province weakened from the core of several urban counties in Guiyang City to the surrounding counties, showing the spatial pattern characteristics of “low in the north and high in the south”. (ii) Sensitivity: In terms of time, the average sensitivity of the rural system in Guizhou Province increased from 0.1385 to 0.1582 between 2015 and 2020, which is greater than the increase in exposure, indicating that the perception of the rural system in Guizhou Province to external pressure sources is decreasing and the geological conditions of the smallest research area and the combination of economic and demographic factors are not conducive to the enhancement of its perception. In terms of space, the rural system sensitivity of Guizhou Province presents a spatial pattern characteristic of “transformation from a single core to a dual core”. (iii) Adaptation: From 2015 to 2020, the average suitability of the rural system in Guizhou Province decreased from 0.2242 to 0.1864, which shows that the adjustment ability of the rural system itself and its resilience to external interference sources in Guizhou Province are declining. In terms of space, the suitability of the rural system in Guizhou Province presents a “dual core” spatial structure, decreasing from the dual core to the surrounding counties. (iv) Rural vulnerability: In terms of time, in 2015 and 2020, the average vulnerability of the rural system in Guizhou Province was 0.0002 and 0.0634, respectively, showing an upward trend, which is the result of the combined effects of exposure, sensitivity, and adaptability. In terms of space, the rural system vulnerability of Guizhou Province is characterized by a spatial pattern of “high on both sides and low in the middle”.
- (2)
- Spatiotemporal aggregation feature of rural vulnerability: The rural vulnerability of Guizhou Province has obvious spatiotemporal aggregation, with Zunyi City and Guiyang City as the cluster centers. It can be seen that the rural vulnerability of Guizhou Province has a regional effect and a central city radiation effect. Therefore, the vulnerability of the rural system in Guizhou Province can be reduced based on two aspects. On the one hand, in areas with low rural vulnerability and proximity to the central area, based on reasonable development and ecological protection, modern transportation and information accessibility should be rationally used to accelerate their economic and social development by relying on the development conditions of the central area. On the other hand, the central areas with huge pressure on ecological protection and economic development should also rely on areas with low rural vulnerability to ease the pressure on their development, transfer some regional functions to other areas, and work together for common development.
- (3)
- Whether it is directly classified or classified by vulnerability level, the vulnerability type of Guizhou Province is mainly “adaptability vulnerability”. Therefore, the key to vulnerability governance in Guizhou Province is to develop the economy. During economic development, although damage is caused to the natural environment, in general, the advantages outweigh the disadvantages. Under the strategic background of national rural revitalization and urban-rural integration development, it is necessary to establish a new urban-rural relationship and promote high-quality coordinated development of urban and rural areas. First, increase the financial expenditure on rural construction, promote the interconnection of urban and rural transportation and other infrastructure, and break the transportation barriers for the transportation and sales of agricultural products. Encourage and guide social capital to participate in the construction of basic public services in rural areas and improve the supply of public services such as rural education, social welfare, and employment. Second, promote the integrated development of primary, secondary, and tertiary industries and optimize and upgrade industrial structures. according to market demand and the characteristics of rural resources, encourage diversified operation, develop efficient, high-quality, and ecological agricultural products, and realize the increase in villagers’ production and income. Especially in Guizhou, where agriculture accounts for a large proportion. Finally, an excellent ecological environment is the biggest developmental and competitive advantage of Guizhou Province. Guizhou Province’s forest coverage rate is higher than the national average, and the air and water quality are among the best in the country. Guizhou Province should firmly grasp the development opportunities brought by the document “Several Opinions of the State Council on Further Promoting the Sound and Rapid Development of Guizhou’s Economy and Society”, conducting ecological resource rights trading and ecological product asset securitization, improving the system of paid use of emission rights, and establishing an ecological product trading center. Health and ecological resources can be transformed into economic indicators to improve people’s quality of life.
Author Contributions
Conceptualizing, L.Y., M.Z. and D.Y.; Methodology, M.Z.; Software, L.Y. and M.Z.; Verification, L.Y., M.Z. and D.Y.; Formal Analysis, M.Z.; Survey, M.Z.; Resources, L.Y.; Data Management, D.Y.; Writing—Original Draft Preparation, M.Z.; Writing—Review and Editing, L.Y.; Visualization, D.Y.; Supervision, L.Y.; Project Management, L.Y.; Capital Acquisition, L.Y. All authors have read and agreed to the published version of the manuscript.
Funding
This research was funded by the “Rural spatial restructuring in poverty-stricken mountainous areas of Guizhou based on spatial equity: A case study of the Dianqiangui Rocky Desertification Area” project of the National Natural Science Foundation of China (grant number 41861038).
Institutional Review Board Statement
Not applicable.
Informed Consent Statement
Not applicable.
Data Availability Statement
Not applicable.
Conflicts of Interest
The authors declare no conflict of interest.
References
- Parra-Lopez, C.; Groot, J.C.J.; Carmona-Torres, C.; Rossing, W.A.H. Integrating public demands into model-based design for multifunctional agriculture: An application to intensive Dutch dairy landscapes. Ecol. Econ. 2008, 67, 538–551. [Google Scholar] [CrossRef]
- Zhang, J.; Li, J.J.; Yang, X.J.; Yin, S.; Chen, J. Rural social-ecological systems vulnerability evolution and spatial-temporal heterogeneity in arid environmental change region: A case study of Minqin Oasis, northwestern China. Appl. Geogr. 2022, 145, 102747. [Google Scholar] [CrossRef]
- Wang, L.; Yu, B.; Chen, F.; Wang, N.; Li, C.R. An Analysis of Eco-Environmental Changes in Rural Areas in China Based on Sustainability Indicators between 2000 and 2015. Land 2022, 11, 1321. [Google Scholar] [CrossRef]
- Adger, W.N. Vulnerability. Glob. Environ. Chang. 2006, 16, 268–281. [Google Scholar] [CrossRef]
- Adger, W.N.; Eakin, H.; Winkels, A. Nested and teleconnected vulnerabilities to environmental change. Front. Ecol. Environ. 2009, 7, 150–157. [Google Scholar] [CrossRef]
- Pachauri, R.K.; Reisinger, A. Climate Change 2007: Synthesis Report; Intergovernmental Panel on Climate Change: Geneva, Switzerland, 2007. [Google Scholar]
- European Environment Agency. Living Planet Report 2012. Biodiversity, Biocapacity and Better Choices; European Environment Agency: Copenhagen, Denmark, 2012; p. 92. [Google Scholar]
- Füssel, H.M.; Capela Lourenço, T.; Downing, C.; Hildén, M.; Leitner, M.; Marx, A.; Prutsch, A.; Sanderson, A. National Climate Change Vulnerability and Risk Assessments in Europe; Publications Office of the European Union: Luxembourg, 2018. [Google Scholar]
- European Environment Agency. Urban Adaptation in Europe: How Cities and Towns Respond to Climate Change; European Environment Agency: Copenhagen, Denmark, 2020; p. 186. [Google Scholar]
- Swart, R.; Fons, J.; Geertsema, W.; van Hove, B.; Gregor, M.; Havranek, M.; Jacobs, C.; Kazmierczak, A.; Krellenberg, K.; Kuhlicke, C.; et al. Urban Vulnerability Indicators. A Joint Report of ETC-CCA and ETC-SIA; ETC-CCA and ETC-SIA Technical Report: Copenhagen, Denmark, 2012. [Google Scholar]
- Senapati, S.; Gupta, V. Socio-economic vulnerability due to climate change: Deriving indicators for fishing communities in Mumbai. Mar. Policy 2017, 76, 90–97. [Google Scholar] [CrossRef]
- Arief, A.Y.; Herminia, F. Climate Change Vulnerability Mapping for Southeast Asia, EEPSEA Special and Technical Paper; Economy and Environment Program for Southeast Asia (EEPSEA): Los Baños, Philippines, 2009; p. tp200901s1. [Google Scholar]
- Berrouet, L.; Villegas-Palacio, C.; Botero, V. Vulnerability of Rural Communities to Change in an Ecosystem Service Provision: Surface water supply. A Case Study in the Northern Andes, Colombia. Land Use Policy 2020, 97, 104737. [Google Scholar] [CrossRef]
- Yu, T.T.; Leng, H.; Yuan, Q.; Jiang, C.Y. Vulnerability Evaluation of Villages Based on Social-Ecological Indicators and Strategies for Improvement: Case Study of Villages in the Northeast China Plain. J. Urban Plan. Dev. 2022, 148, 04021059. [Google Scholar] [CrossRef]
- Hou, K.; Tao, W.D.; Wang, L.M.; Li, X.X. Study on hierarchical transformation mechanisms of regional ecological vulnerability and its applicability. Ecol. Indic. 2020, 114, 106343. [Google Scholar] [CrossRef]
- Hu, X.J.; Ma, C.M.; Huang, P.; Guo, X. Ecological vulnerability assessment based on AHP-PSR method and analysis of its single parameter sensitivity and spatial autocorrelation for ecological protection? A case of Weifang City, China. Ecol. Indic. 2021, 125, 107464. [Google Scholar] [CrossRef]
- Zheng, Y.M.; Wang, S.D.; Cao, Y.; Shi, J.L.; Qu, Y.; Li, L.P.; Zhao, T.J.; Niu, Z.G.; Yang, R.; Gong, P. Assessing the ecological vulnerability of protected areas by using Big Earth Data. Int. J. Digit. Earth 2021, 14, 1624–1637. [Google Scholar] [CrossRef]
- An, Y.Z.; Yin, Z.N.; Yin, J.; Zhang, H.; Zhang, S.J. A Study on Ecological Vulnerability Assessment in Shanghai Based on Land Use. In Proceedings of the 1st Symposium on Disaster Risk Analysis and Management in Chinese Littoral Regions, Shanghai Normal University, Sch Tourism, Shanghai, China, 29–30 October 2011. [Google Scholar]
- Chen, Y.; Feng, Y.Z.; Zhang, F.; Wang, L. Assessing Water Resources Vulnerability by Using a Rough Set Cloud Model: A Case Study of the Huai River Basin, China. Entropy 2019, 21, 14. [Google Scholar] [CrossRef]
- Islam, A.M.T.; Pal, S.C.; Chakrabortty, R.; Idris, A.M.; Salam, R.; Islam, M.S.; Zahid, A.; Shahid, S.; Bin Ismail, Z. A coupled novel framework for assessing vulnerability of water resources using hydrochemical analysis and data-driven models. J. Clean. Prod. 2022, 336, 130407. [Google Scholar] [CrossRef]
- Liu, H.J.; Shi, Y.Z.; Fan, M.Y.; Huang, J.W.; Chen, H.W.; Zhang, X. Research on Water Resources Vulnerability Evaluation Model Based on Extension Theory. Adv. Environ. Technol. 2013, 726, 4123–4130. [Google Scholar] [CrossRef]
- Hejazi, S.J.; Sharifi, A.; Arvin, M. Assessment of social vulnerability in areas exposed to multiple hazards: A case study of the Khuzestan Province, Iran. Int. J. Disaster Risk Reduct. 2022, 78, 103127. [Google Scholar] [CrossRef]
- Park, G.; Xu, Z.W. The constituent components and local indicator variables of social vulnerability index. Nat. Hazards 2022, 110, 95–120. [Google Scholar] [CrossRef]
- Spielman, S.E.; Tuccillo, J.; Folch, D.C.; Schweikert, A.; Davies, R.; Wood, N.; Tate, E. Evaluating social vulnerability indicators: Criteria and their application to the Social Vulnerability Index. Nat. Hazards 2020, 100, 417–436. [Google Scholar] [CrossRef]
- Damian, N.; Mitrica, B.; Mocanu, I.; Grigorescu, I.; Dumitrascu, M. An index-based approach to assess the vulnerability of socio-ecological systems to aridity and drought in the Danube Delta, Romania. Environ. Dev. 2023, 45, 100799. [Google Scholar] [CrossRef]
- Dumitrascu, M.; Mocanu, I.; Mitrica, B.; Dragota, C.; Grigorescu, I.; Dumitrica, C. The assessment of socio-economic vulnerability to drought in Southern Romania (Oltenia Plain). Int. J. Disaster Risk Reduct. 2018, 27, 142–154. [Google Scholar] [CrossRef]
- Grigorescu, I.; Mocanu, I.; Mitrică, B.; Dumitraşcu, M.; Dumitrică, C.; Dragotă, C.-S. Socio-economic and environmental vulnerability to heat-related phenomena in Bucharest metropolitan area. Environ. Res. 2021, 192, 110268. [Google Scholar] [CrossRef]
- Nelson, R.; Kokic, P.; Crimp, S.; Meinke, H.; Howden, S.M. The vulnerability of Australian rural communities to climate variability and change: Part I-Conceptualising and measuring vulnerability. Environ. Sci. Policy 2010, 13, 8–17. [Google Scholar] [CrossRef]
- Wu, J.D.; Han, G.Y.; Zhou, H.J.; Li, N. Economic development and declining vulnerability to climate-related disasters in China. Environ. Res. Lett. 2018, 13, 034013. [Google Scholar] [CrossRef]
- Huynh, H.L.T.; Do, A.T.; Dao, T.M. Climate change vulnerability assessment for Can Tho city by a set of indicators. Int. J. Clim. Chang. Strateg. Manag. 2020, 12, 147–158. [Google Scholar] [CrossRef]
- Fang, C.L.; Wang, Y.; Fang, J.W. A comprehensive assessment of urban vulnerability and its spatial differentiation in China. J. Geogr. Sci. 2016, 26, 153–170. [Google Scholar] [CrossRef]
- Tai, X.L.; Xiao, W.; Tang, Y.X. A quantitative assessment of vulnerability using social-economic-natural compound ecosystem framework in coal mining cities. J. Clean. Prod. 2020, 258, 120969. [Google Scholar] [CrossRef]
- Tapia, C.; Abajo, B.; Feliu, E.; Mendizabal, M.; Martinez, J.A.; Fernandez, J.G.; Laburu, T.; Lejarazu, A. Profiling urban vulnerabilities to climate change: An indicator-based vulnerability assessment for European cities. Ecol. Indic. 2017, 78, 142–155. [Google Scholar] [CrossRef]
- Jamshed, A.; Birkmann, J.; Rana, I.A.; McMillan, J.M. The relevance of city size to the vulnerability of surrounding rural areas: An empirical study of flooding in Pakistan. Int. J. Disaster Risk Reduct. 2020, 48, 101601. [Google Scholar] [CrossRef]
- Kim, J.E.; Yu, J.; Ryu, J.H.; Lee, J.H.; Kim, T.W. Assessment of regional drought vulnerability and risk using principal component analysis and a Gaussian mixture model. Nat. Hazards 2021, 109, 707–724. [Google Scholar] [CrossRef]
- Saha, S.; Kundu, B.; Paul, G.C.; Mukherjee, K.; Pradhan, B.; Dikshit, A.; Maulud, K.N.A.; Alamri, A.M. Spatial assessment of drought vulnerability using fuzzy-analytical hierarchical process: A case study at the Indian state of Odisha. Geomat. Nat. Hazards Risk 2021, 12, 123–153. [Google Scholar] [CrossRef]
- Mocanu, I.; Grigorescu, I.; Mitrica, B.; Dumitrascu, M.; Dragota, C.S.; Mateeva, Z.; Dumitrica, C. Human Health Vulnerability to Summer Heat Extremes in Romanian-Bulgarian Cross-Border Area. Nat. Hazards Rev. 2021, 22, 05021003. [Google Scholar] [CrossRef]
- Gallai, N.; Salles, J.M.; Settele, J.; Vaissiere, B.E. Economic valuation of the vulnerability of world agriculture confronted with pollinator decline. Ecol. Econ. 2009, 68, 810–821. [Google Scholar] [CrossRef]
- Guo, H.P.; Chen, J.; Pan, C.L. Assessment on Agricultural Drought Vulnerability and Spatial Heterogeneity Study in China. Int. J. Environ. Res. Public Health 2021, 18, 4449. [Google Scholar] [CrossRef] [PubMed]
- Loi, D.T.; Huong, L.; Tuan, P.A.; Nhung, N.T.H.; Huong, T.T.Q.; Man, B.T.H. An Assessment of Agricultural Vulnerability in the Context of Global Climate Change: A Case Study in Ha Tinh Province, Vietnam. Sustainability 2022, 14, 1282. [Google Scholar] [CrossRef]
- Zhang, W.; McManus, P.; Duncan, E. A Raster-Based Subdividing Indicator to Map Urban Heat Vulnerability: A Case Study in Sydney, Australia. Int. J. Environ. Res. Public Health 2018, 15, 2516. [Google Scholar] [CrossRef] [PubMed]
- Mafi-Gholami, D.; Pirasteh, S.; Ellison, J.C.; Jaafari, A. Fuzzy-based vulnerability assessment of coupled social-ecological systems to multiple environmental hazards and climate change. J. Environ. Manag. 2021, 299, 113573. [Google Scholar] [CrossRef]
- Gong, J.; Jin, T.; Cao, E.; Wang, S.; Yan, L. Is ecological vulnerability assessment based on the VSD model and AHP-Entropy method useful for loessial forest landscape protection and adaptative management? A case study of Ziwuling Mountain Region, China. Ecol. Indic. 2022, 143, 109379. [Google Scholar] [CrossRef]
- Wei, S.; Lin, K.R.; Huang, L.Y.; Yao, Z.Y.; Bai, X.Y.; Chen, Z.H. Assessing the Vulnerability of Water Resources System Using VSD-SD Coupling Model: A Case of Pearl River Delta. Water 2022, 14, 1103. [Google Scholar] [CrossRef]
- Min, L. Eco-vulnerability assessment of scenic fringe rural tourism sites based on rmp environmental assessment model. J. Environ. Prot. Ecol. 2019, 20, 1733–1744. [Google Scholar]
- Jiang, Y.J.; Shi, B.; Su, G.J.; Lu, Y.; Li, Q.Q.; Meng, J.; Ding, Y.P.; Song, S.; Dai, L.W. Spatiotemporal analysis of ecological vulnerability in the Tibet Autonomous Region based on a pressure-state-response-management framework. Ecol. Indic. 2021, 130, 108054. [Google Scholar] [CrossRef]
- Chung, E.S.; Lee, K.S. Identification of Spatial Ranking of Hydrological Vulnerability Using Multi-Criteria Decision Making Techniques: Case Study of Korea. Water Resour. Manag. 2009, 23, 2395–2416. [Google Scholar] [CrossRef]
- Jiang, L.; Huang, X.; Wang, F.; Liu, Y.; An, P. Method for evaluating ecological vulnerability under climate change based on remote sensing: A case study. Ecol. Indic. 2018, 85, 479–486. [Google Scholar] [CrossRef]
- Khalid, Z.; Meng, X.M.; Rana, I.A.; Rehman, M.U.; Su, X.J. Holistic Multidimensional Vulnerability Assessment: An empirical investigation on rural communities of the Hindu Kush Himalayan region, Northern Pakistan. Int. J. Disaster Risk Reduct. 2021, 62, 102413. [Google Scholar] [CrossRef]
- Cai, X.; Li, Z.; Liang, Y. Tempo-spatial changes of ecological vulnerability in the arid area based on ordered weighted average model. Ecol. Indic. 2021, 133, 108398. [Google Scholar] [CrossRef]
- Hong, W.; Jiang, R.; Yang, C.; Zhang, F.; Su, M.; Liao, Q. Establishing an ecological vulnerability assessment indicator system for spatial recognition and management of ecologically vulnerable areas in highly urbanized regions: A case study of Shenzhen, China. Ecol. Indic. 2016, 69, 540–547. [Google Scholar] [CrossRef]
- Boori, M.S.; Choudhary, K.; Paringer, R.; Kupriyanov, A. Spatiotemporal ecological vulnerability analysis with statistical correlation based on satellite remote sensing in Samara, Russia. J. Environ. Manag. 2021, 285, 112138. [Google Scholar] [CrossRef]
- Mandal, K.; Dey, P. Coastal vulnerability analysis and RIDIT scoring of socio-economic vulnerability indicators-A case of Jagatsinghpur, Odisha. Int. J. Disaster Risk Reduct. 2022, 79, 103143. [Google Scholar] [CrossRef]
- Zhang, X.Q.; Wang, C.B.; Li, E.K.; Xu, C.D. Assessment Model of Ecoenvironmental Vulnerability Based on Improved Entropy Weight Method. Sci. World J. 2014, 2014, 797814. [Google Scholar] [CrossRef]
- Fei, B.; Min, Z. Assessment of water resources vulnerability in international river basins based on entropy weight method. J. Environ. Prot. Ecol. 2020, 21, 865–875. [Google Scholar]
- Hou, K.; Li, X.X.; Wang, J.J.; Zhang, J. Evaluating Ecological Vulnerability Using the GIS and Analytic Hierarchy Process (AHP) Method in Yan’an, China. Pol. J. Environ. Stud. 2016, 25, 599–605. [Google Scholar]
- Yang, W.C.; Xu, K.; Lian, J.J.; Bin, L.L.; Ma, C. Multiple flood vulnerability assessment approach based on fuzzy comprehensive evaluation method and coordinated development degree model. J. Environ. Manag. 2018, 213, 440–450. [Google Scholar] [CrossRef]
- Wu, X.; Tang, S. Comprehensive evaluation of ecological vulnerability based on the AHP-CV method and SOM model: A case study of Badong County, China. Ecol. Indic. 2022, 137, 108758. [Google Scholar] [CrossRef]
- Wang, Y.; Zhang, Z.; Chen, X. Spatiotemporal change in ecosystem service value in response to land use change in Guizhou Province, southwest China. Ecol. Indic. 2022, 144, 109514. [Google Scholar] [CrossRef]
- Zhao, Y.; Shi, Y.; Feng, C.-C.; Guo, L. Exploring coordinated development between urbanization and ecosystem services value of sustainable demonstration area in China- take Guizhou Province as an example. Ecol. Indic. 2022, 144, 109444. [Google Scholar] [CrossRef]
- Cheng, F.; Lu, H.; Ren, H.; Zhou, L.; Zhang, L.; Li, J.; Lu, X.; Huang, D.; Zhao, D. Integrated emergy and economic evaluation of three typical rocky desertification control modes in karst areas of Guizhou Province, China. J. Clean. Prod. 2017, 161, 1104–1128. [Google Scholar] [CrossRef]
- Zhou, X.; Li, H.; Yin, J. Study on the evolution of rural regional system vulnerability and the classification of its causes in Jilin Province. Res. Agric. Mod. 2022, 43, 679–690. [Google Scholar] [CrossRef]
- Yang, R.; Pan, Y.X. Rural vulnerability in China: Evaluation theory and spatial patterns. J. Geogr. Sci. 2021, 31, 1507–1528. [Google Scholar] [CrossRef]
- Li, Z.; Shi, L.; Zhang, C. Vulnerability assessment and differentiated coping strategies of county rural regional system from the perspective of society-ecology. Econ. Geogr. 2022, 42, 175–184. [Google Scholar] [CrossRef]
- Han, C.; Zhang, Y.; Shen, J. Fuzzy-Based Ecological Vulnerability Assessment Driven by Human Impacts in China. Sustainability 2022, 14, 9166. [Google Scholar] [CrossRef]
- Yang, X.P.; Dai, X.A.; Li, W.Y.; Lu, H.; Liu, C.; Li, N.W.; Yang, Z.L.; He, Y.X.; Li, W.L.; Fu, X.; et al. Socio-Ecological Vulnerability in Aba Prefecture, Western Sichuan Plateau: Evaluation, Driving Forces and Scenario Simulation. ISPRS Int. J. Geo-Inf. 2022, 11, 524. [Google Scholar] [CrossRef]
- Guo, B.; Zang, W.Q.; Luo, W. Spatial-temporal shifts of ecological vulnerability of Karst Mountain ecosystem-impacts of global change and anthropogenic interference. Sci. Total Environ. 2020, 741, 140256. [Google Scholar] [CrossRef]
- He, Y.Y.; Zhou, C.C.; Ahmed, T. Vulnerability assessment of rural social-ecological system to climate change: A case study of Yunnan Province, China. Int. J. Clim. Chang. Strateg. Manag. 2021, 13, 162–180. [Google Scholar] [CrossRef]
- Zhao, J.; Ji, G.; Tian, Y.; Chen, Y.; Wang, Z. Environmental vulnerability assessment for mainland China based on entropy method. Ecol. Indic. 2018, 91, 410–422. [Google Scholar] [CrossRef]
- Luo, Q.X. Study on the Coupling Coordination between Smart City Construction and Green Development in Yinchuan. J. Hebei Inst. Environ. Eng. 2020, 30, 6–10+21. [Google Scholar] [CrossRef]
- Hwang, C.-L.; Yoon, K. Methods for Multiple Attribute Decision Making. In Multiple Attribute Decision Making: Methods and Applications a State-of-the-Art Survey; Hwang, C.-L., Yoon, K., Eds.; Springer: Berlin/Heidelberg, Germany, 1981; pp. 58–191. [Google Scholar]
- Chen, W.; Shen, Y.; Wang, Y.A. Evaluation of economic transformation and upgrading of resource-based cities in Shaanxi province based on an improved TOPSIS method. Sustain. Cities Soc. 2018, 37, 232–240. [Google Scholar] [CrossRef]
- Zhong, C.; Yang, Q.; Liang, J.; Ma, H. Fuzzy comprehensive evaluation with AHP and entropy methods and health risk assessment of groundwater in Yinchuan Basin, northwest China. Environ. Res. 2022, 204, 111956. [Google Scholar] [CrossRef] [PubMed]
- Yang, W.; Xu, K.; Lian, J.; Ma, C.; Bin, L. Integrated flood vulnerability assessment approach based on TOPSIS and Shannon entropy methods. Ecol. Indic. 2018, 89, 269–280. [Google Scholar] [CrossRef]
- Gulum, P.; Ayyildiz, E.; Taskin Gumus, A. A two level interval valued neutrosophic AHP integrated TOPSIS methodology for post-earthquake fire risk assessment: An application for Istanbul. Int. J. Disaster Risk Reduct. 2021, 61, 102330. [Google Scholar] [CrossRef]
- Wang, C.; He, Y.Z. Spatial and temporal differentiation and differential regulation of rural production spatial system vulnerability in Chongqing. J. Geogr. 2020, 75, 1680–1698. [Google Scholar]
- Shi, Y.; Deng, M.; Yang, X.X.; Liu, Q.L.; Zhao, L.; Lu, C.T. A Framework for Discovering Evolving Domain Related Spatio-Temporal Patterns in Twitter. ISPRS Int. J. Geo-Inf. 2016, 5, 193. [Google Scholar] [CrossRef]
- Santos Júnior, E.P.; Silva, M.V.B.d.; Simioni, F.J.; Rotella Junior, P.; Menezes, R.S.C.; Coelho Junior, L.M. Location and concentration of the forest bioelectricity supply in Brazil: A space-time analysis. Renew. Energy 2022, 199, 710–719. [Google Scholar] [CrossRef]
- Wan, Y.; Pei, T.; Zhou, C.H.; Jiang, Y.; Qu, C.X.; Qiao, Y.L. ACOMCD: A multiple cluster detection algorithm based on the spatial scan statistic and ant colony optimization. Comput. Stat. Data Anal. 2012, 56, 283–296. [Google Scholar] [CrossRef]
- Hjalmars, U.; Kulldorff, M.; Gustafsson, G.; Nagarwalla, N. Childhood leukaemia in Sweden: Using GIS and a spatial scan statistic for cluster detection. Stat. Med. 1996, 15, 707–715. [Google Scholar] [CrossRef]
- Morais, L.R.d.A.; Gomes, G.S.d.S. Applying Spatio-temporal Scan Statistics and Spatial Autocorrelation Statistics to identify Covid-19 clusters in the world—A Vaccination Strategy? Spat. Spatio-Temporal Epidemiol. 2021, 39, 100461. [Google Scholar] [CrossRef] [PubMed]
- Sankoh, O.A.; Ye, Y.; Sauerborn, R.; Muller, O.; Becher, H. Clustering of childhood mortality in rural Burkina Faso. Int. J. Epidemiol. 2001, 30, 485–492. [Google Scholar] [CrossRef]
- Calvo, H.; Godoy-Calderon, S.; Moreno-Armendariz, M.A.; Martinez-Hernandez, V.M. Forecasting, clustering and patrolling criminal activities. Intell. Data Anal. 2017, 21, 697–720. [Google Scholar] [CrossRef]
- Wang, P.A.; Luo, W.H.; Bai, Y.P. Comparative analysis of aggregation detection based on spatial autocorrelation and spatial-temporal scan statistics. Human Geogr. 2012, 27, 119–127. [Google Scholar] [CrossRef]
- Li, J.F.; Yu, H.F.; Fu, Y.C.; Zhao, Y.L. Spatio-temporal variation and clustering pattern of urbanization coordination degree of “population-economy-land-society-ecology” in Guangdong Province. Prog. Geogr. Sci. 2018, 37, 287–298. [Google Scholar]


Disclaimer/Publisher’s Note: The statements, opinions and data contained in all publications are solely those of the individual author(s) and contributor(s) and not of MDPI and/or the editor(s). MDPI and/or the editor(s) disclaim responsibility for any injury to people or property resulting from any ideas, methods, instructions or products referred to in the content. |
© 2023 by the authors. Licensee MDPI, Basel, Switzerland. This article is an open access article distributed under the terms and conditions of the Creative Commons Attribution (CC BY) license (https://creativecommons.org/licenses/by/4.0/).