Article

Spatiotemporal Heterogeneity of the Characteristics and Influencing Factors of Energy-Consumption-Related Carbon Emissions in Jiangsu Province Based on DMSP-OLS and NPP-VIIRS

1
School of Public Administration, Hohai University, Nanjing 211100, China
2
Center for Environmental and Social Studies, Hohai University, Nanjing 211100, China
3
The Second Institute of Geological and Mineral Resources Survey of Henan, Zhengzhou 450001, China
4
Henan Shanshui Geological Tourism Resources Development Co., Ltd., Zhengzhou 450001, China
*
Authors to whom correspondence should be addressed.
Land 2023, 12(7), 1369; https://doi.org/10.3390/land12071369
Submission received: 28 May 2023 / Revised: 5 July 2023 / Accepted: 6 July 2023 / Published: 8 July 2023

Abstract

:
Scientific estimations and the dynamic monitoring of the development trend of carbon emissions from energy consumption with a long time series can provide the scientific basis for formulating and implementing regional carbon-reduction strategies. Based on DMSP-OLS and NPP-VIIRS night-time light data, a pixel-scale estimation model of energy-consumption carbon emissions in Jiangsu Province from 2000 to 2019 was constructed. The spatiotemporal evolution characteristics and influencing factors were analyzed using the GIS method and a GTWR (geographically and temporally weighted regression) model. The results showed that: (1) The goodness of fit of the image-fusion correction of the two night-time light data sources from 2012 to 2013 was 0.894; the goodness of fit of the carbon-emission estimation model by stages was above 0.99; and the average relative error was 7.71%, which met the requirement for the estimation accuracy. (2) During the study period, the total carbon emissions from energy consumption in Jiangsu Province continued to increase, rising from 94.7618 million tons to 313.3576 million tons, with an annual growth rate of 6.50%; and the growth rate presented an upward trend of “slow-accelerate-decelerate”. Spatially, it showed an unbalanced distribution pattern of “low north and high south”. (3) Per-capita GDP and energy intensity were the core driving factors affecting carbon emissions in Jiangsu Province over the past 20 years. Energy intensity had the greatest driving effect on carbon emissions in southern Jiangsu, while per-capita GDP had the greatest influence in central and northern Jiangsu. Coordinating the relationship between central, north, and south Jiangsu is of great significance for the realization of the sustainable economic and social development of the double carbon goal.

1. Introduction

In the context of global warming, reducing energy-consumption-related carbon emissions is gradually becoming a key factor affecting carbon peaking and carbon neutrality. The impact of global warming is not gradual or mild; it is rather unbalanced, linear, etc. Once certain critical points that ensure the global climate balance are exceeded, it will trigger unpredictable and irreversible ecological and environmental changes [1,2,3]. As a major greenhouse gas, CO2 is associated with at least 66% of climate change [4], and carbon emissions are receiving increasing attention from the international community. In the face of global environmental challenges, China, as a responsible developing country, strives to achieve a carbon peak by 2030 and to achieve carbon neutrality by 2060 (collectively referred to as the “3060 double carbon target”). The achievement of the “3060 dual carbon target” not only relies on macroeconomic regulation at the national level but also on specific response measures at the local level. Therefore, each region needs to develop an accurate scientific understanding of the local carbon emissions situation, determine the driving factors, and then quantify and clarify emissions-reduction pathways to achieve precise emissions reduction [4,5].
There are various methods for estimating carbon emissions, each with its own advantages and disadvantages. Most researchers use the IPCC carbon-emission estimation method based on statistical data [6,7,8], which can achieve estimations at the provincial scale and for some key cities. However, the estimation of heterogeneity on smaller administrative scales is limited. By using night-time light image data, regional spatial differentiation characteristics can be intuitively revealed [9,10], effectively applying energy-consumption statistical data [11]. Night-light data (DMSP-OLS: Defense Meteorological Satellite Program-Operational LineScan System, NPP-VIIRS: National Polar-orbiting Partnership-Visible Infrared Imaging Radiometer Suite) can effectively detect night light and even low-intensity night light generated by small-scale residential areas and traffic flow, which is a good data source for monitoring the intensity of human activities. That night-light data can be used to estimate carbon emissions has been proved by many scholars [9,10,11]. Welch first validated the feasibility of using night-light data for power consumption estimation in the 1980s [12]. Later, increasing numbers of domestic and foreign scholars began to study energy consumption at the national or regional scales based on DMSP-OLS night-light data. With the discontinuation of DMSP-OLS data in February 2014, VIIRS continued to capture global night-time low-light images [13] and provided NPP-VIIRS night-time light data from 2012 to the present. Scholars began to study continuous long time series data based on the fusion of DMSP-OLS night-time light data and NPP-VIIRS night-time light data [11,14]. By sorting and summarizing the existing literature, we found that current scholars mainly use methods and theories such as the Logarithmic Mean Dirichlet Index (LMDI) [15,16], the Spatial Econometric Model [17], the STIRPAT Model [18], Geographic Detector [19], the Environmental Kuznets Curve Theory [20], and Geographically Weighted Regression [21] to study the impact of the energy structure, energy efficiency, economic development, population size, industrial structure, and technological level [22,23,24,25] on carbon emissions.
The above research provides references for this study; however, currently, most studies based on night-time light data are only based on one data source, and there are relatively few studies that combine the DMSP-OLS and NPP-VIIRS data sources to estimate carbon emissions. Moreover, most research areas are concentrated at global or national scales, and there is relatively little detailed research on micro scales at the provincial and municipal levels. In terms of the methods used to analyze the influencing factors of carbon emissions, scholars have given less consideration to the temporal variation and non-stationary nature of the continuous surface validation parameter values at the regional spatial scale, which may lead to significant errors in the research results. In the fourteenth Five-Year Development Goal and Plan on carbon neutrality and carbon peaking, Jiangsu Province proposed to accelerate the energy revolution and strive to take the lead in achieving the goal of “carbon peaking” in the country. However, pollution-intensive and energy-consuming industries are still important components in driving the economic growth of Jiangsu Province. The energy structure is heavily dependent on coal, and the energy-conservation and emissions-reduction situation is increasingly urgent.
In view of this, this study selects Jiangsu Province as the research object and builds an estimation model of energy-consumption carbon emissions in Jiangsu Province at the pixel scale from 2000 to 2019 based on DMSP-OLS and NPP-VIIRS night-light data. It uses the longitude and latitude data of 13 prefecture-level cities to build a geographical distance matrix and uses a spatiotemporal geographical weighted regression model to reveal the key factors affecting energy-consumption carbon emissions in Jiangsu Province and their mechanisms. This study offers a data basis for achieving peak and neutral carbon emissions and provides strong references for accurately determining key emissions-reduction areas and formulating reasonable carbon emissions policies.

2. Data and Methods

2.1. Study Area

Jiangsu Province is located on the coast of the Yellow Sea in the eastern part of mainland China, with geographic coordinates ranging from 116°18′~121°57′ E to 30°45′~35°20′ N. It borders Shandong, Anhui, Zhejiang, and Shanghai, covering a total area of 107,200 square kilometers. It has 13 prefecture-level administrative regions and can be divided into 3 major regions: southern Jiangsu, central Jiangsu, and northern Jiangsu, according to its geographical location [26]. As an important part of the Yangtze River Delta economic circle, Jiangsu Province is not only a major economic province, but also a province that amplifies carbon emissions. Highly polluting and energy-consuming industries are important components of the economic growth in Jiangsu Province. Coal accounts for a high proportion of the energy-consumption structure, and the carbon emissions-reduction situation is severe.

2.2. Data

2.2.1. Night-Time Light Data

DMSP-OLS data can be obtained from http://www.ngdc.noaa.gov/eog/index.html (accessed on 1 November 2021). The product collects 34 time series images with 6 different sensors (including F10, F12, F14, F15, F16, and F18), providing global night-light imaging data from 1992 to 2013. Due to the lack of in-orbit radiometric calibration and correction facilities, there is a pixel saturation problem with DMSP-OLS non-radiometric calibration data, which needs to be corrected based on radiometric calibration data. The NPP-VIIRS annual night-time light remote sensing data is the global night-time light annual data captured by the Suomi NPP satellite using a visible light infrared imaging radiometer. It can be obtained at https://eogdata.mines.edu/products/vnl/#annual_v2obtain (accessed on 10 November 2021). The spatial data resolution of the product is 15 arc seconds, and the geographic coordinate system is WGS-84. Compared with the DMSP-OLS night-light data, these data do not have the problem of pixel DN saturation, but there are negative values and abnormal mutation values for brightness, so data preprocessing is required. This study conducted a series of preprocesses on DMSP-OLS image data, including reprojection, resampling and cropping, mutual correction between images, annual fusion correction, and time series continuity correction [27,28,29,30], and ultimately obtained DMSP-OLS data corrected from 2000 to 2013 and NPP-VIIRS data corrected from 2012 to 2019 in China.
Finally, a regression model was established for China’s 2012 and 2013 data from two data sources—DMSP-OLS and NPP-VIIRS. With prefecture-level administrative regions as calibration units, DMSP-OLS data as reference objects, and NPP-VIIRS data as calibration objects, a regression relationship was constructed between the total brightness values of prefecture level lighting in 2012 and 2013 (Table 1).
In the formula, y is the DMSP-OLS night-time lighting data for the years 2012–2013 and X represents NPP-VIIRS night-time lighting data for the years 2012–2013. After comparison, the quadratic function with the best goodness of fit is selected as the fitting model, then, the night-time light data for 2014–2019 under the DMSP-OLS scale is fitted; and finally, the corrected night-time light data in Jiangsu Province from 2000 to 2019 under the DMSP-OLS scale is obtained.

2.2.2. Statistical Data

The statistical data of energy consumption are from the China Energy Statistical Yearbook, and the data of the total permanent population, urbanization rate, GDP per capita, foreign investment, energy intensity, and other influencing factors are all from the Jiangsu Statistical Yearbook.

2.3. Methods

2.3.1. Energy Consumption Carbon-Emission Calculation Model

Based on the statistical data for energy consumption in Jiangsu Province, the carbon emissions are calculated using the various energy carbon-emission coefficients determined in the IPCC National Greenhouse Gas Inventory Guidelines. Referring to the calculation method of Su Yongxian et al. [31], the carbon emissions in Jiangsu Province are calculated using the following formula:
C O 2 = 44 12 × i = 1 9 K i E i
In the formula, i represents the type of energy consumption; Ki represents the carbon-emission coefficient of Class I energy (10,000 tons of carbon/10,000 tons of standard coal), and Ei represents the consumption of Class I energy, calculated based on standard coal (10,000 tons). The specific carbon-emission coefficients of each energy consumption type are shown in Table 2.

2.3.2. Simulating Carbon Emissions Based on Night-Time Lighting Data

Due to the significant differences in economic development levels between different regions in China, the carbon emissions of different provinces are also quite different. In order to avoid this having an impact on the accuracy of the carbon emissions estimation, this paper directly selects the corrected total night-light value of Jiangsu Province from 2000 to 2019 and its carbon emissions to establish a regression model. With the total night-light value as the explanatory variable and the total carbon emissions as the explanatory variable, considering the inversion accuracy of the downscaling model, this study uses the linear function model without constant terms. By analyzing the data’s characteristics, it is found that the stage characteristics are relatively obvious, showing the characteristics of slow growth in early years, rapid growth after reaching the inflection point of 2004, and gradual slowing down after 2012. Therefore, this study divides the data into three time periods for linear fitting analysis (Table 3). The results show that the p value is significant at the level of 1%; R2 was 0.998, 0.991, and 0.994, respectively, and the goodness of fit was high in certain stages. The average relative error between the estimated carbon emissions and the statistical values is 7.71%, which meets the estimation accuracy requirements.
In the formula, y represents the carbon emissions (t) and x represents the DN value of night-time lighting. According to the above formula, the carbon emissions of energy consumption in Jiangsu Province from 2000 to 2019 are calculated based on night-time lighting data. Finally, the annual statistical carbon emission results are used to correct the estimated results of each grid, so the total results are consistent.

2.3.3. GTWR Model

The GTWR model is a local linear regression model used in geography and related disciplines in the analysis of spatiotemporal pattern changes; it can be used for the quantitative analysis of spatial patterns. It is an optimization of the geographically weighted regression (GWR) model, which verifies the temporal and non-stationary changes in parameter values on a continuous surface at the regional spatial scale and fits the influencing factors from the spatiotemporal dimension to make the estimation results more accurate and effective [26,27]. The formula is as follows [28]:
Y i = β 0 u i , v i , t i + j = 1 ρ β j u i , v i , t i X i j + ε i i = 1 , 2 , 3 n
In the formula, Yi is the estimated carbon emissions of the sample point, and ui, vi, and ti are the longitude, latitude, and time of the sample point, respectively. β0(ui, vi, ti) is the regression constant of the sample points, βj(ui, vi, ti) is the regression coefficient of the jth independent variable of the sample point; Xij is the value of the explanatory variable xj at sample point i; and εi is the random error term.

3. Results

3.1. The Spatiotemporal Evolution Characteristics of Carbon Emissions

3.1.1. Provincial Scales

From a spatial perspective, as shown in Figure 1, the carbon emissions in Jiangsu Province showed a continuous growth trend from 2000 to 2019, expanding from point distribution to block-like continuous expansion, mainly relying on various cities and districts, continuously expanding outward, and ultimately forming several high-density emission clusters centered around each city. The expansion trend in the southern region of Jiangsu is the most obvious, and it presents an uneven distribution pattern of “low in the north and high in the south”.
From 2000 to 2019, the total carbon emissions from energy consumption in Jiangsu Province continued to grow, from 94.7618 million tons to 313.3576 million tons, with an average annual growth rate of 6.50%. From a phased perspective, the growth rate of carbon emissions in Jiangsu Province has shown a “slow acceleration deceleration” upward trend. From 2000 to 2003 (the slow upward stage), the average annual growth rate of carbon emissions was 3.01%; from 2003 to 2011 (the accelerated upward stage), the average annual growth rate reached 13.21%, and from 2011 to 2019 (the deceleration upward stage), the growth rate slowed down, with an average annual growth rate of 1.44%. This is closely related to the gradual shift from early extensive high-speed growth to high-quality economic development. During the tenth Five-Year Plan period, the average annual growth rate of total carbon emissions in the province was about 14.2%; during the eleventh Five-Year Plan period, the average annual growth rate of total carbon emissions was about 6.7%; during the twelfth Five-Year Plan period, the average annual growth rate of total carbon emissions decreased to 3.8%; and during the first four years of the thirteenth Five-Year Plan period, the average annual growth rate of carbon emissions was 1.6%. The annual average growth rate of total carbon emissions decreased significantly in stages.

3.1.2. Municipal Scale

From a municipal-scale perspective, as shown in Figure 1, in 2000, the high-carbon-emission areas in Jiangsu Province were mainly located in the urban areas of Nanjing, Suzhou, Wuxi, Changzhou, and Xuzhou, and they were generally at a relatively low level. In 2005, the scale of the above-mentioned regions continued to expand, with carbon emissions in the urban areas of Suzhou, Wuxi, and Changzhou forming a “three point one line” series. At the same time, carbon emissions in Suzhou continued to spread from the urban area to surrounding districts and counties. Carbon emissions in the central and northern regions of Jiangsu also spread from the urban area to the periphery, but their degree of diffusion was not as significant as in the southern region of Jiangsu. In 2010, the diffusion effects of Yangzhou City and Zhenjiang City were significantly enhanced and served as a bridge connecting Nanjing with the Suzhou Wuxi Changzhou region, forming a belt-shaped carbon-emission zone. In 2015, carbon emissions in the southern Jiangsu region were strengthened, forming a large-scale contiguous carbon-emission zone. Among them, the unit grids with carbon emissions of over 3000 tons in Suzhou and Wuxi almost covered the entire city. In 2019, various urban areas continued to develop and spread outward. The trend of contiguous areas in southern and central Jiangsu became increasingly strong, and the diffusion trend in northern Jiangsu became more obvious. Eventually, the province formed carbon-emission zones with different levels of density that spread from the urban area to surrounding districts and counties. However, overall, the southern Jiangsu region showed a cluster-like agglomeration trend, which also drove the overall southward diffusion and development of the central Jiangsu region. Meanwhile, the cities in northern Jiangsu are scattered and the agglomeration effect is not significant.
The specific temporal variation in carbon emissions at the municipal level is shown in Figure 2. In 2000, the city with the highest carbon emissions was Suzhou, while the other high-level cities included Nanjing, Wuxi, Nantong, and Xuzhou. In 2005, the above-mentioned high-carbon areas showed a rapid expansion trend, with Suzhou City widening the gap with other cities in terms of carbon emissions at a significant growth rate— almost twice that of Wuxi City, the second-largest emitter city. In 2010, the carbon emissions of Suzhou and Nantong continued to rapidly expand and significantly increase. In 2015, the growth rate of Suzhou slowed down, while Nantong continued to accelerate its growth, becoming the second-largest emission-emitting city in the province. In 2019, various cities further developed on their original bases, with Suzhou’s growth rate further slowing down and Yancheng’s carbon emissions continuously increasing, becoming the fourth-largest emitting city in the province. These results show that high-carbon-emission areas are mainly distributed in cities such as Suzhou, Wuxi, Nantong, and Nanjing, while cities such as Suqian, Huai’an, and Lianyungang in the northern Jiangsu region have always been low-carbon areas. Their economies are relatively behind compared to those in the southern Jiangsu region, and their energy consumption is relatively low.

3.1.3. County Scales

According to the natural discontinuities classification method, the carbon emissions of the counties and districts in Jiangsu Province were divided into three different carbon-emission zones: severe, moderate, and mild (Figure 3). In 2000, there were 41 mild emission areas, mainly distributed in the north of Yancheng City, the south of Lianyungang City, the southwest of Suqian City, and the southwest of Huai’an City. There were 39 areas with moderate emission, mainly distributed in Xuzhou, Yangzhou, and Nantong, and 16 areas with heavy emission, mainly distributed in Nanjing, Suzhou, and Wuxi, including Liuhe District, Gulou District, Pukou District and Jiangning District in Nanjing, Zhangjiagang District, Changshu City, Kunshan City, Wuzhong District, and Wujiang District in Suzhou, and Jiangyin District and Yixing City in Wuxi. In 2005, there were 43 low-emission areas, mainly situated in Yancheng City, Lianyungang City, Suqian City, and Huai’an City. There were 43 areas with moderate emissions, mainly distributed in southern Jiangsu, Xuzhou, and Yancheng’s coastal districts and counties. There were 10 key emission areas, mainly distributed in Zhangjiagang, Changshu, Kunshan, the Wuzhong and Wujiang districts of Suzhou, the Yixing and Jiangyin districts of Wuxi, the Wujin District of Changzhou, and the Jiangning District of Nanjing. In 2010, the number of counties with mild emissions decreased to 23, while the number of counties with moderate emissions increased to 62, accounting for 65 percent of the total. The number of major emission areas totaled 11, with Tongzhou District of Nantong City added to the list over the course of 2005. In 2015, there were 36 counties and districts with low emissions; these areas were mainly distributed in the north of Yancheng City, the south of Lianyungang City, the southwest of Suqian City, and the southwest of Huai’an City. There were 48 areas with moderate emissions, mainly distributed in Yangzhou, Nantong, Taizhou, and other middle Jiangsu cities and Xuzhou. Finally, 12 areas had heavy emissions; these were mainly distributed in Nanjing, Suzhou, and Wuxi, including the Jiangning District of Nanjing, the Zhangjiagang City of Suzhou, Changshu City, Kunshan City, Wuzhong District, Wujiang District, Wuxi Jiangyin District, Yixing City, etc., as well as the Wujin District of Changzhou City and the Tongshan District of Xuzhou City. In 2019, the number of counties with low emissions decreased to 20, and the number of counties with moderate emissions increased to 56, with a total of 20 key emissions areas. Compared with 2015, eight more counties and districts were added, including Dafeng District, Xinghua City, Rugao City, Qidong City, Pizhou City, Liuhe District, Pukou District, and Danyang City. In general, the number of counties with mild emissions increased first and then decreased; the number of counties with moderate emissions increased first and then decreased and then increased again; and the number of counties with heavy emissions has been increasing since 2005.
The top three counties with the highest energy-consumption carbon emissions in 2000, 2005, 2010, 2015, and 2019 were as follows. In 2000, the county-level carbon emissions were the highest in Jiangyin, Changshu, and Kunshan, with 2,502,200 tons, 2,243,000 tons, and 2,116,400 tons, respectively. In 2005, Jiangyin City, Changshu City, and Kunshan City had the highest carbon emissions, with values of 5,605,200 tons, 5,584,500 tons, and 5,336,100 tons, respectively. In 2010, the highest carbon emissions were in Jiangyin City, Changshu City, and Wujiang District, with values of 7,630,200 tons, 7,755,500 tons, and 6,612,800 tons, respectively. In 2015, Changshu City, Wujiang District, and Yixing City had the highest carbon emissions, with 9,0266,100 tons, 8,265,800 tons, and 7,908,800 tons, respectively. In 2019, Changshu City, Yixing City, and Wujiang District had the highest carbon emissions of 8,182,700 tons, 8,310,800 tons, and 8,005,300 tons, respectively.

3.2. Analysis of Factors Affecting Carbon Emissions

3.2.1. Empirical Results of GTWR

By synthesizing the indicators selected in the existing research [32,33,34], and in order to avoid the problem of multicollinearity, OLS is used to conduct regression analysis on each indicator. Then, we gradually screened explanatory variables until the variance expansion factor (VIF) was within 7.5 and the p value of each explanatory factor was less than 0.05, thus forming an effective list of explanatory variables. Finally, this study determines that the carbon emissions (10,000 tons) of each city are the explanatory variable Y, and the population size, economic level, industrial structure, foreign investment, energy intensity, urbanization rate, etc., as factors affecting carbon emissions, are the explanatory variables X, which are characterized by, respectively, the total number of permanent residents (10,000 people), per-capita GDP (CNY 10,000), the proportion of gross output value of the secondary industry in GDP (%), actual total foreign direct investment (USD 100 million), the proportion of energy consumption in GDP (t standard coal/CNY 10,000), and the proportion of the urban population in the total population (%) [35,36,37,38].
To investigate the differences in the impact of various explanatory variables on urban carbon emissions in Jiangsu Province, this study used the min–max standardization method to perform dimensionless treatment on each variable. Using the ArcGIS 10.7 spatiotemporal geographic weighted regression analysis module, the OLS, GWR, and GTWR methods were selected to calculate the regression coefficients of the influencing factors. The GTWR model selected the optimal bandwidth through cross-validation and set the ratio of spatiotemporal distance parameters to 1. Based on the estimation results of each model, it was found (Table 4) that GTWR has a higher fitting degree and a lower residual sum of squares, AICc, and Sigma compared to OLS and GWR, indicating that the GTWR model will produce more accurate and effective results and is a suitable method for exploring the factors affecting carbon emissions.
From the average value of the regression coefficient of GTWR, the estimated values of the regression coefficient of the population size, economic level, industrial structure, foreign investment, energy intensity, and urbanization rate are all positive, indicating that the above variables are positively related to carbon emissions from a global perspective and other variables remain unchanged. From the specific regression coefficient (Table 5), the economic level and energy intensity have the greatest explanatory power for carbon emissions in Jiangsu Province, followed by population size and the urbanization rate; the industrial structure and foreign investment have weak explanatory power. Specifically, the economic level has the greatest impact on carbon emissions in eight cities, Nanjing, Xuzhou, Lianyungang, Huai’an, Yancheng, Yangzhou, Taizhou, Suqian, and Wuxi. In five cities including Changzhou, Suzhou, Zhenjiang, and Nantong, energy intensity is the strongest factor to promote carbon emissions. On average, every 1% increase in the economic level, energy intensity, population size, urbanization rate, industrial structure, and foreign investment will increase carbon emissions by 0.747%, 0.678%, 0.409%, 0.163%, 0.087%, and 0.031%, respectively.

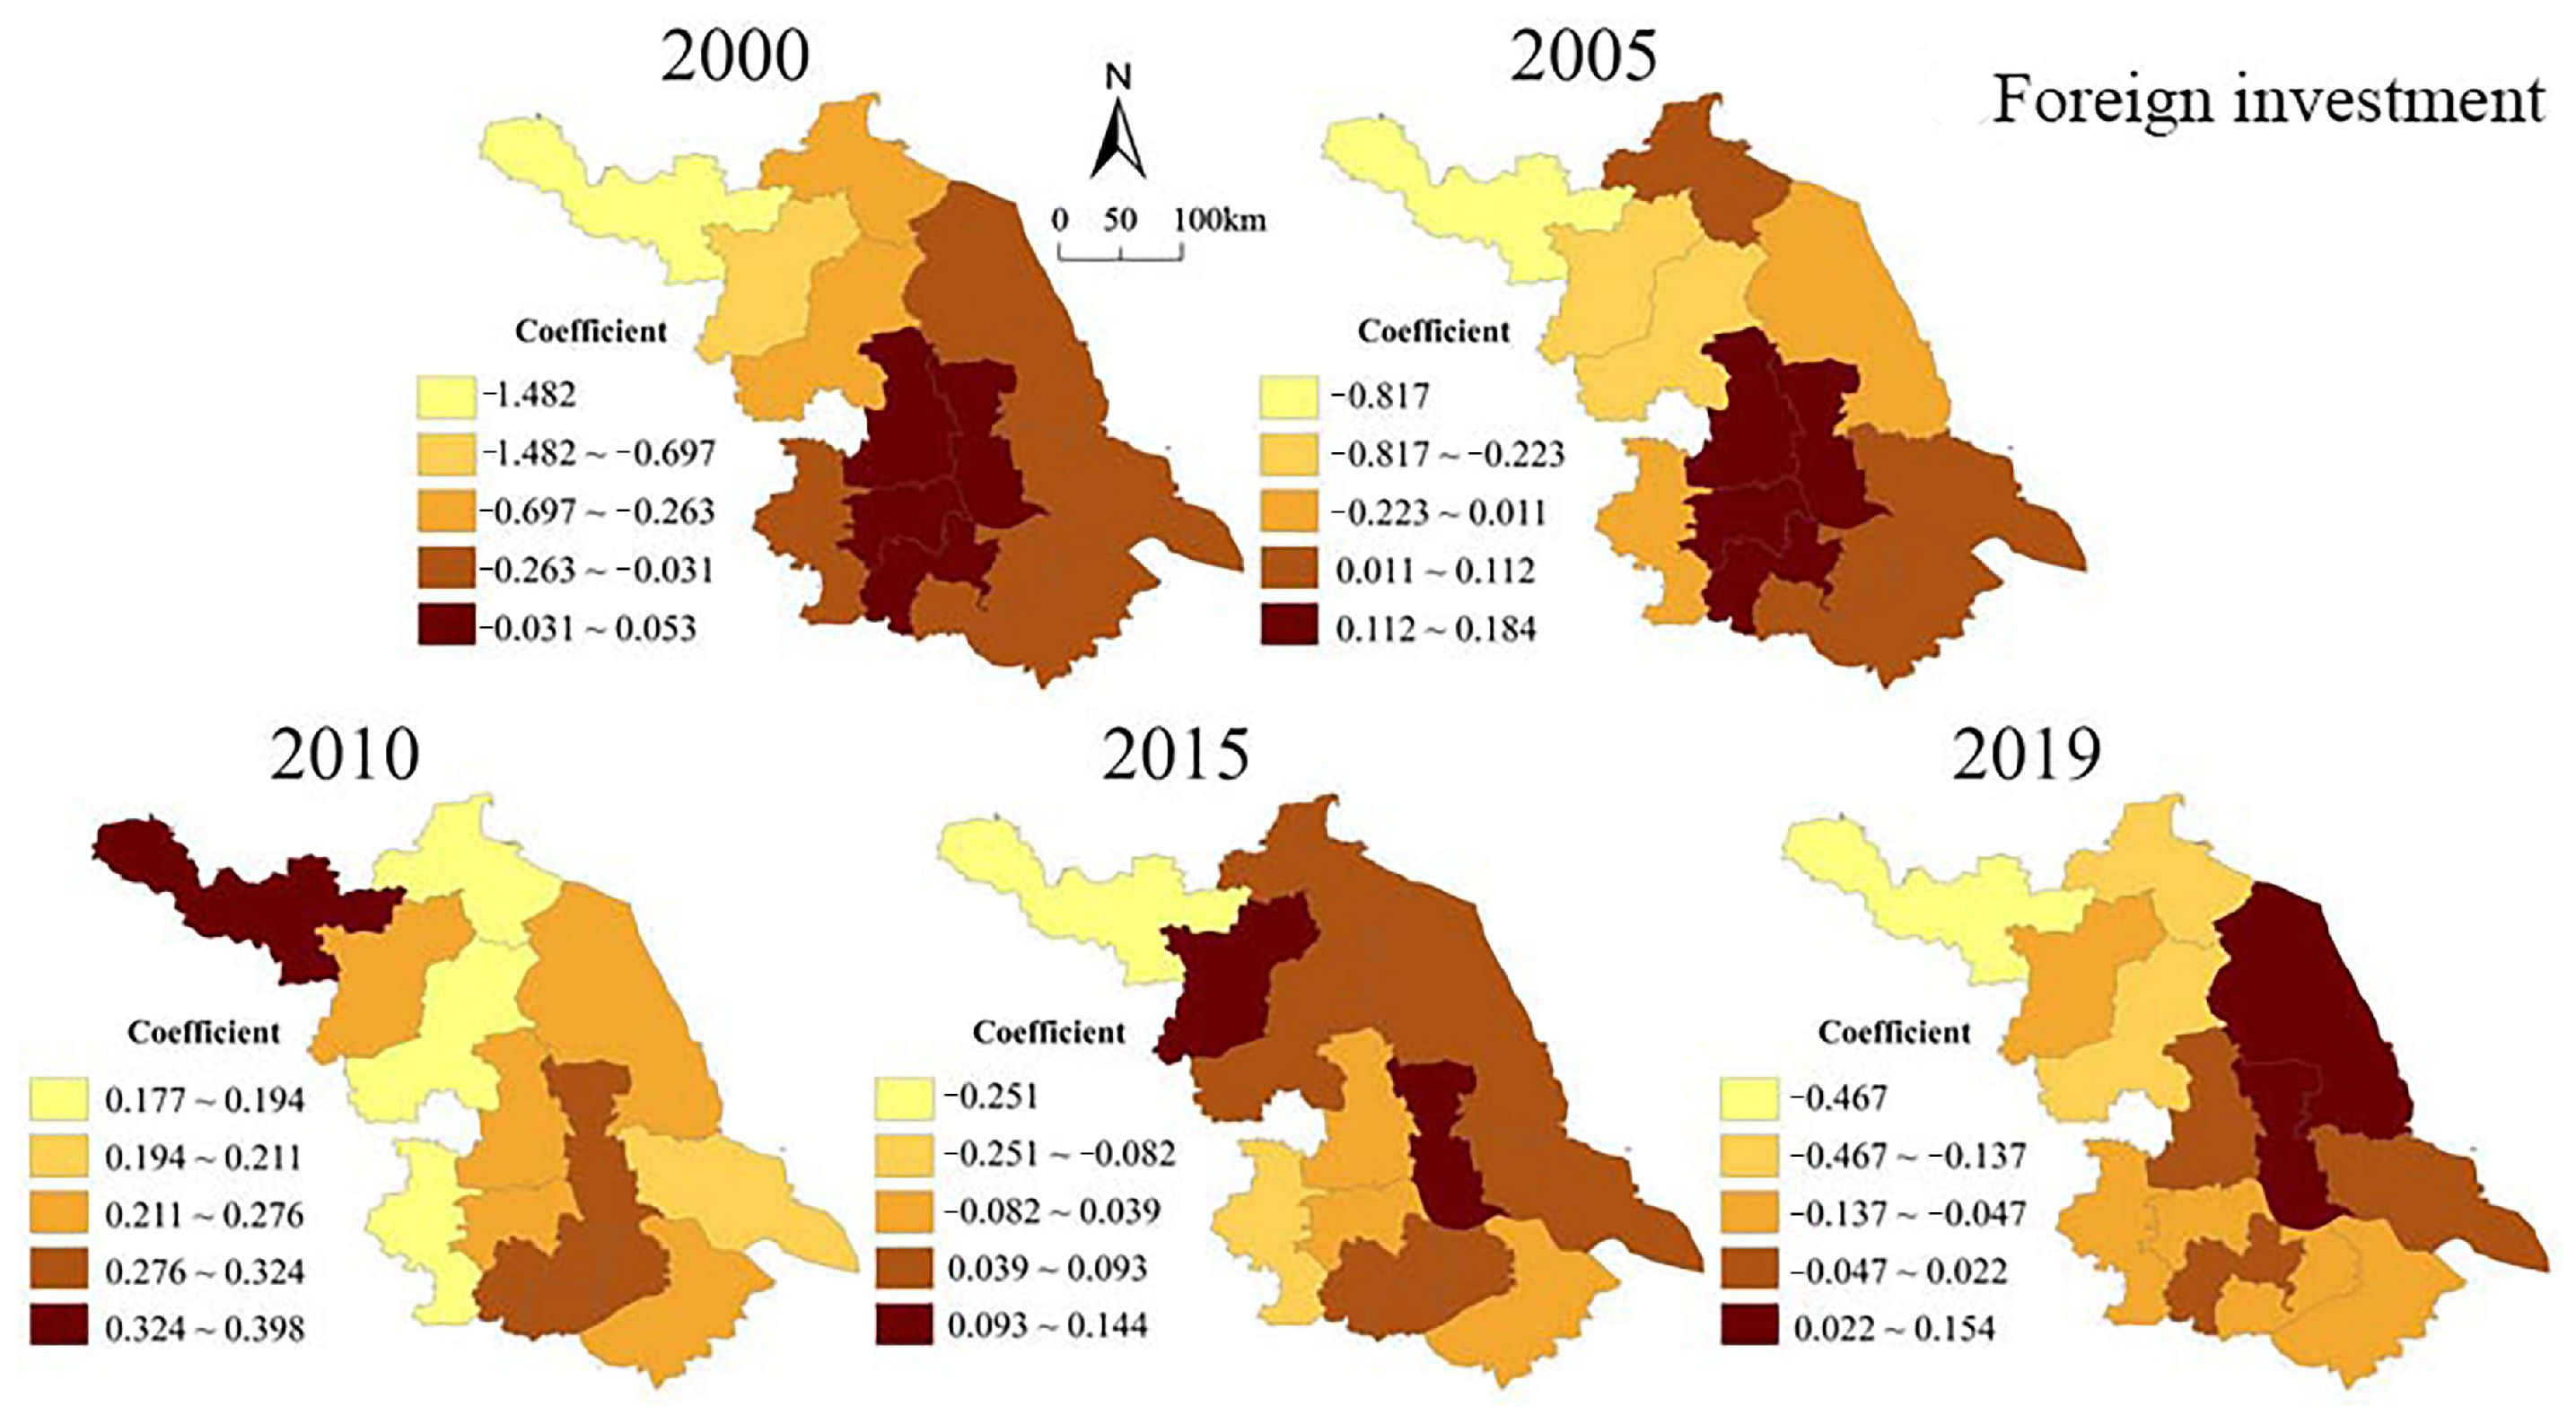
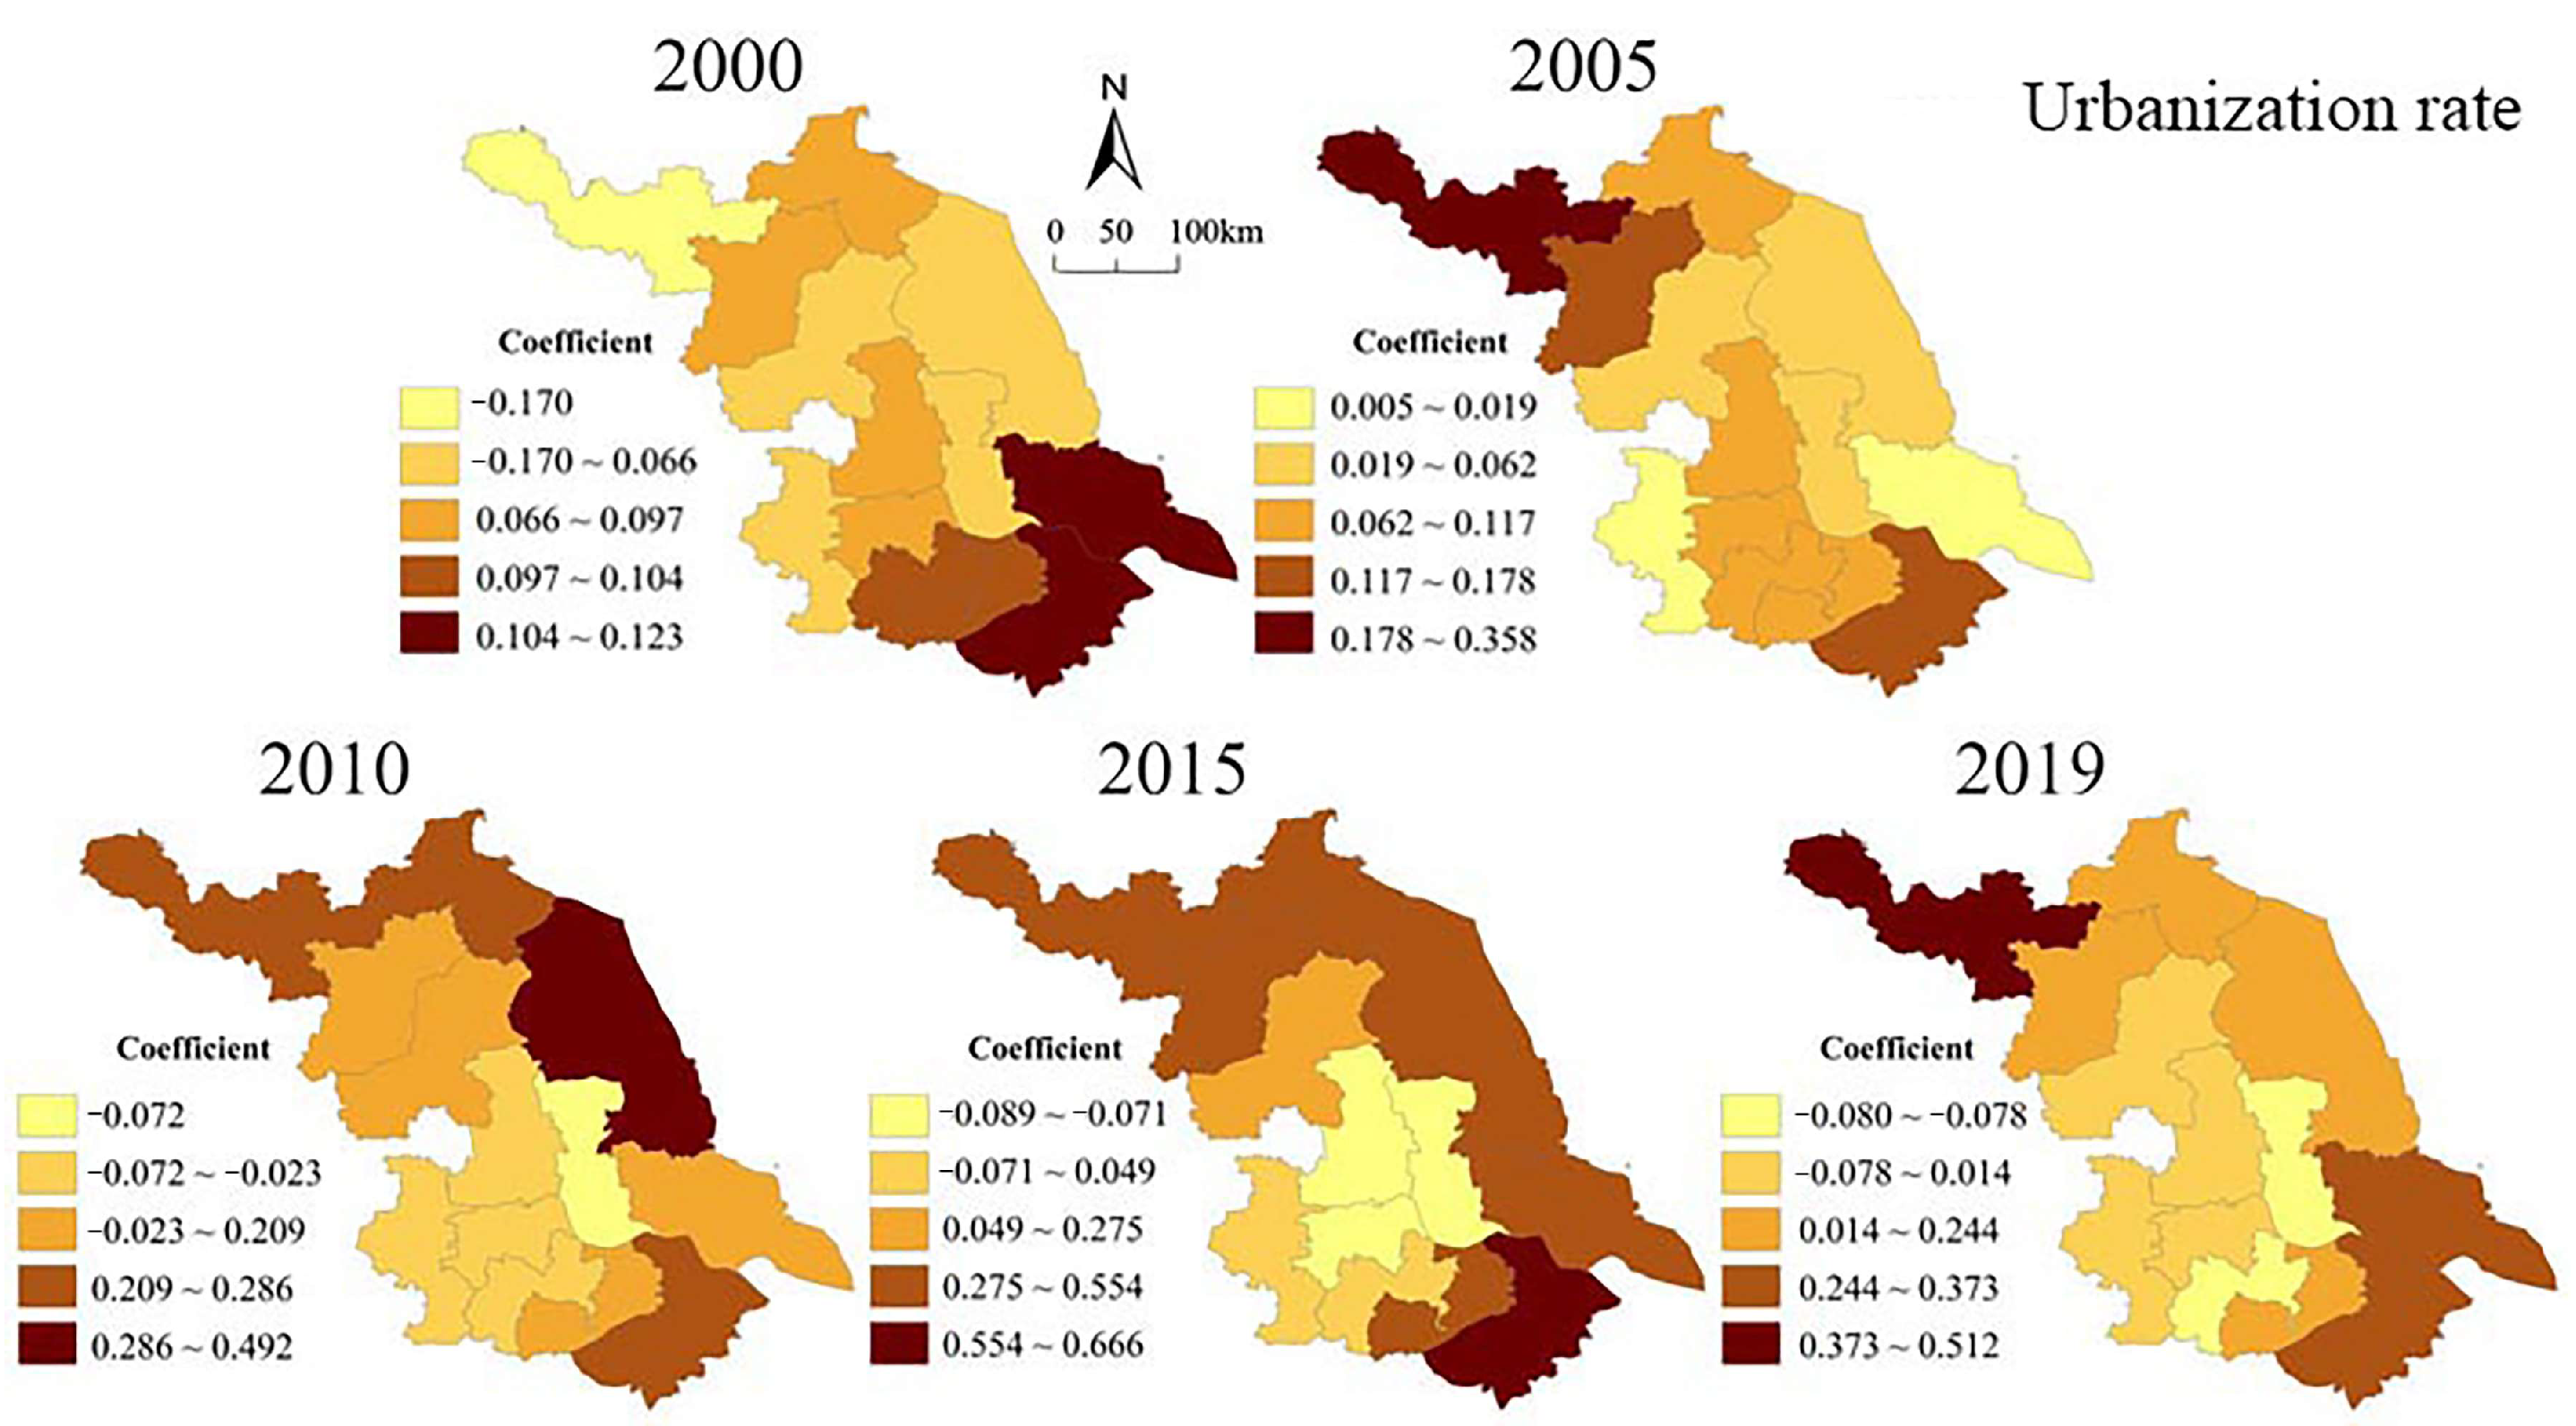
3.2.2. Spatial and Temporal Heterogeneity of Factors Affecting Carbon Emissions

The regression coefficients of influencing factors in different time periods are visualized after analyzing the GTWR model; the spatiotemporal differentiation pattern of each influencing factor coefficient are analyzed from a global perspective; and Arcgis10.7 is used to classify the regression coefficients into five levels according to the natural breakpoint classification method (low, low, medium, high, and high). This allows for a spatial analysis of the differences of various influencing factors. The darker the color, the greater the coefficient, indicating a higher driving intensity.
The regression coefficients of the population size factor during the research period were all positive and gradually increasing, with the lowest value increasing from 0.131 in 2000 to 0.379 in 2019, and the highest value increasing from 0.344 to 0.759 (Figure 4). This indicates that the population size factor has a positive effect on the carbon emissions of all prefecture-level cities, and its driving force is gradually increasing. However, there are significant spatial differences regarding this impact, and the overall pattern is high in the south and low in the north. In 2000, the high-value areas for the population size factor coefficient were mainly concentrated in Suzhou, Wuxi, and Nantong. In 2005, Nanjing was newly added as a high-value area; meanwhile, in 2010, Changzhou and Zhenjiang retired to the middle and equivalent areas. In 2015, the population coefficient of all cities in the southern Jiangsu region reached values above 0.61; in 2019, it reached 0.65. This shows that Suzhou, Nantong, Nanjing, Wuxi, and other key cities have a significant impact on carbon emissions due to population size. The impact of population growth on carbon emissions has always been among the factors in the province, while the low-value areas have always been cities such as Suqian and Lianyungang in the northern Jiangsu region. Their population outflow is relatively severe, and their growth rate is relatively slow compared to other regions, meaning that population factors have a relatively small impact on carbon emissions.
The regression coefficients of the economic-level factors are all positive, showing an overall trend of first decreasing and then increasing (Figure 5). This indicates that the economic-level factors have a positive effect on the carbon emissions of all prefecture-level cities, and their driving effect generally shows a trend of first weakening and then slightly increasing. Spatially, high-value areas show a trend of gradually shifting from north to south. In 2000, the coefficient of economic-level factors ranged from 0.757 to 3.771, with high values mainly concentrated in Xuzhou, Suqian, and Lianyungang. In 2005, the overall impact degree decreased compared to 2000, with the highest coefficient decreasing to 1.941. Relatively speaking, the high-value areas were mainly concentrated in Xuzhou and Suqian. In 2010, the overall impact degree decreased significantly, with a coefficient range of 0.110 to 0.538. In 2015, the impact degree slightly increased, and the high-value areas shifted to Changzhou and Zhenjiang cities. In 2019, the degree of impact continued to increase slightly, and the high-value areas expanded to include Xuzhou, Lianyungang, Changzhou, Wuxi, and other places. From the perspective of the overall evolution pattern, with the formulation of a low-carbon economic strategy, the establishment of carbon emissions-reduction goals, and the emphasis on the ecological responsibility of enterprises, the urban economic development structure has been gradually optimized and the level has been rising. This has gradually brought the carbon emissions caused by economic development under control, so the impact of the economic level is generally fluctuating downward [39].
The regression coefficient of the industrial structure factor changes slightly, showing a fluctuating downward trend overall (Figure 6). Spatially, it shows a trend of high-value areas moving from the southeast to the southwest. In 2000 and 2005, high-value areas were mainly distributed in Suzhou, Wuxi, Nantong, etc., mainly because of the rapid growth of these cities’ early extensive economies and the increase in energy demand and consumption caused by the agglomeration of industry-led activities. From 2010 to 2019, Suzhou, Wuxi, Changzhou, and Nantong exhibited negative values, indicating a negative correlation between their industrial structure and carbon emissions. This is mainly due to the gradual increase in the proportion of tertiary industry and the continuous decrease in the proportion of secondary industry in these cities with the improvement of their economic development level, leading to the opposite trend for industrial structure and carbon emissions. However, the industrial structure coefficient in northern Jiangsu is mostly positive, indicating that its industrial structure has a stronger driving effect on carbon emissions than in the southern region of Jiangsu.
The overall regression coefficient of the foreign investment factor shows a trend of first increasing and then decreasing (Figure 7). In 2000, 69.23% of the samples had a negative coefficient for foreign investment factors; meanwhile, in 2005, only 30.77% of the samples had a negative coefficient. In 2010, the coefficients of all cities were positive, with higher coefficients in Xuzhou, Changzhou, Wuxi, Taizhou, etc. In 2015, 15.38% of the samples had a negative coefficient and in 2019, 76.92% of the samples had a negative coefficient. The coefficients of Taizhou and Changzhou are positive. The trend of coefficient development increases first and then decreases mainly because, in the early stage of China’s accession to the WTO, most foreign businesses introduced pollution-intensive and labor-intensive industries to Jiangsu, which brought economic growth to Jiangsu and also increased carbon dioxide emissions. In recent years, the government has put forward the goals of a green economy and energy conservation and emissions reduction, increased control over high-pollution and energy-consuming industries and formulated strict environmental access regulations for foreign investment. The driving effect of foreign investment as an influencing factor on carbon emissions is gradually weakening [40].
The regression coefficients of the energy intensity factors are all positive, showing an overall upward trend, indicating that the driving role of energy intensity factors on carbon emissions in all prefecture-level cities has gradually increased, and the overall spatial distribution pattern is high in the south and low in the north (Figure 8). In 2000, the overall level was relatively low, with the energy intensity coefficient ranging from 0.109 to 0.424. High-value areas were mainly concentrated in Suzhou, Wuxi, Changzhou, and Nantong, while low-value areas were mainly concentrated in northern Jiangsu. In 2005, the coefficients of all regions increased. In 2010, the coefficients of most regions decreased compared with 2005. The main high-value areas were Suzhou and Wuxi. In 2015, the impact of the energy intensity factors increased significantly compared with 2010; the coefficient range is between 0.365 and 2.681, and there is no significant change in the high-value areas compared to 2010. The overall coefficient value continued to increase in 2019, with the coefficient in Suzhou reaching 3.604. It can be seen that the carbon emissions of Suzhou and Wuxi have always been high-value areas affected by energy intensity factors during the study period, mainly because they have many highly energy-consuming enterprises, high energy intensity, and a strong pulling effect on carbon emissions. Meanwhile, most cities in northern Jiangsu are less strongly affected by energy intensity factors than those in southern Jiangsu.
The overall regression coefficient of the urbanization rate factor shows a fluctuating upward trend with positive and negative values, indicating that there are significant differences in the impact of the urbanization rate on carbon emissions within the study area (Figure 9). In 2000, only Xuzhou City had a negative coefficient, with high-value areas concentrated in Suzhou, Nantong, and other areas. In 2005, the urbanization rate coefficients of all cities were positive, and in 2010, 2015, and 2019, some cities had negative regression coefficients. Among them, cities such as Yangzhou, Zhenjiang, and Taizhou had negative values in these three years, mainly because their urbanization rates tended to improve after 2010, and especially after 2015. Therefore, the carbon emissions growth caused by the urbanization rate is slow.

4. Discussion

4.1. The Spatiotemporal Evolution Characteristics of Carbon Emissions

The results of this article on the total carbon emissions of energy consumption in Jiangsu Province are relatively similar to the research results of scholars such as Dai Yong [41] and Lv Qian [28]. The growth rate shows a trend of “slow acceleration deceleration”, which is consistent with the research results of Xu Guoquan et al. [15]. The development trend of slowing down growth in the later stage is closely related to the environmental regulations and policies issued by the government. For example, in 2012, Suzhou, Huai’an, and Zhenjiang were selected as the second batch of low-carbon pilot cities in the country; in 2016, the State Council issued the “13th Five Year Plan” for controlling greenhouse gas emissions, and, since 2014, various cities in Jiangsu Province have successively introduced the “Low Carbon Development Plan”. From the perspective of spatial distribution and the agglomeration status, Yixing, Changshu and Jiangning District had the largest carbon emissions of 8,310,080 tons, 8,182,700 tons and 8,005,300 tons; Qinhuai, Gulou and Xiangcheng District had the largest carbon emissions density of 0.710 tons/km2, 0.699 tons/km2 and 0.690 tons/km2, respectively, in 2019. The built-up areas will still be the key implementation areas for future carbon reduction, with particular attention required in cities such as Suzhou, Nanjing, Wuxi, and Nantong, which require marked emissions reduction.

4.2. Analysis of Factors Affecting Carbon Emissions

Research shows that economic level and energy intensity are the core driving factors of emissions. The government should selectively introduce foreign investment, focus on the development of low-pollution emerging industries and high-tech industries, increase the upgrading and transformation of highly energy-consuming industries, strengthen the allocation of carbon-emission quotas for key emissions industries such as chemicals, building materials, steel, electricity and aviation, and establish a normalized mechanism for carbon emissions management [42]. In terms of regions, the south of Jiangsu has abundant technical resources and a flexible energy-consumption structure, but its carbon emissions mainly come from the consumption of living materials and energy generated by rapid development. Therefore, we should pay attention to the structural reform of energy consumption driven by economic development dividends and the technological spillover effect of high-level innovative talents; make full use of the dividends of economic development; promote the development of low-carbon technologies; promote the transformation of the energy-consumption structure; and encourage the technological spillover of highly skilled people, so as to accelerate the pace of carbon emissions peaking [24,43]. The industrial and energy structures of northern Jiangsu are relatively fixed, and the spillover effect of technology is not significant; the influence of the energy structure of this effect mainly comes from the consumption of productive energy. The northern region of Jiangsu should improve the efficiency of productive energy utilization under the influence of the industrial structure, accelerate the optimization and upgrading of the industrial structure, strengthen low-carbon technological cooperation with cities in central and southern Jiangsu, and promote regional integration development within Jiangsu Province [44]. Therefore, the influence of energy intensity on carbon dioxide emissions should be reduced through the development of traditional clean energy technologies when the urban energy structure is relatively fixed.

4.3. Implications

This article uses night-time lighting data on a pixel scale to estimate carbon emissions from energy consumption. For any region, not only administrative divisions, carbon emissions from energy consumption data can be obtained. However, there are issues with the saturation and spillover effects of lighting data, and the proportion of energy used for luminescence varies between regions. Some high-carbon-emission industries may only display lower night-time lighting intensity, while some low-carbon-emission areas may display higher night-time lighting intensity. In addition, some high-carbon-emission industries only operate during the day and do not operate at night, so they may not display light at night or only display lower night-light intensity, resulting in certain errors in the estimation results. In addition to DMSP-OLS and NPP-VIIRS, there are also the professional night-time light remote sensing satellite Luojia 1-01/CMOS data launched by China in 2018 [45], which have a feature recognition ability for microscopic scale research. Auxiliary data, such as Landsat data, population migration data, social media data, traffic network data, and point of interest data, should also be added to the research on carbon emissions based on night-time light data. In the future, the scope of multi-source data should be broadened, the degree of combined with big data should be improved, and carbon emissions and their associated effects at different scales should be explored. This is conducive to a comprehensive understanding of the interaction and mutual feeding mechanism among the internal elements of the human earth system, the comprehensive utilization of multi-source data and the use of complex models, which will push the research of carbon emissions to a new height and depth.

5. Conclusions

(1)
In this paper, DMSP-OLS and NPP-VIIRS global night-light data from 2000 to 2013 and from 2012 to 2019 were corrected. On the basis of these two data sources, images from 2012 to 2013 were fused and corrected, and the goodness of fit was 0.894. Finally, a long time series night-light dataset for Jiangsu Province from 2000 to 2019 was obtained. According to the statistical value of carbon emissions from energy consumption in Jiangsu Province, a carbon-emission estimation model was constructed. The phased estimation results showed that the goodness of fit of the models reached more than 0.99 with an average relative error of 7.71%, which met the estimation accuracy requirements.
(2)
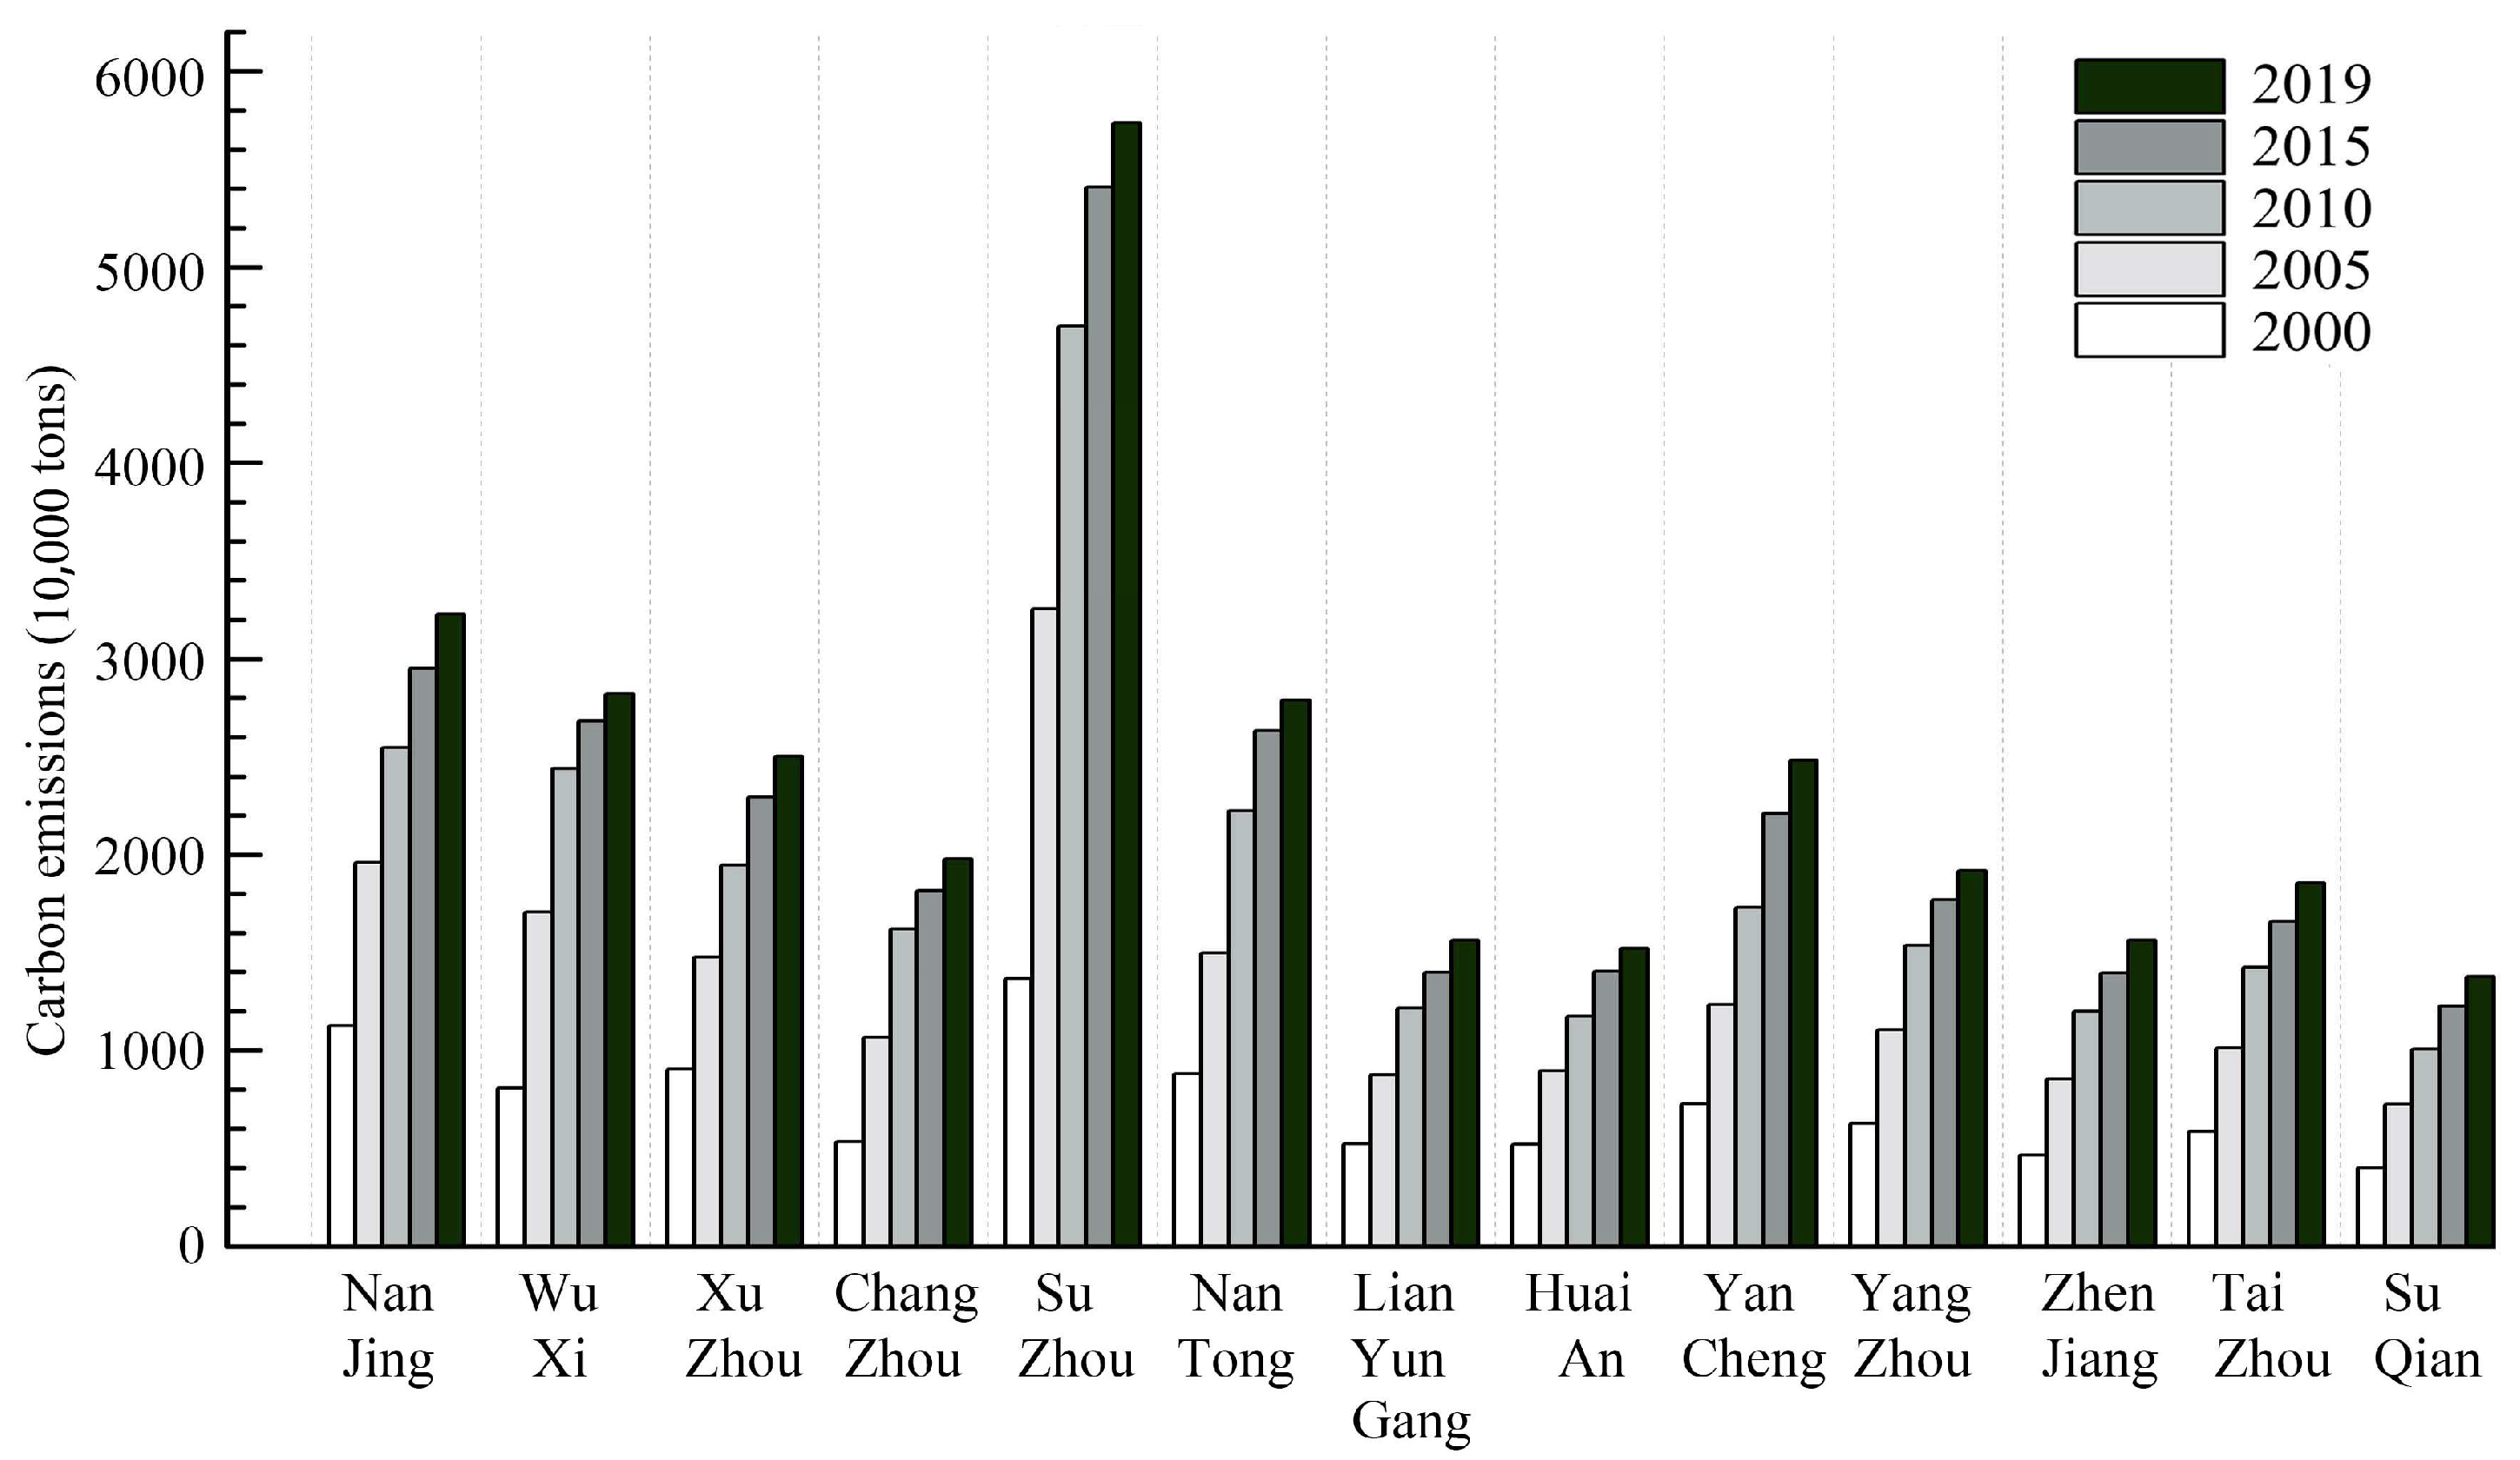
During the research period, the total carbon emissions from energy consumption in Jiangsu Province continued to grow, with a growth rate showing a “slow acceleration deceleration” upward trend. Spatially, there was a trend of expanding from point distribution to block-like continuous expansion, ultimately forming several high-density emission clusters centered around various urban areas. Overall, there was an uneven distribution pattern of “low in the north and high in the south”. Suzhou, Nanjing, Wuxi, Nantong, and other key cities had high carbon emissions.
(3)
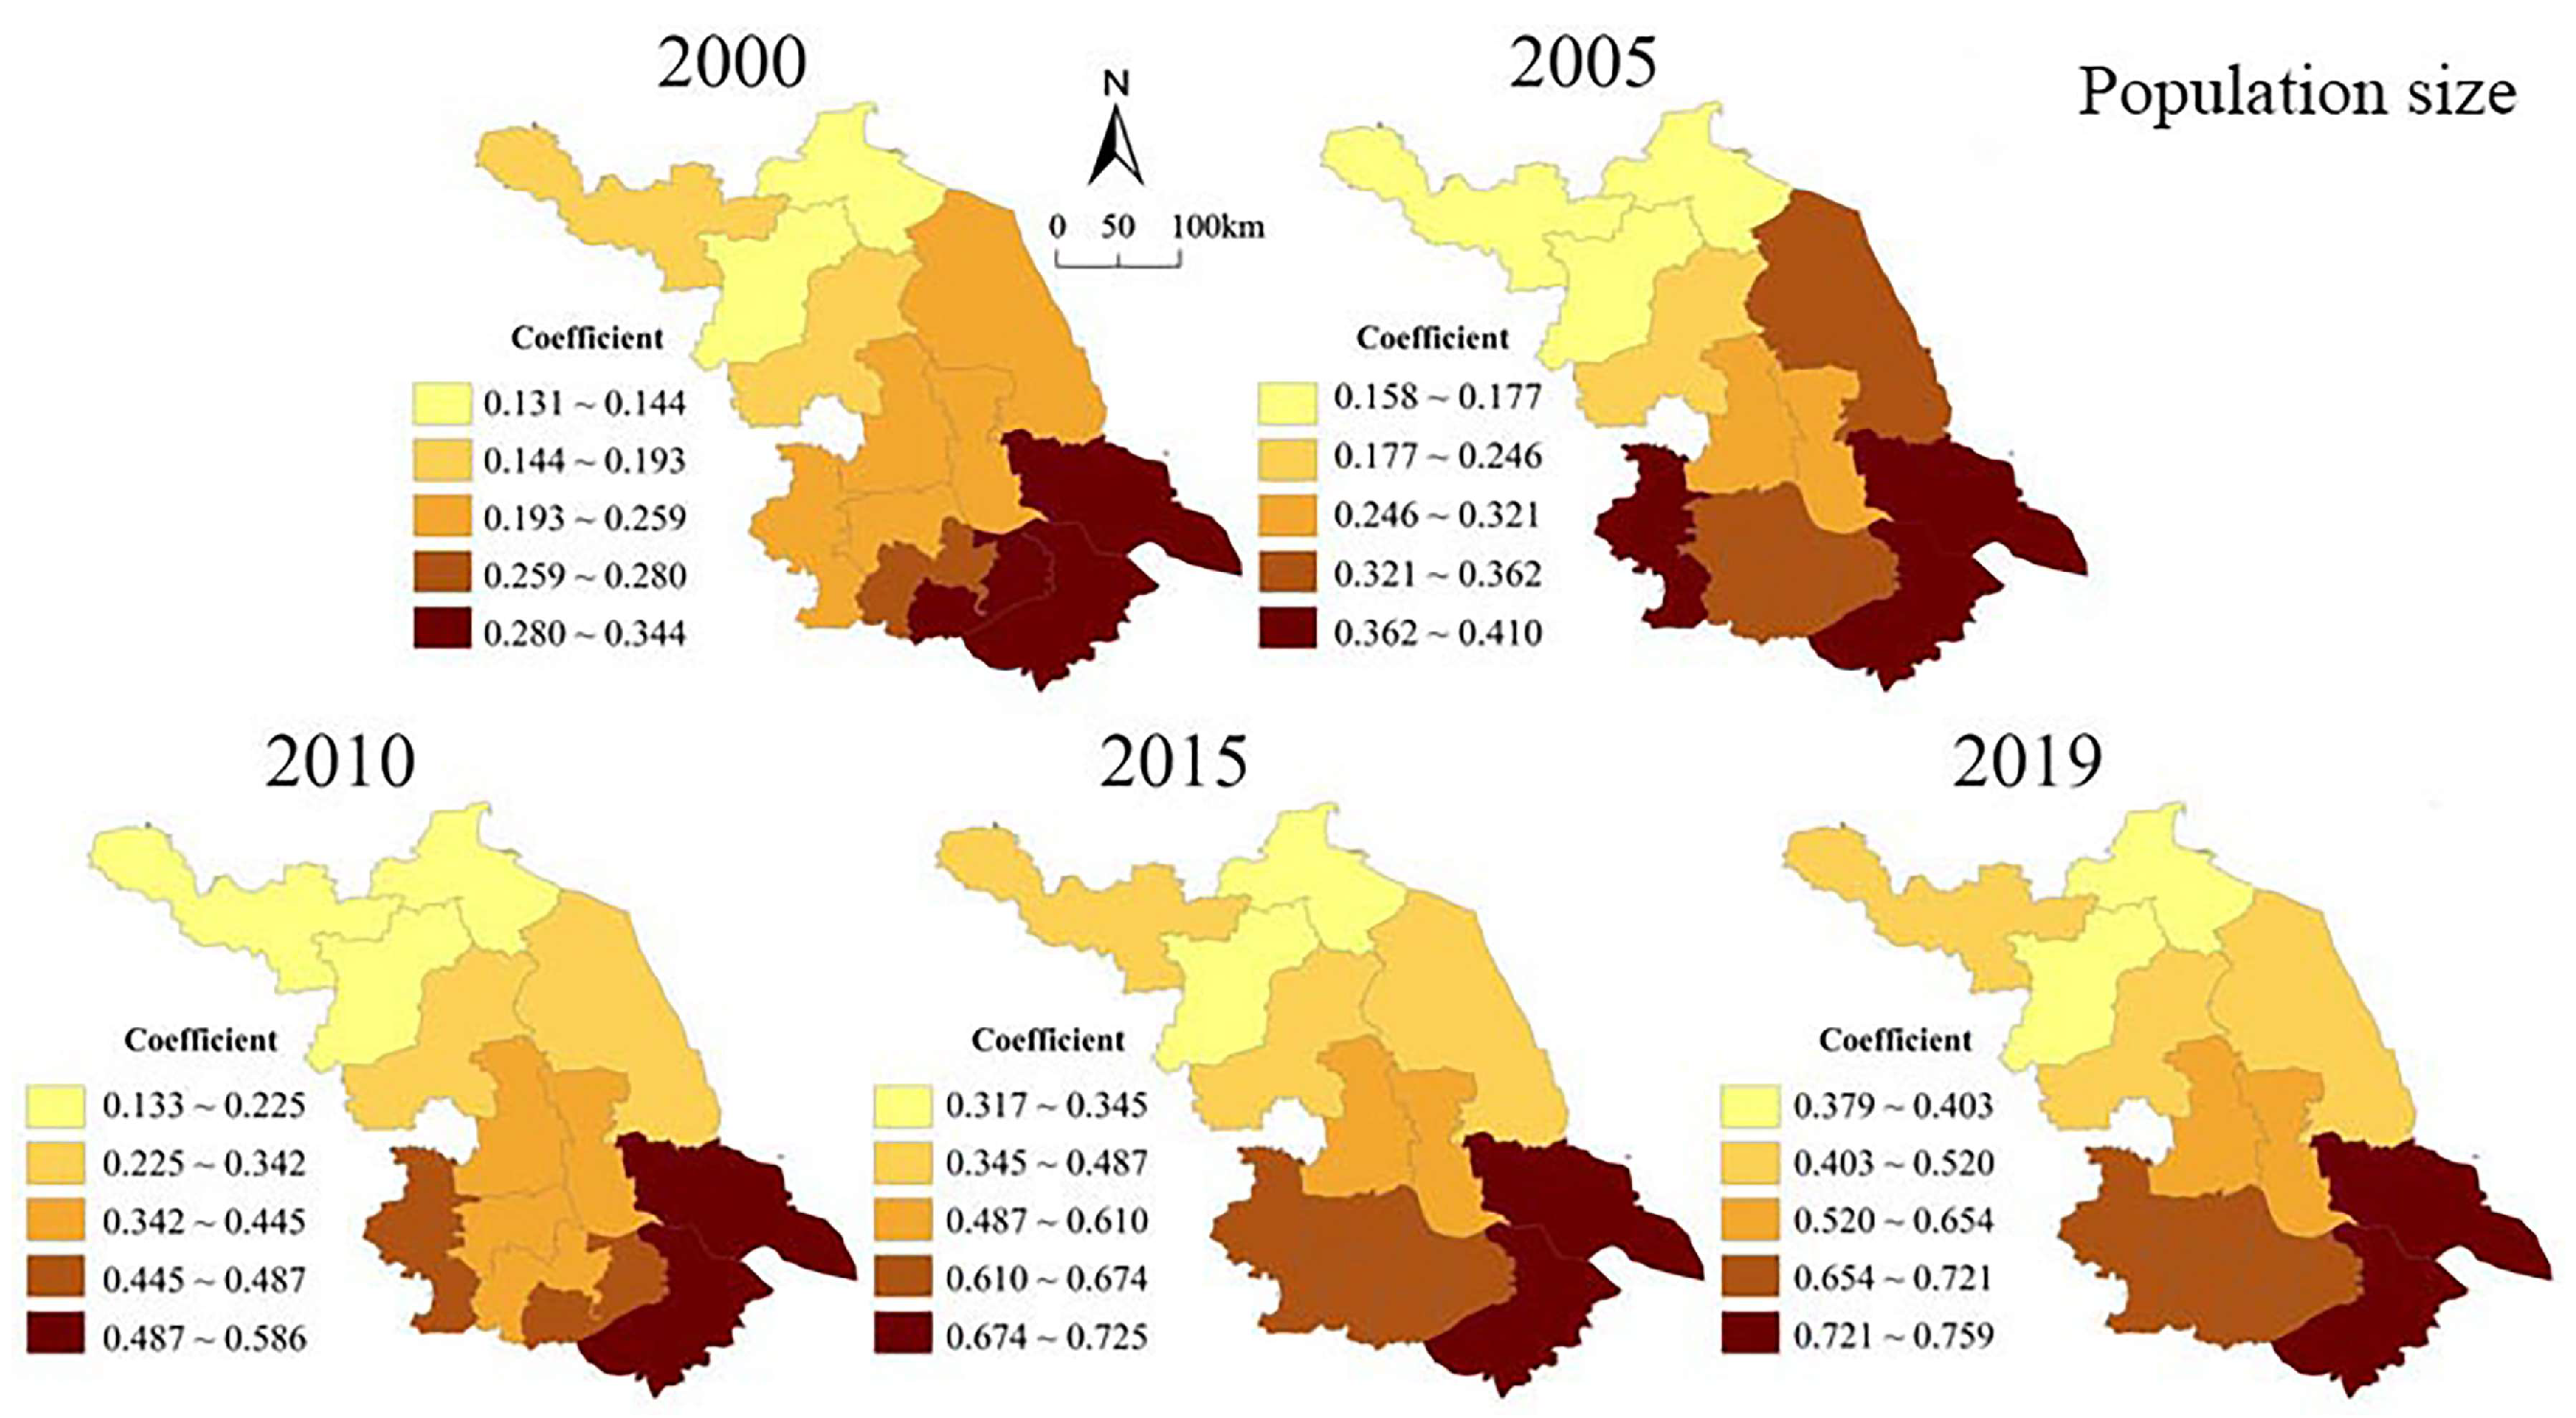
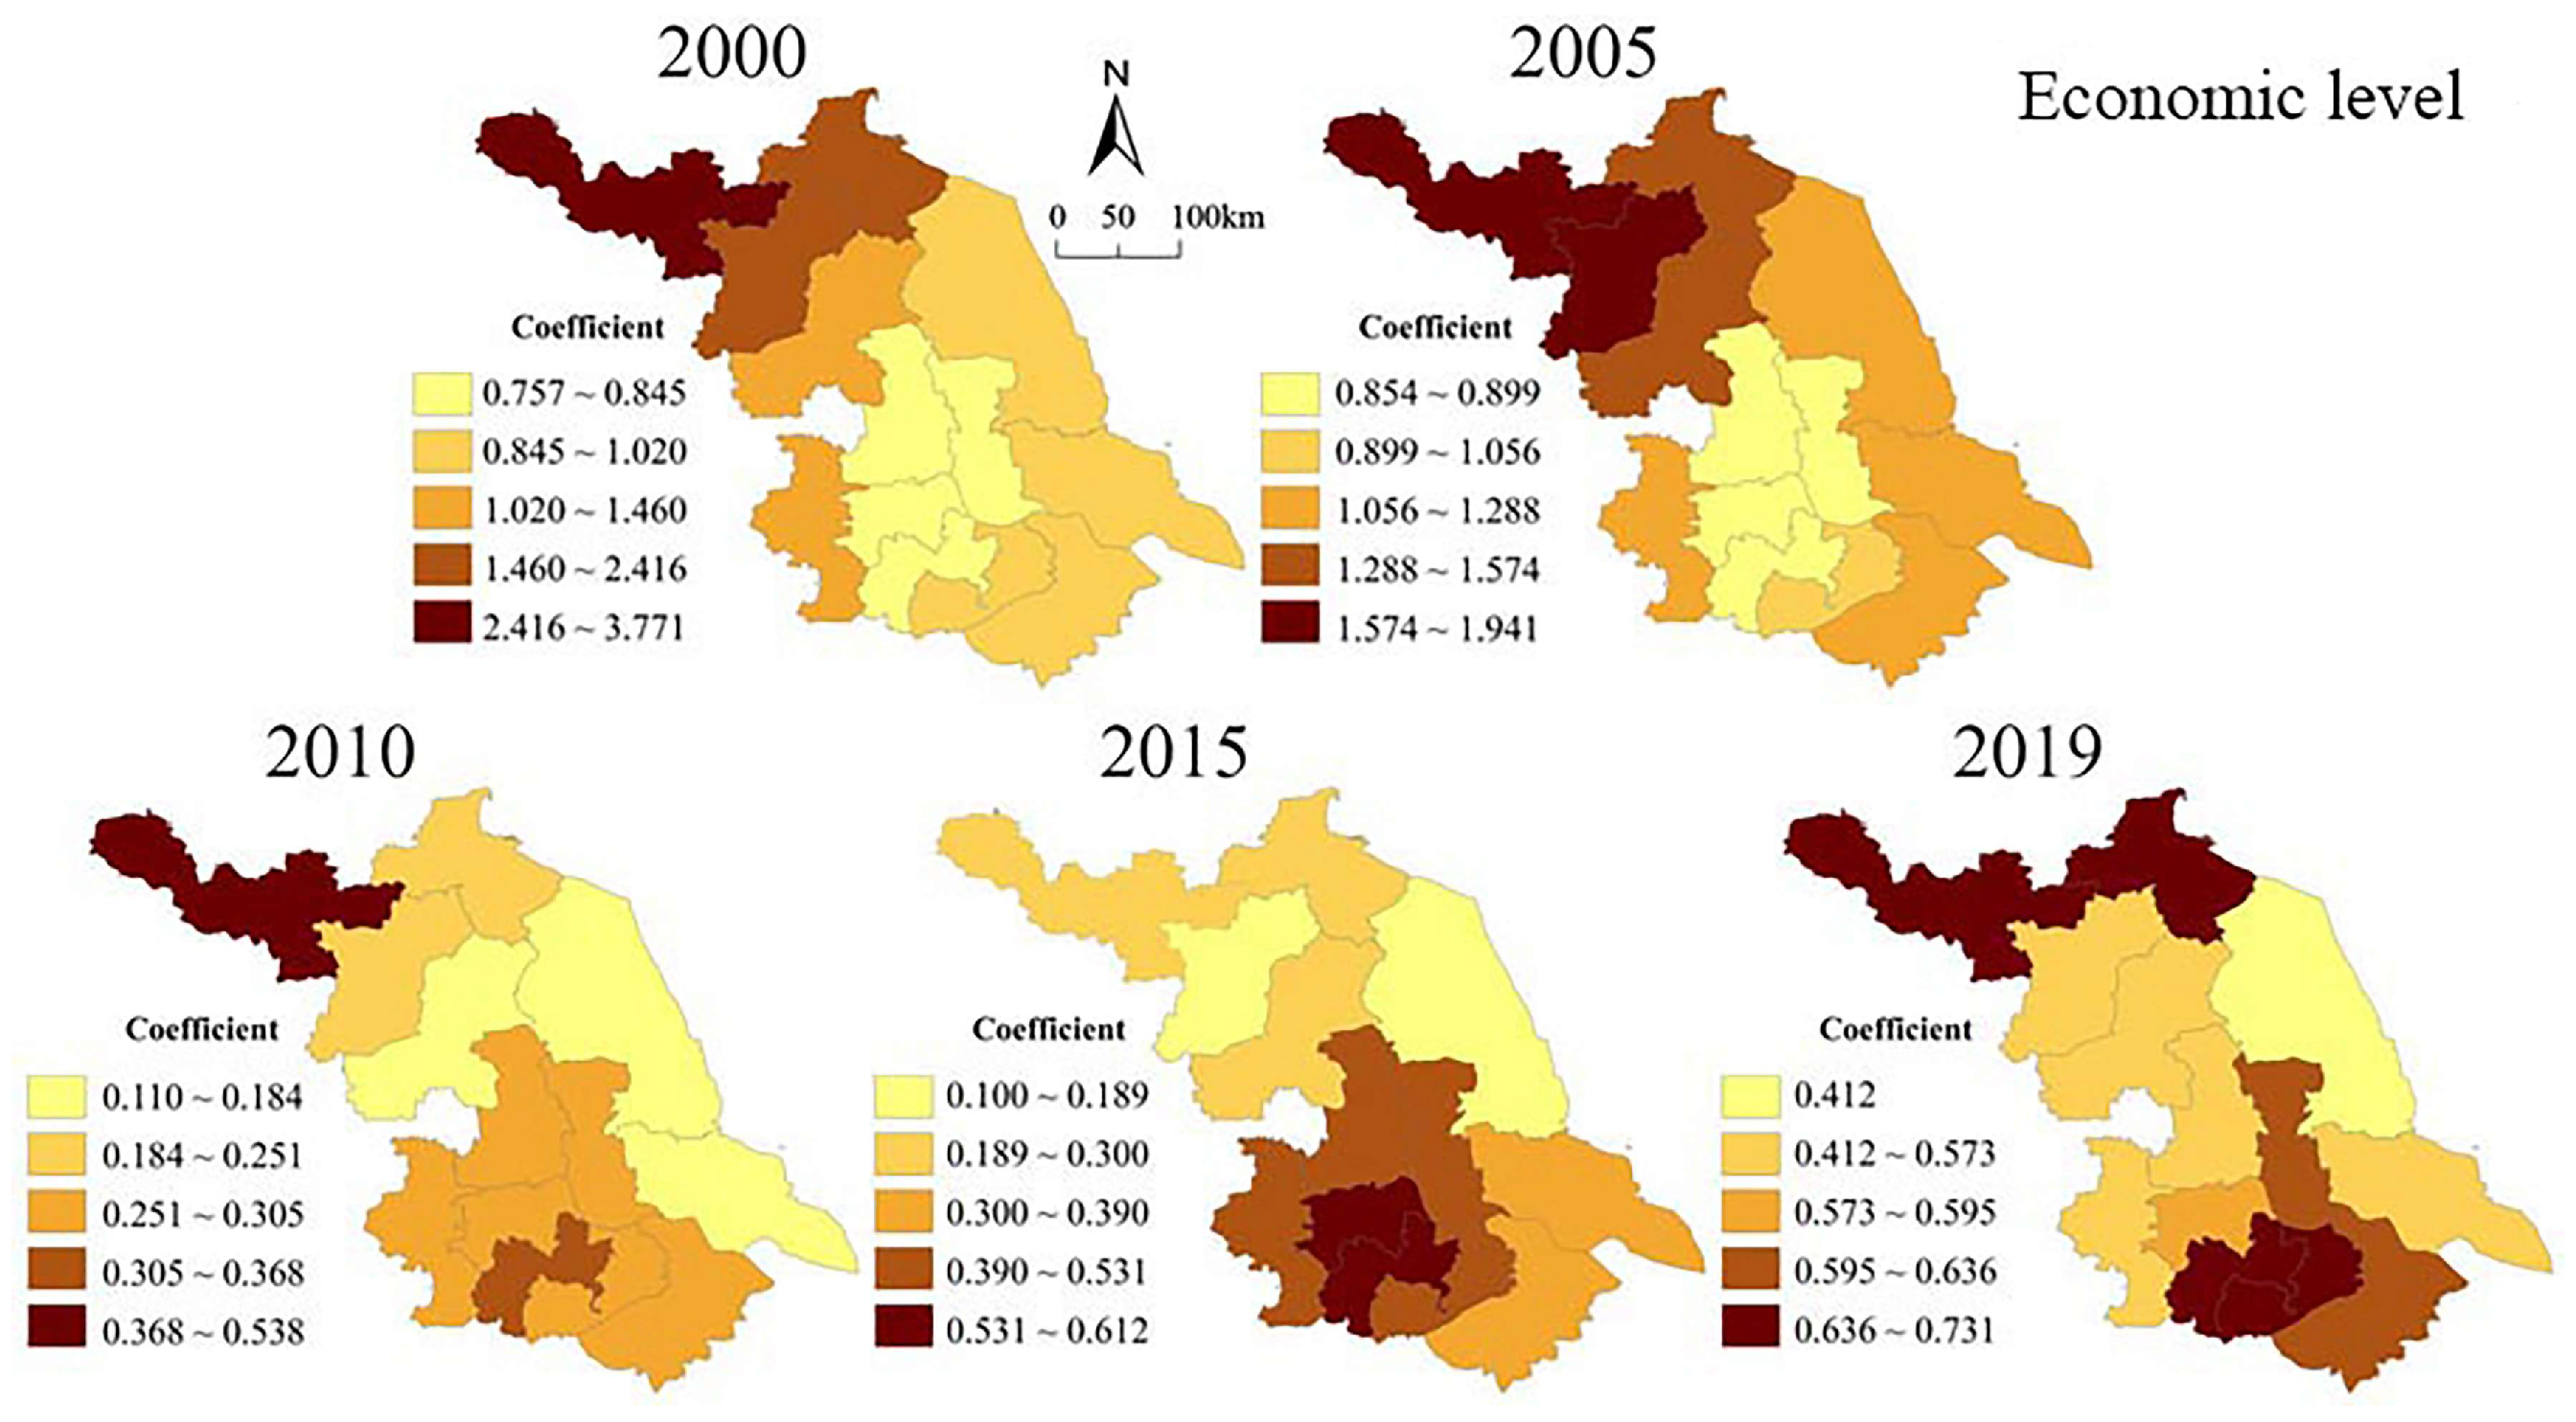
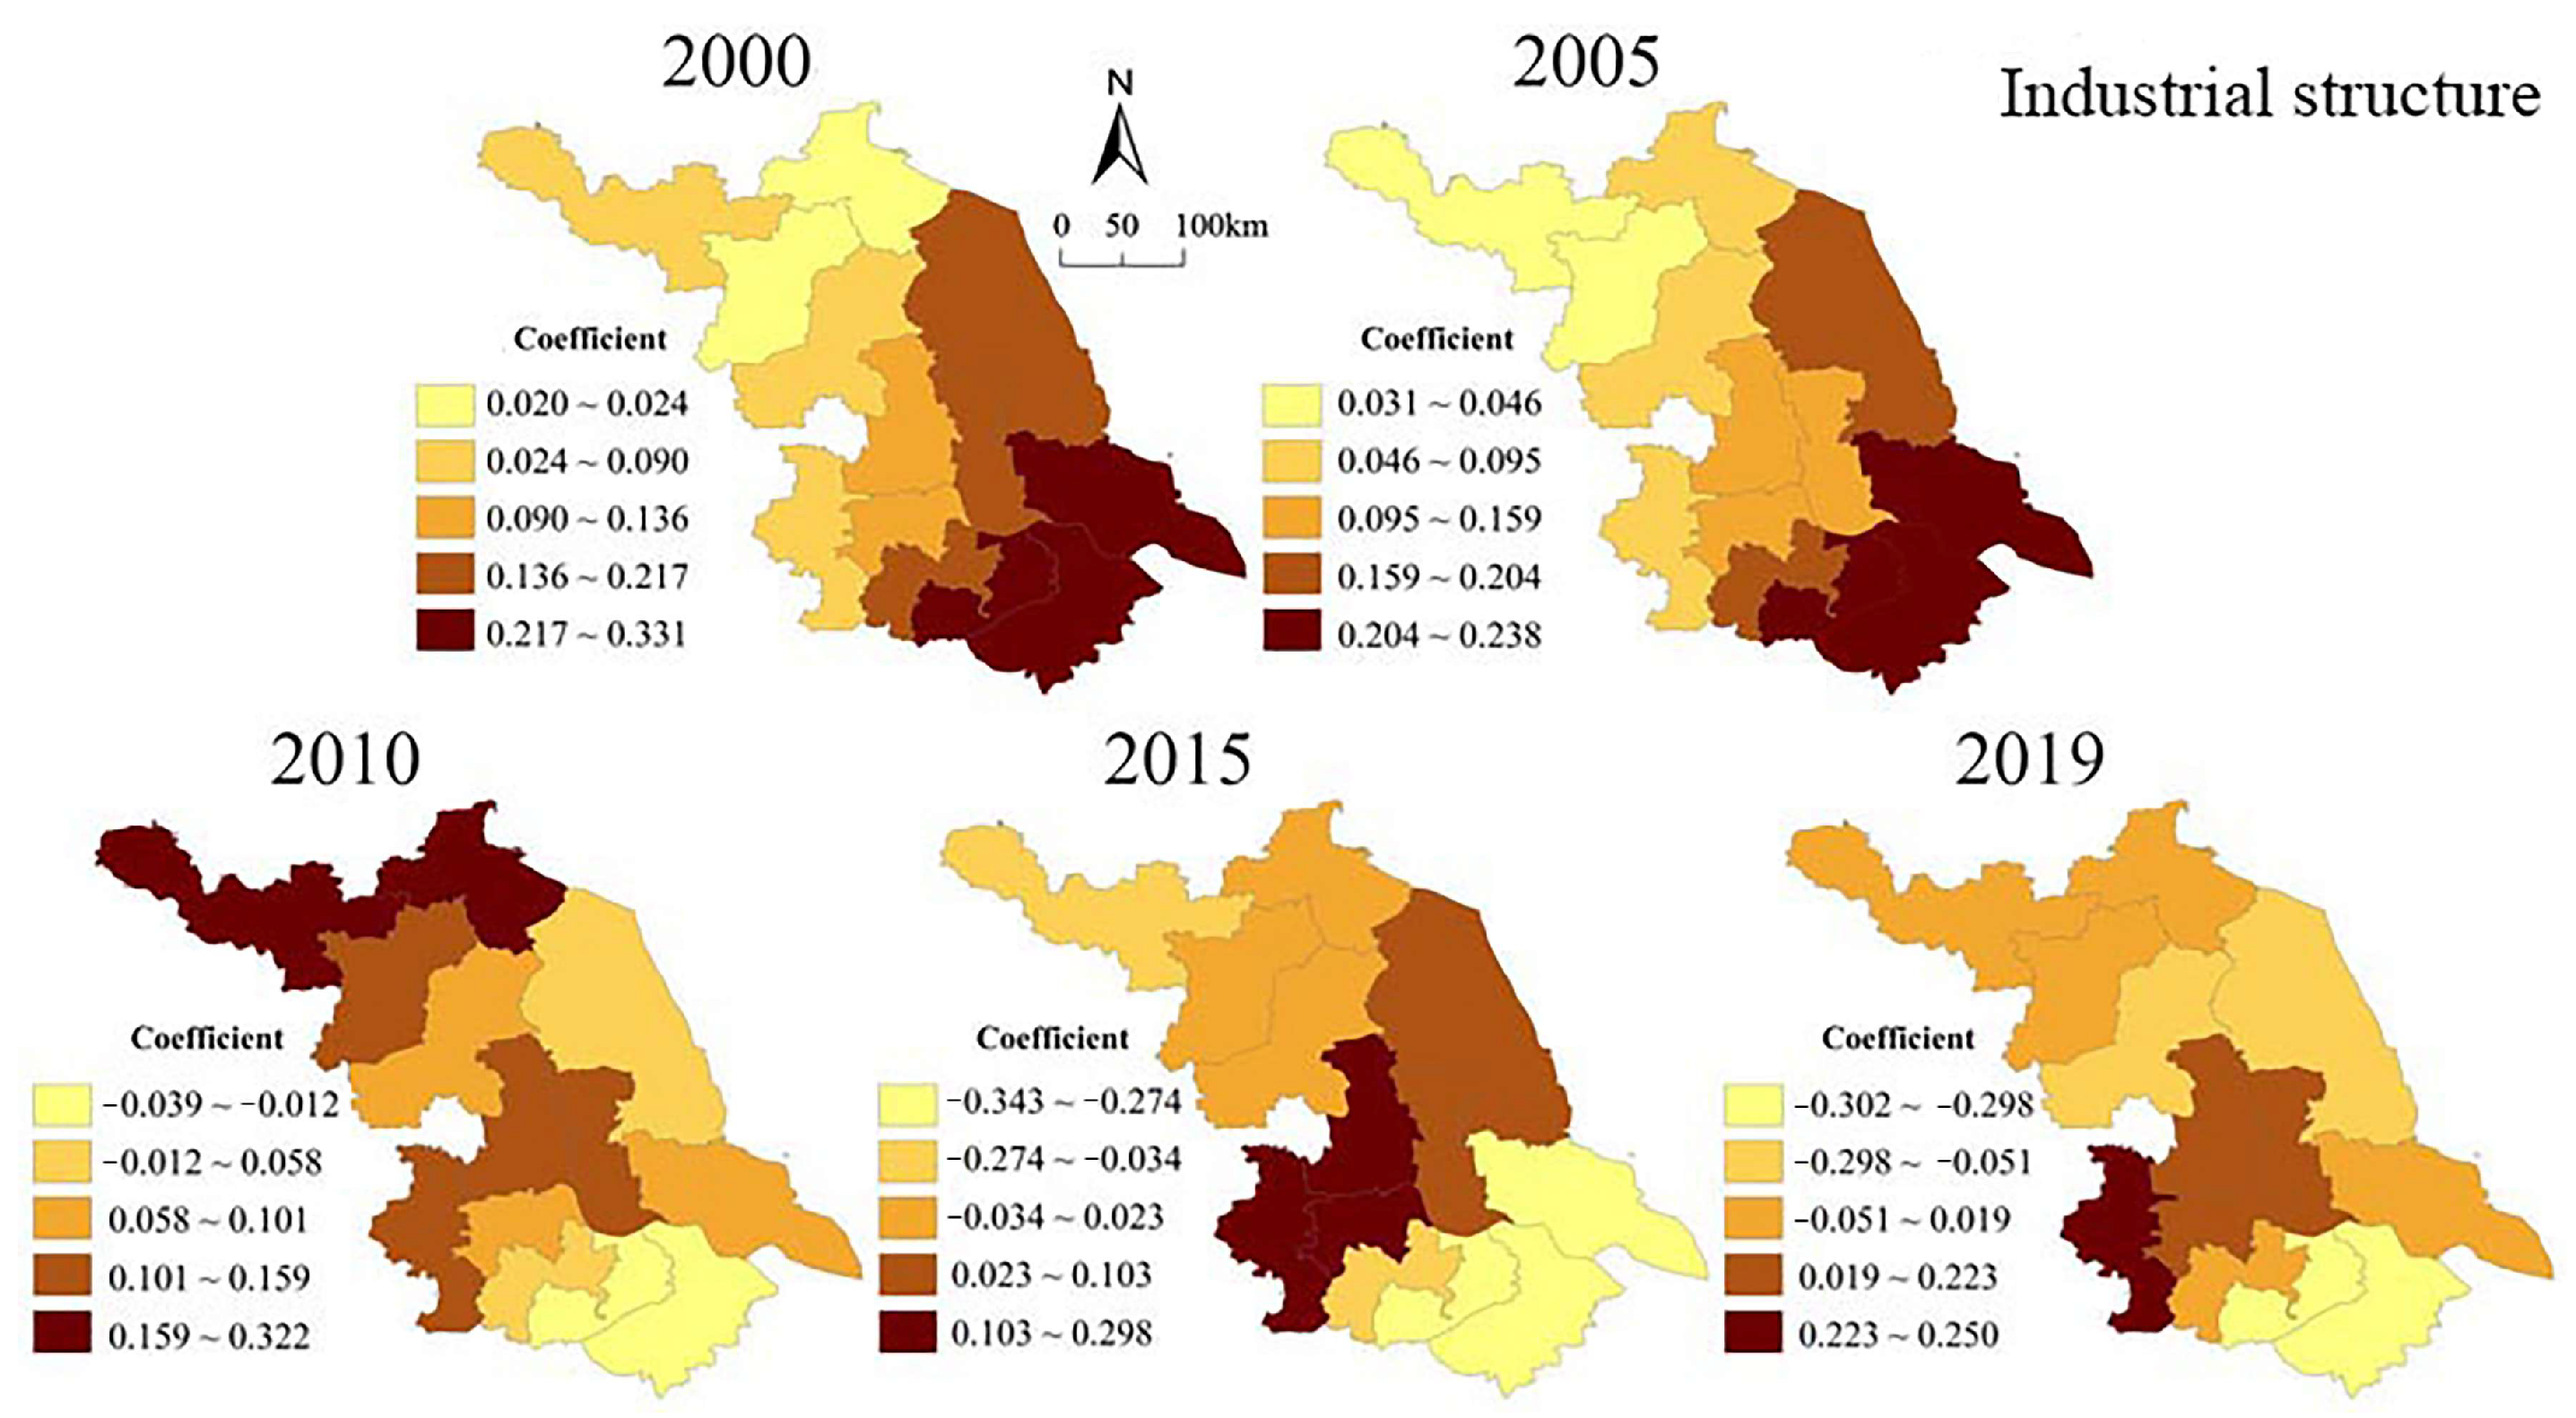
In general, population size, energy intensity, and the economic level have been the core driving factors affecting carbon emissions in Jiangsu Province in the past 20 years. The impact of population size and energy intensity is on the rise, while the driving force of economic level is on the decline. Meanwhile, urbanization rate, industrial structure, and foreign investment have weak explanatory power regarding carbon emissions. Comparatively speaking, carbon emissions in central and southern Jiangsu are more strongly affected by population, economy, energy intensity, and other factors than in northern Jiangsu, where economic development is lagging slightly behind. Meanwhile, carbon emissions in northern Jiangsu are more strongly affected by the industrial structure, the urbanization rate, and other factors than those in southern Jiangsu, but the impact of population and the economy on carbon emissions in northern Jiangsu has also gradually increased since 2000.

Author Contributions

All the authors contributed significantly to this study. H.M., writing—original draft, methodology, conceptualization and software; X.Z., funding acquisition, methodology, resources and conceptualization; X.D. and K.D., writing—review and editing. All authors have read and agreed to the published version of the manuscript.

Funding

This research was financially supported by the Fundamental Research Funds for the Central Universities (Project Grant No. B230207054 and No. B210202163).

Data Availability Statement

The data that support the findings of this study are available from the corresponding author, upon reasonable request.

Conflicts of Interest

The authors declare no conflict of interest.

References

  1. Shi, G.; Yan, H.; Zhang, W.; Dodson, J.; Heijnis, H.; Burrows, M. Rapid warming has resulted in more wildfires in northeastern Australia. Sci. Total Environ. 2021, 771, 144888. [Google Scholar] [CrossRef]
  2. Valone, T.F. Linear Global Temperature Correlation to Carbon Dioxide Level, Sea Level, and Innovative Solutions to a Projected 6 °C Warming by 2100. J. Geosci. Environ. Prot. 2021, 9, 84–135. [Google Scholar] [CrossRef]
  3. Weitzman, M.L. Book Review—A Review of William Nordhaus’ the Climate Casino: Risk, Uncertainty, and Economics for a Warming World. Rev. Environ. Econ. Policy 2015, 9, 145–156. [Google Scholar] [CrossRef]
  4. Nepal, R.; Paija, N. A multivariate time series analysis of energy consumption, real output and pollutant emissions in a developing economy: New evidence from Nepal. Econ. Model. 2019, 77, 164–173. [Google Scholar] [CrossRef]
  5. Qian, Y.; Zhao, J.; Lyu, Y.; Liu, Y.; Tian, J.; Chen, L. Uncovering the roadmap of decoupling economic growth and CO2 emissions targeting energy-resource-emission-intensive industrial parks located nearby large river: Practices and implications from China. J. Clean. Prod. 2023, 393, 136306. [Google Scholar] [CrossRef]
  6. Wang, S.; Liu, Y.; Fang, C. Review of energy-related CO2 emission in response to climate change. Prog. Geogr. 2015, 34, 151–164. [Google Scholar]
  7. Wang, W.; Liu, L.; Liao, H.; Wei, Y. The impact of urbanization on carbon emissions: Analysis of panel data from 158 cities in China. Acta Ecol. Sin. 2020, 40, 7897–7907. [Google Scholar]
  8. Li, X.; Zhang, Q. Factors affecting carbon emission from energy consumption in Tianjin. Arid Zone Res. 2019, 36, 997–1004. [Google Scholar]
  9. Zhang, Y.; Pan, J. Spatio-temporal simulation and differentiation pattern of carbon emissions in China based on DMSP/OLS nighttime light Data. China Environ. Sci. 2019, 39, 1436–1446. [Google Scholar]
  10. Chao, J.; Zhao, X.; Li, T.; Qing, Y. Comparative analysis on the dynamic characteristics of scale structure among three urban agglomerations in the Yangtze River Economic Belt based on multi-source nighttime light data. Geogr. Geo-Inf. Sci. 2020, 36, 44–51. [Google Scholar]
  11. Lv, Q.; Liu, H.; Wang, J.; Liu, H.; Shang, Y. Multiscale analysis on spatiotemporal dynamics of energy consumption CO2 emissions in China: Utilizing the integrated of DMSP-OLS and NPP-VIIRS nighttime light datasets. Sci. Total Environ. 2020, 703, 134394. [Google Scholar] [CrossRef] [PubMed]
  12. Welch, R. Monitoring urban population and energy utilization patterns from satellite Data. Remote Sens. Environ. 1980, 9, 1–9. [Google Scholar] [CrossRef]
  13. Elvidge, C.; Zhizhin, M.; Ghosh, T.; Hsu, F.; Taneja, J. Annual time series of global VIIRS nighttime lights derived from monthly averages: 2012 to 2019. Remote Sens. 2021, 13, 922. [Google Scholar] [CrossRef]
  14. Chen, J.; Gao, M.; Cheng, S.; Liu, X.; Hou, W.; Song, M.; Li, D.; Fan, W. China’s city-level carbon emissions during 1992–2017 based on the inter-calibration of nighttime light data. Sci. Rep. 2021, 11, 3323. [Google Scholar] [CrossRef] [PubMed]
  15. Xu, G.; Cai, Z.; Feng, S. Spatial and temporal differences and influencing factors of carbon emissions based on the analysis of the two-stage LMDI model—An empirical study on Jiangsu Province. Soft Sci. 2021, 35, 107–113. [Google Scholar]
  16. Dong, K.; Jiang, H.; Sun, R.; Dong, X. Driving forces and mitigation potential of global CO2 emissions from 1980 through 2030: Evidence from countries with different income levels. Sci. Total Environ. 2019, 649, 335–343. [Google Scholar] [CrossRef] [PubMed]
  17. Zhao, J.; Ji, G.; Yue, Y.; Lai, Z.; Chen, Y.; Yang, D.; Yang, X.; Wang, Z. Spatio-temporal dynamics of urban residential CO2 emissions and their driving forces in China using the integrated two nighttime light datasets. Appl. Energy 2019, 235, 612–624. [Google Scholar] [CrossRef]
  18. Lv, T.; Zeng, C.; Liu, Z.; Yang, J. Driving factors and spillover effects of CO2 emissions from the perspective of spatial interaction: A case study of 98 countries worldwide. Acta Ecol. Sin. 2020, 40, 8974–8987. [Google Scholar]
  19. Du, H.; Wei, W.; Zhang, X.; Ji, X. Spatio-temporal evolution and influencing factors of energy-related carbon emissions in the Yellow River Basin: Based on the DMSP/OLS and NPP/VIIRS nighttime light data. Geogr. Res. 2021, 40, 2051–2065. [Google Scholar]
  20. Lian, Y. Economic hierarchy and environmental pollution: An environmental Kuznets curve study based on carbon emissions. Stat. Decis. 2021, 37, 146–150. [Google Scholar]
  21. Wang, K.; Tang, X.; Gan, C.; Liu, H. Temporal-spatial evolution and influencing factors of carbon emission intensity of China’s service industry, China Population. Res. Environ. 2021, 31, 23–31. [Google Scholar]
  22. Raupach, M.; Rayner, P.; Paget, M. Regional variations in spatial structure of nightlights, population density and fossil-fuel CO2 emissions. Energy Policy 2010, 38, 4756–4764. [Google Scholar] [CrossRef]
  23. Shi, K.; Chen, Y.; Yu, B.; Xu, T.; Chen, Z.; Liu, R.; Li, L.; Wu, J. Modeling spatiotemporal CO2 (carbon dioxide) emission dynamics in China from DMSP-OLS nighttime stable light data using panel data analysis. Appl. Energy 2016, 168, 523–533. [Google Scholar] [CrossRef]
  24. Su, Y.; Chen, X.; Li, Y.; Liao, J.; Ye, Y.; Zhang, H.; Huang, N.; Kuang, Y. China’s 19-year city-level carbon emissions of energy consumptions, driving forces and regionalized mitigation guidelines. Renew. Sustain. Energy Rev. 2014, 35, 231–243. [Google Scholar] [CrossRef]
  25. Meng, L.; Graus, W.; Worrell, E.; Huang, B. Estimating CO2 (carbon dioxide) emissions at urban scales by DMSP/OLS (Defense Meteorological Satellite Program’s Operational Linescan System) nighttime light imagery: Methodological challenges and a case study for China. Energy 2014, 71, 468–478. [Google Scholar] [CrossRef]
  26. Hu, Y.; Qiao, W.; Wan, Y.; He, T.; Chai, Y.; Bi, Y. Comprehensive evaluation and spatial distinction of land use efficiency in county area of Jiangsu Province. Econ. Geogr. 2020, 40, 186–195. [Google Scholar]
  27. Qiao, X.; Gu, Y.; Zhou, C.; Huang, X.; Hu, T. The impact of urban expansion on net primary productivity in the Taihu Lake basin based on nighttime light images. Acta Ecol. Sin. 2018, 38, 5883–5893. [Google Scholar]
  28. Lv, Q.; Liu, H. Multiscale spatio-temporal characteristics of carbon emission of energy consumption in Yellow River Basin based on the nighttime light datasets. Econ. Geogr. 2020, 40, 12–21. [Google Scholar]
  29. Wu, K.; Wang, X. Aligning pixel values of DMSP and VIIRS nighttime light images to evaluate urban dynamics. Remote Sens. 2019, 11, 1463. [Google Scholar] [CrossRef] [Green Version]
  30. Shi, K.; Yu, B.; Huang, Y.; Hu, Y.; Yin, B.; Chen, Z.; Chen, L.; Wu, J. Evaluating the ability of NPP-VIIRS nighttime light data to estimate the gross domestic product and the electric power consumption of China at multiple scales: A comparison with DMSP-OLS data. Remote Sens. 2014, 6, 1705–1724. [Google Scholar] [CrossRef] [Green Version]
  31. Su, Y.; Chen, X.; Ye, Y.; Wu, Q.; Zhang, H.; Huang, N.; Kuang, Y. The characteristics and mechanisms of carbon emissions from energy consumption in China using DMSP/OLS night light imageries. Acta Geogr. Sin. 2013, 68, 1513–1526. [Google Scholar]
  32. Henriques, S.; Borowiecki, K. The drivers of long-run CO2 emissions in Europe, North America and Japan since 1800. Energy Policy 2017, 101, 537–549. [Google Scholar] [CrossRef]
  33. González, P.; Landajo, M.; Presno, M. The driving forces behind changes in CO2 emission levels in EU-27. Differences between member states. Environ. Sci. Policy 2014, 38, 11–16. [Google Scholar] [CrossRef]
  34. Liu, X.; Ning, X.; Wang, H.; Wang, C.; Zhang, H.; Meng, J. A rapid and automated urban boundary extraction method based on nighttime light data in China. Remote Sens. 2019, 11, 1109–1126. [Google Scholar] [CrossRef] [Green Version]
  35. Pan, J.; Li, J. Spatiotemporal dynamics of electricity consumption in China. Appl. Spat. Anal. Policy 2019, 12, 395–422. [Google Scholar] [CrossRef]
  36. Wang, L.; Zhang, N.; Deng, H.; Wang, P.; Yang, F.; Qu, J.; Zhou, X. Monitoring urban carbon emissions from energy consumption over China with DMSP/OLS nighttime light observations. Theor. Appl. Climatol. 2022, 149, 983–992. [Google Scholar] [CrossRef]
  37. Liu, Q.; Wu, R.; Zhang, W.; Li, W.; Wang, S. The varying driving forces of PM2. 5 concentrations in Chinese cities: Insights from a geographically and temporally weighted regression model. Environ. Int. 2020, 145, 106168. [Google Scholar] [CrossRef]
  38. Huang, H.; Zhu, N. Study on Spatiotemporal Characteristics of the Impacting Factors of Agricultural Carbon Emissions Based on the GTWR Model: Evidence from the Yellow River Basin, China. Nat. Environ. Pollut. Technol. 2022, 21, 607–615. [Google Scholar] [CrossRef]
  39. Shen, Y.; Wang, C.; Gao, C.; Ding, L. Spatio-temporal distribution and its influencing factors of carbon emissions in economic zone of Zhejiang Bay Area based on urbanization. J. Nat. Res. 2020, 35, 329–342. [Google Scholar]
  40. Huang, B.; Wu, B.; Barry, M. Geographically and temporally weighted regression for modeling spatio-temporal variation in house prices. Int. J. Geogr. Inf. Sci. 2010, 24, 383–401. [Google Scholar] [CrossRef]
  41. Dai, Y.; Chen, X.; Wang, M. Research on kuznets effect of carbon emission: Taking Jiangsu Province as an example. Stat. Decis. 2020, 36, 75–78. [Google Scholar]
  42. Wang, S.; Xie, Z.; Wang, Z. The spatiotemporal pattern evolution and influencing factors of CO2 emissions at the county level of China. Acta Geogr. Sin. 2021, 76, 3103–3118. [Google Scholar]
  43. Mala, P.; Palanivel, M.; Priyan, S.; Jirawattanapanit, A.; Rajchakit, G.; Kaewmesri, P. Sustainable supply chain system for defective products with different carbon emission strategies. Sustainability 2022, 14, 16082. [Google Scholar] [CrossRef]
  44. Li, J.; Huang, X.; Chuai, X.; Sun, S. Spatio-temporal characteristics and influencing factors of carbon emissions efficiency in the Yangtze River Delta region. Resour. Environ. Yangtze Basin 2020, 29, 1486–1496. [Google Scholar]
  45. Cui, Y.; Zha, H.; Jiang, L.; Zhang, M.; Shi, K. Luojia 1-01 Data Outperform Suomi-NPP VIIRS Data in Estimating CO2 Emissions in the Service, Industrial, and Urban Residential Sectors. IEEE Geosci. Remote Sens. 2023, 25, 3000905. [Google Scholar] [CrossRef]
Figure 1. Evolution characteristics of grid-scale carbon emissions.
Land 12 01369 g001
Figure 2. Carbon emissions at the municipal level in Jiangsu Province.
Land 12 01369 g002
Figure 3. Carbon emissions type at the county level in Jiangsu Province.
Land 12 01369 g003
Figure 4. Spatiotemporal variation pattern of the coefficient of the population size factor of carbon emissions.
Land 12 01369 g004
Figure 5. Spatiotemporal variation pattern of the coefficient of the economic level factor of carbon emissions.
Land 12 01369 g005
Figure 6. Spatiotemporal variation pattern of the coefficient of the industrial structure factor of carbon emissions.
Land 12 01369 g006
Figure 7. Spatiotemporal variation pattern of the coefficient of the foreign investment factor of carbon emissions.
Land 12 01369 g007
Figure 8. Spatiotemporal variation pattern of the coefficient of the energy intensity factor of carbon emissions.
Land 12 01369 g008
Figure 9. Spatiotemporal variation pattern of the coefficient of the urbanization rate factor of carbon emissions.
Land 12 01369 g009
Table 1. Fitting parameters of DMSP-OLS and NPP-VIIRS in 2012 and 2013.
ModelFitting FunctionabcR2
Lineary = ax + b6.064100,313.024 0.887
Secondaryy = ax + bx2 + c0.00002723.971123,719.6270.894
Powery = axb1189.4890.532 0.737
Indexy = aebx135,562.3240.0000203 0.768
Table 2. Coefficients of carbon emissions of energy consumption.
Energy TypeConversion Standard
Coal Coefficient
Carbon-Emission
Coefficient
Raw coal0.7143 t·t−10.7559
Coke0.9714 t·t−10.8550
Crude oil1.4286 t·t−10.5857
Gasoline1.4714 t·t−10.5538
Kerosene1.4714 t·t−10.5714
Diesel oil1.4571 t·t−10.5921
Fuel oil1.4286 t·t−10.6185
Liquefied petroleum gas1.7143 t·t−10.5042
Natural gas1.33 × 10−3 t·m−30.4483
Table 3. Simulation regression parameters of carbon emissions from 2000 to 2019.
YearFitting FunctionR2
2000–2003y = 55.047707x0.998
2004–2011y = 90.771864x0.991
2012–2019y = 84.182303x0.994
Table 4. Index of model evaluation.
ModelOLSGWRGTWR
R20.9080.9810.997
Adjusted R20.9010.9800.996
Sum of squared residuals0.8790.1840.034
Sigma/0.0270.011
AICc−727.222−1034.620−1368.432
Table 5. GTWR model estimation results.
VariableMinimumMaximumMedianMean
Constant term−0.7513−0.0217−0.3235−0.3415
Population size0.07690.75910.36570.4093
Economic level−0.13423.77110.58630.7473
Industrial structure−0.35250.42590.11470.0867
Foreign investment−1.48180.39860.07490.0314
Energy intensity−0.04483.60390.36900.6783
Urbanization rate−0.22680.71960.09570.1628
Disclaimer/Publisher’s Note: The statements, opinions and data contained in all publications are solely those of the individual author(s) and contributor(s) and not of MDPI and/or the editor(s). MDPI and/or the editor(s) disclaim responsibility for any injury to people or property resulting from any ideas, methods, instructions or products referred to in the content.

