Article

Research on the Evolution Characteristics and Dynamic Simulation of Habitat Quality in the Southwest Mountainous Urban Agglomeration from 1990 to 2030

1
College of Geography and Tourism, Chongqing Normal University, Chongqing 401331, China
2
National Earth System Science Data Center, Beijing 100101, China
3
Chongqing Geographic Information and Remote Sensing Application Center, Chongqing 401331, China
4
College of Land Science and Technology, China Agricultural University, Beijing 100101, China
*
Author to whom correspondence should be addressed.
Land 2023, 12(8), 1488; https://doi.org/10.3390/land12081488
Submission received: 20 June 2023 / Revised: 17 July 2023 / Accepted: 24 July 2023 / Published: 27 July 2023

Abstract

:
In the context of promoting high-quality development of mountainous urban areas, it is of great significance to explore the evolutionary trajectory of habitat quality in the future based on policy-driven backgrounds, particularly for the protection of the Western mountainous ecosystem. This study takes the Chongqing metropolitan area, a typical southwestern mountainous city, as the study area. Based on land use data from 1990 to 2020, the study combines the InVEST and PLUS models, considering the constraints imposed by urban construction planning and ecological control policies, to investigate the spatiotemporal variations of habitat quality from 1990 to 2030. The findings are as follows: (1) From 1990 to 2020, there was a significant decrease in cultivated land area in the study area, while forestland and unused land showed a declining trend. Conversely, built-up land, grassland, and water bodies exhibited an increasing trend. In the land use simulation for 2030, under the scenarios of natural growth and ecological protection, the cultivated land area further decreased, while forestland and grassland received a certain degree of protection. In the scenario of development, a large amount of cultivated land was converted into built-up land. (2) From 1990 to 2030, significant overall habitat quality changes were observed among different regions within the study area. Except for Nanchuan District and Qijiang District, other administrative regions experienced a certain degree of decline in habitat quality. The distribution of habitat quality exhibited significant spatial heterogeneity. The low-value habitat areas were centered in the middle of the metropolitan area and gradually expanded outward. The high-value habitat areas were concentrated in the study area, including the Huaying Mountain range and other mountainous ecological corridor regions. (3) Habitat quality in the study area showed a decreasing trend with an increasing slope gradient. With the development of urbanization, habitat quality degradation gradually spread to high-altitude and steep-slope areas. (4) The expansion of built-up land is the main cause of habitat degradation in the study area. From 1990 to 2030, against the background of development strategies in the study area, the expansion of built-up land encroached upon cultivated land and forestland. In the habitat quality prediction for 2030, habitat degradation in the region will continue to intensify. This study provides scientific references and the basis for promoting regional sustainable land use and ecological conservation.

1. Introduction

Ecosystem services and biodiversity are crucial for the survival of humans [1]. Habitat quality represents the ability of ecosystems to support the survival and sustainable development of species [2], and it is an important indicator for measuring regional biodiversity and ecosystem service values [3]. In the process of rapid urbanization globally, intense land transformation has affected the energy and material flow cycles between habitat units. The encroachment of urban construction areas on natural ecological landscapes directly leads to a decrease in biodiversity and a reduction in ecosystem service values in the original habitats, which directly impacts the well-being of local residents [4,5]. There is a close relationship between land use changes and habitat quality changes, as human modifications to land use directly affect changes in regional habitat quality [6,7,8]. Therefore, in order to achieve goals such as promoting biodiversity conservation, ecosystem restoration and protection, and strengthening the sustainable use of natural resources in the Millennium Ecosystem Assessment [9], it is important to explore the spatial and temporal dynamics of land use patterns and habitat quality in regions in policy-driven contexts. This will help understand the dynamic impacts of land use changes on regional habitat quality, adjust land planning and ecological conservation strategies, balance the coordinated development among society, economy, and environment, and promote the construction of a green development system and the advancement of high-quality social development.
Land use change is a primary driving factor for ecosystem services and their associated impacts [10,11]. Simulating future land use patterns based on land use change models is currently a research hotspot and an important approach to exploring future land use and habitat quality change patterns [12,13]. Land use simulation involves various models and methods, with the current research mainly coupling statistical and process models to simulate future land use spatial patterns [14,15,16]. Statistical models used in land use simulation include logistic regression models, Markov models, neural network models, and others [17,18,19]. The role of statistical models is to analyze the trends and correlations of land use change based on historical data and pattern recognition, and to quantitatively predict future land use demands. Process models are mainly based on Cellular Automata (CA), which simulate land use change by defining transition rules and neighborhood relationships among cells [14]. Examples of process models include the Conversion of Land Use and its Effects (CLUE) model, which simulates dynamic changes in land use by defining rules and transition probabilities for land use change [20]. Building upon the CLUE model, the CLUE-S (Conversion of Land Use and its Effects at Small regional extent) model incorporates driving factors and conversion rules for land use change [21]. The Land Transformation Model (LTM) divides land parcels into multiple categories and determines land use change paths based on transition probabilities and neighborhood relationships [22]. However, existing CA models have limitations in terms of rule mining strategies and landscape dynamic simulation strategies. To address these issues, Liang et al. proposed the rule mining framework based on the Land use Expansion Analysis Strategy (LEAS) and the Cellular Automaton model based on multi-type Random Seeds (CARS). The PLUS model, compared to other models, demonstrates better performance in mining various land use change factors, simulating changes in multiple land use patches, and supporting policy planning for sustainable development [23].
Traditional methods for assessing habitat quality in ecological studies often rely on field sampling and the construction of evaluation models to assess the quality of habitats in a given region. However, these methods have limitations such as difficulties in obtaining data, complex assessment processes, and inconsistencies in expert evaluations, which have hindered their widespread application [24,25,26]. With the continuous development of 3S technologies, ecological models such as SoLVES (Social Values for Ecosystem Services), InVEST (Integrated Valuation of Ecosystem Services and Tradeoffs), and ARIES (Artificial Intelligence for Ecosystem Services) [27,28,29] have emerged for quantitative assessment of regional habitat quality. These models offer advantages such as easy data acquisition, high evaluation accuracy, and multi-scale spatial analysis, which have attracted increasing attention from scholars [30,31,32]. The application of the InVEST model in assessing habitat quality in the context of land use change can contribute to the adjustment of biodiversity conservation policies and the coordination of socioeconomic development and ecological environmental protection [33]. In the study by Wu et al. on habitat quality in the Guangdong-Hong Kong-Macao Greater Bay Area, it was found that forest ecosystems have the highest habitat quality value, which increases with higher elevation [34]. Furthermore, Yang et al. discovered a significant negative spatial correlation between the intensity of land development and habitat quality in the northeastern region of China. Based on their research findings, they provided relevant recommendations for optimizing land development and improving ecological and environmental quality in the region [35].
The “Chongqing Urban Agglomeration Development Plan”, jointly issued by the Chongqing Municipal People’s Government and the Sichuan Provincial People’s Government in August 2022, determines the planning scope of the Chongqing Urban Agglomeration and its core position in promoting the development of the western region, the Yangtze River Economic Belt, and the construction of the “Belt and Road” initiative. The plan explicitly emphasizes the need to practice the concept of “comprehensively accelerating the construction of ecological civilization and promoting harmonious coexistence between humans and nature” in the high-quality development of the Chongqing Urban Agglomeration. As a typical mountainous urban area in Southwest China, the Chongqing Urban Agglomeration faces challenges due to the vulnerability of its mountainous ecosystems [36]. However, in recent years, rapid socio-economic development and high-density population aggregation have exerted significant pressure on habitat quality in the region due to rapid and extensive urbanization [37]. This has led to increasing attention being paid to the study of habitat quality in mountainous urban areas. Previous studies on habitat quality in mountainous cities mainly focused on exploring the relationship between human activities, land use change, and habitat quality changes in mountainous regions [38,39]. For example, Luan et al. selected Guiyang, a typical karst landform city in Southwest China, as the study area to investigate the impact of human activity intensity on habitat quality [40]. Yang examined the dynamic changes in land use and explored the relationship between habitat quality changes and land use changes, aiming to provide scientific guidance for balancing regional economic development and ecological integrity [35]. Some scholars have also conducted in-depth research on the potential mechanisms influencing habitat quality changes in mountainous urban areas from the perspectives of socio-economic development, natural climate, and other factors [41,42].
The above research on habitat quality in mountainous cities has certain limitations. The main reason is that the use of historical land use data results in a temporal and spatial lag in studying the evolution patterns and driving factors of regional habitat quality, which cannot capture the current and future trends of habitat quality changes in mountainous regions. Therefore, it is necessary to combine land use simulation research to predict the habitat quality of future mountainous urban ecosystems. However, there are still some issues with the existing regional habitat quality simulation research. In current land use simulation studies, the simulation region is often treated as a homogeneous entity, overlooking the heterogeneity of spatial units within the simulation region [43,44,45]. The land conversion rules based on a single scenario also face the challenge of being inapplicable to large-scale regional simulation and prediction as they fail to comprehensively reflect the future land use changes in the region. Additionally, most simulation studies neglect the policy effects of local government regulations that restrict, incentivize, and guide land use behaviors, especially regarding regional planning, construction, and ecological conservation policies. Ignoring the driving effects of policies does not align with the actual circumstances of regional development.
Considering these issues, this study extracts the policy planning scope from the overall urban planning and land spatial ecological conservation and restoration planning of each district and county in the Chongqing metropolitan area. Based on these planning scopes, the Chongqing metropolitan area is divided into different types of spatial units. Using land use data from 2000 to 2020 in the Chongqing metropolitan area and employing the PLUS model, this study analyzes the land use spatial patterns in the policy-driven context of the Chongqing metropolitan area in 2030. The InVEST model is used to assess the spatiotemporal dynamic changes in ecosystem habitat quality in the Chongqing metropolitan area from 2000 to 2030. The specific objectives of this research are as follows: (1) Analyze the structural changes in land use in the Chongqing metropolitan area from 1990 to 2020 and explore the response of habitat quality to land use changes over the past 30 years; (2) Under the driving force of planning and construction policies and ecological conservation, what spatial patterns of land use will emerge in the Chongqing metropolitan area in 2030? Conduct a longitudinal analysis of the predicted results to understand their changing characteristics; (3) How does the predicted habitat quality in the Chongqing metropolitan area in 2030 compare to previous years? Investigate the trend of habitat quality changes from 2000 to 2030; (4) Characterize the topographic gradient effect on habitat quality in the Chongqing metropolitan area from 2000 to 2030.

2. Materials and Methods
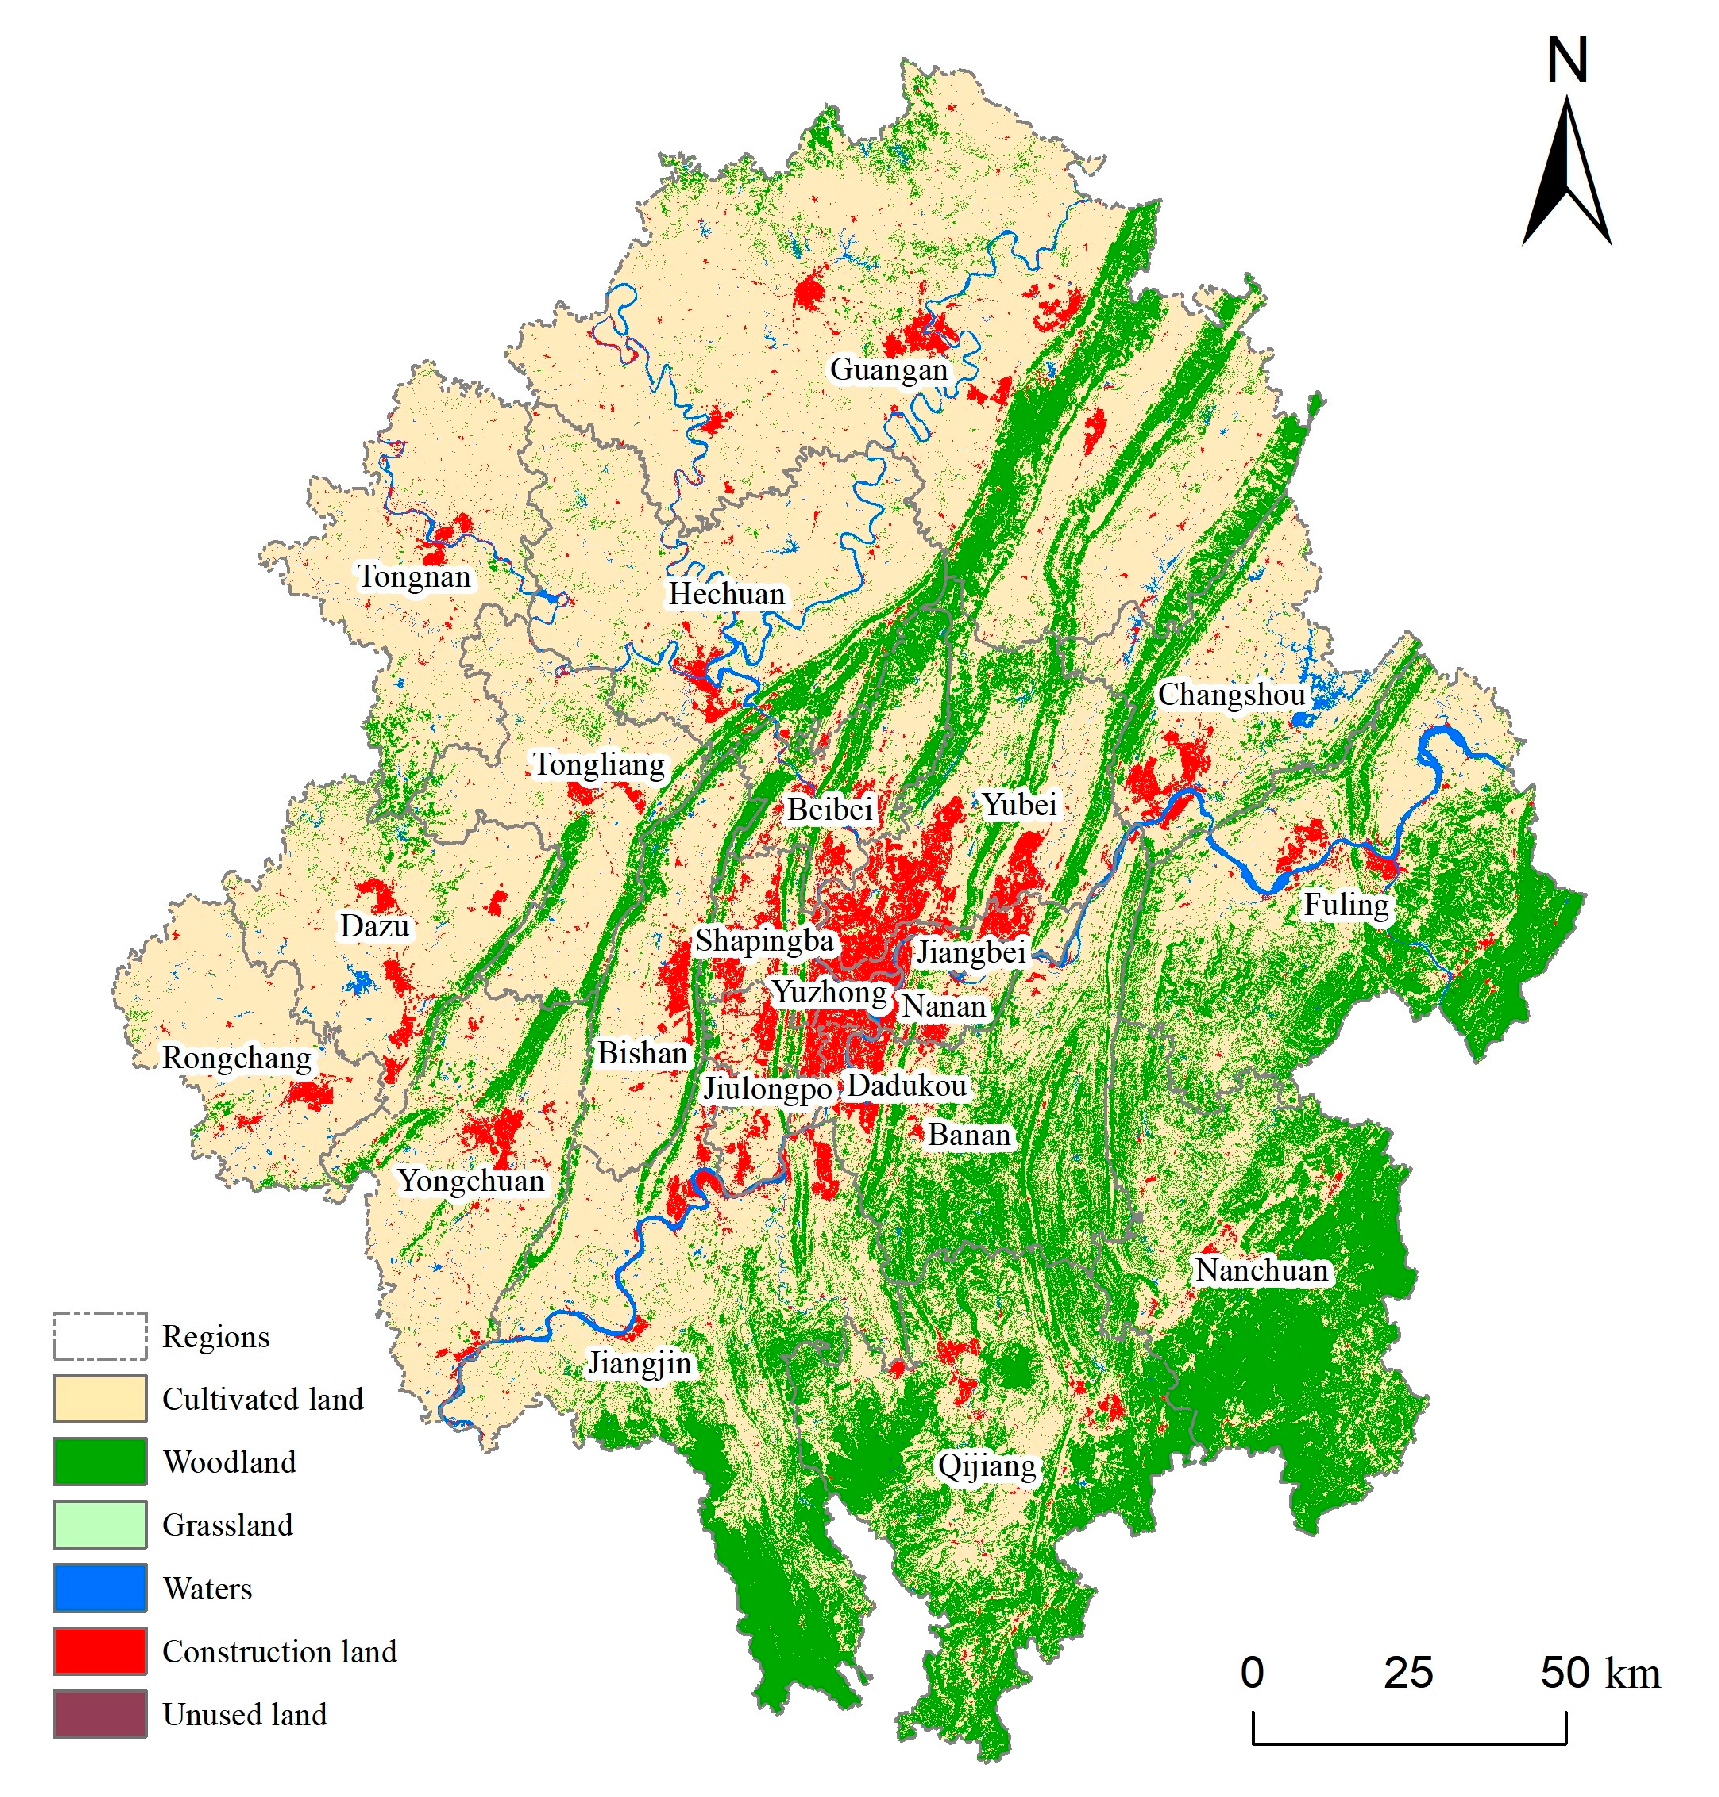
2.1. Study Area

The Chongqing Metropolitan Area is located in the southwestern region of China, in the upper reaches of the Yangtze River. It encompasses the ecological corridors formed by the main water system consisting of the Yangtze River and its major tributaries such as the Jialing River and Wujian River, as well as important mountain ecological corridors including Huaying Mountain, Mingyue Mountain, and Tongluo Mountain. This unique landscape forms the “Two Rivers and Four Mountains” pattern and serves as an important ecological barrier in the upper reaches of the Yangtze River. The total area of the Chongqing Metropolitan Area is approximately 35,000 square kilometers, with plains covering about 3100 square kilometers, hills covering about 21,400 square kilometers, and mountains covering about 10,500 square kilometers. The area has a population of around 24.4 million and a total economic output exceeding 2 trillion yuan, with an urbanization rate of 74%. As a highland for the high-quality development of western China, the Chongqing Metropolitan Area plays a crucial role in promoting green development in the Yangtze River Economic Belt and serves as a model for sustainable growth [46,47]. However, rapid economic growth, urban expansion, and intensive surface transformation have placed significant burdens on the mountainous ecosystems, drawing considerable attention to the level of habitat health in the region [48] (The overview of the research area of this study is shown in Figure 1).

2.2. Data Sources and Processing

2.2.1. Date Sources

The land use data used in this study were sourced from the Resource and Environment Science and Data Center of the Chinese Academy of Sciences (http://www.resdc.cn), with a spatial resolution of 30 × 30 m. The land use data consists of six primary classes, including cropland, forest land, grassland, water bodies, built-up land, and unused land. Five periods of land use grid data for the Chongqing Metropolitan Area were used in this research, covering the years 1990, 1995, 2000, 2005, 2010, 2015, and 2020. To simulate land use changes more accurately, this study extracted the planning and policy implementation scope based on the overall urban planning and land and space ecological protection and restoration plans of the 22 administrative regions within the study area. Finally, considering social-economic and natural environmental factors, nine land use change driving factors were selected, including population density, GDP, slope, average annual precipitation, and average annual temperature, among others. (The attributes and descriptions of all the data used in this study can be found in Table 1).

2.2.2. Research Framework

This study utilizes land use data from 1990 to 2020. Firstly, the spatial characteristics of land use changes in the study area from 1990 to 2020 are described using transition matrices and graph analysis. Then, the InVEST model is employed to characterize the spatiotemporal variations in habitat quality in the study area during the same period and explore the relationship between regional habitat changes and land use. Finally, based on government construction planning and ecological control policies, the PLUS model is used to simulate the spatial pattern of land use in the study area for 2030 and predict the spatial distribution of habitat quality in 2030. By combining the terrain gradient index to analyze the degraded areas of habitat quality in the study area, the relationship between habitat degradation and terrain is understood. The research framework is illustrated in Figure 2.

2.3. Research Methods

2.3.1. Simulating Future Land Use Patterns Based on the PLUS Model

The PLUS model, developed by Liang Xun et al. in 2020 at the High-Performance Spatial Computing Intelligence Laboratory of the China University of Geosciences (Wuhan), is a rule mining framework based on Land Expansion Analysis Strategy (LEAS) and a Cellular Automata (CA) model based on Multi-Type Random Seed (CARS). Compared to traditional CA models, the PLUS model has been improved and optimized in terms of rule mining strategy and landscape dynamic simulation strategy, enabling the application of CA models in conjunction with actual planning and land policy development. The Land Expansion Analysis Strategy (LEAS) extracts the expansion of various land use types between two periods and employs the random forest algorithm to explore the expansion and driving forces of each land use type, obtaining the development probabilities of various land uses as well as the driving factors and contributions to the expansion of each land use type during that period. Based on the CA model using multi-type random seed patches (CARS), the PLUS model can dynamically simulate the generation and changes of patches in space and time while adhering to the development probabilities constraint and employing a roulette-based adaptive inertia mechanism [23].
Using the Markov-chain module encapsulated in the PLUS model, the land use demand for the Chongqing Metropolitan Area in 2030 is calculated. The Markov-chain approach utilizes a transition probability matrix P i j based on land use changes between two time periods to predict future changes in the land use landscape. The specific formula is as follows:
P n = P ( n 1 ) P i j
In the equation, P represents the transition probability matrix of land cover types. n represents the number of land cover types. P i j denotes the probability of a transition from land cover type i to land cover type j , where 0 P i j 1 and i = 1 n P i j = 1 . P n is the probability vector of reaching the state after n transitions, which can be calculated as P n = P ( 0 ) P i j n , where P ( 0 ) is the initial probability vector.
Using the PLUS model, the land use distribution of the Chongqing metropolitan area in 2030 is simulated. The model parameters and workflow are as follows: (1) Based on the land use data from 2010 and 2020, the Markov-chain module is used to predict the land use demand for different categories in the Chongqing metropolitan area in 2030. (2) The expansion data for each land class in 2010 and 2020 is extracted. Nine driving factors, including population, GDP, average annual precipitation, and average annual temperature, are selected based on social-economic and climatic-environmental aspects. The LEAS (Land Expansion Analysis Strategy) module utilizes the random forest algorithm to explore the development probability of each landscape class and the contribution values of the driving factors to the expansion of different land classes. In the LEAS module, the following settings are applied for the random forest parameters: random sampling is selected as the sampling method, the sampling rate for land use expansion is set to 0.1 (the default value is 0.01, and this value ranges from 0 to 1, with a larger value indicating finer sampling), and the number of decision trees in the random forest is set to 50. M-Try represents the number of features used for training the random forest and is set to 9 by default, as it should not exceed the number of driving factors. (3) In the CA module, a restricted development area is imported, where the boundaries of different regional units are defined based on the urban construction scope of each district and the relevant policy documents on ecological protection (Table 1). The ecological control area serves as a restriction zone, protecting ecological land within the area and prohibiting the conversion of ecological land classes internally. The natural simulation area undergoes land class conversions based on the development probability in the natural state, according to the model. The planning and construction area allows for an increased generation probability of the target land class within the region, simulating the driving effect of planned development zones on urban development. In this study, the conversion probability of construction land is increased to generate new construction land parcels. (4) Combining the development probability of each land class and the predicted land use demand for 2030, the CARS (Cellular Automaton for Residential Simulation) module is used to simulate the land use distribution in the Chongqing metropolitan area in 2030 based on the land use data from 2020. In the CARS module, parameters are adjusted for different land use type transition matrices and their neighborhood weights based on relevant research results [49,50,51] and expert opinions. The remaining parameters, such as neighborhood distance, maximum proportion of random seed, range of decay coefficient for decrement threshold, probability of random patch seed, and policy enforcement intensity in the planning and development area, are set to default values according to the model guidelines.
During the validation phase of the simulation accuracy, this study selected the Kappa coefficient to compare the simulated land use results for the year 2020. The results were obtained through the aforementioned process based on the 2000 and 2010 simulations, with the actual land use data for 2020. This was carried out to assess the accuracy of the model for this study. The formula for calculating the Kappa coefficient is as follows:
K = P o P e 1 P e
The Kappa coefficient is a measure based on a confusion matrix used to assess the consistency between two variables. When the variables are the classification results and the validation samples, it can be used to evaluate classification accuracy. In the formula, P o represents the overall classification accuracy, which is the sum of correctly classified samples for each class divided by the total number of samples. P e represents the chance-corrected agreement, calculated as the sum of the products of “actual and predicted counts” for each class divided by the square of the total number of samples. The Kappa coefficient ranges from −1 to 1, typically greater than 0, with the following interpretations: 0 indicates chance agreement; (0–0.2) indicates slight agreement; (0.2–0.4) indicates fair agreement; (0.4–0.6) indicates moderate agreement; (0.6–0.8) indicates substantial agreement; (0.8–1) indicates almost perfect agreement.
In this study, the Kappa coefficient was calculated to evaluate the consistency between the simulated land use results for 2020, obtained from the PLUS model based on the land cover data from 2000 to 2010 under the natural simulation scenario, and the actual land use data for 2020. The Kappa coefficient was found to be 0.81, indicating a high level of agreement. The overall accuracy was greater than 0.9. Therefore, the simulated results showed a high level of consistency with the actual data, and the accuracy of the model fully meets the research requirements, indicating the suitability of the PLUS model for the relevant simulations in this study.

2.3.2. Habitat Quality Assessment Based on the InVEST Model

This study calculates the habitat quality indicators in the study area based on the Habitat Quality Assessment module of the InVEST model. In this module, the calculation formula for the habitat quality index is as follows:
Q i j = H j · 1 D i j z D i j z + k z
D i j = r = 1 R y = 1 Y i w i r = 1 R w r r y i r i y β x S j i
In the equation, Q i j represents the habitat quality of grid i in land use type j , ranging from 0 to 1. H j is the habitat suitability of habitat type j . D i j represents the habitat degradation index of the grid, indicating the overall threat level of grid i in habitat type j . The value of the habitat degradation index ranges from 0 to 1, where a higher value indicates a higher degree of degradation relative to the current land use. k is the half-saturation constant, typically set to 0.05 according to the model’s official documentation. z is the conversion coefficient, set to 2.5 based on the InVEST model’s user guide. R is the number of threat factors, Y i is the number of grid cells for threat factor i , w r is the weight of threat factor r , i r i y is the maximum influence distance of threat factor i , β x is the accessibility of grid x , S j i is the sensitivity of habitat type j to threat factor r , and w i is the weight of stressor factor i .
Generally, the impact of a threat source on the habitat grid decreases as the distance between the grid and the threat source increases. Therefore, within the range of the threat distance, the impact of the threat source on the habitat grid can be described as either exponential decay or linear decay. The formulas for linear decay and exponential decay are as follows:
i r x y = 1 d x y d r   m a x   i f   l i n e a r
i r x y = 2.99 d r   m a x d x y   i f   e x p o n e n t i a l
In the equation, i r x y represents the impact of threat source r on grid y in terms of habitat quality. Here, d x y refers to the linear distance between grid x and y , while d r m a x represents the maximum influence distance of threat source r .
By referring to relevant studies on habitat quality in mountainous regions [36,37,38,39], following the parameter setting principles outlined in the InVEST model usage manual, and consulting experts in the field, the following threat factors were selected as influential factors for assessing the habitat quality in the Chongqing Metropolitan Area: Cultivated land, Construction Land, and Unused land. The weights, influence distances, and spatial decay types of these threat factors were determined (Table 2). Additionally, parameter settings were established to account for the sensitivity of different land use types to habitat quality threat factors (Table 3).

2.3.3. Topographic Position Index and Distribution Index

Due to the study area being located in the southwestern mountainous region of China, it is important to consider the influence of elevation in addition to slope when examining habitat degradation. A detailed analysis of the spatial distribution and differentiated characteristics of habitat degradation across different terrain position gradients in the study area is necessary. Therefore, this study utilizes the terrain position index for this research, and its calculation formula is as follows:
T = log 10 E E ¯ + 1 × S S ¯ + 1
In the equation, T represents the terrain position index. E denotes the corresponding elevation value within the grid cell in the study area, while S represents the corresponding slope value within the grid cell. E ¯ and S ¯ represent the average elevation and slope values in the study area, respectively. In the study area, grid cells with higher elevations and steeper slopes will have larger terrain position index values, while those with lower elevations and gentler slopes will have smaller values. This study utilizes the natural break method to divide the terrain position index into five levels (1–5), which facilitates the investigation of the impact of terrain factors on habitat degradation in the study area and highlights the numerical representation of habitat degradation across different terrain position gradients.
The distribution index is used to address the issue of dimensional differences among habitat degradation areas at different terrain gradients. Therefore, this study employs the distribution index to analyze the differences in the distribution of regional habitat degradation among different levels of terrain position gradients. The calculation formula is as follows:
P = S i j / S i / S j / S
In the equation, P represents the distribution index. S i j represents the area of habitat degradation of level i at the terrain position gradient level j . S i represents the total area of level i habitat degradation, while S j represents the total area within terrain position gradient level j . When the distribution index of habitat degradation is greater than 1, it indicates a dominant position, whereas if it is less than 1, it indicates a subordinate position. Within the same terrain position gradient level, comparing the distribution indices of different levels of habitat degradation, a higher distribution index indicates a higher dominance of habitat degradation at that gradient level.

3. Results

3.1. Land Use Change Characteristics and Simulation Results

3.1.1. Land Use Transfer Analysis

According to Table 4, it can be observed that from 1990 to 2020, the arable land area in the main urban area of Chongqing experienced a significant decrease, reducing by 1954.34 km2. On the other hand, the land areas of grassland, built-up land, forestland, water bodies, and unused land showed an increasing trend, with an increase of 2.37 km2, 1143.90 km2, 793.84 km2, 13.43 km2, and 0.79 km2, respectively. Over the course of 30 years, there were significant land use transfers in the main urban area of Chongqing, particularly from arable land to forestland and built-up land. The largest transfer was from arable land, with an area of 3586.26 km2, which was twice the area of incoming transfers (1631.92 km2), mainly in the form of forestland (2322.55 km2). The largest incoming transfer was for built-up land, with an area of 1195.42 km2, which was 23 times the outgoing transfer area (51.51 km2), and most of the incoming area came from arable land. Forestland had an outgoing transfer area of 1539.81 km2 and an incoming transfer area of 2333.65 km2, mainly due to the afforestation of converted cropland. Additionally, there were minor changes in the land areas of grassland, water bodies, and unused land, with no clear patterns of land conversion.

3.1.2. Land Use Expansion Analysis

The spatial pattern of land use expansion in the Chongqing metropolitan area from 1990 to 2020 is shown in Figure 3. The main types of land expansion (with an expansion area greater than 10 km2) include arable land, forestland, water bodies, and built-up land, which collectively account for 99.8% of the total expansion area. The results indicate that the main type of expansion in the main urban area of Chongqing is built-up land, with an expansion area of 119.54 km2. The expansion is primarily concentrated in the central region, including areas in Yubei, Jiangbei, Shapingba, Jiulongpo, and Dadukou districts, with sporadic expansion in surrounding areas. Forestland expansion covers an area of 233.36 km2 and is concentrated in the southeastern parts of Qijiang, Fuling, Nanchuan, and Banan districts, with noticeable expansion in the northern mountainous regions as well. Arable land expansion covers an area of 163.19 km2 and is concentrated along the riverbanks at the boundary between Yongchuan and Dazu districts. The expansion of other types is not clearly reflected in the figure and is more scattered in distribution.
We analyzed the expansion of each land type in the study area on a 10-year cycle from 1990 to 2020 to understand the variability of the expansion patterns of different land types (grassland, watershed, and unused land were excluded from the discussion for the time being due to insignificant changes in expansion). From 1990 to 2000, the study area expanded 92.02 km2, 173.34 km2, and 15.81 km2 of cultivated, forested, and built-up land, respectively. From 2000 to 2010, the study area expanded 102.91 km2, 113.27 km2, and 38.46 km2 of cropland, forest land, and construction land, respectively. From 2010 to 2020, the study area expanded 157.72 km2, 127.84 km2, and 70.8 km2 of cropland, forest land, and construction land, respectively. In conclusion, cropland and forest land expand and flow with each other in the southeastern part of the study area and within the ecological corridor, as well as construction land from the initial development stage in 1990–2000, the rapid expansion stage during 2000–2010, and finally the stable growth stage in 2010–2020.

3.1.3. Land Use Simulation Results

Figure 4 represents the spatial pattern of land use in the Chongqing Metropolitan Area in 2030 under the driving force of government planning, construction, and ecological control policies. Table 5 shows the changes in different land categories within different simulation units from 2020 to 2030. Overall, there is a decreasing trend in arable land, grassland, and unused land, which decreased by 127.87, 0.02, and 0.05 km2, respectively, compared to the year 2020. On the other hand, forest land, water bodies, and built-up areas show an increasing trend, with an increase of 66.18, 6.09, and 55.66 km2, respectively.
Compared to 2020, there is significant expansion in the forest areas of southeastern Qijiang, Fuling, Nanchuan, and Banan districts, as well as the mountainous areas in the north. The ecological control areas are mostly ecological corridors, indicating significant effects of the ecological control policy on ecosystem restoration. The built-up area has increased in all three types of regions, with the largest increase occurring under the construction and development policy. A large amount of arable land has been converted into built-up areas, resulting in a growth of 12.35% compared to 2020, representing an increase of 47.86 km2. Spatially, it is mainly manifested as radial urban expansion in the central region, with areas such as Yubei, Jiangbei, Shapingba, Jiulongpo, and Dadukou districts as the main expansion areas, while other regions show scattered patches of built-up area expansion. Under the ecological control policy, the water body area has increased by 7.09 km2, representing a growth of 0.69%. However, there is a slight decrease (0.04%, 0.05%) in water body area under the projections of natural growth and construction development.
Through Table 5, we can observe significant differences in the area of different land use types within spatial units under different scenarios, which are due to regionally differentiated development strategies. Among them, the planning and construction spatial units are driven by policy and actively engage in urban development and socio-economic growth. These units primarily provide a range of functions such as residential, industrial, commercial, and transportation services. In urban expansion, arable land with gentle terrain is typically used as reserve land for expansion. Therefore, construction land and arable land are the main components of the planning and construction units. The natural conservation units are designated by relevant government departments to improve the ecological environment in the region. They serve as important ecological barriers in the study area and are mainly composed of forestland and arable land. On the other hand, the natural simulation units differ from the other two types of regions. They primarily serve the function of ensuring food security, with ecological regulation as a secondary objective. Therefore, these units are mainly composed of arable land and forestland, with a larger proportion of “agriculture-forestry” area compared to the conservation units.
From the perspective of land types, under the projection of natural growth, the decrease in arable land area is relatively small, at only 5.54 km2, representing a decrease of 0.27% in arable land area compared to all land use types. Under the environmental control and construction development policies, there is a significant decrease in arable land area, with decreases of 72.40 km2 and 49.93 km2, respectively, and the overall proportion of arable land has decreased by 7.01% and 12.88%, respectively. Under the three policies, there is a certain degree of increase in forest land area. Among them, under the ecological control policy, a large amount of arable land has been converted into forest land, resulting in the fastest growth of forest land area, with an increase of 63.06 km2, representing a growth rate of 6.10%. In the natural simulation unit, the forest land area increased by 0.48 km2, an increase of 0.02%. Under the construction development policy, the forest land area increased by 2.63 km2, representing a growth rate of 0.68%.

3.2. Spatiotemporal Evolution Characteristics of Habitat Quality in the Chongqing Metropolitan Area

3.2.1. Trends in Habitat Quality Changes in the Chongqing Metropolitan Area from 1990 to 2030

The InVEST model was used to obtain the changes in area and proportion of habitat quality classes in the Chongqing metropolitan area from 1990 to 2030 (Table 6). By referring to the previous research results [36,37,38,39], the habitat quality in the study area was classified into the following five classes using the equal spacing method: very low (0–0.2), low (0.2–0.4), medium (0.4–0.6), high (0.6–0.8), and very high-high (0.8–1).
As can be seen from Table 6, the very low, high, and very high habitat quality areas in the study area showed a spreading trend during 1990–2030, with an increase of 607.84, 2.78, and 13.75 km2, respectively, during the 40-year period, and an inward shrinking trend of low and medium value areas, with a decrease of 562.16 and 62.22 km2, respectively. It can be seen that the low and very low value areas are the main components of habitat change, and the medium, high, and very high value areas maintain a stable trend. This indicates that the habitat decline caused by urban construction in the study area has been effectively controlled to a certain extent under the regulation of the planning and construction and ecological control policies in the study area, and the ecological areas that support the main role of regional habitat protection have been effectively protected and have a tendency to recover.

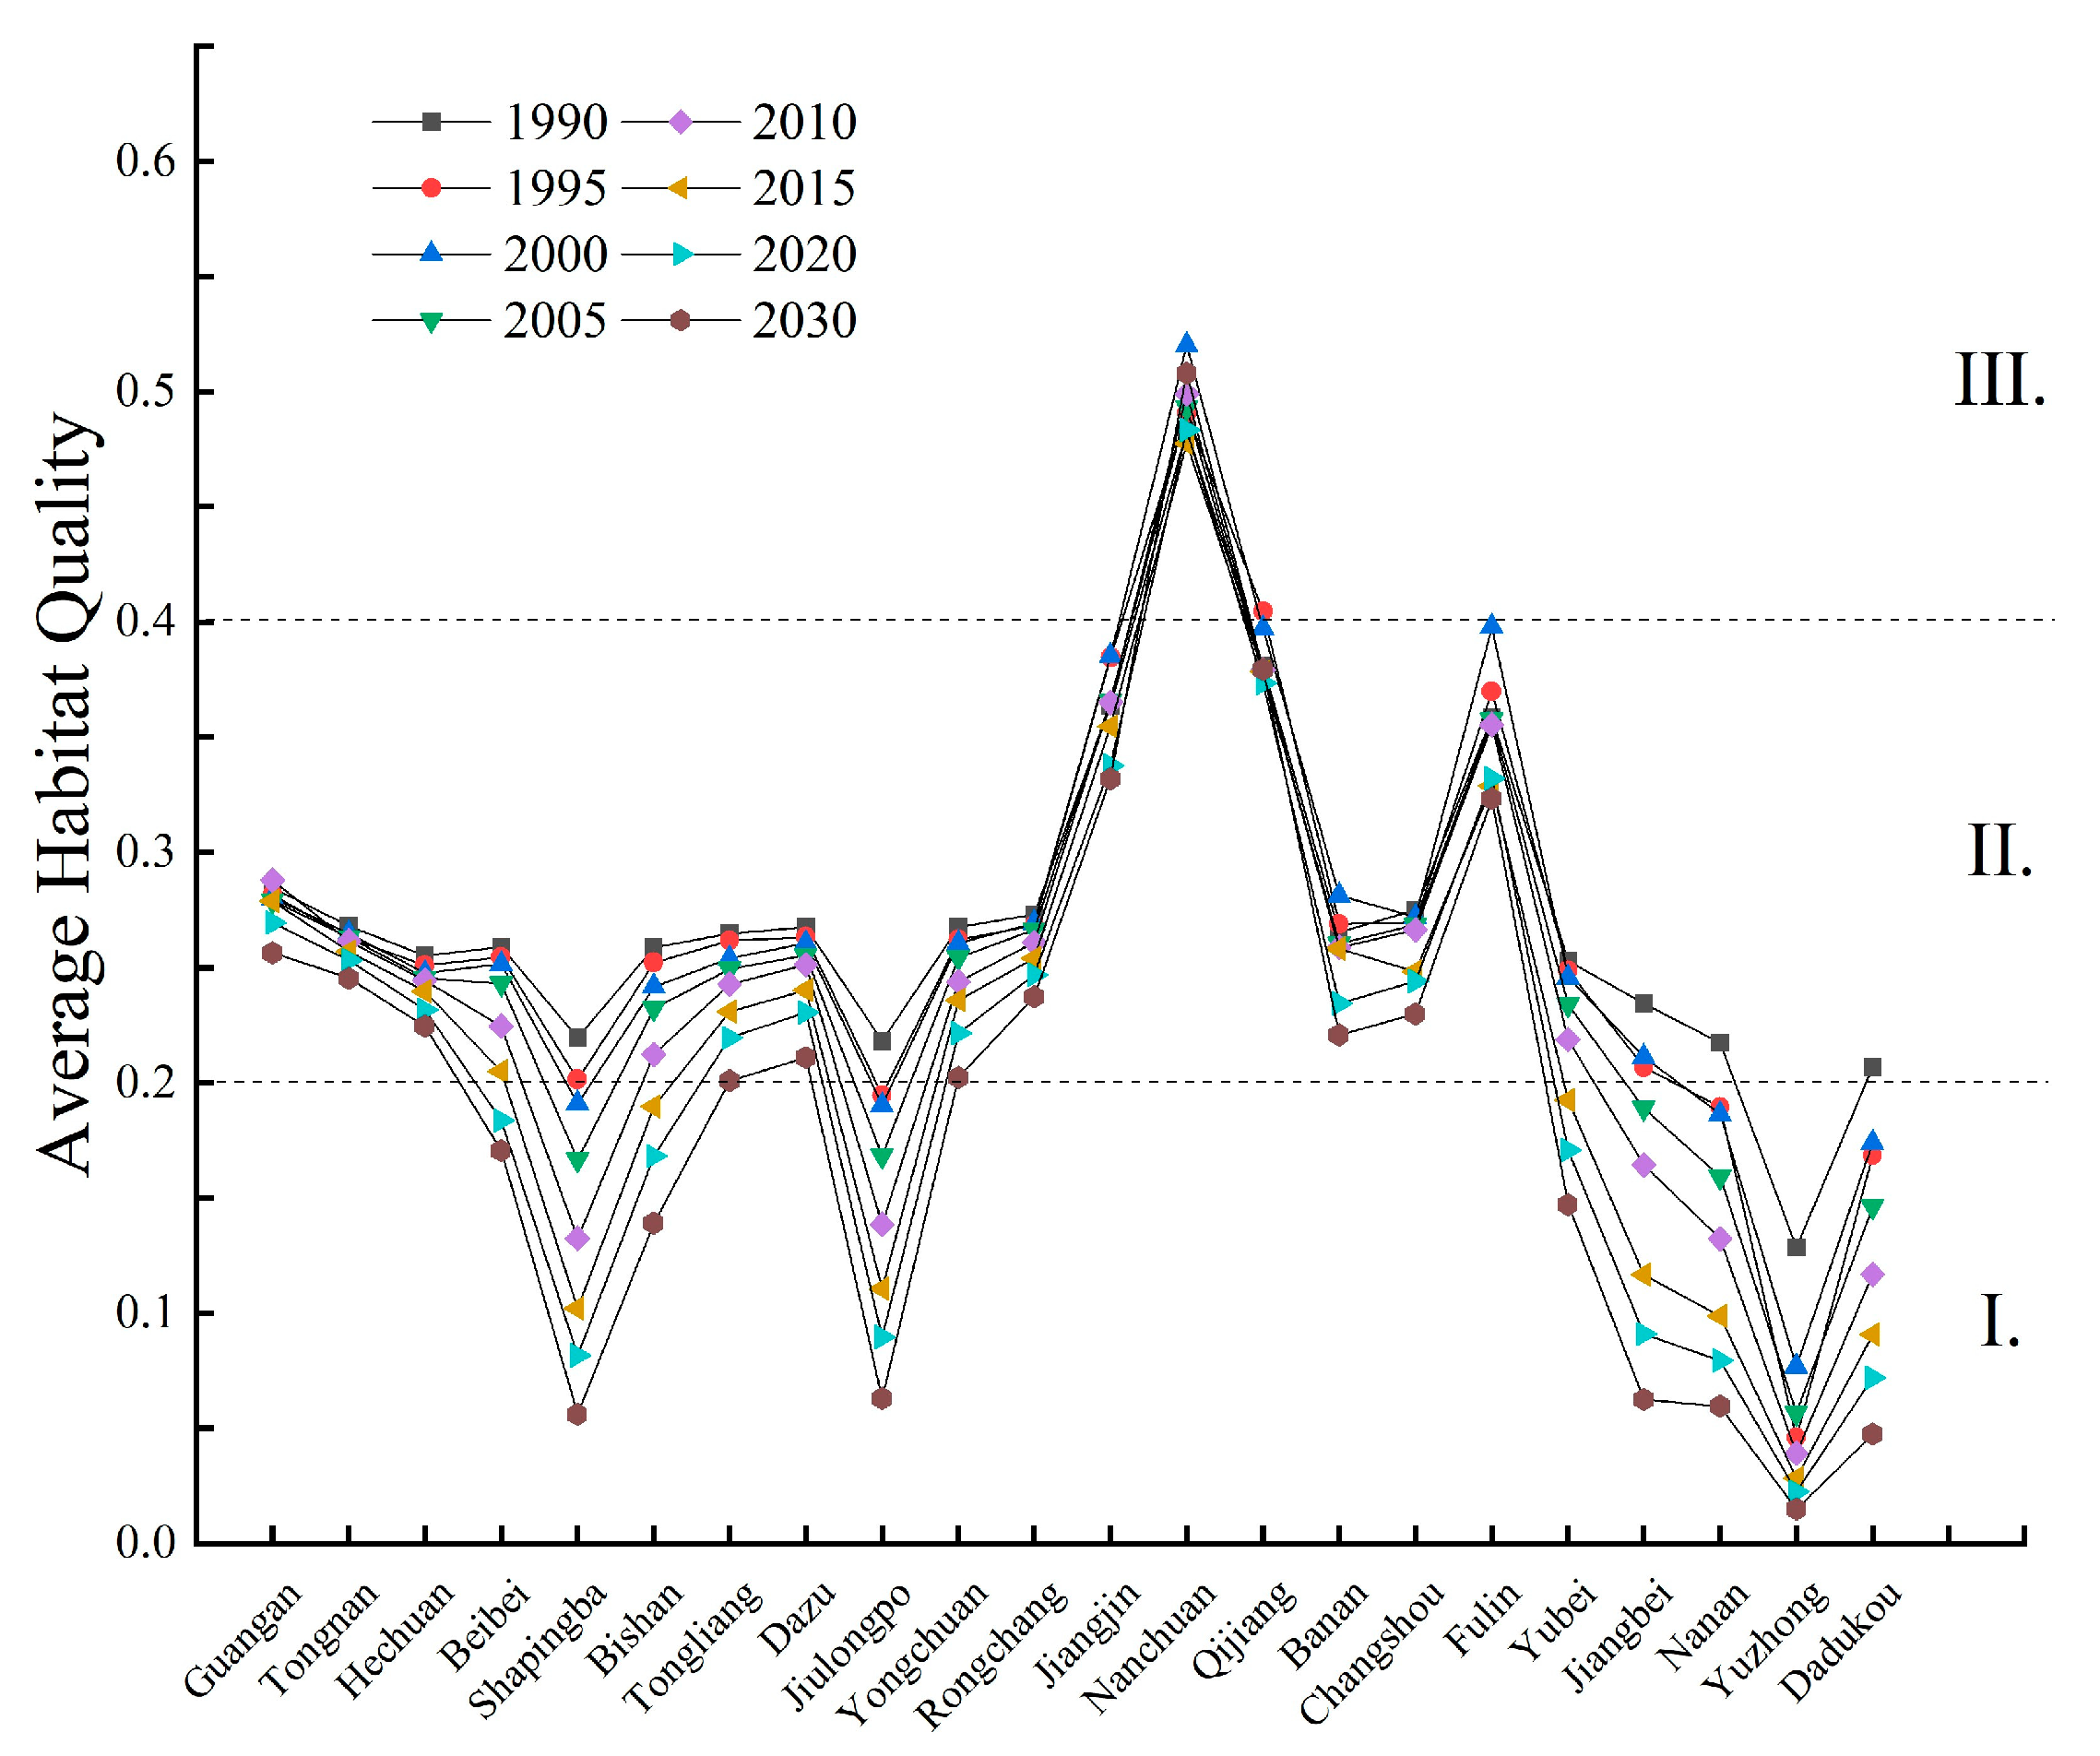
3.2.2. The Changes in Habitat Quality Levels across Different Regions of the Chongqing Metropolitan Area from 1990 to 2030

According to Figure 5, there are significant differences in the changes in the quality of the living environment among the administrative regions of the Chongqing metropolitan area from 1990 to 2030. Except for Nanchuan District, where the living environment quality shows an overall increasing trend, other regions exhibit a declining trend in the overall living environment quality, and the degree of habitat quality decline varies among different districts.
According to the classification method mentioned above, the overall habitat quality is divided into three levels: Level I (0–0.2), Level II (0.2–0.4), and Level III (>0.4). Over the course of 30 years, only Nanchuan District and Yuzhong District fell within the Level III and Level I ranges of habitat quality. The regions with habitat quality ranging between Level II and Level I constitute the main part of the study area. Over a span of 40 years, the regions where the overall habitat quality declined from Level II to Level I include Beibei District, Shapingba District, Bishan District, Tongliang District, Dazu District, Yubei District, Jiangbei District, Nan’an District, and Dadukou District. Nanchuan District witnessed an overall increase of approximately 5.16% in habitat quality average value by 2030 compared to 1990. The most significant declines in habitat quality were observed in Yuzhong District, Dadukou District, Jiangbei District, Nan’an District, and Jiulongpo District. These regions experienced a decline of over 70% in habitat quality average value by 2030 compared to 1990, with an overall decrease in habitat quality levels of 0.11, 0.16, 0.17, 0.16, and 0.16, respectively. Regions with relatively weaker declining trends, where the overall habitat quality levels decreased by less than 20% compared to 1990, include Guang’an City, Tongnan County, Hechuan District, Rongchang County, Jiangjin District, Nanchuan District, Qijiang District, and Fuling District. The habitat quality levels in these regions decreased by 0.03, 0.02, 0.03, 0.04, 0.03, 0.02, 0.01, and 0.04, respectively.

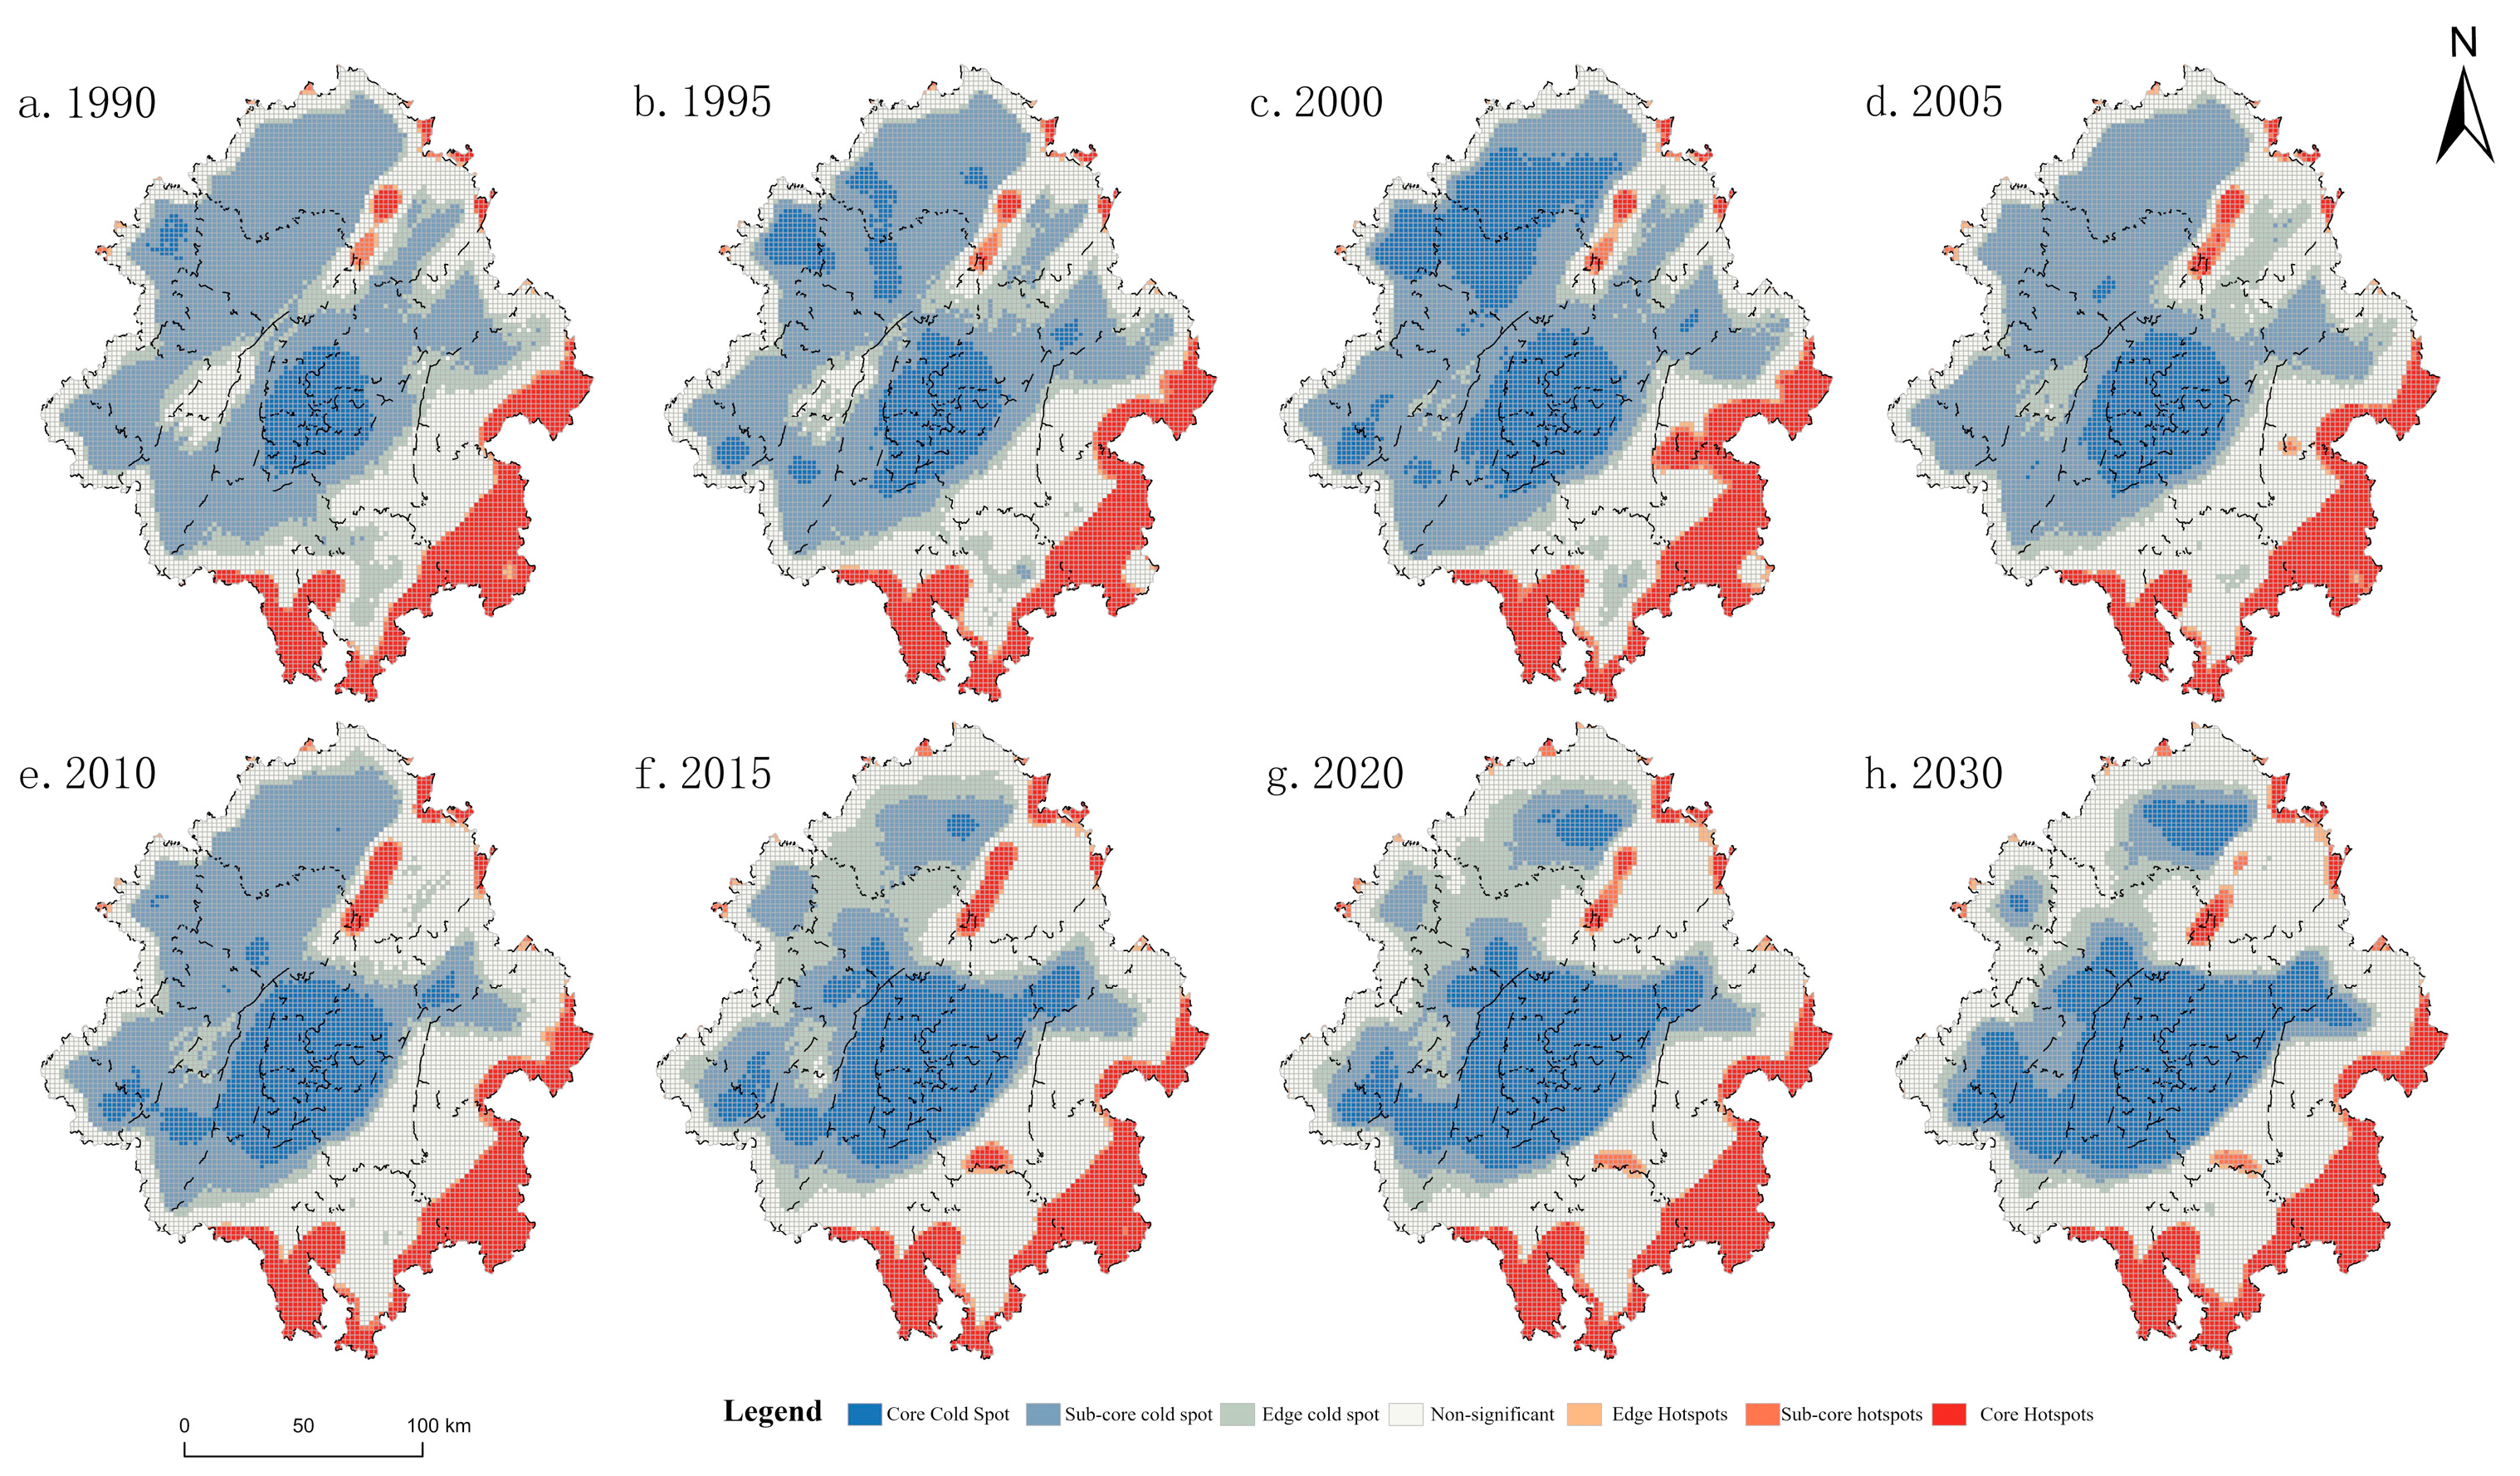
3.2.3. Spatial Agglomeration Effects of Habitat Quality in the Chongqing Metropolitan Area

As shown in Figure 6 and Figure 7, From 1990 to 2030, the hotspots and cold-spots of habitat quality exhibit significant spatiotemporal variations. In terms of time, although the hotspots generally show an increasing trend in area, the fluctuations are relatively small. On the other hand, the cold-spots, except for the core cold-spot area, experience a notable decrease in area for both the sub-core cold-spot and the edge cold-spot regions, with larger fluctuations. Spatially, the hotspots are mainly concentrated in the southeastern part of the study area, while the cold-spots are predominantly distributed in the central region. Over the 40-year period, the hotspots demonstrated relative spatial stability, while the cold-spots exhibited a significant expansion phenomenon, radiating extensively from the core region in the center towards the western part of the study area.
The area changes of cold and hotspots of habitat quality in the study area of the Chongqing metropolitan area from 1990 to 2030 can be summarized as follows: The hotspots, representing areas of high habitat quality, showed an overall increasing trend in their area, although the magnitude of change was relatively small. The core hotspots, sub-core hotspots, and peripheral hotspots had an area range of 3952.2 km2 to 4291.7 km2, 493 km2 to 604.1 km2, and 297.4 km2 to 414.5 km2, respectively. During the 40-year period, they expanded by 339.5 km2, 110.2 km2, and 117.1 km2, respectively, with relatively stable fluctuations in between. The area changes of cold-spots in the study area exhibited significant differences and showed stage-specific patterns. The core cold-spots experienced an “increase-decline-increase” trend. From 1990 to 2000, their area increased from 2084 km2 to 7132 km2, followed by a decline to 3116 km2 from 2000 to 2005, and ultimately rising to 8944 km2 by 2030. The sub-core cold-spots had the largest initial area of 14,484 km2 and showed a generally declining trend over the entire period, with a slight rebound from 2000 to 2005 and a subsequent accelerated decline. Their area decreased from 12,908 km2 to 3608 km2 in the 20-year period. The peripheral cold-spots exhibited an overall “decline-increase” pattern. From 1990 to 2000, the area decreased from 4256 km2 to 2344 km2, followed by a continuous increase to 8944 km2 by 2030. Areas without significant changes showed an overall increasing trend in their area, with a small decrease observed from 1995 to 2000, but it did not affect the overall trend. During the 40-year period, their area ranged from 9460.4 km2 to 14,493.6 km2, increasing by 5033.2 km2.
Over the course of 40 years, the hotspots in the southeastern part of the study area showed no significant changes and were mainly distributed along the southwestern periphery, as well as in small-scale clusters in the mountain corridor region in the northeastern part of the study area. The changes in cold-spot areas can be divided into two stages. The first stage, from 1990 to 2005, witnessed the gradual expansion of cold-spot areas in the central region of the study area, but with a relatively stable growth rate. Significant changes occurred in the cold-spot areas of Tongnan County, Hechuan District, and Guangan City in the northern part of the study area during this stage. These cold-spots rapidly expanded between 1995 and 2000, followed by a rapid decline between 2000 and 2005. From 2010 to 2030, the cold-spot areas of the entire study area entered a phase of rapid expansion. The core cold-spot area in the central region expanded in both east and west directions, with an increasing expansion rate. Ultimately, by 2030, a large-scale aggregation of cold-spot areas would have formed in the central and western parts of the study area.

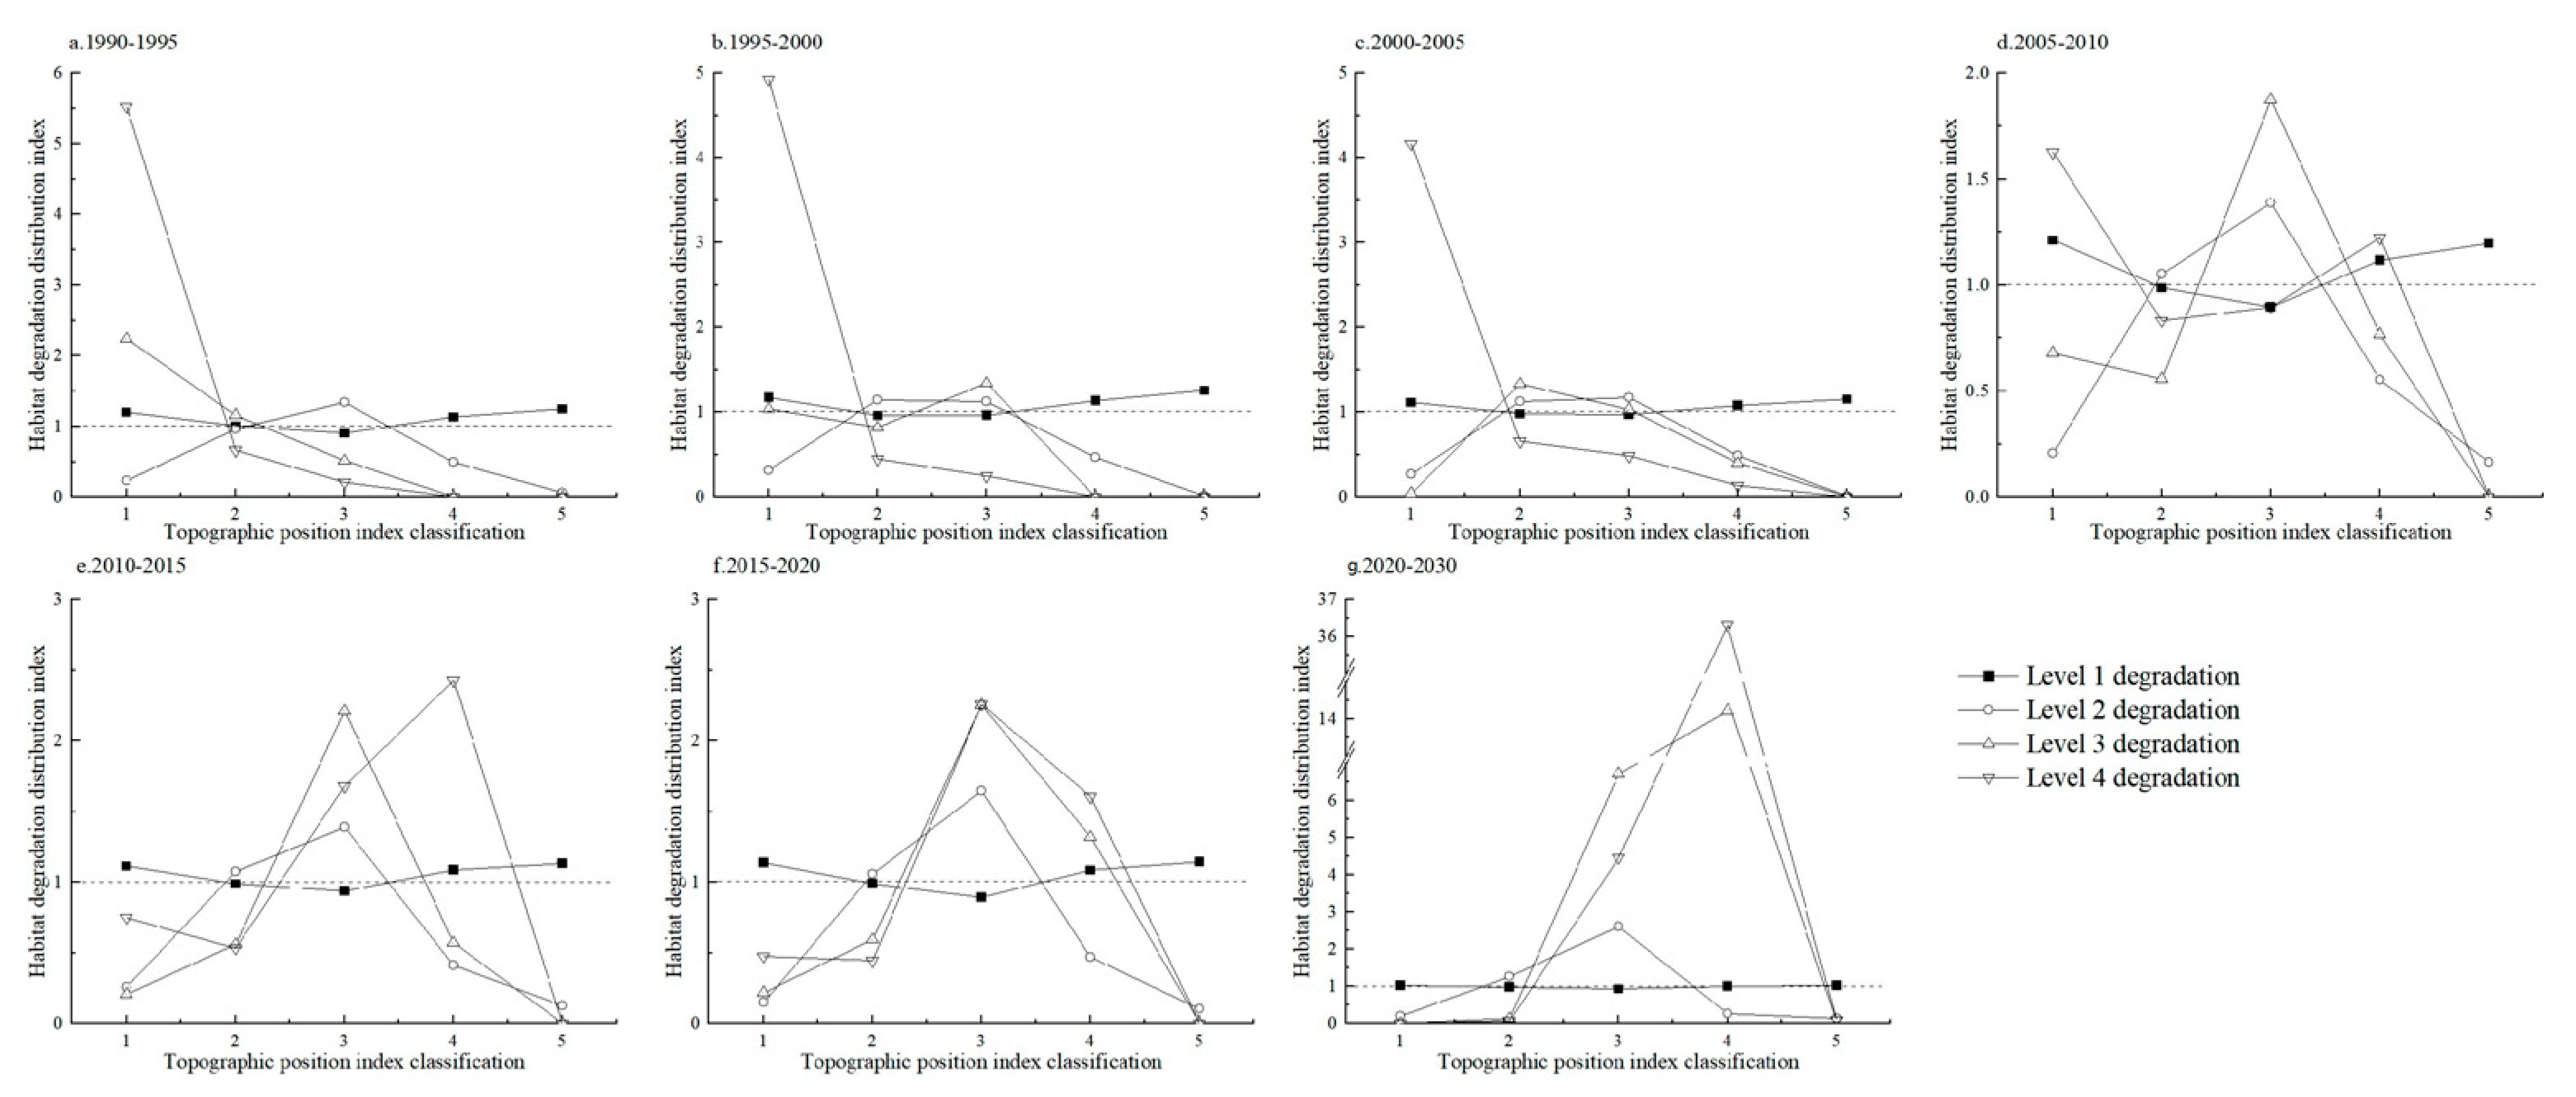
3.3. The Topographic Gradient Effect on Habitat Quality Degradation in the Chongqing Urban Agglomeration

According to the classification of regional habitat quality mentioned earlier, the phenomenon of decreasing habitat quality is referred to as habitat degradation. Based on the intensity of habitat quality decline, habitat degradation can be categorized into four levels: Level 1 degradation (very high to high, high to moderate, moderate to low, low to very low), Level 2 degradation (very high to moderate, high to low, moderate to very low), Level 3 degradation (very high to low, high to very low), and Level 4 degradation (very high to very low). By utilizing the raster calculator and reclassification tools in ArcGIS, we obtained the terrain position index and habitat degradation distribution index for the study area. As shown in Figure 8, the habitat degradation values across different terrain position gradients in the Chongqing metropolitan area varied from 1990 to 2030. The overall trend can be divided into three stages: 1990–2005, 2005–2030, and beyond 2030. Each stage exhibits similar graphical trends and the dominant role of habitat degradation on each terrain position gradient.
During the period from 1990 to 2005 in the study area and at the 1st terrain position gradient, the distribution indices of habitat degradation for the 1st, 3rd, and 4th levels were greater than 1, indicating their dominance. At the 2nd terrain position gradient, the distribution indices of habitat degradation for the 1st, 3rd, and 4th levels decreased, and the distribution indices for each level were similar, but the 2nd and 3rd levels still had indices greater than 1. At the 3rd to 5th terrain position gradients, the differences in the distribution indices of habitat degradation for each level gradually widened. Specifically, the distribution indices of the 2nd, 3rd, and 4th levels decreased with the increase in terrain position gradient, while the distribution index for the 1st level remained relatively stable across different terrain position gradients, almost consistently above 1. From 2005 to 2030, the distribution index for the 1st level did not undergo significant changes compared to the previous stage, maintaining a stable trend across different terrain position gradients. The major changes occurred in the 3rd and 4th terrain position gradients, where the distribution indices of habitat degradation for the 3rd and 4th levels showed significant enhancement compared to the previous stage. This indicates that the terrain in the Chongqing metropolitan area has a significant impact on the spatial distribution of habitat degradation. Different terrains can affect the cost of investment in urban construction and subsequently influence the range and intensity of human activities. However, the study also found that with the rapid urbanization in the study area, the areas of habitat degradation gradually spread to regions with higher elevation and steeper slopes, leading to the degradation of ecosystems in mountainous areas with higher terrain position gradients.

4. Discussion

4.1. Response of Habitat Decline to Land Use Change

Using the method of ArcGIS zoning statistics, the areas and intensities of land use transitions related to habitat degradation within the study area at different time periods were calculated. As shown in Table 7, it can be observed that the main cause of habitat degradation in the study area from 1990 to 2030 was the conversion of cropland to built-up land, followed by the conversion of forest land to built-up land. Therefore, urbanization and construction are the primary factors leading to the decline in regional habitat quality, which is consistent with findings from most studies [52,53]. The intensity of encroachment on cropland and the expansion of built-up land have continuously increased over a period of 40 years. From the perspective of Chongqing’s development, we will analyze the expansion of built-up land in habitat degradation areas.
In the first stage, from 1990 to 2000, the built-up land increased by 70.8327 km2 and 94.8294 km2, respectively. This period had the slowest growth rate compared to other stages. During this period, Chongqing City initiated strategic transformation, shifting from a focus on traditional industries to the development of high-tech industries and modern services, and the city entered the initial stage of rapid urbanization. In the second stage, from 2000 to 2010, the built-up land expanded by 145.249 km2 and 219.732 km2, respectively. During this period, Chongqing City set the goal of building an inland open economic center and strengthened economic cooperation with surrounding areas. In the third stage, from 2010 to 2030, the built-up land increased by 284.759 km2, 251.046 km2, and 295.007 km2, respectively. During this period, Chongqing City became a municipality directly under the central government in the western region, further expanding its opening and cooperation. The municipal government proposed the development strategy of “one district, two centers”, with Jiangbei District as the financial center and Liangjiang New Area as the inland open highland, which accelerated the city’s development and led to a strong demand for land and ecological resources.
According to the findings of this study, we have observed a continuous decrease in overall habitat quality in the study area until 2030. The degradation of habitat quality is gradually spreading towards higher elevation and steeper slope areas within the study area, which is a concerning signal for a typical mountainous urban region like this. Mountainous ecosystems are inherently fragile, and the loss of regional biodiversity not only affects the balance of natural ecosystems but also impacts the ecosystem services essential for human survival, leading to a reduction in accessible natural resources. Furthermore, the decline in habitat quality may exacerbate the extent of environmental pollution, with air and water pollution potentially affecting human health systems. The deterioration of environmental quality, coupled with issues such as noise pollution, traffic congestion, and declining air quality resulting from urbanization, adversely affects the living quality of people, thereby exerting a negative impact on their mental well-being and weakening social cohesion. At the same time, Due to the complex topography of mountainous cities, the destruction of ecosystems and the reduction in habitat quality can increase the frequency of natural disasters such as landslides, debris flows, and earthquakes. Furthermore, urbanization leads to an increase in population density and the density of buildings in the region, which exacerbates the risk of natural disasters in the study area [46].
Therefore, protecting and improving habitat quality is crucial for maintaining human well-being. This study contributes to the further enrichment of ecological conservation theories in mountainous areas and supports the layout and optimization of regional ecological conservation areas, as well as the formulation of policies related to ecological compensation and regulation measures. It provides scientific guidance for the high-quality development of mountainous regions in the upper Yangtze River Basin.

4.2. Mechanisms of Land Use Effects on Spatial and Temporal Evolution of Habitat Quality

Chongqing Urban Agglomeration is a typical mountainous city characterized by its topographical features, including high mountains, canyons, lakes, and diverse ecosystems, which contribute to its complex landscape and diverse habitats [54]. The impact of land use changes on the ecological systems and habitat quality in the region is a crucial and complex issue. Driven by national strategies, the Chongqing Urban Agglomeration plays a vital role in the economic development of the Chengdu-Chongqing dual-city region. To promote local economic growth and industrialization, as well as meet the demands of productive economic activities, there is a need to expand the scale of industrial and commercial land use. Consequently, new manufacturing industrial clusters and supporting infrastructure, such as the designated Western Science City at the border of Shapingba District and Bishan District, and the planned High-Speed Rail New Area, are being developed. This leads to the transformation of natural land types within these areas into industrial parks and commercial centers. The planning and construction of these industrial clusters drive regional economic development, which, in turn, results in population growth and urbanization. The rapid increase in population requires the consumption of a significant amount of land for residential, commercial, and infrastructure development to accommodate the growing population. As a result, a large amount of natural land is converted into built-up areas, which is one of the main driving forces behind land use changes in the Chongqing Urban Agglomeration. Furthermore, to support the industrial parks and residential areas, the development of regional mineral resources, energy resources, and timber resources is necessary. This further transforms the original natural land into mining areas and various types of green spaces. The intense human activities in land transformation can disrupt the natural habitats within the region, causing the fragmentation of once-intact and continuous large-scale natural habitats, especially in the complex terrain of mountainous urban areas [55]. Due to the limitations imposed by the topography, urban development tends to occur in plains and gently sloping areas [56]. On the one hand, the mountain corridors impede urban expansion, and on the other hand, the sprawling of cities on flat areas disconnects ecological regions, affecting the migration and dispersal of species within different ecological systems, reducing habitat connectivity, and thus impacting the reproduction and survival of species. Activities such as mining and logging, which are involved in the exploitation of natural resources, tend to destroy the natural landscape and cause pollution of the air, water sources, and soil. The accumulation of pollutants can lead to soil erosion and further aggravate ecological degradation. Therefore, the cumulative effects of resource exploitation can cause long-term ecological damage to the ecosystems within the region, not only affecting the sustainable development of natural resource extraction but also impacting the overall health and resilience of the system [57]. Moreover, excessive production activities in industrial-agricultural areas within urban regions can result in the accumulation of pollutants, increase the pressure on resource utilization, and cause environmental damage. The land use changes dramatically alter the living environment and resource availability for local species, which in turn affect their adaptability within the region [58]. While some species may benefit from human-induced land transformations, others may struggle to adapt to the rapidly changing environment, leading to a decrease in species abundance and diversity or even endangerment [59].
In summary, land use change has a direct impact on the evolution of habitat quality in mountainous cities. To achieve the coordinated development of socio-economic and ecological systems, it is essential to fully consider the significance of ecological systems and habitat quality for regional sustainable development. From the perspective of land use planning, it is necessary to allocate land use types reasonably, strengthen land protection and restoration, and promote sustainable land use practices.

4.3. Limitations and Future Outlook

This study simulated the land use in the Chongqing metropolitan area in 2030 using the coupled PLUS-InVEST model, driven by policy background, and explored the evolution trajectory of habitat quality in the study area from 1990 to 2030. However, the study has some limitations [60]. The InVEST model, widely used and developed by Stanford University, is employed in this research for evaluating ecosystem services and trade-offs. Although it aids in assessing the impacts of land use decisions on ecosystem services, it has certain limitations that affect its application. These limitations include: (1) reliance on high-quality base data for accurate outputs; (2) limited spatial resolution that may overlook important spatial characteristics; (3) time-scale dependency of habitat quality results, which may vary in reality; and (4) the importance of validating the authenticity of model calculations, a significant issue in ecological modeling. The PLUS (Planning for Land Use Systems) model, extensively used for land use planning and management decision support, also has limitations similar to those of the InVEST model regarding data quality, spatial scale, and temporal scale. Moreover, the PLUS model neglects the influence of human factors when simulating land use changes, which can impact the accuracy of the simulated results. Therefore, we hope to address the following points in future research to improve the relevant directions: (1) further expanding the study area to encompass more geographical regions and ecosystem types for comprehensive data results and discussions, while introducing multiple regions for comparison to better understand the relationship between land use and ecosystems, (2) establishing small-scale monitoring stations to obtain actual observational data on regional ecology, comparing model outputs with real observation data to assess the fit between model results and actual data, and further adjusting model parameters based on the evaluation results, (3) considering the influence of social changes and economic development on land use in future land use simulation studies, constructing relevant indicator systems to assess regional development trends, and providing more accurate support for model outputs, (4) Further delving into the mechanisms by which land use affects habitat quality, encompassing the varying impacts of different land use types and the interplay of influencing factors, will enable a comprehensive understanding. By conducting a thorough analysis of these mechanisms, it will be possible to formulate more precise policy recommendations and implement effective management measures for mountainous urban areas, facilitating the achievement of sustainable development goals for the ecological environment.

5. Conclusions

This article utilizes land use data from 1990 to 2020 in the Chongqing metropolitan area to analyze the characteristics of land use structure changes. The PLUS model is used to simulate the spatial pattern of land use in the study area in 2030 under policy-driven scenarios. The InVEST model is employed to quantitatively assess the evolutionary characteristics of habitat quality in the study area from 1990 to 2030 and to analyze the impact of topographic factors on habitat degradation. The research findings are as follows:
(1)
During the period from 1990 to 2030, significant changes were observed in the land use structure of the study area. From 1990 to 2020, there was an expansion in the area of built-up land, grassland, and water bodies, while the area of cultivated land, forestland, and unused land gradually decreased. The land use simulation results for 2030 indicate that, under the influence of urban planning and ecological control policies, there is an increase in the area of forestland, built-up land, and water bodies, while there is a decrease in the area of cultivated land, grassland, and unused land;
(2)
During the period from 1990 to 2030, the habitat quality in the study area exhibited significant spatial heterogeneity, with an overall declining trend across different regions, gradually forming a spatial pattern of “lower in the central-western part and higher in the southeastern part”. The low-value habitat areas were primarily concentrated in the middle of the metropolitan area and expanded outward, radiating towards the western part of the study area, showing more pronounced changes in these areas. The high-value habitat areas were mainly concentrated in the southeastern part of the study area, including Nanchuan District, Qijiang District, Jiangjin District, and Fuling District, as well as mountain corridor regions like Huaying Mountain, where the changes in these areas were relatively stable;
(3)
The spatial distribution of habitat quality in the study area exhibits a significant topographic gradient effect. The dominant position of habitat degradation gradually shifted from regions with gentle topographic gradients to those with steeper gradients. However, with the rapid socio-economic development in the study area, the degradation of higher-level habitat quality areas expanded towards higher-altitude and steeper slope regions within the study area;
(4)
The expansion of built-up land is the primary cause of habitat degradation in the study area. Between 1990 and 2030, under the context of urban planning and economic development in the study area, built-up land expanded to varying degrees at different stages, encroaching upon cultivated land and ecological land. This has resulted in a sustained decline in overall habitat quality, thereby increasing the risk of ecological and social issues.
Based on the conclusions of this study, the following recommendations are proposed to protect and improve habitat quality in the research area,: (1) Prioritize the establishment of ecologically protected areas in regions with poor habitat quality. Strengthen environmental monitoring and ecological protection efforts in these areas to prevent further degradation of the ecological environment. (2) Control land use from an urban planning perspective. Promote the intensive use of land resources while considering the preservation of urban green spaces and natural landscapes in the planning process. These areas can provide ecosystem services and support the overall health of the regional ecosystem, balancing urbanization and ecological conservation. (3) Utilize technologies such as big data analysis, unmanned aerial vehicles (UAVs), and monitoring sensors to establish a regional ecological system health monitoring network. Collect and analyze monitoring data to assess the health status of the ecosystem in real time, providing scientific evidence to support decision-making and policy formulation by relevant departments. (4) Strengthen public awareness and education on ecological conservation. Guide the public to raise environmental awareness and foster a culture of protecting the ecological environment. These measures can effectively protect and improve the ecological environment of the Chongqing metropolitan area, achieving a harmonious development between the environment and the economy.

Author Contributions

Conceptualization, T.M. (Taquan Ma); methodology, R.L. and Z.L.; software, T.M. (Taquan Ma); validation, T.M. (Taquan Ma); formal analysis, T.M. (Taquan Ma) and Z.L.; investigation, T.M. (Taquan Ma) and Z.L.; resources, Z.L.; data curation, T.M. (Taquan Ma) and R.L.; writing—original draft preparation, T.M. (Taquan Ma); writing—review and editing, T.M. (Taquan Ma); visualization, T.M. (Taquan Ma) and T.M. (Tongtu Ma); supervision, Z.L. and R.L.; project administration, Z.L.; funding acquisition, T.M. (Tongtu Ma) and R.L. All authors have read and agreed to the published version of the manuscript.

Funding

This study was supported by a major research project of the Chongqing Municipal Education Commission Science Foundation, No. KJZD-M202200502 and by the National Natural Science Foundation of China, No. 42071217.

Informed Consent Statement

Informed consent was obtained from all subjects involved in the study.

Data Availability Statement

The data presented in this study are available upon reasonable request.

Acknowledgments

We thank the beneficial comments from anonymous expert for improving our manuscript.

Conflicts of Interest

The authors declare no conflict of interest.

References

  1. Mooney, H.; Larigauderie, A.; Cesario, M.; Elmquist, T.; Hoegh-Guldberg, O.; Lavorel, S.; Mace, G.M.; Palmer, M.; Scholes, R.; Yahara, T. Biodiversity, climate change, and ecosystem services. Curr. Opin. Environ. Sustain. 2009, 1, 46–54. [Google Scholar]
  2. Johnson, M.D. Measuring habitat quality: A review. Condor 2007, 109, 489–504. [Google Scholar]
  3. Koellner, T.; Bonn, A.; Arnhold, S.; Bagstad, K.J.; Fridman, D.; Guerra, C.A.; Kastner, T.; Kissinger, M.; Kleemann, J.; Kulhlicke, C.; et al. Guidance for assessing interregional ecosystem service flows. Ecol. Indic. 2019, 105, 92–106. [Google Scholar] [CrossRef]
  4. Rahimi, L.; Malekmohammadi, B.; Yavari, A.R. Assessing and modeling the impacts of wetland land cover changes on water provision and habitat quality ecosystem services. Nat. Resour. Res. 2020, 29, 3701–3718. [Google Scholar] [CrossRef]
  5. Newbold, T.; Hudson, L.N.; Hill, S.L.L.; Contu, S.; Lysenko, I.; Senior, R.A.; Börger, L.; Bennett, D.J.; Choimes, A.; Collen, B.; et al. Global effects of land use on local terrestrial biodiversity. Nature 2015, 520, 45–50. [Google Scholar]
  6. Zhang, X.; Zhou, J.; Li, G.; Chen, C.; Li, M.; Luo, J. Spatial pattern reconstruction of regional habitat quality based on the simulation of land use changes from 1975 to 2010. J. Geogr. Sci. 2020, 30, 601–620. [Google Scholar] [CrossRef]
  7. Dai, L.; Li, S.; Lewis, B.J.; Wu, J.; Yu, D.; Zhou, W.; Zhou, L.; Wu, S. The influence of land use change on the spatial–temporal variability of habitat quality between 1990 and 2010 in Northeast China. J. For. Res. 2019, 30, 2227–2236. [Google Scholar]
  8. Zhang, X.; Song, W.; Lang, Y.; Feng, X.; Yuan, Q.; Wang, J. Land use changes in the coastal zone of China’s Hebei Province and the corresponding impacts on habitat quality. Land Use Policy 2020, 99, 104957. [Google Scholar] [CrossRef]
  9. Millennium Ecosystem Assessment. 2001. Available online: http://chapter.ser.org/europe/files/2012/08/Harris.pdf (accessed on 23 March 2023).
  10. Hasan, S.S.; Zhen, L.; Miah, M.G.; Ahamed, T.; Samie, A. Impact of land use change on ecosystem services: A review. Environ. Dev. 2020, 34, 100527. [Google Scholar]
  11. Zhou, F.C.; Han, X.; Tang, S.; Song, X.; Wang, H. An improved model for evaluating ecosystem service values using land use/cover and vegetation parameters. J. Meteorol. Res. 2021, 35, 148–156. [Google Scholar] [CrossRef]
  12. He, J.; Huang, J.; Li, C. The evaluation for the impact of land use change on habitat quality: A joint contribution of cellular automata scenario simulation and habitat quality assessment model. Ecol. Model. 2017, 366, 58–67. [Google Scholar] [CrossRef]
  13. Xu, L.; Chen, S.S.; Xu, Y.; Li, G.; Su, W. Impacts of land-use change on habitat quality during 1985–2015 in the Taihu Lake Basin. Sustainability 2019, 11, 3513. [Google Scholar] [CrossRef] [Green Version]
  14. Ren, Y.; Lü, Y.; Comber, A.; Fu, B.; Harris, P.; Wu, L. Spatially explicit simulation of land use/land cover changes: Current coverage and future prospects. Earth-Sci. Rev. 2019, 190, 398–415. [Google Scholar]
  15. Mas, J.F.; Kolb, M.; Paegelow, M.; Olmedo, M.T.C.; Houet, T. Inductive pattern-based land use/cover change models: A comparison of four software packages. Environ. Model. Softw. 2014, 51, 94–111. [Google Scholar] [CrossRef] [Green Version]
  16. Liu, X.; Liang, X.; Li, X.; Xu, X.; Ou, J.; Chen, Y.; Li, S.; Wang, S.; Pei, F. A future land use simulation model (FLUS) for simulating multiple land use scenarios by coupling human and natural effects. Landsc. Urban Plan. 2017, 168, 94–116. [Google Scholar] [CrossRef]
  17. Wang, H.; Stephenson, S.R.; Qu, S. Modeling spatially non-stationary land use/cover change in the lower Connecticut River Basin by combining geographically weighted logistic regression and the CA-Markov model. Int. J. Geogr. Inf. Sci. 2019, 33, 1313–1334. [Google Scholar] [CrossRef]
  18. Ghosh, P.; Mukhopadhyay, A.; Chanda, A.; Mondal, P.; Akhand, A.; Mukherjee, S.; Nayak, S.K.; Ghosh, S.; Mitra, D.; Ghosh, T.; et al. Application of Cellular automata and Markov-chain model in geospatial environmental modeling-A review. Remote Sens. Appl. Soc. Environ. 2017, 5, 64–77. [Google Scholar] [CrossRef]
  19. Noszczyk, T. A review of approaches to land use changes modeling. Hum. Ecol. Risk Assess. Int. J. 2019, 25, 1377–1405. [Google Scholar] [CrossRef]
  20. Veldkamp, A.; Fresco, L.O. CLUE: A conceptual model to study the conversion of land use and its effects. Ecol. Model. 1996, 85, 253–270. [Google Scholar] [CrossRef]
  21. Verburg, P.H.; Soepboer, W.; Veldkamp, A.; Limpiada, R.; Espaldon, V.; Mastura, S.S. Modeling the spatial dynamics of regional land use: The CLUE-S model. Environ. Manag. 2002, 30, 391–405. [Google Scholar] [CrossRef] [PubMed]
  22. Pijanowski, B.C.; Brown, D.G.; Shellito, B.A.; Manik, G.A. Using neural networks and GIS to forecast land use changes: A land transformation model. Comput. Environ. Urban Syst. 2002, 26, 553–575. [Google Scholar]
  23. Liang, X.; Guan, Q.; Clarke, K.C.; Liu, S.; Wang, B.; Yao, Y. Understanding the drivers of sustainable land expansion using a patch-generating land use simulation (PLUS) model: A case study in Wuhan, China. Comput. Environ. Urban Syst. 2021, 85, 101569. [Google Scholar]
  24. Fan, X.; Gu, X.; Yu, H.; Long, A.; Tiando, D.S.; Ou, S.; Li, J.; Rong, Y.; Tang, G.; Zheng, Y.; et al. The spatial and temporal evolution and drivers of habitat quality in the Hung River Valley. Land 2021, 10, 1369. [Google Scholar]
  25. He, B.; Chang, J.; Guo, A.; Wang, Y.; Wang, Y.; Li, Z. Assessment of river basin habitat quality and its relationship with disturbance factors: A case study of the Tarim River Basin in Northwest China. J. Arid Land 2022, 14, 167–185. [Google Scholar]
  26. Gong, J.; Xie, Y.; Cao, E.; Huang, Q.; Li, H. Integration of InVEST-habitat quality model with landscape pattern indexes to assess mountain plant biodiversity change: A case study of Bailongjiang watershed in Gansu Province. J. Geogr. Sci. 2019, 19, 1193–1210. [Google Scholar]
  27. Yang, J.; Zhu, Y.; Song, W.; Zhang, J.; Zhang, L.; Luo, X. Evaluation of ecological environment quality in Laizhou Bay based on habitat quality and ecological response. J. Ecol. 2014, 34, 105–114. [Google Scholar]
  28. Brown, G. The relationship between social values for ecosystem services and global land cover: An empirical analysis. Ecosyst. Serv. 2013, 5, 58–68. [Google Scholar]
  29. Villa, F.; Ceroni, M.; Bagstad, K.; Johnson, G.; Krivov, S. ARIES (Artificial Intelligence for Ecosystem Services): A new tool for ecosystem services assessment, planning, and valuation. In Proceedings of the 11th Annual BIOECON Conference on Economic Instruments to Enhance the Conservation and Sustainable Use of Biodiversity, Venice, Italy, 21–22 September 2009. [Google Scholar]
  30. Nelson, E.; Mendoza, G.; Regetz, J.; Polasky, S.; Tallis, H.; Cameron, D.; Chan, K.M.; Daily, G.C.; Goldstein, J.; Kareiva, P.M.; et al. Modeling multiple ecosystem services, biodiversity conservation, commodity production, and tradeoffs at landscape scales. Front. Ecol. Environ. 2009, 7, 4–11. [Google Scholar] [CrossRef]
  31. Sherrouse, B.C.; Semmens, D.J.; Clement, J.M. An application of Social Values for Ecosystem Services (SolVES) to three national forests in Colorado and Wyoming. Ecol. Indic. 2014, 36, 68–79. [Google Scholar]
  32. Scowen, M.; Athanasiadis, I.N.; Bullock, J.M.; Eigenbrod, F.; Willcock, S. The current and future uses of machine learning in ecosystem service research. Sci. Total Environ. 2021, 799, 149263. [Google Scholar]
  33. Bai, L.; Xiu, C.; Feng, X.; Liu, D. Influence of urbanization on regional habitat quality: A case study of Changchun City. Habitat Int. 2019, 93, 102042. [Google Scholar] [CrossRef]
  34. Wu, L.; Sun, C.; Fan, F. Estimating the characteristic spatiotemporal variation in habitat quality using the invest model—A case study from Guangdong–Hong Kong–Macao Greater Bay Area. Remote Sens. 2021, 13, 1008. [Google Scholar]
  35. Yang, Z.; Wang, S.; Guo, M.; Tian, J.; Zhang, Y. Spatiotemporal Differentiation of Territorial Space Development Intensity and Its Habitat Quality Response in Northeast China. Land 2021, 10, 573. [Google Scholar]
  36. Zeng, C.; He, J.; He, Q.; Mao, Y.; Yu, B. Assessment of Land Use Pattern and Landscape Ecological Risk in the Chengdu-Chongqing Economic Circle, Southwestern China. Land 2022, 11, 659. [Google Scholar] [CrossRef]
  37. Ding, Y.; Peng, J. Impacts of urbanization of mountainous areas on resources and environment: Based on ecological footprint model. Sustainability 2018, 10, 765. [Google Scholar] [CrossRef] [Green Version]
  38. Xie, B.; Zhang, M. Spatio-temporal evolution and driving forces of habitat quality in Guizhou Province. Sci. Rep. 2023, 13, 6908. [Google Scholar] [CrossRef]
  39. Han, H.; Zhang, Y.; Liu, Y.; Yu, X.; Wang, J. Spatiotemporal changes of the habitat quality and the human activity intensity and their correlation in mountainous cities. J. Environ. Eng. Landsc. Manag. 2022, 30, 472–483. [Google Scholar] [CrossRef]
  40. Luan, Y.; Huang, G.; Zheng, G.; Wang, Y. Correlation between Spatio-Temporal Evolution of Habitat Quality and Human Activity Intensity in Typical Mountain Cities: A Case Study of Guiyang City, China. Int. J. Environ. Res. Public Health 2022, 19, 14294. [Google Scholar]
  41. Wang, S.; Lu, F.; Wei, G. Direct and Spillover Effects of Urban Land Expansion on Habitat Quality in Chengdu-Chongqing Urban Agglomeration. Sustainability 2022, 14, 14931. [Google Scholar]
  42. Dong, J.; Zhang, Z.; Liu, B.; Zhang, X.; Zhang, W.; Chen, L. Spatiotemporal variations and driving factors of habitat quality in the loess hilly area of the Yellow River Basin: A case study of Lanzhou City, China. J. Arid Land 2022, 14, 637–652. [Google Scholar] [CrossRef]
  43. Ren, Y.; Liu, X.; Xu, X.; Sun, S.; Zhao, L.; Liang, X.; Zeng, L. Multi-scenario land use change simulation in Beijing-Tianjin-Hebei based on FLUS-InVEST model and its impact on ecosystem service function. J. Ecol. 2023, 43, 4473–4487. [Google Scholar]
  44. Chen, L.T.; Cai, H.S.; Zhang, T.; Zhang, X.L.; Zeng, H. Multi-scenario simulation analysis of land use in Raohe River Basin based on Markov-FLUS model. J. Ecol. 2022, 42, 3947–3958. [Google Scholar]
  45. Li, L.; Huang, X.; Yang, H. Scenario-based urban growth simulation by incorporating ecological-agricultural-urban suitability into a future land use simulation model. Cities 2023, 137, 104334. [Google Scholar] [CrossRef]
  46. Yang, C.; Zeng, W.; Yang, X. Coupling coordination evaluation and sustainable development pattern of geo-ecological environment and urbanization in Chongqing municipality, China. Sustain. Cities Soc. 2020, 61, 102271. [Google Scholar] [CrossRef]
  47. Li, W.; Wang, Y.; Xie, S.; Cheng, X. Coupling coordination analysis and spatiotemporal heterogeneity between urbanization and ecosystem health in Chongqing municipality, China. Sci. Total Environ. 2021, 791, 148311. [Google Scholar] [CrossRef]
  48. Ouyang, X.; Tang, L.; Wei, X.; Li, Y. Spatial interaction between urbanization and ecosystem services in Chinese urban agglomerations. Land Use Policy 2021, 109, 105587. [Google Scholar] [CrossRef]
  49. Xu, L.; Liu, X.; Tong, D.; Liu, Z.; Yin, L.; Zheng, W. Forecasting urban land use change based on cellular automata and the PLUS model. Land 2022, 11, 652. [Google Scholar] [CrossRef]
  50. Gao, L.; Tao, F.; Liu, R.; Wang, Z.; Leng, H.; Zhou, T. Multi-scenario simulation and ecological risk analysis of land use based on the PLUS model: A case study of Nanjing. Sustain. Cities Soc. 2022, 85, 104055. [Google Scholar]
  51. Zhang, S.; Zhong, Q.; Cheng, D.; Xu, C.; Chang, Y.; Lin, Y.; Li, B. Landscape ecological risk projection based on the PLUS model under the localized shared socioeconomic pathways in the Fujian Delta region. Ecol. Indic. 2022, 136, 108642. [Google Scholar] [CrossRef]
  52. Deng, Y.; Jiang, W.G.; Wang, W.J.; Lv, J.X.; Chen, K. Urban expansion causes habitat quality decline in the Beijing-Tianjin-Hebei region. J. Ecol. 2018, 38, 4516–4525. [Google Scholar]
  53. Liu, Y.T.; Yang, Z.Z.; Xu, G.L.; Liu, B.; Zhang, F.L.; Chi, J.Y. Study on the response of habitat quality to urbanization in the urban zone of Wanjiang River based on MGWR model. Geoscience 2023, 43, 280–290. [Google Scholar]
  54. Grêt-Regamey, A.; Brunner, S.H.; Kienast, F. Mountain ecosystem services: Who cares? Mt. Res. Dev. 2012, 32, S1. [Google Scholar] [CrossRef]
  55. Savard, J.-P.L.; Clergeau, P.; Mennechez, G. Biodiversity concepts and urban ecosystems. Landsc. Urban Plan. 2000, 48, 131–142. [Google Scholar] [CrossRef]
  56. Yang, X.; Lo, C.P. Modelling urban growth and landscape changes in the Atlanta metropolitan area. Int. J. Geogr. Inf. Sci. 2003, 17, 463–488. [Google Scholar] [CrossRef]
  57. Yang, Y. Evolution of habitat quality and association with land-use changes in mountainous areas: A case study of the Taihang Mountains in Hebei Province, China. Ecol. Indic. 2021, 129, 107967. [Google Scholar]
  58. Dincer, I. Renewable energy and sustainable development: A crucial review. Renew. Sustain. Energy Rev. 2000, 4, 157–175. [Google Scholar] [CrossRef]
  59. Wang, R.; Zhao, J.; Chen, G.; Lin, Y.; Yang, A.; Cheng, J. Coupling PLUS–InVEST Model for Ecosystem Service Research in Yunnan Province, China. Sustainability 2022, 15, 271. [Google Scholar] [CrossRef]
  60. Zeleke, G.; Hans, H. Implications of land use and land cover dynamics for mountain resource degradation in the Northwestern Ethiopian highlands. Mt. Res. Dev. 2001, 21, 184–191. [Google Scholar] [CrossRef] [Green Version]
Figure 1. Study area (Chongqing Metropolitan Area, China). Note: (a) The geographic location of the study area within China. (b) Range of simulated spatial units in the study area. (c) The location conditions and elevation of the study area.
Land 12 01488 g001
Figure 2. Research framework.
Land 12 01488 g002
Figure 3. Land use expansion in the Chongqing metropolitan area from 1990 to 2020 and expansion size.
Land 12 01488 g003
Figure 4. Land use simulation results of the Chongqing metropolitan area in 2030.
Land 12 01488 g004
Figure 5. Changes in average habitat quality across different regions of the Chongqing metropolitan area from 1990 to 2030.
Land 12 01488 g005
Figure 6. The changes in the area of cold and hotspots of habitat quality in the Chongqing metropolitan area from 1990 to 2030.
Land 12 01488 g006
Figure 7. Spatial analysis of cold and hot spots of habitat quality in the Chongqing metropolitan area from 1990 to 2030.
Land 12 01488 g007
Figure 8. Habitat degradation index along the topographic gradient from 1990 to 2030.
Land 12 01488 g008
Table 1. List of land use simulation study data.
Data TypeData PropertiesDescription
NameFormatYear
Land Use DataPrimary Classification Land Use DataRaster 1990, 1995, 2000, 2005, 2010, 2015, 2020Source from the Resource and Environmental Science and Data Center, Chinese Academy of Sciences (www.resdc.cn)
Constraint/
planning data
Land use constraint dataVector -Extraction of 2020 land use data watershed class I all land types (including rivers and canals, lakes, reservoirs and ponds, mudflats and beaches)
Planning and Construction ScopeExtracted from the Urban and Rural Master Development Plan of 21 districts and counties and Guang’an City
Scope of key ecological restoration projectsSource from “Chongqing Municipal Territorial Spatial Ecological Protection and Restoration Plan (2021–2035)” and “Guang’an City Urban Master Plan (2013–2030)” of Sichuan Province
Socio-economic dataPopulation densityRaster 2020Cell phone signaling data (from China Unicom Network Communications Group Limited)
GDPData Center for Resources and Environment, Chinese Academy of Sciences (http://www.resde.cn)
Distance to adjacent roads andOpenStreetMap (https://www.openstreetmap.org/)
Distance to railroad
Proximity to government officesUse Python to crawl, clean and filter the relevant location attribute values of Gaode Map Open Platform (https://lbs.amap.com/) to obtain
Climate and environmental dataDEMRaster 2020Data Center for Resources and Environment, Chinese Academy of Sciences (http://www.resde.cn)
Average annual temperature
Average annual precipitation
Distance to adjacent open water
Table 2. Weight and maximum impact distance of the stress factor.
Threat FactorsMax. Impact Distance (Unit/km)WeightsSpatial Recession Type
Cultivated land40.6Linear
Construction Land81Exponential
Unused land60.5Linear
Table 3. Parameters of sensitivity of different landscapes to threat factors.
Land Use TypesHabitat SuitabilityThreat Factors
Cultivated LandConstruction LandUnused Land
Cultivated land0.60.20.50.4
Woodland10.80.90.4
Grassland0.70.80.60.5
Waters0.90.60.80.4
Construction Land0000
Unused land0.40.50.90.2
Table 4. Land use transfer matrix for the Chongqing metropolitan area (km2).
19902020
GrasslandCultivated LandConstruction LandWoodlandWatersUnused LandTotal
Grassland0.182.811.782.122.15-9.03
Cultivated land9.2822,215.781151.952322.55101.620.8625,802.04
Construction Land0.0217.77183.200.1833.550.00234.72
Woodland1.911516.5518.966778.672.380.018318.48
Waters0.0194.8022.708.80527.520.00653.83
Unused land--0.03-0.05-0.08
Total11.4023,847.701378.629112.32667.260.8735,018.18
Table 5. Changes in the area of different land cover types from 2020 to 2030 under different simulation units (Area/km2 and Proportion/%).
Simulation UnitYearCultivated LandWoodlandGrasslandWatersConstruction LandUnused Land
Natural
Simulation
20201543.46
(74.17%)
508.95
(24.46%)
0.17
(0.01%)
13.20
(0.63%)
15.26
(0.73%)
0.01
(0.00%)
20301537.92
(73.90%)
509.43
(24.48%)
0.17
(0.01%)
12.39
(0.60%)
21.12
(1.01%)
0.02
(0.00%)
Changes−5.54
(−0.27%)
0.48
(0.02%)
0.00
(0.00%)
−0.81
(−0.04%)
5.86
(0.28%)
0.00
(0.00%)
Ecological control2020578.01
(55.94%)
392.78
(38.02%)
0.32
(0.03%)
43.92
(4.25%)
18.16
(1.76%)
0.01
(0.00%)
2030505.61
(48.94%)
455.84
(44.12%)
0.63
(0.06%)
51.01
(4.94%)
20.11
(1.95%)
0.01
(0.00%)
Changes−72.40
(−7.01%)
63.06
(6.10%)
0.31
(0.03%)
7.09
(0.69%)
1.95
(0.19%)
0.00
(0.00%)
Construction Development2020263.35
(67.94%)
9.52
(2.46%)
0.65
(0.17%)
9.61
(2.48%)
104.44
(26.94%)
0.07
(0.02%)
2030213.42
(55.06%)
12.15
(3.14%)
0.32
(0.08%)
9.42
(2.43%)
152.30
(39.29%)
0.02
(0.00%)
Changes−49.93
(−12.88%)
2.63
(0.68%)
−0.33
(−0.08%)
−0.18
(−0.05%)
47.86
(12.35%)
−0.05
(−0.01%)
Table 6. Changes in the area and proportion of habitat quality grades in the Chongqing metropolitan area from 1990 to 2030 (Area/km2 and Proportion/%).
Habitat Quality LevelYear
19901995200020052010201520202030
Very low566.35
(16.17%)
617.68
(17.64%)
580.27
(16.57%)
662.59
(18.92%)
758.05
(21.65%)
862.81
(24.64%)
951.69
(27.18%)
1174.18
(33.53%)
Low2276.26
(65.00%)
2180.26
(62.26%)
2210.24
(63.12%)
2183.30
(62.35%)
2064.16
(58.94%)
2001.66
(57.16%)
1938.12
(55.35%)
1714.11
(48.95%)
Medium483.33
(13.80%)
504.46
(14.41%)
499.54
(14.26%)
475.19
(13.57%)
486.77
(13.90%)
458.10
(13.08%)
437.10
(12.48%)
421.11
(12.03%)
High54.89
(1.57%)
55.72
(1.59%)
58.56
(1.67%)
49.81
(1.42%)
54.26
(1.55%)
52.74
(1.51%)
51.91
(1.48%)
57.67
(1.65%)
Very high121.06
(3.46%)
143.77
(4.11%)
153.28
(4.38%)
131.00
(3.74%)
138.64
(3.96%)
126.59
(3.61%)
123.07
(3.51%)
134.81
(3.85%)
Table 7. Changes in the area and proportion of habitat quality grades in the Chongqing metropolitan area from 1990 to 2030 (Area/km2).
Types of Land Cover Conversion1990–19951995–20002000–20052005–20102010–20152015–20202020–2030
Cultivated land → Construction Land70.248 94.207 144.690 219.140 283.616 250.055 291.589
Cultivated land → Unused land--0.005 0.044 0.022 0.117 0.009
Woodland → Cultivated land31.946 36.710 76.623 32.832 50.761 37.670 0.832
Woodland → Grassland-0.480 0.201 0.119 0.234 0.256 0.032
Woodland → Waters0.012 0.005 0.473 0.075 0.094 0.026 0.111
Woodland → Construction Land0.348 0.315 0.264 0.284 0.881 0.711 3.028
Grassland → Construction Land0.058 -0.036 0.047 0.032 0.084 -
Waters → Cultivated land0.109 0.168 0.230 0.192 0.114 0.214 -
Waters → Grassland-0.044 0.043 0.008 0.005 0.002 -
Waters → Construction Land0.179 0.308 0.260 0.261 0.230 0.196 0.391
Disclaimer/Publisher’s Note: The statements, opinions and data contained in all publications are solely those of the individual author(s) and contributor(s) and not of MDPI and/or the editor(s). MDPI and/or the editor(s) disclaim responsibility for any injury to people or property resulting from any ideas, methods, instructions or products referred to in the content.

