Article

Research on the Spatial-Temporal Variation of Resources and Environmental Carrying Capacity and the Impact of Supply-Side Reform on Them: Evidence from Provincial-Level Data in China

1
College of Public Administration, Nanjing Agricultural University, Nanjing 210095, China
2
School of Government, Beijing Normal University, Beijing 100875, China
*
Author to whom correspondence should be addressed.
Land 2023, 12(8), 1584; https://doi.org/10.3390/land12081584
Submission received: 27 June 2023 / Revised: 4 August 2023 / Accepted: 9 August 2023 / Published: 11 August 2023

Abstract

:
Both the resource environmental carrying capacity (RECC) and supply-side reform are crucial for achieving sustainable national developments. However, current research on RECC lacks consideration of the supply-side industrial structures and factors, and the relationship between RECC and supply-side reform remains unrevealed. In order to measure the RECC in China at the provincial level from 2005 to 2019, this study constructs an evaluation index based on industrial structure. It utilizes the TOPSIS model coupled with the supply-demand balance method and environmental capacity method while gathering and summarizing the indicators related to natural resource support, socio-economic support, and environmental factor accommodation. The analysis of evolutionary characteristics and spatial heterogeneity is carried out by statistical and spatial econometric methods, and the impact of the supply-side reform policy on RECC is examined using a bidirectional fixed-effect model. The findings indicate the following: (1) China’s RECC demonstrates a clear upward trend, with higher values in the west and lower values in the east. The average annual growth rate from 2016 to 2019 (18.12%) is nearly three times that of the period from 2005 to 2010 (6.28%), indicating a significant acceleration in the increase in RECC post-supply-side reform. (2) The spatial agglomeration of RECC and its sub-system support is observed, as the allocation of nature resources and markets promotes the convergence of regional differences and enhances the spatial convergence of the RECC. (3) The implementation of supply-side reform policies has a positive impact on RECC, with industrial upgrading playing a particularly significant role. This study provides a new idea and method for the selection of evaluation indicators, quantitatively assessing province-level RECC and understanding the potential effects of national supply-side policies on RECC.

1. Introduction

In the context of rapid urbanization, climate change, biodiversity loss, and environmental pollution are already significantly impacting the human living environment [1,2,3]. The contradiction between human social and economic development, as well as resource and environmental protection, has long been a pressing concern for scholars worldwide. Addressing this issue is also crucial for achieving the United Nations Sustainable Development Goals (SDGs) [4]. For over 40 years, China has pursued a conventional economic growth model characterized by high investment, energy consumption, and emissions, which has ignored the limited capacity of resources and the environment. This has resulted in a growing contradiction between the conservation of resources and the environment and the development of human social and economic systems. Consequently, issues such as water shortages, unsustainable energy consumption, unprecedented climate change, and frequent air pollution events have emerged. China’s conventional economic growth model has led to 43% of its regions and 44% of its population being at risk of sustainable development [3]. These risks manifest in various ways, including annual water shortages that exceed 500 billion cubic meters in China [5], below-standard surface water quality in 51 megacities [6], and air pollution affecting 1.08 million km2 of land in the eastern provinces [1]. In order to tackle these issues in China, the 20th National Congress of the Communist Party of China put forward the proposal to establish a sound system for the market-oriented allocation of resources and environmental factors, as well as deepening the efforts to prevent and control environmental pollution to enhancing regional resources and environmental carrying capacity. Therefore, co-ordinating resource utilization, economic development, and environmental protection is becoming increasingly critical for future social and economic development.
The concept of “resource and environmental carrying capacity” (RECC) refers to the maximum capacity of a region’s natural resources and environment to support social and economic demands while maintaining stability [6]. It is a vital indicator for assessing a region’s sustainable development and plays an integral role in spatial planning. Major function-oriented zoning in China is employed to clearly define and optimize development areas, key development areas, restricted development areas, and prohibited development areas. It also sets (limits) resource consumption boundaries and other measures for various types of development activities, ensuring that development activities remain within the RECC. Therefore, RECC serves as a crucial reference point for ensuring ecological stability, conserving natural resources, promoting resource-efficient utilization, addressing resource supply challenges, and mitigating environmental issues [7].
The concept of RECC was first introduced in the “United States Agricultural Statistical Yearbook” in 1906 (USDA, 1907 [8]). Since then, the United Nations Food and Agriculture Organization (FAO) has proposed various research and evaluation methods related to RECC. Foreign academic communities have subsequently explored theories and methods related to the overconsumption of resources, ecosystem degradation, and environmental pollution, primarily focusing on micro and industrial RECC [9]. Millington (1973) and Slessor (1983) developed a comprehensive evaluation index system for regional RECC under the framework of UNESCO, considering factors like land, water, energy, economics, and climate [10,11]. The paper by Arrow et al. (1995) titled “Economic Growth, Carrying Capacity, and Environment” was published in Science and initiated a comprehensive study on the integrated assessment of the carrying capacity of economic-resource-environment systems from the perspective of resource and environmental constraints [12]. In the early 21st century, domestic research on RECC has primarily focused on expanding the index system and exploring comprehensive methods for evaluating the individual elements and regions, which have been applied to various quantitative research fields. Previous research has employed methods from diverse disciplines, including ecological economics, biophysics, geography, planning, and demography [7,13,14]. Xu et al. (2018) utilized a comprehensive RECC indicator in input-output factors and a governance supply-demand balance model, focusing on Jiangsu Province as a typical research area [15]. Yuan et al. (2023) studied water carrying capacity in prefecture-lever cities in Hubei Province [16]. Zhang et al. (2022) use a three-dimensional balance model to evaluate the comprehensive RECC of the Southwest Guangxi Karst-Beidu Gulf at the county level [2]. Zhao et al. (2022) introduced the grey relational projection method on the basis of the TOPSIS model to evaluate and analyze the RECC of Jiaozuo City [17]. Unfortunately, those studies lack consideration for industrial structures, and only a few studies researched the comprehensive evaluation of RECC at the provincial level. Moreover, the evaluation indicators and elements selected for RECC research vary across regions, departments, and fields, resulting in a lack of universality and generalizability in provincial-level RECC evaluation studies.
In recent years, the Chinese government has implemented supply-side reforms to address the economic imbalances resulting from the country’s structural transformation. The approach, known as “three reductions, one optimization, and one compensation”, aims to optimize resource allocation and improve supply system efficiency and quality. Market-oriented reforms have been introduced to rectify market distortions and facilitate cross-regional, cross-sectoral, and cross-industry resource allocation, such as land, capital, and labor. Structural reforms in the agricultural sector have addressed the issues of excessive and inadequate supply while promoting technological innovation to enhance quality, brand reputation, safety, and environmentally friendly consumption [18]. Moreover, the industrial sector has implemented market-oriented mechanisms to optimize the allocation of both resource and non-resource factors. Increased investment in science, technology, capital, talent, information, and innovation has been prioritized to transition the economy from being driven by factors and efficiency to being driven by innovation. The environmental protection department has played a crucial role in addressing bottlenecks that hinder sustainable economic growth.
Both supply-side reform and resource and environmental carrying capacity (RECC) are crucial for achieving sustainable national developments. Investigating the impact of supply-side policies on RECC can lead to a more comprehensive understanding of the evolutionary process of these capacities. Such research not only enhances predictions of the future RECC but also aids in optimizing policy implementation structures. Thus, examining the impact of national policies on RECC has become increasingly important. For instance, Niu and Sun (2019) identified a coupling relationship between economic growth, development patterns, and supporting systems and empirically demonstrated the impact of technological progress on resource utilization efficiency and pollution emissions [19]. Hao and Deng (2019) validated the effects of regional innovation and technology absorption on the structure of energy consumption [20]. Wang et al. (2021) discovered that industrial structure upgrading had an influence on energy utilization efficiency [21]. Zhang (2020) [22] determined that agricultural supply-side reform can enhance the quality and efficiency of the agricultural system. Kongbuamai et al. (2021) and Appiah et al. (2023) revealed that environmental policy, renewable energy, and innovation for reducing the industrial ecological footprint can improve RECC [23,24]. Kong et al. (2023) conducted a study on the adaptability analysis of water pollution and advanced industrial structures [25]. However, the existing research has mainly focused on the impacts of technological change, industrial structures, and economic development on RECC, leaving the impact of supply-side reform on RECC undisclosed. Therefore, more comprehensive and in-depth research is necessary to explore the impact and mechanisms of supply-side reform on RECC. This article provides a detailed explanation of the supply-side reform strategy and examines its impact on RECC in China.
The article pursues three primary objectives in studying this topic. First, this article calculates the RECC for each Chinese province from 2005 to 2019. Second, it investigates the spatial-temporal patterns of provincial RECC levels. Last, it employs a bidirectional fixed-effect model to empirically examine the impact of supply-side reform policies on RECC. The rest of this paper is organized as follows. Section 2 introduces the theoretical foundation and analytical framework to evaluate province-level RECC. This section also outline the data, model index, and methods used for evaluating RECC. Section 3 presents spatial analysis and the estimated results, followed by discussion in Section 4. Finally, Section 5 summarizes our key findings and policy rec-ommendations as the conclusion.

2. Theoretical Framework and Research Methods

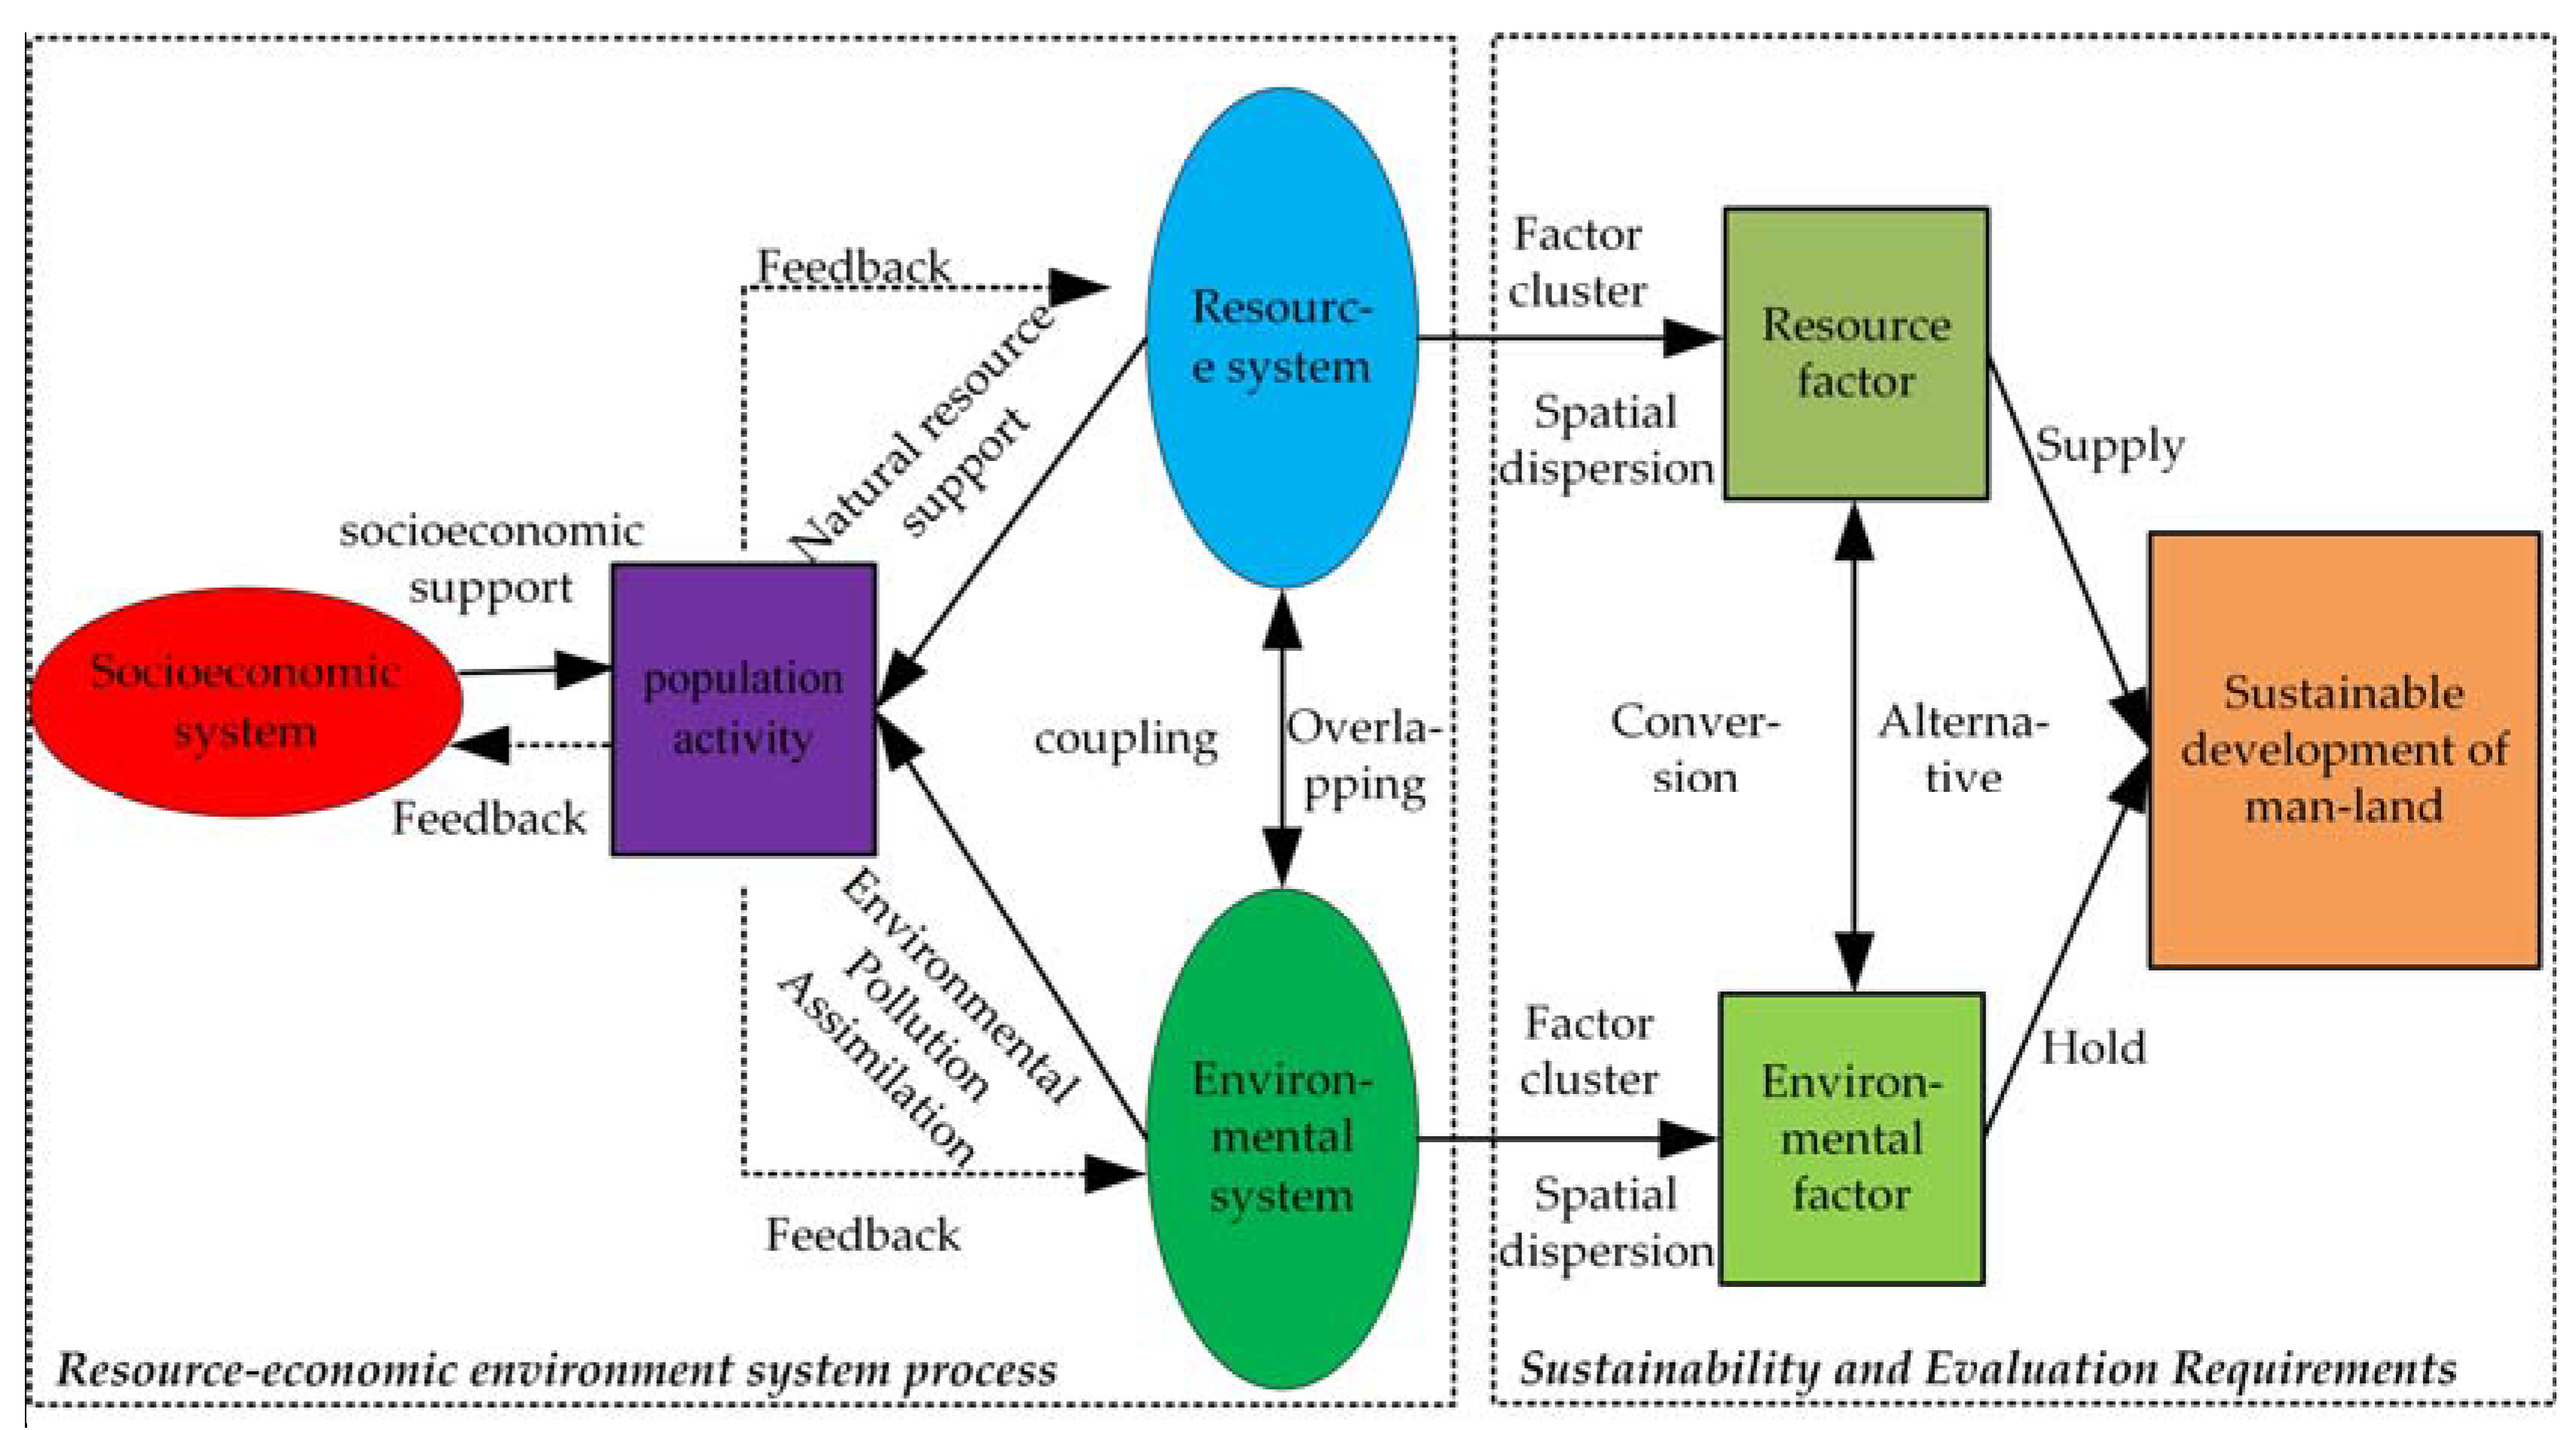
2.1. Research Framework of RECC

Natural resource utilization, socio-economic development, and the environment are interconnected elements within a dynamic system that collectively contribute to the capacity of the natural resource-social-economic-ecological environment system to meet human needs. Regional resource and environmental carrying capacity (RECC) refers to the capacity of the regional resource and environment system to support various social and economic activities [3]. It encompasses the resource support carrying capacity, socio-economic support carrying capacity, and environmental pollution assimilation carrying capacity [26]. However, the complex interrelationships and feedback loops in resource-environment systems increase the complexity of the RECC, leading to objective uncertainty and subjective cognitive inconsistencies. In order to enhance the comprehensiveness and dynamicity of RECC evaluation, it is crucial to adopt the principle of the sustainable development of man–land relations as a guide, as illustrated in Figure 1.

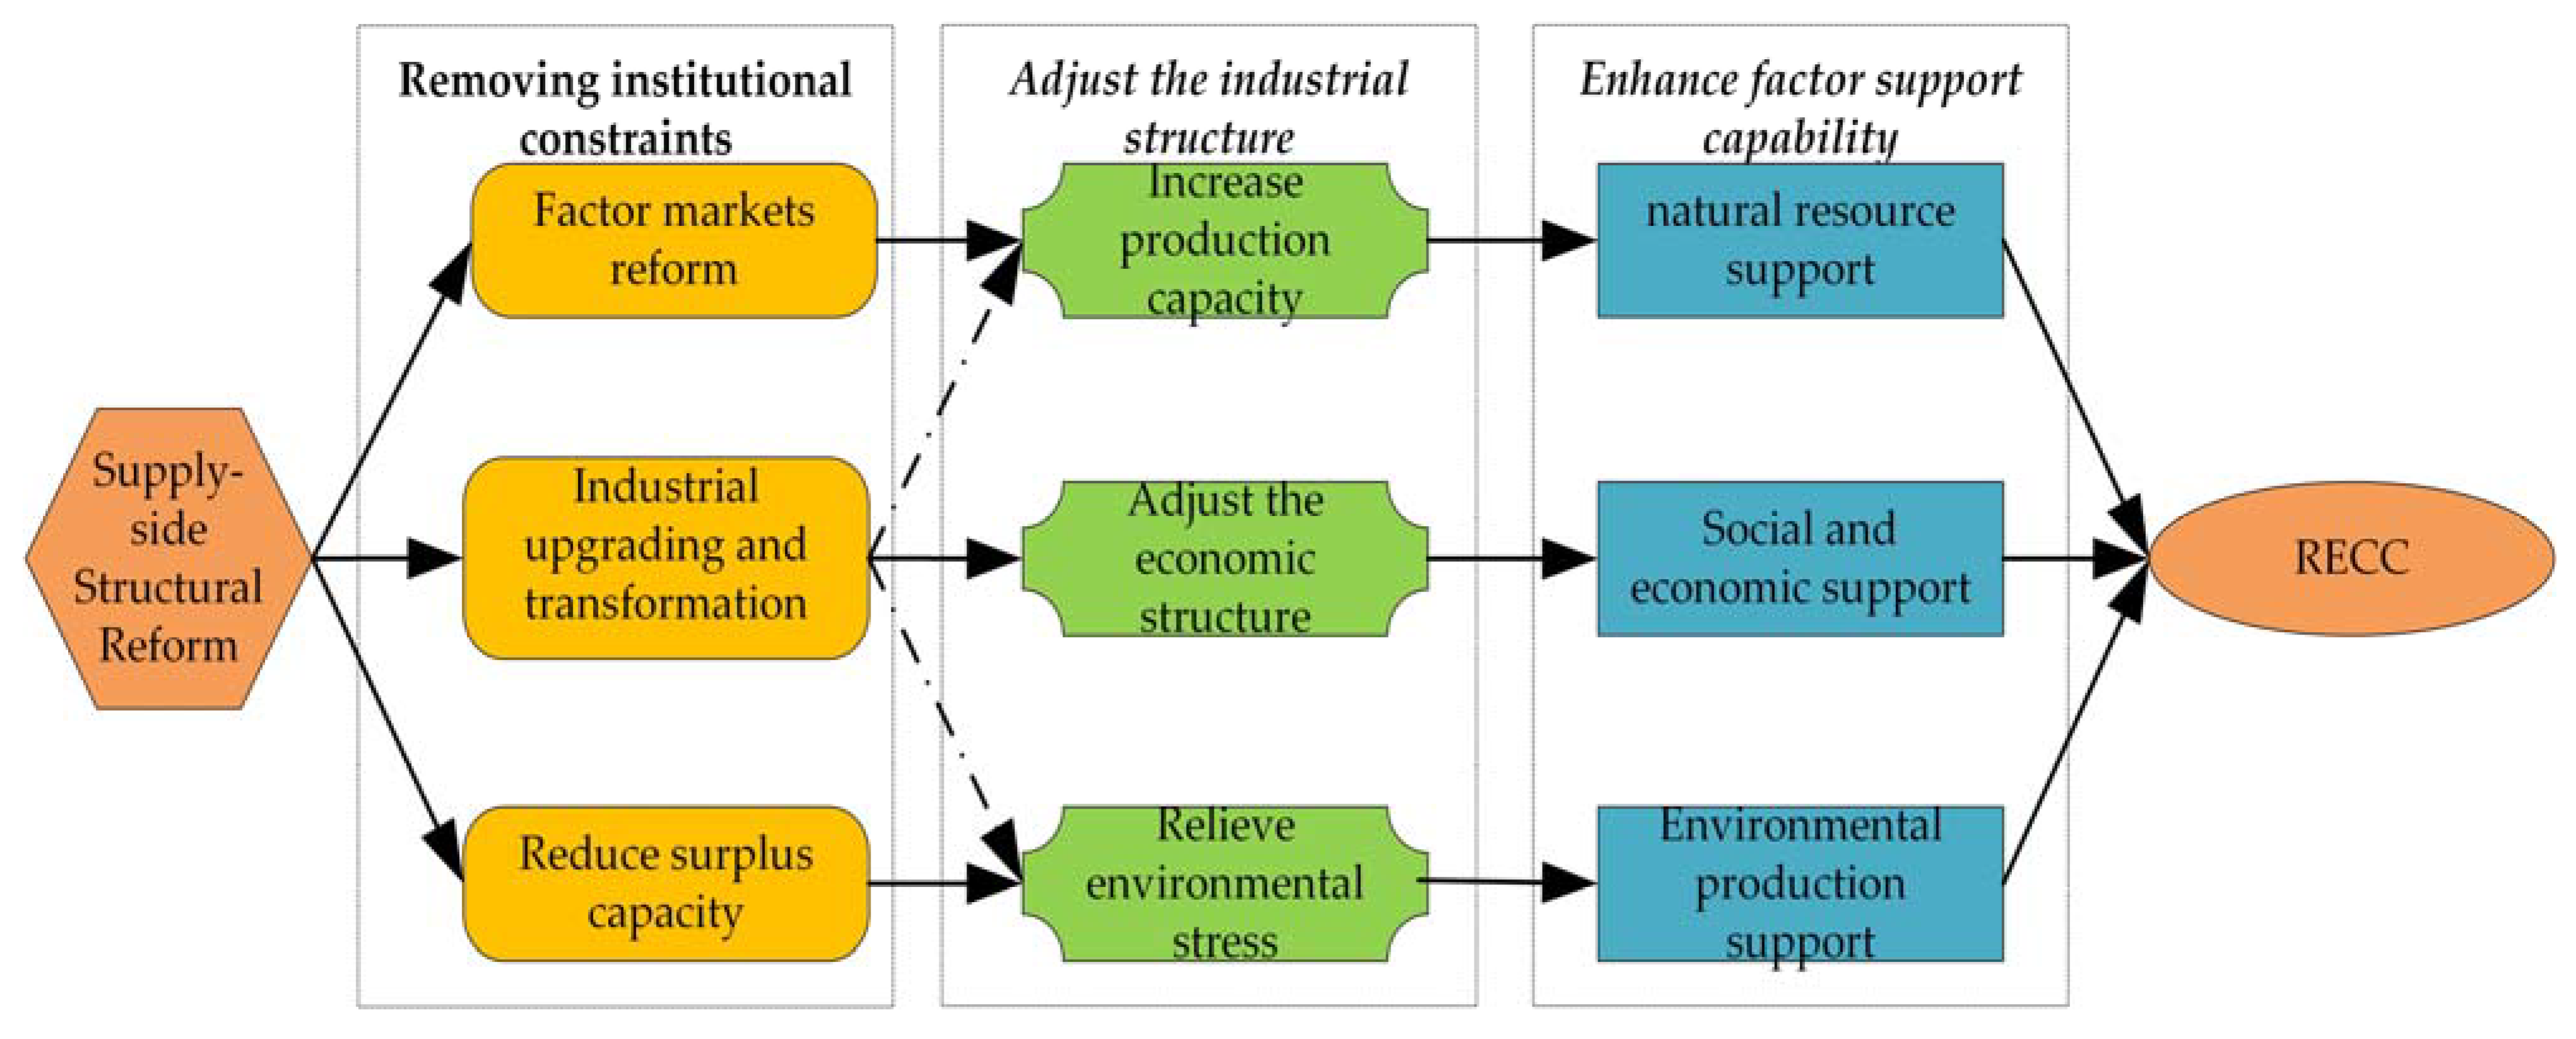
2.2. How Supply-Side Reform Affects RECC

The concept of sustainable development and environmental protection arose in response to the industrial revolution, leading to a shift in the focus of resource and environmental carrying capacity (RECC) from supply-side limitations to demand-driven support [27]. While reducing consumption and controlling demand are important for maintaining RECC stability, the importance of the supply side should not be overlooked. Supply-side reforms have brought about changes in previous administrative supply management methods [28], facilitating expedited factor transfers and enhanced efficiency in factor allocation.
Supply-side reform policies, such as “three reductions, one optimization, and one compensation”, have a significant impact on resource and environmental carrying capacity (RECC). They achieve this by improving regional capacity, adjusting the economic structure, and relieving environmental constraints through various measures such as factor market reforms, industrial transformation and upgrading, and reducing excess production capacity. First, supply-side reform improves RECC by activating market allocations and increasing market liquidity factors. In certain pilot areas, natural resources, including state-owned land, collective agricultural land, and water resources, have been commercialized for compensated use [29]. Additionally, ongoing marketization reforms for forest and grassland assets are expected to enhance land and resource utilization efficiency and carrying capacity. Second, the evolution of factor specialization, the diffusion and transfer of industrial technology, and the adoption of ecological industrial models contribute to the transformation and upgrading of traditional resource-based industries [28]. These factors collectively influence production capacity, economic structure, and environmental pressures, resulting in an increase in RECC. Policies targeting the consolidation and revitalization of “zombie” industries, the rectification of low-efficiency enterprises, and the promotion of factor specialization facilitate resource conservation, intensive utilization, and improvements in the natural resource carrying capacity. Industrial technology diffusion and transfer through investments, technology sharing, and labor migration establish stronger connections between traditional industries and technological advancements, leading to significant adjustments in the economic structure and impacting socio-economic support capabilities. The government’s efforts to establish and enhance eco-friendly industrial development models, improve the production environment, achieve energy conservation and emission reduction, and reduce environmental pressures also contribute to RECC [30]. Third, addressing excess production capacity is crucial as it serves as the root cause and primary source of environmental pollution [30]. By implementing mechanisms to tackle environmental pollution, the resolution of excess production capacity is achieved, leading to improved pollution absorption and treatment capabilities. Therefore, in theory, supply-side reforms activate factor flow allocation, facilitate industrial structural adjustment, and promote institutional productivity transformation through the removal of institutional constraints, adjustments to the industrial structure, and the enhancement of factor support capabilities. These actions collectively impact RECC (as depicted in Figure 2).

2.3. RECC Index System

The factors influencing and shaping the growth of the national economy include resource supply, water and land resource security, and environmental and ecological carrying capacity, along with the potential for industrial growth and development models based on these elements [31]. This article introduces a multi-criteria TOPSIS model for evaluating the resource and environmental carrying capacity (RECC). The model considers the interconnectedness of natural resources and the socio-economic and environmental elements (see Table 1 for details) that support human activities, as well as their evolving relationships [7,15]. Specifically, it assesses the impact of human activities on the natural ecological environment and the corresponding reactions and counteractions of the natural resource-environmental system [27]. The TOPSIS model framework comprises three components: natural resource support carrying capacity (NRSCC), socio-economic carrying capacity (SECC), and environmental population assimilation carrying capacity (EPACC).
NRSCC represents the capacity of localized resources to meet residents’ consumption demands for resource products and should include support from sectors such as agriculture, pasture, water conservancy, and energy [7,23,27,32]. The supply and demands of the essential resources, such as arable land, grassland, water resources, and energy, directly determine the regions’ carrying capacity, ensuring basic human living needs [15]. Arable land elements are sub-divided into grain, vegetables, and fruits based on the corresponding agricultural products. Grassland resources provide milk and livestock for human consumption. The close relationship between industrial and water resource consumption structures categorizes water resource carrying capacity into agricultural water, industrial water, and urban domestic water based on its usage [33,34]. SECC refers to the ecosystem’s ability to support the socio-economic development of human society within the constraints of natural resources and environmental systems [27]. It includes specific social resources like urban land1, labor, capital, and technology that ensure the population’s quality of life and economic development [14,17,25,35]. When drawing from the existing research, the guidelines for socio-economic support should encompass urban land security capacity and the development capacity of labor, capital, and technological innovation. The associated control indicators consist of urban construction land security capacity, transportation land security capacity, and green space security capacity [36]. Moreover, the analysis also takes into account labor development capacity, green credit development capacity [37], and research and development capacity [38]. EPACC relates to the regional resource utilization process that exceeds the self-healing ability of the natural ecological system, leading to ecological damage [29]. Land/soil, water, and air pollution are widely recognized as international public health problems. Therefore, the EPACC criterion layer should include the pollution assimilation capacity (PSC), and it should also include the agricultural environment, the atmospheric environment, and the water environment pollution assimilation capacity [15,39]. Under agricultural environmental PSC, the considerations involve agricultural pesticides and agri-chemical fertilizers [39]. For Atmospheric pollution PSC, the assimilation of carbon pollution, SO2, smoke, and dust are included [7,15,39]. In terms of the water environment PSC, ammonia nitrogen and COD are considered [7,15,40].

2.4. Methods of RECC and Spatial Analysis

(1)
Methods of RECC assessment and analysis
Based on departmental data sources, we can monitor the production of resource products ( I r a ), economic output ( I y b ), and environmental pollution output ( I e p c ) in the region. The calculation of natural resource support carrying capacity (NRSCC) involves determining the ratio of resource product output per capita to the per capita resource demand, Equation (1). Social and economic carrying capacity (SECC) can be measured by the ratio of urban land to planned population land demand or by considering factors such as labor conditions, capital investment, and technological innovation to social standards, high-end industry development, and technological investment standards (Table 1). Environmental pollution carrying capacity (EPACC) can be determined by comparing international per capita pesticide and fertilizer usage standards, carbon emissions standards and the actual per capita usage and emissions, or by assessing the ideal capacity for accommodating environmental pollutants. The A-value method is used to calculate the ideal carrying capacity of the atmospheric environment, with A-value set as 2.94 × 10⁴ km2·a−1. Similarly, the ideal carrying capacity of water environmental pollutants is calculated by multiplying the regional area by the unit area ammonia nitrogen safety threshold [7].
I r a = i = 1 m w i [ r a i / ( P × r a ¯ ) ] = R a / ( P × r a ¯ )
I y b = i = 1 n w i [ y b i / ( P × r b ¯ ) ] = Y a / ( P × r b ¯ )
I e p c = i = 1 o w i ( e c i ¯ / e p c i ) = E c ¯ / E P c
In Equations (1)–(3), P represents regional population; r a i is the total output of resources for the i-th department; y b i is the current status of land supply, labor, capital, and technology inputs for the i-th department; r a ¯ and r b ¯ represent per capita resource demand (consumption) and planning restrictive indicators, respectively. E c ¯ ( e c i ¯ ) represents the pollution execution standard; m and n denote resource and economic element types, respectively, and o represents the type of pollutant.
I = f ( I r I y I e p ) = α f 1 ( I r I y ) + β f 2 ( I y I e p ) + γ f 3 ( I r I e p )
In Equation (4), I represents RECC, represents the coupling relationship of the system, α , β , and γ , respectively, represent the coupling degree between NRSCC and SECC, SECC, and EPACC, and EPACC and NRSCC. In order to measure RECC, this paper uses factor analysis to calculate the comprehensive integration of multiple factors.
(2)
Methods of spatial analysis
This study employs the Moran global and local spatial autocorrelation analysis method to investigate the systematic and aggregated resource and environmental carrying capacity (RECC). In order to ensure unbiased data estimations (and the clarity of the spatial characteristics), normal distribution weights are used during the process of spatial processing and analysis procedures [7,15]. The provincial level was chosen as the fundamental spatial analysis unit, and a spatial adjacency matrix was created. The neighboring topological relationships among provinces are established using ArcGIS 10.2, while GeoDa was employed to construct adjacency based on the principles of queen, rook, bishop, and distance-based spatial weights, thereby determining the appropriate spatial weights. The global spatial relationship of Moran can be represented by Equation (5) [41].
I i = Z i j = 1 n ( X i X ¯ ) i = 1 n w i j ( X j X ¯ ) / ( s 2 i = 1 n j = 1 n W i j )
s 2 = 1 / n i = 1 n ( X i X ¯ ) 2
In Equations (5) and (6), I i represents the global spatial auto-correlation index of RECC, whereas n is the number of spatial units; X i and X j denote the attribute values of spatial units i and j, respectively. w i j is the spatial weight coefficient matrix between provinces i and j, which indicates the adjacent relationship between spatial units.
I i = Z i j = 1 m w i j × Z i
Z i = ( X i X i ¯ ) 1 n i = 1 n ( X i X i ¯ ) 2
Equations (7) and (8) illustrate the local spatial auto-correlation index of RECC, where Z i represents the standardized value of the resource-environment factors in province i, and other variables are consistent with Equations (5) and (6). In this study, we used the default value of 4 for the spatial weight of the average adjacent province unit in the geometric center and measured the spatial distance in kilometers using ArcGIS.

2.5. Data Source and Variable Selection

This study evaluated regional resource and environmental carrying capacity (RECC) using provincial-level data on product output, economic output, and environmental pollutants from the China Urban Statistical Yearbook, China Statistical Yearbook, China Industrial Statistical Yearbook, and China Carbon Accounting Database from 2005 to 2019. Data from Macao, Hong Kong, Taiwan, and Tibet were excluded due to missing information. The per capita product demand calculation parameters were based on Table 1, with standards set for various food items, such as per capita food demand at 400 kg/year, per capita vegetable demand at 300–500 g/day, per capita fruit demand at 200–350 g/day, per capita meat demand at 280–525 g/week, per capita liquid milk demand at 300 g/day (using the median as the calculation standard), and agricultural and industrial water quotas based on the “Compilation of Water Quotas for Each Province Nationwide”. The use of pesticides and international safety guidelines for fertilizers was set at 1.058 kg/hm2 and 225 kg/hm2, respectively. The annual average concentration standards for the atmospheric pollutants SO2 and dust were taken as Grade II standards at 60 μg/m3 and 70 μg/m3, respectively. For water pollutants, the limits for chemical oxygen demand and ammonia nitrogen for surface water were based on Class II standards, with values of 15 mg/L and 0.5 mg/L, respectively. The study used the theory of supply and demand to measure the supporting capacity of natural resources, socio-economy, and environmental production. Factor analysis was used to determine the weight of multiple factors, and the Bartlett sphericity test confirmed the statistical significance of the supporting capacity of the three resource and environmental sub-systems at a significance level 1%.
In empirical research, different policies form the supply-side reform are indicated by various indicators. For example, the “capacity reduction” policy is represented by the ratio of the output value of energy-intensive industries to the total industrial output value (HEIR) [42]. The “inventory reduction” policy is assessed based on the average annual reduction in the inventory of commercial housing (DCHI) [13]. The “deleveraging” policy is represented by the ratio of liabilities of industrial enterprises above a certain size to the total assets (TLIE) [42,43]. As for “cost reduction”, which primarily involves tax and fee reductions and reducing the factor costs, this study uses the ratio of manufacturing industry tax revenue to GDP (TMT) to represent this policy [19]. “Filling gaps” includes filling the development gaps between regions and industries, as well as institutional gaps. Filling regional gaps is measured by government fiscal deficit (GD) [42]. Filling industry gaps is indicated by the industrial structure, which represents the ratio of the value added from the tertiary industry to that of the secondary industry (IND) [42,43]). Filling institutional gaps is represented by the strength of environmental regulations, measured by the revenue from pollution fees per unit of output (ENRE) [42], and “environmental governance investment” is measured by the ratio of environmental governance investment to GDP (IVEN) [43].

3. Results

3.1. Mean Analysis of RECC

The evaluation results of resource and environmental carrying capacity (RECC) reveal that the majority of provincial-level regions exhibit a state of sustainable carrying capacity, with an average carrying capacity of 1.98 (refer to Table 2).
In order to further explore the spatial disparity in RECC, 30 provincial regions are divided into the eastern, central, western, and northeast regions2. The capacity is slightly higher than the measurement result of 1.73, which did not consider industrial structure [44]. Over the years, RECC has continuously increased, starting from 1.54 in 2005, reaching 1.96 in 2010, ultimately growing to 3.16 in 2019. The regional distribution of RECC indicates that the eastern region has a capacity of 1.45, whereas the central region has a capacity of 1.72. Both the western region and the northeastern region are above 2.30. Among these regions, the western region has the highest carrying capacity, followed by the northeastern, central, and eastern regions3. While the eastern region demonstrates a high socio-economic support capacity, it faces challenges due to its high population density, making it difficult to meet natural resource demands. Additionally, the earlier industrial development in the east has led to more severe ecological environmental damage. On the other hand, the western and northeastern regions possess a relatively strong NRSCC, while the central and western regions have a relatively strong EPACC. However, EPACC remains a significant bottleneck that restricts the improvement of RECC. This is consistent with the research findings of Zhang et al. (2012), Tu et al. (2016), and Li and Lu (2018) [1,5,42]. Therefore, efforts to enhance RECC should primarily focus on the central and eastern regions. This is crucial because the region factors in the eastern region are insufficient, such as a shortage of land supply and the continuous increase in labor costs, which have limited the growth of RECC.

3.2. Time Dynamics Analysis of RECC

When analyzing the growth rate of RECC (refer to Figure 3), it is evident that from 2005 to 2010, China’s economy was in its initial stage, with an average growth rate of 6.28% for RECC. During this period, all regions—eastern, central, western, and northeastern—experienced an upward trend in RECC, with the central region exhibiting the highest increase, followed by the western, northeastern, and eastern regions. The subsequent period from 2011 to 2015 witnessed rapid economic growth in China, which resulted in significant resource waste and environmental damage. The average decline rate of RECC during this period was 1.17%, with the northeastern region experiencing the most significant decline, whereas the eastern region experienced only a modest increase. In the years spanning 2016 to 2019, coinciding with the implementation of supply-side reform, China experienced an average annual growth rate of 18.12% for RECC. During this phase, the central government proactively adjusted the industrial structure, redirecting attention towards addressing the issue of extensive growth primarily in the eastern and central regions, even at the expense of the environment and resources [45]. Consequently, ecologically friendly industries witnessed notable growth, contributing to an enhancement of RECC. Furthermore, in the western region, the successful relocation of numerous resource-intensive industries from the eastern and central regions facilitated the transfer of capital, labor, and technology, resulting in significant improvement in RECC.
(1)
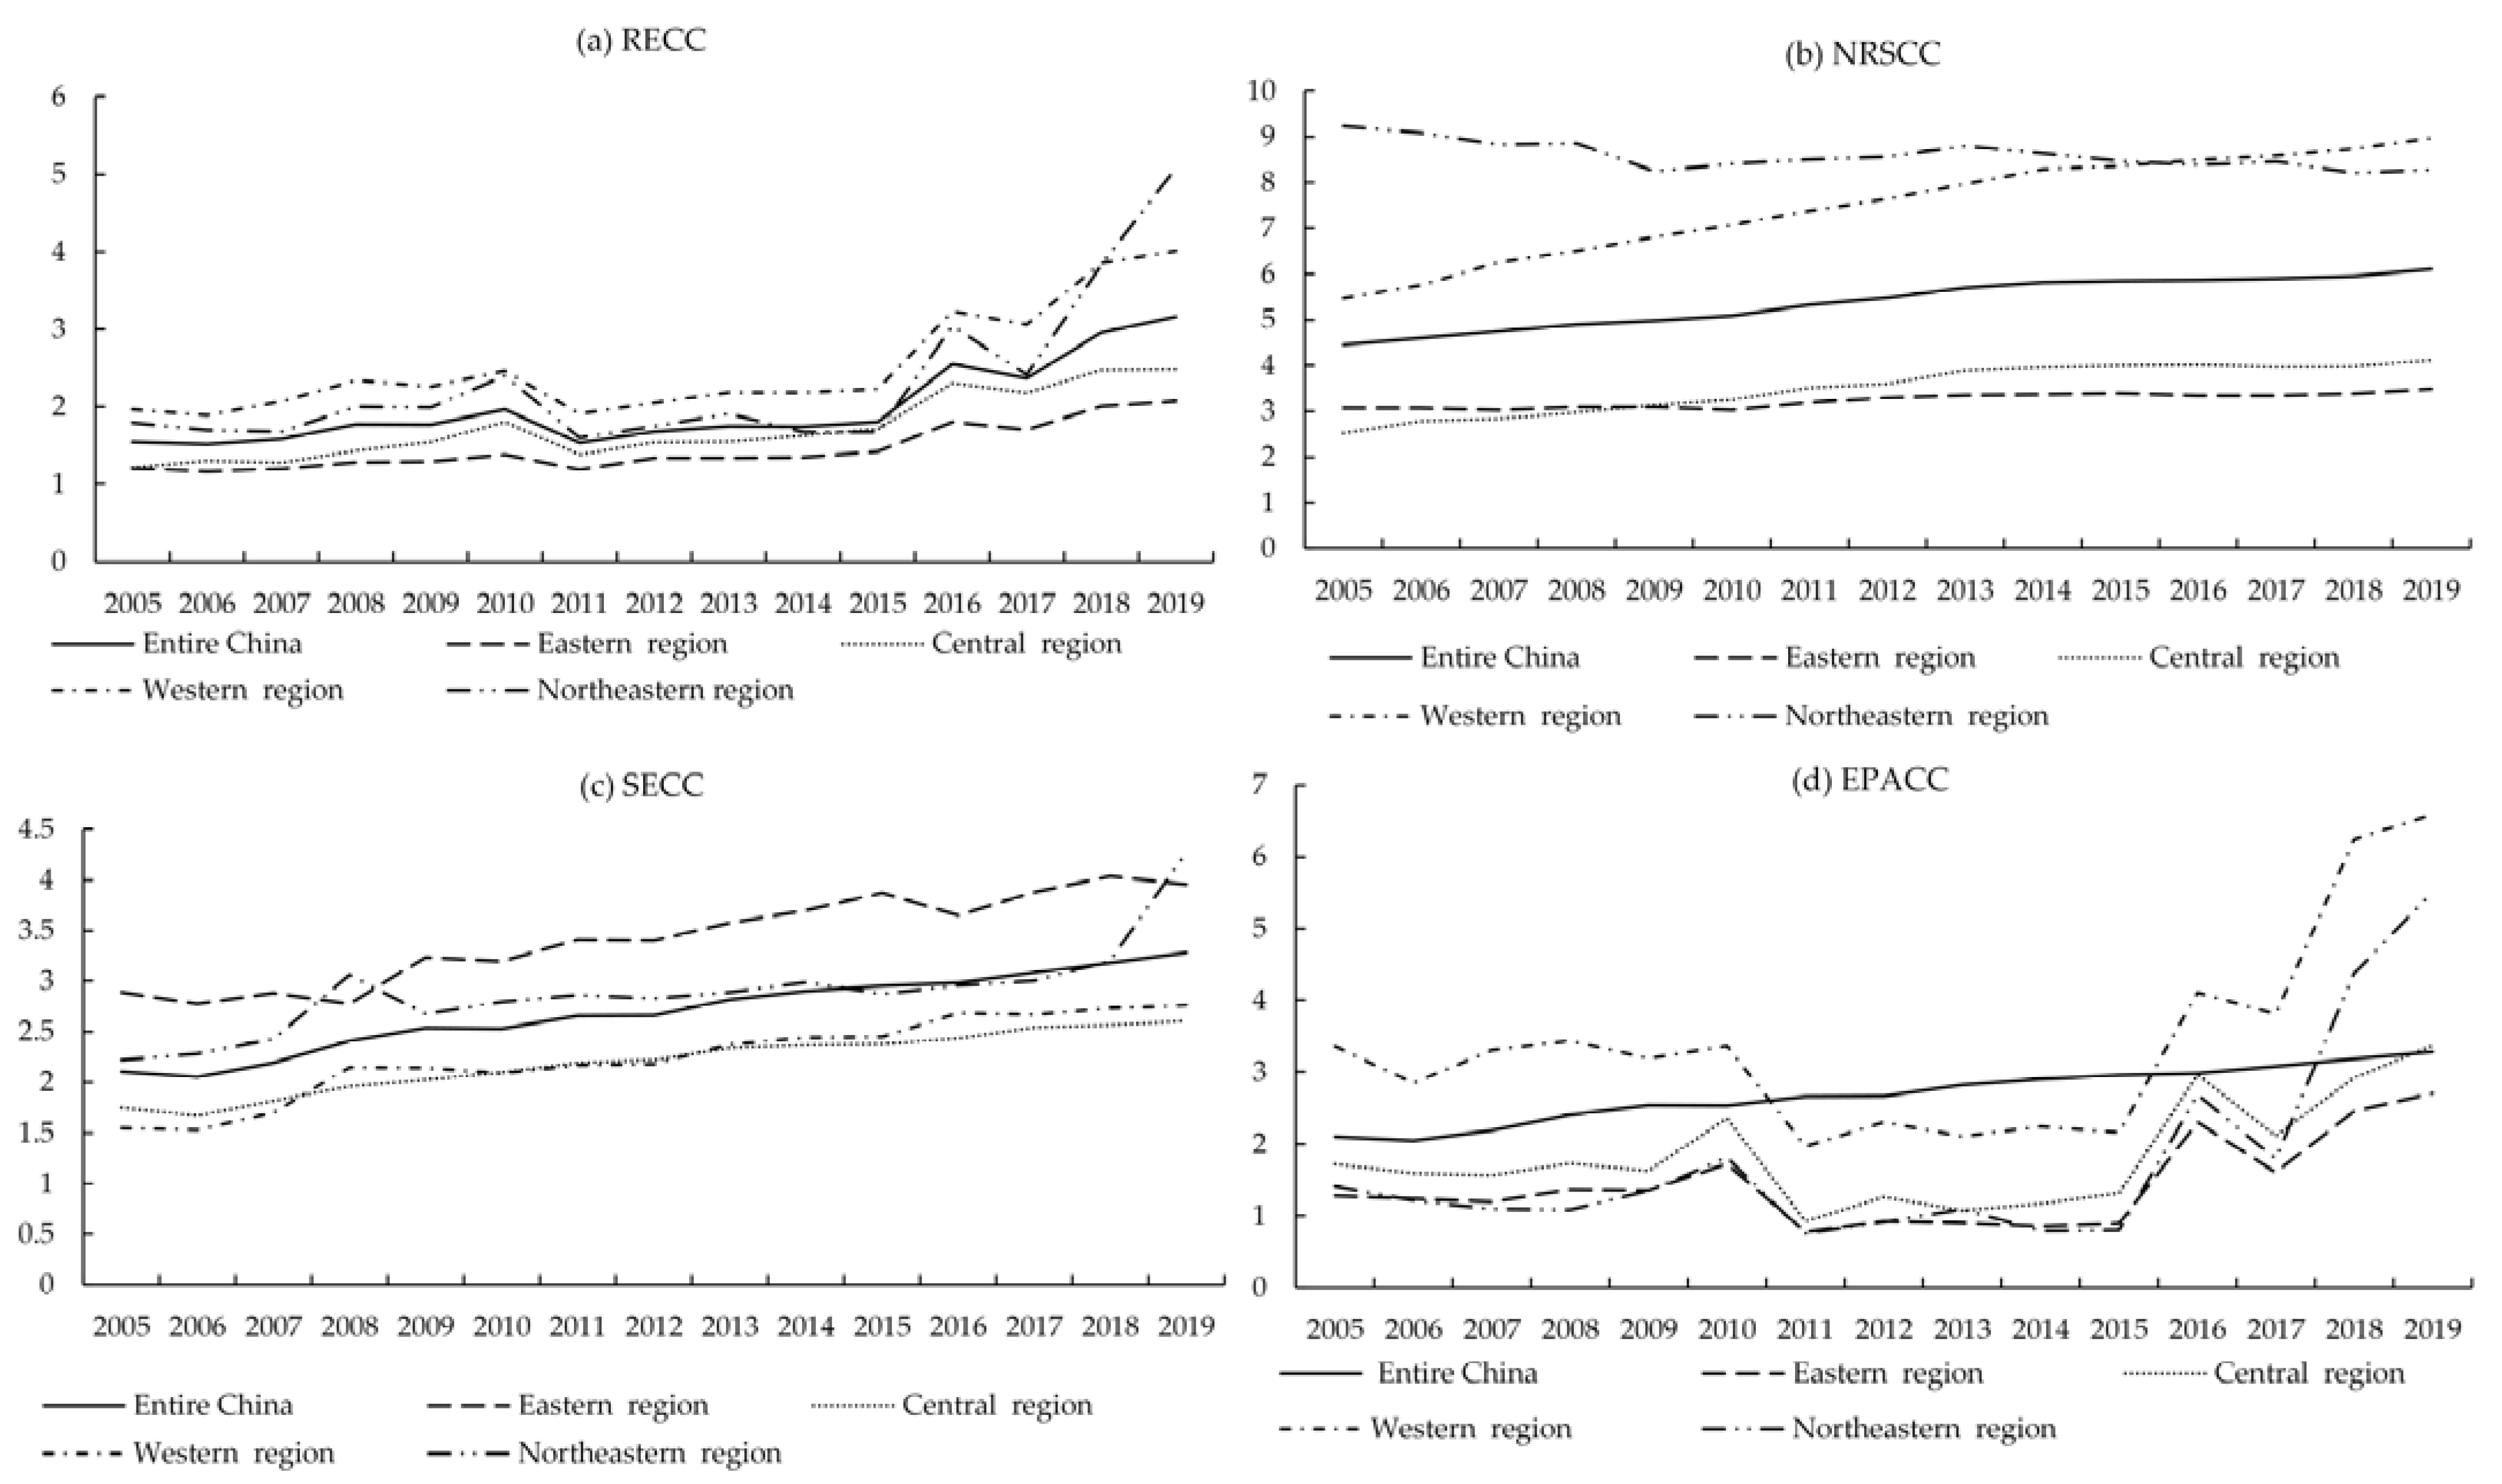
According to Figure 4a, the RECC and its sub-supporting capacity exhibited a gradual increase from 2005 to 2016. However, since 2016, the government’s implementation of market element allocation reform and industrial strategic transfer has led to a significant increase in RECC in the western and northeastern regions. In contrast, the improvement in RECC for eastern and central regions has been relatively modest;
(2)
The NRSCC (natural resource supporting carrying capacity) exhibited a gradual increase from 2005 to 2016, as shown in Figure 4b. The northeast region had the highest capacity, followed by the western, central, and eastern regions. An analysis of the yearly data reveals that the northeastern region is a major grain producer with a per capita grain amount of 1148.88 kg. However, the per capita vegetable and fruit amounts are relatively lower at 325.69 kg and 98.51 kg, respectively. In contrast, the western region exhibits significantly higher natural resource abundance compared to the eastern region and central regions. The per capita amounts of grain, vegetables, and fruit in the western region are 865.01 kg, 781.61 kg, and 472.14 kg, respectively. These figures are much higher than those in the central region (455.90 kg, 421.91 kg, and 148.65 kg, respectively) and the eastern region (282.44 kg, 591.67 kg, and 272.09 kg, respectively). Additionally, per capita meat consumption is highest in the western region, followed by the eastern region, central region, and northeastern region, with values of 110.13 kg, 69.26 kg, 57.53 kg, and 23.04 kg, respectively. Per capita milk consumption is highest in the northeastern region, followed by the western region, eastern region, and central region, with values of 60.64 kg, 24.77 m3, 23.04 m3, and 9.49 kg, respectively. Water security rates for agricultural use are significantly higher in the western and northeastern regions compared to the central and eastern regions, with 68.14% and 70.30% versus 49.88% and 57.67%, respectively. Although the proportion of industrial water usage is relatively low, its output value surpasses that of agricultural water usage, indicating higher water use efficiency in industry compared to agriculture. The western region also possesses relatively rich fossil energy reserves, with per capita natural gas amounts of 209.19 m3, per capita coal amounts of 0.885 t, and per capita crude oil amounts of 2.195 t, which are much higher than those in the eastern region (18.83 m3, 0.758 t, and 0.018 t, respectively), central region (24.77 m3, 0.574 t, and 0.143 t, respectively), and northeastern region (194.52 m3, 1.498 t, and 0.142 t, respectively). Notably, cross-regional resource supply strategies such as the “West-to-East Grain Transfer”, “South-to-North Vegetable Transportation”, and “West-East Gas Transmission”, can help alleviate the disparities in NRSCC across China;
(3)
The SECC (socio-economic carrying capacity) is higher in the eastern and northeastern regions compared to the central and western regions (see Figure 4c). The Western Development Strategy4 and the relocation of industries from the eastern and central regions to the western region have contributed to the increased socio-economic support in the northeastern and western regions. Although there is little difference in per capita urban construction land (22.12–26.50 m2) among the eastern, central, western, and northeastern regions, the per capita green space land differs significantly. Specifically, the eastern, central, western, and northeastern regions have 19.96 m2, 10.42 m2, 19.81 m2, and 34.34 m2 of green space land, respectively. Furthermore, the aging rates in these regions are 9.83%, 9.64%, 8.72%, and 10.1%, respectively. Furthermore, the proportion of green credit in these regions is 44.00%, 49.92%, 65.57%, and 50.69%, respectively. Following the implementation of the Western Development Strategy transfer, the interest payments for high-energy-consuming industries are notably higher in the western and northeastern regions than in the central and eastern regions. Moreover, the ratio of research and development investment costs to GDP in the eastern region is currently 2.26%, significantly surpassing the figures in central region (1.27%), western region (0.98%), and northeastern region (1.18%). Consequently, the ongoing strategic transfer involves the relocation of industries, labor, and capital. However, to facilitate effective technology transfer, further implementation of the “Changeling of more computing resources from China’s eastern areas to less developed western regions” project is necessary;
(4)
The EPACC (environmental population assimilation carrying capacity) demonstrates a decline in the western, central, northeastern, and eastern regions, as depicted in Figure 4d. Despite the eastern region having higher industrial output efficiency compared to the western and central regions, its earlier industrial development has resulted in persistent environmental pollution. The efficiency of industrial wastewater discharge per CNY 10,000 in the eastern, central, western, and northeastern regions is 0.0064 t, 0.0127 t, 0.0097 t, and 0.0087 t, respectively. In contrast, the water consumption intensity in the United States in 2015 was 0.0044 t/CNY 10,000 [46] (converting the dollar to the Chinese yuan using the exchange rate of that year), indicating lower consumption in the eastern regions of China. In order to achieve sustainable economic development and continuously improve efficiency, it is essential to address the water resources and economic development dilemma through adjustments in the industrial structure or by enhancing water use efficiency [47]. The central and western regions exhibit significantly higher capacities for COD pollution absorption than the eastern and northeastern regions, with values of 4.68 and 2.19, respectively, compared to 1.77 and 1.92. Carbon emissions per capita in the eastern region are much lower than those in the western and central regions, with values of 7.269 t, 12.453 t, 15.272 t, and 23.437 t in the eastern, central, western, and northeastern regions, respectively. The efficiency of industrial sulfur dioxide emissions per CNY 10,000 in the eastern, central, western, and northeastern regions is 0.0344 t, 0.1103 t, 0.1406 t, and 0.0715 t, respectively. Similarly, the efficiency of industrial soot emissions is 0.0164 t, 0.0786 t, 0.0614 t, and 0.0639 t in those regions, respectively.

3.3. Spatial Classification of RECC

This article utilizes the natural breakpoint method with uniform dimensions in ArcGIS to classify and grade the RECC of each province in 2005, 2010, 2015, and 2019.
In 2005, Sichuan and Yunnan achieved the highest Grade IV for RECC. Grade III was attained by Zhejiang, Guangdong, Jiangxi, Guizhou, Shanaxi, Xinjiang, Guangxi, and Heilongjiang. Shandong, Hainan, Shanxi, Hubei, Chongqing, Shaanxi, Gansu, Qinghai, Ningxia, Inner Mongolia, and Liaoning were classified as Grade II, while the remaining other provinces were rated as Grade I. By 2010, several provinces significantly improved their RECC. Guangxi was upgraded from Grade III to Grade IV, Hubei, Gansu, and Liaoning advanced from Grade II to Grade III, Jiangsu, Fujian, Anhui, Henan, and Hunan moved up from Grade I to Grade II. Ningxia was upgraded from Grade I to Grade III, while Hainan was downgraded from Grade II to Grade I, with most provinces maintaining their existing grades. In 2015, there were fluctuations in carrying capacity grades. Hubei, Shanaxi, Gansu, and Jilin were downgraded from Grade III to Grade II, while Henan’s RECC was downgraded from Grade II to Grade I. Following the implementation of the supply-side reform in 2016, the transfer of labor, capital, and technology due to industrial transfer occurred. Provinces such as Zhejiang and Guangdong in the eastern regions, Jiangxi in the central regions, Sichuan, Guizhou, Ningxia, and Inner Mongolia in the western regions, and Heilongjiang in the northeastern region all experienced an upgrade from Grade III to Grade IV. Hubei, Shandong, Shanxi, Anhui, Hubei, Hunan, and Liaoning were upgraded from Grade II to Grade III. Fujian, Chongqing, Shanaxi, Gansu, and Jilin were upgraded from Grade II to Grade IV. Beijing, Hebei, Hainan, and Henan were upgraded from Grade I to Grade II, while the grades of RECC in other regions remained unchanged.
From 2005 to 2019 (refer to Figure 5), the RECC in China demonstrated a pattern of “local deterioration and overall improvement”. Notably, the implementation of the supply-side reform played a significant role in the enhancement of RECC. During this period, the RECC of the eastern and central regions remained relatively stable, with coastal provinces like Tianjin, Shanghai, Hebei, Shandong, and Jiangsu experiencing minimal changes in their carrying capacity. However, the acceleration of the supply-side reform led to the relocation of industries from the eastern to the western region. The shift provided the western region, particularly in Yunnan, Inner Mongolia, Guizhou, Shaanxi, Sichuan, and Xinjiang, with increased support in terms of resources, funding, and technology. As a result, the RECC in the western region showed significant improvement.

3.4. Spatial Auto-Correlation Analysis of RECC

The current study uses the principle of geometric center adaptive kernels to examine spatial weights. The results indicate a limited correlation between NRSCC and SECC. However, there is a moderate and significant correlation between SECC and EPACC. The transfer and dissemination of industrial technology have reinforced the connection and correlation of regional SECC, resulting in the spatial clustering of SECC that extends to EPACC.
The analysis employing the geometric center adaptive kernel principle reveals a distinct spatial correlation between NRSCC and SECC (refer to Table 3). In the case of NRSCC, Yunnan stands out as the only region demonstrating significant spatial correction, characterized by high-support regions surrounded by other high-support regions (HH type). Conversely, Zhejiang in the Yangtze River Delta, as well as Hunan, Jiangxi, and Fujian in the Pearl River Delta, exhibit the LL type, indicating a low-support region surrounded by other low-support regions. Regarding SECC, Shandong, Jiangsu, and Beijing show significant spatial correlation with the HH type, while Jilin demonstrates the LH type. In terms of EPACC, Yunnan, Qinghai, and Guizhou exhibit strong spatial dependence and correlation to the HH type, while Inner Mongolia, Liaoning, Hebei, Beijing, Tianjin, Shaanxi, Shanxi, Gansu, Shandong, Jiangsu, and Anhui showcase the LL type. The spatial auto-correlation index of RECC is 0.334, with Yunnan and Sichuan displaying the HH type, while Shanghai, Jiangsu, Zhejiang, Shandong, Beijing, Tianjin, and Anhui in the eastern coastal areas exhibit the LL type. These findings underscore significant regional disparities in carrying capacity due to environmental conditions in the eastern coastal areas.
Furthermore, the analysis of the local spatial correlation reveals a weak spatial correlation between NRSCC and SECC, while EPACC shows a strong spatial correlation with significant p-values. The hindrance of the flow of natural elements, a lag in population and land agglomeration, the absence of a national natural resource market system, and the limited marketization of some natural resources contribute to the difficulty in achieving cross-regional transactions, thereby hindering the formation of a strong spatial correlation. In other words, the spatial correlation of natural resources has less impact due to the fixity of resources and the challenges in market transactions. In contrast, the spatial correlation of SECC, EPACC, and RECC increased over time due to the spatial transfer and agglomeration of industries, as well as the diffusion and transfer of environmental pollution. During the Eleventh Five-Year Plan period (2006–2010), regional economies rapidly developed in a step-by-step manner from south to north and from east to west, strengthening the spatial correlation of the economy. The subsequent years, particularly during the Twelfth Five-Year Plan period (2011–2015), witnessed the strengthened role of the Chinese government in structural adjustment, leading to enhanced spatial correlations in the SECC. The implementation of the supply-side reform during the Thirteenth Five-Year Plan period further promoted the convergence of spatial carrying capacity differences, particularly in resources and the environment, strengthening the spatial correlation of RECC through improved resource allocation efficiency and factor production efficiency.

3.5. Research on the Impact of Supply-Side Reform Policy on RECC

(1)
Supply-side reform strategy and its impact on RECC
The analysis of the impact on resource and environmental carrying capacity (RECC) is beneficial for understanding the underlying factors of temporal and spatial changes in RECC from the perspective of the supply side. However, it is crucial to acknowledge that the effects of supply-side reforms on RECC are not uniform. The implementation of the policy of “three reductions, one optimization, and one supplement” in 2016 had notable impacts both before and after the reform. Specifically, policy variables in the central region exhibited negative changes, indicating a decrease in investment in environmental governance and the strength of environmental regulation. On a nationwide scale, “inventory reduction”, “filling regional and industrial gaps”, and “environmental governance investment” demonstrated significant effects, while “capacity reduction” had significant effects in the central and northeastern regions. However, the policies of “deleveraging” and “reducing costs” had no significant effects in the western region, and “filling institutional gaps” had no significant effects in the eastern regions, as indicated by the t-tests conducted on various policy variables. The cumulative effects of multiple policies under the supply-side reform significantly improved the RECC across the provincial regions in China (refer to Table 4).
This section focuses on assessing the impact of the supply-side reform on RECC and its variations. The KMO test and principal component analysis were employed to examine the supply-side policy variables. The analysis yields three principal components: “enterprise production capacity factor” (EPCF), representing a reduced surplus production capacity; “market element factor” (MEF), representing market-oriented factor reform; “industrial structure factor” (ISF), representing industrial upgrading and transformation. These components represent different aspects of reforms. The findings indicate a significant enhancement in the RECC of provincial regions in China as a result of the combined influence of various policies under supply-side reform. The formulas representing the principal components derived from the principal component analysis are presented below:
EPCF = 0.8652 × HEIR + 0.1719 × DCHI + 0.7931 × TLIE + 0.0911 × LN_GD +
0.0336 × TMT − 0.2676 × IND + 0.6482 × ENRE + 0.2174 × IVEN
MEF = 0.0431 × HEIR + 0.8504 × DCHI + 0.0254 × TLIE + 0.1894 × LN_GD −
0.8359 × TMT + 0.1695 × IND + 0.4085 × ENRE + 0.4769 × IVEN
ISF = 0.2089 × HEIR + 0.1114 × DCHI − 0.3211 × TLIE + 0.8083 × LN_GD −
0.1291 × TMT + 0.6259 × IND − 0.1776 × ENRE − 0.5112 × IVEN
(2)
Empirical analysis of the impact of supply-side reform on RECC
In order to account for the time factor and the individual effects on changes in RECC, this paper employs a bidirectional fixed-effects model, as outlined below:
I k = β 1 i E P C F + β 2 i M E F + β 3 i I S F + β 3 i X i j + α t + ν i + ε i t
The formula for calculating resource and environmental carrying capacity (RECC) incorporates the sub-systems’ support force, time effect α t , individual effect ν i , and error term ε i t . In order to account for variables that may influence carrying capacity, control variables X i j , such as the proportion of regional import and export to GDP, the proportion of floating population, and the logarithm of per capita consumption expenditure of regional residents are included. The regression analysis in this study was conducted using Stata16.0, and the results are presented in Table 5.
This section presents the empirical findings on the impact of supply-side reform policies on RECC, NRSCC, EPACC, and SECC. The results show that industrial upgrading and transformation (ISF) significantly and positively affect RECC, which is consistent with the research findings of Li and Lu (2018) and Zhao et al. (2022) [27,42]. Additionally, reducing the surplus production capacity (EPCF) also contributes positively. The impact of industrial upgrading and transformation (ISF) on NRSCC is statistically significant at the 10% level, whereas the impact of reducing surplus production capacity (EPCF) is significant at the 5% level. Additionally, the impact of market-oriented factor reform (MEF) on EPACC shows significance at the 10% level. However, the positive effects of market-oriented factor reform (MEF) and the reducing surplus production capacity (ISF) on SECC are not significant. This could be attributed to the negative impact of “deleveraging” on the SECC. Furthermore, a single tax preference policy without adjustment in industrial organizational structures may not stimulate technological transformation and innovation [43]. The slowdown or negative growth in the production of high-polluting products, including coke, cement, flat glass, pig iron, crude steel, steel, and thermal power generation since 2013 can be attributed to the diversification of the participating subjects resulting from the market-oriented factor reform [20]. The “capacity reduction” policy implemented in the steel and coal industries has successfully alleviated resource and environmental pressures, thereby enhancing RECC. Moreover, the migration of investment, technology, and labor has increased industry inter-connectivity, reducing the burden on high-energy-consuming sectors and promoting the improvement of NRSCC.

4. Discussion

The purpose of this paper is to achieve a co-ordinated spatial pattern of population-resource-environment and sustainable development based on the efficient supply and demand balance of agriculture, industry, and environmental factors. Over time, the resources and environmental carrying capacity (RECC) has consistently grown, with a notable acceleration in its growth rate after 2016, attributed to the strategic arrangement of the national supply-side reform and the resulting industrial restructuring. However, the spatial correlation between natural resource carrying capacity and socio-economic capacity is relatively weak. This research has practical applications in China’s industrial restructuring and its influence on RECC. Specifically, facilitating the cross-regional flow of population, resource elements, and industries can lead to an overall improvement in the RECC across the country and strengthen its spatial correlation. The examples discussed include the market-oriented regional flow of grain, vegetables, and natural gas, as well as the ongoing deployment of power equipment transfer.
Estimating the RECC and understanding the impact of supply-side reform on it, including specific policy effects, represent crucial aspects as the Chinese government promotes sustainable national developments through supply-side reform to ensure. The supply-side reform aims to integrate resource and environmental elements, enhancing the influence of science, technology, and systems, which ultimately benefits the impact of RECC. However, the effectiveness of supply-side reform in improving RECC relies on its comprehensive impact on resource elements, the industrial economy, and the ecological system. Although some measures of the supply-side reform currently promote RECC, the coexistence of supply-side reform systems alongside other resource and environmental demand-side systems may lead to conflicts in resource utilization efficiency, economic effects, and the environment. For instance, the “capacity reduction” policy has successfully eliminated highly polluting and energy-consuming zombie enterprises from the market. However, the reform of production capacity has not kept pace with the rising factor prices resulting from resource scarcity, leading to insignificant growth in the SECC and unclear growth in the RECC in the eastern region [13]. Furthermore, the “reducing costs” tax reduction policy exhibits a dual effect of incentive and restriction and only fosters economic development when the tax burden structure aligns with the economic structure. Therefore, it is crucial to comprehensively consider the overall RECC situation, optimize the structure and system of supply-side reform, and achieve the co-ordinated improvement of resource utilization efficiency, economic effects, and environmental benefits.

5. Conclusions

In order to address the significant impacts of climate change, biodiversity loss, and environmental pollution on human life, achieving co-ordination among resource utilization, economic development, and environmental protection is imperative. This study defines the concepts of resources and environmental carrying capacity (RECC) from the perspective of industrial structure. It utilizes a multi-criteria TOPSIS model to assess three pairs of carrying capacities, namely NRSCC, EPACC, and SECC. The carrying capacity for natural factors is calculated based on the ratio of regional factor supply to demand, while the carrying capacity for economic factors, such as labor conditions, capital investment, and technological innovation, is determined by their ratio of economic development demand to social standards. Furthermore, the carrying capacity for environmental factors is assessed by comparing international per capita pesticide and fertilizer usage standards, carbon emissions standards, and the ideal capacity for accommodating environmental pollutants.
This study aims to establish a multi-dimensional evaluation index system for resource and environmental carrying capacity (RECC), assess and analyze the provincial RECC in China from 2005 to 2019, and explore the spatial-temporal differentiation characteristics of RECC and its sub-system support. Additionally, we empirically investigate the impact of supply-side reform on carrying capacity. Our research findings reveal the following key points: (1) currently, the provincial RECC in China is at a level of bearing capacity, with the highest capacity observed in the western regions, followed by the northeast, central, and eastern regions. The natural resource support capacity surpasses the social economy support capacity and the pollution absorption capacity of the environment. (2) RECC exhibits a wave-like upward trend, with an average annual growth rate of 6.28% from 2005 to 2010 and an average annual growth rate of 18.12% from 2016 to 2019. This indicates a significant acceleration in the increase in RECC after the implementation of the supply-side reform. Notably, only the environmental pollution absorption capacity (EPACC) demonstrates moderate spatial agglomeration, and the spatial correlation in the SECC, EPACC, and RECC has been steadily increasing over the years. (3) Our study verifies the positive impact of the supply-side reform on RECC, particularly through factors such as market factor reform, industrial upgrading and transformation, and a reduction in excess production capacity. The findings indicate that policymakers need to be prepared for shifting trends in RECC across different regions as supply-side reform continues to be promoted. In order to mitigate the impact on resources and the environment, it is advisable to consider measures such as slowing down the development pace in the eastern coastal regions and accelerating their industrial restructuring.
This article proposes measures to enhance resource utilization and environmental protection in different regions in China based on a spatial-temporal analysis of RECC and its sub-supporting capacity. These measures aim to promote concentrated development and the implementation of zoning/classification protection. For the western and northeastern regions, we recommend focusing on concentrated development to improve resource utilization efficiency and boost economic output. In the eastern coastal region, we suggest implementing zoning environmental protection measures and adopting classification-based environmental regulations that consider different environmental limitations. In the central region, efforts should be made to conserve and intensively utilize resources while ensuring equal environmental protection to prevent a decline in RECC. Furthermore, we emphasize the importance of market mechanisms for commercialized resource factors, where price mechanisms should guide their allocation. Non-commercialized resource factors, on the other hand, should prioritize meeting the basic needs of the population. In addition, we propose establishing appropriate compensation mechanisms, ecological voucher systems, and cross-regional control mechanisms to support the implementation of these measures. By implementing these recommendations, China can effectively improve resource utilization, protect the environment, and enhance the overall RECC in different regions of the country.

Author Contributions

Conceptualization, M.X., C.C., S.L. and D.S.; funding acquisition, M.X. and D.S.; methodology, M.X. and C.C.; software, M.X. and S.L.; validation, M.X. and C.C.; writing—original, M.X., C.C. and S.L.; writing—review and editing, M.X., C.C. and D.S. All authors have read and agreed to the published version of the manuscript.

Funding

This paper was sponsored by the Nanjing Agricultural University, the foundation of humanities and social sciences for basic scientific research of the Central University of China (Grant No. Skyz2018013).

Institutional Review Board Statement

Not applicable.

Informed Consent Statement

Not applicable.

Data Availability Statement

The data used for this study were obtained from the following public networks: https://data.stats.gov.cn/ (accessed on 6 March 2023); https://www.fao.org/home/en/ (accessed on 6 March 2023); https://www.ceads.net.cn/ (accessed on 6 March 2023); https://yearbook.enerdata.net/ (accessed on 6 March 2023); http://dg.cnsoc.org/article/2016b.html (accessed on 6 March 2023); https://www.mee.gov.cn/ywgz/fgbz/bz/bzwb/shjbh/shjzlbz/200206/t20020601_66497.shtml (accessed on 6 March 2023); https://english.mee.gov.cn/Resources/standards/Air_Environment/quality_standard1/201605/t20160511_337502.shtml (accessed on 6 March 2023).

Acknowledgments

The authors would like to thank the Editor and three anonymous reviewers for their useful and constructive comments. We thank them for their comments on reshaping the paper, model logic, and theoretical underpinning. All remaining errors and omissions are our responsibility.

Conflicts of Interest

We wish to confirm that there are no known conflict of interest associated with this publication, and there has been no significant financial support for this work that could have influenced its outcome.

Notes

1
Due to the significant concentration of population and socio-economic benefits, urban land is included in the indicators for monitoring socio-economic support capacity.
2
East region: Beijing, Tianjin, Hebei, Shanghai, Jiangsu, Zhejiang, Fujian, Shandong, Guangdong, and Hainan. West region: Inner Mongolia, Guangxi, Chongqing, Sichuan, Guizhou, Yunnan, Shaanxi, Gansu, Ningxia, Qinghai, And Xinjiang. Central region: Shanxi, Anhui, Jiangxi, Henan, Hubei, and Hunan. Northeast region: Liaoning, Jilin, and Heilongjiang.
3
The general perception is that the higher the population and economic development in a region, the higher it’s carrying capacity, based on an absolute number. However, this overlooks the equivalence of natural resource supply, human needs, and environmental pollution. As the population increases, so does the demand, and with greater economic development comes increased environmental pollution. This article presents a persuasive argument based on the supply-demand balance method, indicating that the resource and environmental carrying capacity exhibits a pattern of “higher in the west, lower in the east”. This finding underscores the significance of implementing the western development strategy at the national level.
4
The China Western Development Strategy aims to promote balanced economic and social development in the western region while narrowing the development gap with the eastern region. It prioritizes the improvement of infrastructure, such as transportation, communication, and energy facilities, to unlock the development potential of the western region. Additionally, the strategy emphasizes the advancement of modern agriculture, high-tech industries, and the service sector, facilitating industrial upgrading and fostering innovation-driven development in the western region.

References

  1. Zhang, Q.; He, K.; Huo, H. Cleaning China’s air. Nature 2012, 484, 161–162. Available online: https://www.nature.com/articles/484161a/ (accessed on 16 April 2023). [CrossRef] [PubMed]
  2. Zhang, Z.; Hu, B.; Qiu, H. Comprehensive evaluation of resource and environmental carrying capacity based on SDGs perspective and Three-dimensional Balance Model. Ecol. Indic. 2022, 138, 108788. [Google Scholar] [CrossRef]
  3. Fan, J.; Wang, Y.; Ouyang, Z.; Li, L.; Xu, Y.; Zhang, W.; Wang, C.; Xu, W.; Li, J.; Yu, J.; et al. Risk forewarning of regional development sustainability based on a natural resources and environmental carrying index in China. Earths Future 2017, 5, 196–213. [Google Scholar] [CrossRef]
  4. Running, S.W. A measurable planetary boundary for the biosphere. Science 2012, 337, 1458–1459. [Google Scholar] [CrossRef] [Green Version]
  5. Tu, Z.; Li, M.; Sun, T. The status and trend analysis of desertification and sandification. For. Resour. Manag. 2016, 1, 1–5. [Google Scholar] [CrossRef]
  6. Wang, Y.; Peng, B.; Wei, G.; Elahi, E. Comprehensive evaluation and spatial difference analysis of regional ecological carrying capacity: A case study of the Yangtze River urban agglomeration. Int. J. Environ. Res. Public Health 2019, 16, 3499. [Google Scholar] [CrossRef] [PubMed] [Green Version]
  7. Xu, M.; Yang, Z. The evaluation and analysis of coordinated development on resources and environment carrying capacity in southwestern mountainous area of China: A case of Dehong Dai-jingpo Autonomous Prefecture, Yunnan Province. J. Nat. Resour. 2016, 31, 1726–1738. Available online: http://www.jnr.ac.cn/CN/10.11849/zrzyxb.20151191 (accessed on 17 April 2023).
  8. U.S. Environmental Protection Agency. Four Township Environmental Carrying Capacity Study; Project No. 51830106; Progressive AE: Grand Rapids, NE, USA, 2002. Available online: http://www.ftwrc.org/publications/Envcapacity.pdf (accessed on 17 April 2023).
  9. Chen, J.; Huang, X.; Jing, Y.; Wen, Z.; Zang, C. Spatial and temporal variation and driving factors of ecological carrying capacity in the Pan-Pearl River Basin. China. Ecol. Indic. 2023, 151, 110318. [Google Scholar] [CrossRef]
  10. Millington, R.; Gifford, R. Energy and How We Live; Australian UNESCO Seminar, Committee for Man and Biosphere: Adelaide, Australia, 1973. [Google Scholar]
  11. Sleeser, M. Enhancement of Carrying Capacity Option-ECCO: Simulation Software for Assessing National Sustainable Development; The Resource Use Institute: London, UK, 1990. [Google Scholar]
  12. Arrow, K.; Bolin, B.; Costanza, R.; Dasgupta, P.; Folke, C.; Holling, C.S.; Jansson, B.-O.; Levin, S.; Mäler, K.-G.; Perrings, C.; et al. Economic growth, carrying capacity and the environment. Ecol. Econ. 1995, 15, 91–95. [Google Scholar] [CrossRef]
  13. Yu, S.; Zhang, L.; Zeng, Y.; Zhang, H. Dual influences of regulatory polices on real estate enterprises’ investment—Based on the perspective of supply-side reform in China. Financ. Res. Lett. 2017, 23, 50–57. [Google Scholar] [CrossRef]
  14. Zhang, J.; Dong, Z. Assessment of coupling coordination degree and water resources carrying capacity of Hebei province (China) based on WRESP2D2P framework and GTWR approach. Sustain. Cities Soc. 2022, 82, 103862. [Google Scholar] [CrossRef]
  15. Xu, M.; Feng, S.; Su, M.; Fan, P.; Wang, B. The evaluation of resource environment carrying capacity in Jiangsu Province on the factor supply perspective. Resour. Sci. 2018, 40, 1991–2001. Available online: http://www.resci.cn/CN/10.18402/resci.2018.10.08 (accessed on 18 April 2023).
  16. Yuan, L.; Ding, L.; He, W.; Kong, Y.; Ramsey, T.; Degefu, D.M.; Wu, X. Compilation of water resource balance sheets under unified accounting of water quantity and quality, a case study of Hubei Province. Water 2023, 15, 1383. [Google Scholar] [CrossRef]
  17. Zhao, Y.; Dai, R.; Yang, Y.; Fan, L.; Zhang, Y.; Wang, X. Integrated evaluation of resource and environmental carrying capacity during the transformation of resource-exhausted cities based on Euclidean distance and a Gray-TOPSIS model: A case study of Jiaozuo City. China Ecol. Indic. 2022, 142, 109282. [Google Scholar] [CrossRef]
  18. Lele, U.; Goswami, S. Agricultural policy reforms: Roles of markets and states in China and India. Global Food Secur. 2020, 26, 100371. [Google Scholar] [CrossRef]
  19. Niu, F.; Sun, D. Modelling the sustainability of China’s growth based on the resource and environmental carrying capacity. Acta Geogr. Sin. 2019, 74, 2604–2613. Available online: http://www.geog.com.cn/CN/10.11821/dlxb201912013 (accessed on 18 April 2023).
  20. Hao, X.; Deng, F. The marginal and double threshold effects of regional innovation on energy consumption structure: Evidence from resource-based regions in China. Energy Policy 2019, 131, 144–154. [Google Scholar] [CrossRef]
  21. Wang, X.; Song, J.; Duan, H.; Wang, X. Coupling between energy efficiency and industrial structure: An urban agglomeration case. Energy 2021, 234, 121304. [Google Scholar] [CrossRef]
  22. Zhang, S. The countermeasures of agricultural development in our country under the background of agricultural supply-side structural reform. S. China Agric. 2020, 14, 119–120. [Google Scholar] [CrossRef]
  23. Kongbuamai, N.; Bui, Q.; Nimsai, S. The effects of renewable and nonrenewable energy consumption on the ecological footprint: The role of environmental policy in BRICS countries. Environ. Sci. Pollut. Res. 2021, 28, 27885–27899. [Google Scholar] [CrossRef]
  24. Appiah, M.; Li, M.; Naeem, M.; Karim, S. Greening the globe: Uncovering the impact of environmental policy, renewable energy, and innovation on ecological footprint. Technol. Forecast. Soc. Chang. 2023, 192, 122561. [Google Scholar] [CrossRef]
  25. Kong, Y.; He, W.; Shen, J.; Yuan, L.; Gao, X.; Ramsey, T.S.; Peng, Q.; Degefu, D.W.; Sun, F. Adaptability analysis of water pollution and advanced industrial structure in Jiangsu Province, China. Ecol. Model. 2023, 481, 110365. [Google Scholar] [CrossRef]
  26. Hong, Y.; Ye, W. Measurement of sustainable carrying capacity and its application. China Popul. Resour. Environ. 1998, 3, 57–61. [Google Scholar]
  27. Zhao, D.; Zhang, X.; Deng, S. Evaluation theory and method of regional resources and environment carrying capacity. Chin. J. Appl. Ecol. 2022, 33, 591–602. [Google Scholar] [CrossRef]
  28. Liu, J.; Su, Y.; Wei, F. Research on population scale regulation of megacities based on the regional population carrying capacity. China Soft. Sci. 2013, 10, 147–156. [Google Scholar]
  29. Xu, M.; Liu, M. Early warning evaluation and warning trend analysis of resources and environment carrying capacity in Hunan province. Econ. Geogr. 2020, 40, 187–196. [Google Scholar] [CrossRef]
  30. Lin, W.; Su, J. Industrial Policy and deepening supply-side structural reform: A case study of power industry. Price Theory Pract. 2017, 1, 12–14. [Google Scholar] [CrossRef]
  31. Meadows, D.H.; Meadows, D.L.; Randers, J.; Behrens, W.W. The Limits to Growth, a Report for the Club of Rome’s Project on the Predicament of Mankind; Universe Books: New York, NY, USA, 1972. [Google Scholar]
  32. Wang, Y.; Sun, K.; Li, L.; Lei, Y.; Wu, S.; Wang, F.; Luo, J. The optimal allocation and the evaluation of water resources carrying capacity in Shendong mining area. Resour. Policy 2022, 77, 102738. [Google Scholar] [CrossRef]
  33. Tao, A. Study on the relationship between water resources utilization and economic development based on decoupling theory in Beijing. IOP Conf. Ser. Earth Environ. Sci. 2021, 687, 012207. Available online: https://iopscience.iop.org/article/10.1088/1755-1315/687/1/012207/meta (accessed on 19 April 2023).
  34. Naimi-Ait-Aoudia, M.; Berezowska-Azzag, E. Algiers carrying capacity with respect to per capita domestic water use. Sustain. Cities Soc. 2014, 13, 1–11. Available online: https://www.sciencedirect.com/science/article/pii/S2210670714000286 (accessed on 20 April 2023).
  35. Chen, D.; Zhou, Q.; Yu, L. Response of resources and environment carrying capacity under the evolution of land use structure in Chongqing Section of the Three Gorges Reservoir Area. J. Environ. Manag. 2020, 274, 111–169. [Google Scholar] [CrossRef]
  36. Esfandi, S.; Nourian, F. Urban carrying capacity assessment framework for mega mall development. A case study of Tehran’s 22 municipal districts. Land Use Policy 2021, 109, 105628. [Google Scholar] [CrossRef]
  37. Su, D.; Lian, L. Does green credit policy affect corporate financing and investment? Evidence from pubilicly listed firms in pollution- intensive industries. J. Financ. Res. 2018, 12, 123–137. [Google Scholar]
  38. Yuan, L.; Li, R.; He, W.; Wu, X.; Kong, Y.; Degefu, D.; Ramsey, T. Coordination of the industrial-ecological economy in the Yangtze River Economic Belt, China. Front. Environ. Sci. 2022, 10, 882221. [Google Scholar]
  39. Luo, Y.; Li, X.; Cai, G.; Zhao, D. A study on atmospheric environmental resource accounting: A case of SO2 capacity resources in Chinese provinces. J. Environ. Manag. 2019, 249, 109432. [Google Scholar] [CrossRef]
  40. Peng, J.; Tong, H.; Liu, X.; Feng, Y.; Zhu, Y.; Wu, Y.; Chu, Z.; Zheng, B. Comprehensive evaluation of water resources and environmental carrying capacity based on dualistic water cycle analysis and its application in the Tuo River Basin, China. Ecol. Indic. 2023, 146, 109897. Available online: https://www.sciencedirect.com/science/article/pii/S1470160X23000390 (accessed on 21 April 2023).
  41. Lin, L.; Ma, F. Spatical distribution and trends of the aging of population in Guangzhou. Geogr. Res. 2007, 05, 1043–1054. [Google Scholar]
  42. Li, L.; Lu, J. Response relationship and its influencing factors of carrying capacity of resource and environment in China’s Provincial urbanization. Econ. Surv. 2018, 35, 8–15. [Google Scholar] [CrossRef]
  43. Ke, S.; Zhao, Y. Industrial structure, city size and urban productivity in China. Econ. Res. J. 2014, 49, 76–88. [Google Scholar]
  44. Zhang, L.; Liu, H.; Chen, W. An issue on the national security of natural resources and environment for China. Adv. Earth. Sci. 2004, 2, 283–288. Available online: http://www.dqxxkx.cn/CN/Y2002/V4/I4/86 (accessed on 21 April 2023).
  45. Liu, Z.; Ling, Y. Structural transformation, TFP and high-quality development. J. Manag. World 2020, 36, 15–29. [Google Scholar] [CrossRef]
  46. Dieter, C.A.; Maupin, M.A.; Caldwell, R.R.; Harris, M.A.; Ivahnenko, T.I.; Lovelace, J.K.; Barber, N.L.; Linsey, K.S. Estimated Use of Water in the United States in 2015; U.S. Geological Survey, Water Availability and Use Science Program: Reston, VA, USA, 2018. [CrossRef]
  47. Li, R.; Guo, P.; Li, J. Regional water use structure optimization under multiple uncertainties based on water resources vulnerability analysis. Water Resour. Manag. 2018, 32, 1827–1847. Available online: https://link.springer.com/article/10.1007/s11269-018-1906-8 (accessed on 23 April 2023). [CrossRef]
Figure 1. System processes of the population–resource environment and sustainable development.
Land 12 01584 g001
Figure 2. Impact of supply-side reform mechanism on RECC.
Land 12 01584 g002
Figure 3. The annual growth rate of RECC in China from 2005 to 2019.
Land 12 01584 g003
Figure 4. Changing trends of RECC and its sub-system support capacity in all of China and in the eastern, central, western, and northeastern regions of China.
Land 12 01584 g004
Figure 5. The grading of RECC in China from 2005 to 2019.
Land 12 01584 g005
Table 1. Resource and environmental carrying capacity (RECC) indicators, system measurement methods, and standards.
RECCIndex LayerControl IndicatorsMeasurement MethodsMeasurement Basis and Standards
NRSCCCultivated land resource support capacitySupply and demand of grainGrain output/(regional population × per capita demand)International 400 kg grain security line
Supply and demand of vegetablesVegetable output/(regional population × per capita demand)“Dietary Nutrition Guidelines for Chinese Residents 2016”
Supply and demand of fruitFruit output/(regional population × per capita demand)“Dietary Nutrition Guidelines for Chinese Residents 2016”
Grassland resource support
capacity
Supply and demand of livestock and poultry meatLivestock and poultry output/(regional population × per capita demand)“Dietary Nutrition Guidelines for Chinese Residents 2016”
Supply and demand of milkMilk output/(regional population × per capita demand)“Dietary Nutrition Guidelines for Chinese Residents 2016”
Water resource support Capacity of domesticSupply and demand of urban waterUrban water supply capacity/(per capita daily demand × 365)“Urban Residential Water Standard”
Supply and demand of industrial waterTotal industrial water use/industrial water quota“Compilation of water quotas for provinces across the country”
Supply and demand of agricultural waterTotal agricultural water use/agricultural water use quota“Compilation of water quotas for provinces across the country”
Energy support capabilitySupply and demand of fossil(Standard coal)/World per capita fossil energy consumption a“Statistical Yearbook of World Energy 2020”
Supply and demand of powerTotal power generation/(regional population × per capita demand) bInternational per capita power consumption classification standard
SECCUrban Social Security CapabilityConstruction land guarantee capacityUrban construction land area/upper limit of regional planning“Urban Land Classification and Planning Construction Land Standards”
Traffic road guarantee capacityTraffic road area/(urban population × per capita demand)International standard of modern urban traffic land use 12 m2
Green space guarantee capacityUrban green area/(urban population × per capita demand)The planning upper limit is 9 m2 per person
Labor force, capital and technology innovation, and development capabilityLabor force development capabilityAging society standard c/Proportion of population aged 65 and over “Population Aging and Its Socio-economic Consequences”
Green credit development capability0.45 d/(The ratio of interest expenses of the six major energy-intensive industries to total interest expenses of all industries) e--
Scientific research development capabilityScientific research investment intensity/average level of countries in the world in that year“Global Development Index (1960–2021)”
EPACCAgri-environmental pollution assimilation capacity (PSC)PSC of agricultural pesticideInternational Standard/Amount of Pesticide per Unit of Cultivated LandInternational Standard for Pesticide Usage
PSC of agri-chemical fertilizersInternational standard/amount of chemical fertilizer used per unit of cultivated landInternationally recognized safe upper limit of chemical fertilizer application
Atmospheric pollution-assimilation capacity (PSC)PSC of carbon pollutionWorld average level of the year/per capita carbon emission“World Energy Statistical Yearbook 2020”
PSC of SO2Atmospheric SO2 ideal capacity/total SO2 emissionsAmbient Air Quality Standards [GB3095-2012]
PSC of smoke and dust assimilation capacityIdeal capacity of smoke and dust/total discharge of smoke and dustAmbient Air Quality Standards [GB3095-2012]
Water environment PSCPSC of ammonia nitrogenIdeal capacity/total discharge of ammonia nitrogenEnvironmental Quality Standard for Surface Water [GB3838-2002]
PSC of CODIdeal capacity/total discharge of CODEnvironmental Quality Standard for Surface Water [GB3838-2002]
Note: a According to international standards, the conversion factors between coal and coke, kerosene, gasoline, and diesel are 0.7143, 1.4714, 1.4714, and 1.4571, respectively. b The selected upper limit for per capita electricity demand in the third tier of the BRICS countries is 5000 kilowatt-hours per person. c A society is considered an aging society when the population aged 65 and above accounts for 7% or more of the total population. d An industrial structure is considered low-end if the output value of the six major high-energy-consuming industries exceeds 45% of the total industrial output value. e The credit structure is considered unreasonable if the interest expenditure of the six major high-energy-consuming industries accounts for more than 0.45 of the total industrial interest expenditure.
Table 2. Average value of RECC from 2005 to 2019.
RegionsProvincesRECC from 2005 to 2019RegionsProvincesRECC from 2005 to 2019
RECCNRSCCSECCEPACCRECCNRSCCSECCEPACC
EasternBeijing1.0381.2745.7590.715Western Sichuan3.2619.5592.2673.495
Tianjin0.8101.0623.2970.446Chongqing2.0911.3463.1063.144
Hebei0.98013.5051.8670.411Guizhou2.0002.5031.3664.193
Shanghai0.4610.4714.5250.476Yunnan3.31621.3381.2495.78
Jiangsu1.4682.4304.3560.590Shaanxi2.3834.792.5051.771
Zhejiang2.7053.2173.0662.418Gansu2.1702.561.9622.478
Fujian1.6451.0592.2273.136Qinghai1.9612.4891.1368.153
Shandong1.6875.9003.2520.493Ningxia2.0278.7254.0220.497
Guangdong2.5522.6834.4531.918Xinjiang2.6016.4592.0752.54
Hainan1.1500.7531.3533.772Guangxi3.32712.7832.5933.263
Average1.453.243.421.44Inner Mongolia2.5119.8192.3662.101
CentralShanxi1.8635.0681.8321.348Average2.517.492.253.41
Anhui1.3620.9240.5131.642NortheasternLiaoning1.5762.1203.2380.904
Jiangxi2.5363.1511.9513.247Jilin2.4025.9412.4431.944
Henan1.2368.9431.8370.637Heilongjiang2.92717.7352.9832.487
Hubei1.9282.0212.5831.726Average2.308.602.891.78
Hunan1.4000.9071.9102.476
Average1.723.501.7711.85National average1.985.382.692.27
Table 3. Lisa analysis of RECC and its sub-system support capacity.
Category2005–20102011–20152016–2019
Moran’s Ip ValueMoran’s Ip ValueMoran’s Ip-Value
NRSCC0.2280.2450.2290.2530.2450.181
SECC0.2230.2800.3140.0460.3050.075
EPACC0.4680.0030.4320.0010.6060.001
RECC0.3250.0520.2990.0880.2830.013
Table 4. Supply-side reform policy differentiation and its response to RECC growth.
VariablesBefore and After Supply-Side Reform and T-testEastern RegionCentral RegionWestern RegionNortheastern Region
HEIRBefore supply-side reform0.31680.38710.46200.3226
After supply-side reform0.33400.33800.54940.3579
T-test0.41630.01200.22660.0028
DCHIBefore supply-side reform−0.0327−0.0714−0.0538−0.0280
After supply-side reform−0.2042−0.4136−0.1861−0.0822
T-test0.00000.00000.00000.0328
TLIEBefore supply-side reform0.55930.59780.61370.5736
After supply-side reform0.53790.56110.61900.5928
T-test0.01590.01330.44500.0361
TMTBefore supply-side reform0.07680.04340.06820.0411
After supply-side reform0.10020.03460.05860.0590
T-test0.01720.01560.15040.0003
GD(logarithm)Before supply-side reform6.06276.80616.52976.7670
After supply-side reform7.54118.15937.89197.9523
T-test0.00000.00000.00000.0000
INDBefore supply-side reform1.30460.80021.01110.9408
After supply-side reform0.18841.13091.32010.1510
T-test0.00160.00000.00000.0000
ENREBefore supply-side reform8.603715.386818.104015.4748
After supply-side reform8.36607.793210.83568.9731
T-test0.80500.01780.00000.0009
IVENBefore supply-side reform1.22541.21981.63861.4790
After supply-side reform0.56620.85220.93940.5223
T-test0.00000.04970.00010.0000
RECCBefore supply-side reform1.28771.48912.14021.8333
After supply-side reform1.89502.35803.53903.5896
T-test0.00000.00000.00000.0000
Table 5. Bidirectional fixed-effect model analysis of the impact of supply-side reform on RECC.
RECCNRSCCSECCEPACC
EPCF−0.064 *** (0.017)−0.093 ** (0.038)0.013 (0.023)−0.032 (0.038)
MEF0.035 ** (0.016)−0.015 (0.044)0.009 (0.022)0.084 * (0.046)
ISF0.204 ** (0.078)0.430 * (0.219)−0.073 (0.096)−0.148 (0.204)
Regional Openness−0.020 (0.112)0.151 (0.388)0.030 (0.106)0.520 ** (0.245)
Proportion of Floating Population−0.203 (0.210)−0.577 (0.706)−0.171 (0.102)0.096 (0.540)
Per Capita Consumption Expenditure (logarithmic)−0.146 (0.232)1.382 ** (0.503)−0.097 (0.208)−0.564 (0.573)
Constant 1.849 (2.897)1.123 (10.138)1.151 (2.733)−10.646 (6.550)
Individual FEControlledControlledControlledControlled
Time FEControlledControlledControlledControlled
Observations450450450450
R-squared0.6760.4600.5500.589
Note: *, **, *** represent the significance levels of 10%, 5%, and 1%, respectively, and the robust standard errors are in brackets.
Disclaimer/Publisher’s Note: The statements, opinions and data contained in all publications are solely those of the individual author(s) and contributor(s) and not of MDPI and/or the editor(s). MDPI and/or the editor(s) disclaim responsibility for any injury to people or property resulting from any ideas, methods, instructions or products referred to in the content.

