Article

The Impact of Opening a High-Speed Railway on Urban Innovation: A Comparative Perspective of Traditional Innovation and Green Innovation

School of Economics and Management, Beijing Jiaotong University, Beijing 100044, China
*
Author to whom correspondence should be addressed.
Land 2023, 12(9), 1671; https://doi.org/10.3390/land12091671
Submission received: 18 July 2023 / Revised: 14 August 2023 / Accepted: 16 August 2023 / Published: 27 August 2023

Abstract

:
Transportation infrastructure is essential to regional innovation systems, and the high-speed railway (HSR) is reshaping China’s regional innovation pattern. Previous research lacks an analysis of the impact of opening an HSR on urban traditional and green innovation. This paper uses urban panel data from 285 prefecture-level cities in China from 2003 to 2019 to study the impact and mechanism of opening an HSR on urban innovation from a comparative perspective. The results of a multi-period difference-in-difference (DID) model show that opening an HSR can promote both traditional and green urban innovation, especially impacting urban green innovation. A further analysis of the mechanism of action found that high-quality talent and communication infrastructures are two crucial mechanisms of transmission for the opening of an HSR to affect urban innovation. In addition, heterogeneity analysis showed that opening an HSR promotes traditional urban and green innovation for cities in general. However, for central cities, the opening of an HSR has no significant impact on green innovation and has little effect on promoting traditional innovation. The policy inspiration of this paper is that, in the face of an innovation gap and the inequality of regional innovation and development, the construction of HSRs should be promoted according to local conditions. Construction and layout resources should be shifted from central cities to general cities to narrow the regional innovation gap. In addition, it is necessary to pay attention to the roles of the flow of high-quality talent and communication infrastructure in promoting urban innovation and sustainable urban development.

1. Introduction

Urban innovation is the primary driving force leading urban development. According to spatial economics theory, the construction of transportation infrastructure is the key to promoting regional economic growth and rebuilding regional spatial structures. The development of high-speed railways (HSRs) breaks traditional space–time distance constraints, accelerates the flow of innovation elements between regions, and has an essential impact on reshaping regional innovation patterns [1,2,3]. The International Union of Railways (UIC) defines an HSR as infrastructure for new lines designed for speeds of 250 km/h and above, and for upgraded existing lines designed for speeds of up to 200 or even 220 km/h (https://uic.org/, accessed on 7 July 2023). In 1964, Japan built the world’s first HSR, the Tokyo Shinkansen, with a total length of 515 km. The construction of this HSR accelerated the process of Japan’s industrialization (https://uic.org/IMG/pdf/uic-atlas-high-speed-2022.pdf, accessed on 7 July 2023). As of 2021, 15 countries worldwide have built HSRs, with a total operating mileage of 70,305 km. In 2008, China’s first HSR, the Beijing–Tianjin Intercity Railway, was officially opened. As of 2022, the operating mileage of China’s railways has reached 155,000 km; of this total, the operating mileage of the HSR has reached 42,000 km (https://www.mot.gov.cn/, accessed on 7 July 2023). In the past ten years, the operating mileage of China’s HSR has increased by 367%, forming an HSR network with a reasonable layout, extensive coverage, clear layers, and efficient configuration (Figure 1). The opening of an HSR significantly impacts economic growth [4,5]. The endogenous growth theory holds that innovation is a crucial driver of economic growth. Technological innovation activities primarily bring about an impetus for long-term economic growth [6]. Therefore, the question of how the opening of an HSR affects innovation has become a critical issue affecting the development of the national economy.
According to the measurable indicators of urban innovation, urban innovation can be divided into traditional urban innovation and urban green innovation. Patent data represent a relatively objective and quantitative indicator that covers various technical fields and industries in a city and can reflect a city’s innovation activities in multiple areas, which is helpful for comprehensively evaluating a city’s overall innovation strength. Patents can also be transformed into commercial value, creating jobs and driving economic growth. Therefore, patent data are often used to express the traditional level of urban innovation. However, with the deepening of the concept of green sustainable development, more attention and research has focused on urban green innovation. Green patents refer to technologies and innovations related to environmental protection, sustainable development, and resource conservation. Unlike ordinary patents, green patents focus on the contribution of technology to environmental protection and sustainable development. Therefore, green patent data are often used to express urban green innovation.
In terms of traditional urban innovation, the opening of the HSR dramatically reduced the space–time distance, strengthened the connections between cities, and facilitated the development of innovative activities [7]. An HSR significantly improves urban innovation by optimizing regional intercity accessibility, but this effect weakens as commuting time increases [8]. An HSR can significantly improve innovative collaboration at the city level, and the impact of an HSR on less-developed regions, service industries, and domestic business cooperation is more significant [9]. The more sites or lines are connected by an HSR, the more conducive the HSR is to promoting the growth of urban innovation and the integration of innovation, and the diffusion effect of the growth of innovation is better than the diffusion effect of the integration of innovation [2]. Green innovation is a crucial catalyst for sustainable development. With the deepening of the concept of green sustainable development, green innovation has gradually become the goal pursued by urban development. However, the abovementioned studies only focus on the impact of opening an HSR on traditional urban innovation. As a significant technological innovation, the HSR has profoundly affected regional sustainable development and, at the same time, had a substantial impact on urban green innovation. Therefore, the impact of opening an HSR on urban green innovation should be studied in depth.
Consequently, in recent years, some scholars have begun to pay attention to the impact of the opening of an HSR on urban green innovation. Zhou’s research found that the opening of the HSR had significantly improved the city’s green innovation performance, and that this boosting effect is increasing yearly. At the same time, the connection breadth of the HSR network has a positive impact on the city’s green innovation performance [10]. From the perspective of the mobility of innovation factors, Huang verified that HSRs promote the flow of innovation factors and, thus, contribute to the efficiency of green innovation. However, this effect changes dynamically over time, presenting an inverted U-shaped curve characterized by the pattern of “increase first and then decrease”, peaking in the fifth or sixth year [11]. Zhou studied the transmission mechanism of the opening of an HSR to urban green innovation by constructing a regional green innovation spillover model under the radiation path. The research showed that, in addition to production costs and spillover elasticity, production distribution and carbon emissions may affect the selection of regional green innovation transmission paths [12].
It can be seen that the opening of an HSR not only affects traditional urban innovation but also significantly impacts urban green innovation. Urban green innovation is a new goal proposed by urban development based on traditional urban innovation. However, although the above studies focused on the impact of the opening of an HSR on urban green innovation, they separated the relationship between urban green innovation and urban traditional innovation. Few existing studies have paid attention to the differences in the impact of the opening of an HSR on urban traditional and green innovation. The urban green innovation system is fundamental to realizing a city’s sustainable development. Cities are the spatial carriers of innovation. Faced with the dual constraints of resources and the environment, the matter of how to achieve high-quality innovation in cities has become an urgent problem that affects urban development. This article focuses on the impact of the opening of an HSR on urban innovation and compares and analyzes the impact of the opening of an HSR on traditional innovation and green innovation. It is assumed that the opening of an HSR can promote both urban traditional innovation and urban green innovation, but the promotion effect on urban green innovation is greater than that on traditional innovation.
Moreover, regarding the transmission mechanism of the opening of an HSR to urban innovation, the existing literature has studied it from the perspectives of knowledge spillover and labor flow [7,13]. Innovation is divided into the transmission of explicit knowledge and tacit knowledge. Explicit knowledge meets people’s long-distance communication needs through information technology, while tacit knowledge mainly relies on face-to-face communication. An HSR has high levels of timeliness and safety, which reduces the time cost of the cross-regional flow of innovative elements and can better meet the needs of the time-sensitive and high-quality cross-regional flow of talent. However, there are disagreements as to how the opening of an HSR will promote the cross-regional flow of high-quality talent and how this will affect the innovation levels of cities along the line [14,15]. In addition, communication infrastructure provides a digital platform for information exchange for urban innovation. The opening of HSRs has accelerated the speed and efficiency of information transmission, making it easier for people to use network services. However, communication infrastructure has been neglected as one of the vital transmission mechanisms whereby the opening of an HSR may affect urban innovation. Therefore, this paper assumes that high-quality talent and communication infrastructure are the transmission mechanisms through which the opening of an HSR affects the level of urban innovation.
The marginal contributions of this paper are as follows: First, most existing research has focused on whether the opening of HSRs will promote urban innovation. This paper compares the impact of the opening of HSRs on traditional and green innovation. Second, since the opening of an HSR is a step-by-step process, this paper expands the traditional DID model and uses a multi-period DID model for empirical analysis. Third, this paper introduces the intermediary effect model to explore whether talent factors and communication infrastructure are the transmission mechanisms through which the opening of HSR affects urban innovation. We analyze the differences between the two as mediator variables in terms of the impact on traditional and green innovation.
The subsequent sections of this paper are arranged as follows: The second part contains the literature review and research hypothesis. The third part presents the research design, including model construction, data description, and data sources. The fourth part contains an analysis of the empirical results, including benchmark regression, robustness tests, and mechanism analysis. The fifth part presents the conclusions and countermeasures.

2. Literature Review and Mechanism Analysis

2.1. Literature Review

Since the Industrial Revolution, the regional economy’s cyclical process of rising and falling has been accelerating, and the problem of cluster decline is evident. Cluster fading problems are mostly related to path dependence and lock-in [16]. Less normative and more process-oriented learning clusters help to liberate regional economies from path dependence and are favored by most economic geographers [17,18]. The development of new economic geography has brought more attention to the “economic distribution effect” of transportation infrastructure, and the degree of the mutual influence of economic development in different regions is higher [19]. As an essential part of the regional innovation system or innovation network [20], the transportation infrastructure can strengthen the cross-regional flow of innovation elements among different subjects and has an essential impact on improving the innovation network and promoting regional innovation activities [21,22]. The frequent exchange of ideas is the agglomeration force driving various spatial phenomena [23], but large amounts of frequent and high-quality information can also lead to the failure of economic agents [24]. An HSR is an essential factor influencing the urban innovation system as a typical element of transportation infrastructure. The existing literature has studied the impact of HSR openings on urban innovation from the perspectives of trade, investment, technology, and talent flow, but there are differences in the impact of HSR openings on urban innovation and the transmission mechanism.
Some research contends that opening an HSR promotes the cross-regional flow of elements, which is conducive to improving urban innovation. The opening of HSRs has led to the continuous accumulation of homogeneous elements, further promoting the transfer of urban industries and specialization, especially the agglomeration of talent elements and investment elements, which is of great significance in optimizing the industrial structure and promoting urban innovation and development [25]. Although the development of informatization has expanded the communication methods of human society, and the Internet has made it possible to connect information across time and space, face-to-face communication is still the most efficient and comfortable means of communication between people. High-quality talents represent essential carriers of knowledge, and talent flow creates knowledge. The cross-regional flow of high-quality talent promotes the dissemination of knowledge among cities along the line, as well as the creation of new knowledge, promoting technological progress and knowledge overflow [26]. However, although the above literature generally affirms the positive impact of the opening of HSRs on urban innovation, it ignores the differences in impact between individual cities. The impact of the opening of HSRs on urban innovation cannot be generalized.
Therefore, some research suggests that the opening of HSRs does not improve the innovation level of all cities, but that there is a siphon effect or diffusion effect, and innovation elements flow in an unbalanced manner among cities along the line. The siphoning effect dominates urban agglomerations with a low degree of integration. This part of the literature argues that improving transportation infrastructure will promote the cross-regional flow of innovation elements. Driven by the decrease in the cost of moving times and the profit-seeking nature of the economy, high-quality talent and elements will gather in economically developed areas, generating local market effects and further stimulating the development of central cities [27]. The surrounding cities then lose talent and other elements, reducing urban innovation. Urban agglomerations with a higher degree of integration emphasize the diffusion effect. Such studies suggest that, with the opening of the HSR, elements continue to gather. Land prices in central cities and housing costs for the labor force have risen. The congestion costs caused by the agglomeration of elements will restrain parts of the labor force from moving to the central city and avoid market competition. The central city’s development continues to radiate to the surrounding cities along with the flow of elements, driving the economic development of the surrounding cities [28]. However, this part of the literature only analyzes the traditional innovation of cities, ignoring whether the flow of green innovation elements caused by the opening of HSRs is balanced among cities.
Urban green innovation is crucial to sustainable development and environmental protection. It can help cities to reduce energy consumption, reduce pollution emissions, improve resource utilization efficiency, and promote economic growth and sustainable social development [29]. The opening of an HSR can reduce carbon emissions within and between cities, thereby promoting the city’s transition to a low-carbon economy and stimulating the demand and motivation for green innovation in cities. The rapid transportation capacity of HSRs can promote the flow of talent and technologies between cities, further promote regional economic development, and provide a more comprehensive cooperation platform and more resource support for innovation [30]. The opening of an HSR can promote the linkages between cities and surrounding areas, break down regional barriers, realize economic resource sharing, mutual benefits, and win–win exchanges between cities, and then realize the optimal allocation of resources. They promote the sharing and cooperation of urban green innovation by building a collaborative innovation network, as well as providing more resource guarantees and development spaces for urban green innovation [31]. The opening of an HSR can promote the regional economy’s rapid development and improve a city’s comprehensive competitiveness. This improvement in competitiveness will attract more resources, such as technology and capital, to gather in cities, providing better conditions for urban green innovation. However, there is still a lack of in-depth research in the existing literature on how the opening of an HSR affects the cross-regional flow of green innovation elements, as well as which transmission mechanisms are mainly used to achieve urban green innovation.
In summary, although the existing literature has explored the relationship between the opening of HSRs and urban innovation, some issues are still worthy of further exploration. The difference between the impacts of the opening of HSRs on traditional innovation and green innovation also remains to be investigated, as does the transmission mechanism of the impact of the opening of HSRs on traditional and green innovation. The heterogeneity of the impact of the opening of HSRs on traditional and green innovation is another issue to be considered. The following section contains a theoretical analysis of the above issues and proposes our research hypotheses.

2.2. Mechanism Analysis

Compared with classic cars and airplanes, an HSR has a higher passenger capacity, is less time-consuming, and has good safety and punctuality. Moreover, HSRs have further broken the spatial barriers between regions, shortened travel distances, optimized people’s travel methods, and changed the distribution pattern of the labor force [32]. The opening of an HSR can promote the industrial division of labor and cooperation so that enterprises and R&D institutions in different cities can cooperate more efficiently and jointly promote scientific and technological innovation [33]. Meanwhile, HSRs can also promote the flow and exchange of talent so that outstanding talent can flow between cities and communicate more freely, promoting innovation cooperation between cities, and providing more ideas and motivation for urban innovation [34]. In addition, the opening of an HSR can promote cooperation in e-commerce, online education, and other fields between cities so that urban innovation can be more fully integrated into production and life and provide more convenient and efficient services and support for enterprises and individuals in cities [35]. The opening of an HSR also affects the level of urban green innovation. First, the informatization construction, innovation base construction, and policy support along the HSR can all improve the ecological environment and conditions for urban innovation, providing more stable and long-term support for urban innovation [36]. Next, the opening of an HSR can promote green exchanges and cooperation between cities, strengthen the interactions and connections between cities, and promote the dissemination and exchange of green technologies, products, and services [37]. Due to the convenience and efficiency of the HSR, urban residents can more easily carry out cross-city green exchanges and cooperation and accelerate the promotion and application of green technologies and products [38]. Furthermore, the HSR can promote exchanges and cooperation between city governments, promote experience exchange and policy docking in environmental protection and green development, form a complete urban green innovation policy system, and further optimize the urban innovation ecology and policy environment. Based on the above analysis, this paper proposes the following research hypothesis:
Hypothesis 1.
The opening of an HSR has a more substantial promotion effect on green innovation than on traditional innovation.
The opening of an HSR constitutes an updating of transportation means and an important mechanism for driving urban innovation and development. High-quality talent is one of the critical influencing mechanisms for the opening of an HSR to promote urban innovation. High-quality talent has high levels of knowledge, skills, and innovation awareness, can quickly adapt to new environments and jobs, and actively explores ways and means of innovation and development. Gathering and exchanging high-quality talent can promote knowledge sharing and technical exchanges between cities, bring new business opportunities and market demands, and stimulate innovation vitality [39]. The opening of HSRs has shortened the distance between cities, promoted the flow and exchange of talent, increased cooperation and exchanges between different cities, and created favorable conditions for the gathering and exchanging of high-quality talent [40]. The opening of an HSR provides more employment opportunities and development space for high-quality talent. The opening of the HSR provides a fast and convenient travel experience and closely connects the industrial and talent chains between cities. The cooperation and exchanges between different cities provide more employment opportunities and development space for high-quality talent. The opening of an HSR can also provide more learning and exchange opportunities for high-quality talent. High-quality educational resources and scientific research institutions in different cities can achieve better interaction and cooperation through the convenient transportation of HSRs, which promotes knowledge dissemination and sharing, accelerating technological innovation and progress [41]. In addition, the opening of an HSR provides faster technological updates and applications for postal and telecommunications businesses, enabling them to achieve a nationwide layout more quickly, reliably, and conveniently. In HSR networks, various intelligent information technologies have been widely used, improving the security and efficiency of the HSR network and providing better technical updates and application opportunities for postal and telecommunications services. Through e-commerce, online finance, and other platforms, postal and telecommunications businesses enable enterprises in cities to expand their business and markets more conveniently, thus expanding the city’s innovative service scenarios and business models. Based on the above analysis, this paper proposes the following research hypotheses:
Hypothesis 2.
The HSR affects urban innovation by promoting the flow of high-quality talent.
Hypothesis 3.
The HSR affects urban innovation by promoting the development of postal and telecommunications services.
The impact of the opening of HSRs on urban innovation is a complex process, and its degree and mode of influence are heterogeneous across different city levels and locations [42,43]. Regional economic development is affected by both centripetal and centrifugal forces. Large cities have advantages such as advanced infrastructure, sufficient economic resources, good education services, and a medical environment. With the opening of HSRs breaking down traditional geographical restrictions, the time cost for people to move across regions has decreased. More resources, talent, industries, and other elements gather in HSR transportation hubs and cities along the HSR, creating a siphon effect [44]. As a result, the resources of the surrounding cities are lost, and the level of urban innovation decreases. At the same time, the excessive concentration of resources in large cities has increased the cost of congestion in those cities. With the improvement of the economic development levels of large cities, the use cost of land resources rises, which leads the housing costs of the labor force to rise. The high cost of living has caused parts of the labor force to move to surrounding cities. The process of labor transfer also brings with it advanced innovative technologies and innovation achievements, which drive the development of cities in the inflowing areas and produce a diffusion effect [45]. In addition, there is a problem of uncoordinated regional economic development in China’s eastern, central, and western regions, and the effects of the opening of the HSR are not the same across these regions. Thus, the impact of the opening of the HSR on urban innovation cannot be generalized, and different city locations and city levels may affect its influence. Based on the above analysis, this paper proposes the following research hypothesis:
Hypothesis 4.
The impact of the opening of the HSR on urban innovation has location-based and city-level heterogeneity.

3. Research Design

3.1. Model Building

This paper uses a multi-period DID model to study the impact of the opening of the HSR on urban innovation. Compared with traditional econometric analysis methods, such as the ordinary least squares regression model, the DID model can better avoid endogenous problems caused by omitted variables [46]. The DID model can control the individual heterogeneity between samples and the influence of unobservable overall factors that change over time, so an unbiased estimate of the policy effect can be obtained. The DID model requires an experimental group affected by the policy and a control group not affected by the policy. Before the policy intervention, the treatment and control groups must show a common trend. China’s HSR construction is decided by the National Development and Reform Commission and the China State Railway Group Co., Ltd., and it is less strongly affected by local governments. Therefore, this article regards the opening of the HSR as a quasi-natural experiment. The cities where the HSR is opened are set as the experimental group, and the cities where the HSR is not opened are set as the control group. Since there are differences in the opening times of the HSR in prefecture-level cities, this paper constructs a multi-timepoint DID model, as shown in Formula (1):
y i t = α 0 + β 1 H S R i t + γ j X j i t + η t + μ i + ε i t
where i represents the number of individuals and t represents the number of periods. The explained variable y i t is the logarithm of urban innovation, indicating the level of urban innovation; α 0 is the intercepted item, and β 1 is the estimated coefficient, indicating the impact of the opening of the HSR on urban innovation. HSR represents the dummy variable of the year when the HSR was opened; the value is 0 if the HSR is not opened and 1 when the HSR is opened. X j i t represents the j control variables selected in this paper, and γ is the corresponding estimated coefficient; η t is the time fixed effect, μ i is the individual fixed effect, and ε i t is the random error item.

3.2. Variable Setting

3.2.1. Core Explanatory Variable: Opening of the HSR

This paper takes the dummy variable (HSR) of whether the HSR was opened in 285 prefecture-level cities in China from 2003 to 2019 as the core explanatory variable. The explanatory variables in this paper only focus on the cities where the HSR stops at the station and do not consider the city stations where it does not stop. If multiple HSR lines are opened in the same city, the year of the first opening prevails. The HSR mainly opens in Chinese cities in the second half of the year, and it takes a certain amount of time for the opening of the HSR to impact urban innovation. Therefore, this paper lags the opening year of the HSR in all prefecture-level cities by one year.

3.2.2. Dependent Variable: Urban Innovation

The existing research on the measurement indicators of urban innovation mainly includes R&D input or expenditure, total factor productivity (TFP), and the number of patent applications or authorizations. R&D investment or expenditure measures the level of urban innovation from a financial perspective, and the authenticity and availability of data are poor. Technological progress in the TFP indicator refers to all factors contributing to economic growth except for the increase in factors. The error of using this indicator in an imperfectly competitive market is extensive. Patent data are open, complete, and time-sensitive, and compared with patent application data and authorization data they can better reflect the transformation of innovative achievements. Patents include inventions, utility models, and designs. Utility model and design patents only need formal examination, while invention patents must undergo substantive examination, with stricter examinations and higher technical value. Therefore, this paper authorizes invention patents representing ordinary innovation (Ln(Innoit + 1)). The level of urban green innovation reflects the transformation from innovation growth to innovation development. This paper uses green invention patent authorization to represent urban green innovation (Ln(Ginnoit + 1)).

3.2.3. Control Variable

This paper sets the following control variables based on Lu’s research [47]: (1) The level of economic development (LnPgdp). This paper uses the nominal GDP of prefecture-level cities in China to de-price the base period of 2003 to obtain the actual GDP of each year and then divide it by the total population at the end of the corresponding year. Thus, we obtain the real GDP per capita. In order to prevent excessive absolute values from having an impact on the statistical results, logarithmic processing is performed at the end. (2) The level of industrial structure (Ind). This paper uses the proportion of the secondary industry’s added value in the GDP of prefecture-level cities to express this variable. (3) The opening level to the outside world (LnFdi). This paper uses the amount of foreign capital utilized by prefecture-level cities to be converted into CNY at the actual exchange rate of USD to CNY in the year and expressed in logarithms. (4) The level of financial development (Fin) is represented by the ratio of the sum of the deposits and loan balances of prefecture-level cities to GDP at the end of the year. (5) Urbanization level (Urb). This paper uses the logarithm of the proportion of the population of prefecture-level cities and municipal districts to the city’s total population. (6) Human capital level (LnStu). This paper uses the logarithm of the number of students in ordinary middle schools per thousand people in prefecture-level cities. (7) Internet development level (LnNet). This paper uses the logarithm of the number of Internet users per thousand people in prefecture-level cities. (8) Government support (Sup). This paper uses the proportion of science education expenditure in the fiscal expenditure of prefecture-level cities to express this variable.

3.2.4. Subsubsection

This paper selects the geographic slope data (Slope) of prefecture-level cities as an instrumental variable and uses ArcGIS10.8 software to calculate them based on the instrumental variable (China Geography 90 m resolution digital elevation data). This paper selects the talent factor (Tal) and communication infrastructure (LnInf) as mechanism variables. Talent includes not only scientific researchers who have already entered the workforce, but also college students who are about to enter the workforce. Therefore, the talent element variable in this paper is expressed by the sum of the number of employees in scientific research, technical services, and geological exploration and the number of students in public colleges and junior colleges in the city’s total population. For communication infrastructure, this paper uses the per capita postal and telecommunications business volume; that is, the proportion of the sum of postal and telecommunications services in prefecture-level cities to the city’s total population at the end of the year is expressed in logarithms.

3.3. Data

The Beijing–Tianjin Intercity Railway opened in 2008 and is internationally recognized as China’s first HSR. In order to observe the changes in the level of urban innovation before and after the HSR’s opening, and to ensure data availability, this paper chooses 2003 as the starting point of the research. The samples of the empirical research in this paper come from the panel data of 285 prefecture-level cities in China from 2003 to 2019. Considering the reasons for the adjustment of administrative divisions of prefecture-level cities, this paper excludes Chaohu, Sansha, and other regions. Considering the reasons for the withdrawal of land and establishment of cities in prefecture-level cities, this article excludes Bijie, Tongren, and other areas. In order to ensure the integrity and availability of the data, this paper finally retains 285 prefecture-level cities for empirical research, and the elimination of samples has little impact on the total sample size. The indicators at the city level mainly come from the EPS database, WIND database, CSMAR database, National Bureau of Statistics, “China Statistical Yearbook”, “China City Statistical Yearbook”, and “China Regional Economic Statistical Yearbook”. The urban innovation data mainly come from the Chinese patent database. Patent data are among the leading indicators currently used by scholars to measure urban innovation. The general patent and green patent data used in this article are all from the State Intellectual Property Office of China, which is authoritative. Smoothing and linear interpolation filled in the gaps left by some missing data for individual years. The HSR opening data were manually compiled according to the opening times of HSR lines in the “China Railway Yearbook” and the website of China State Railway Group Co., Ltd. The descriptive statistics of the main variables of the 285 cities are shown in Table 1.

4. Empirical Results

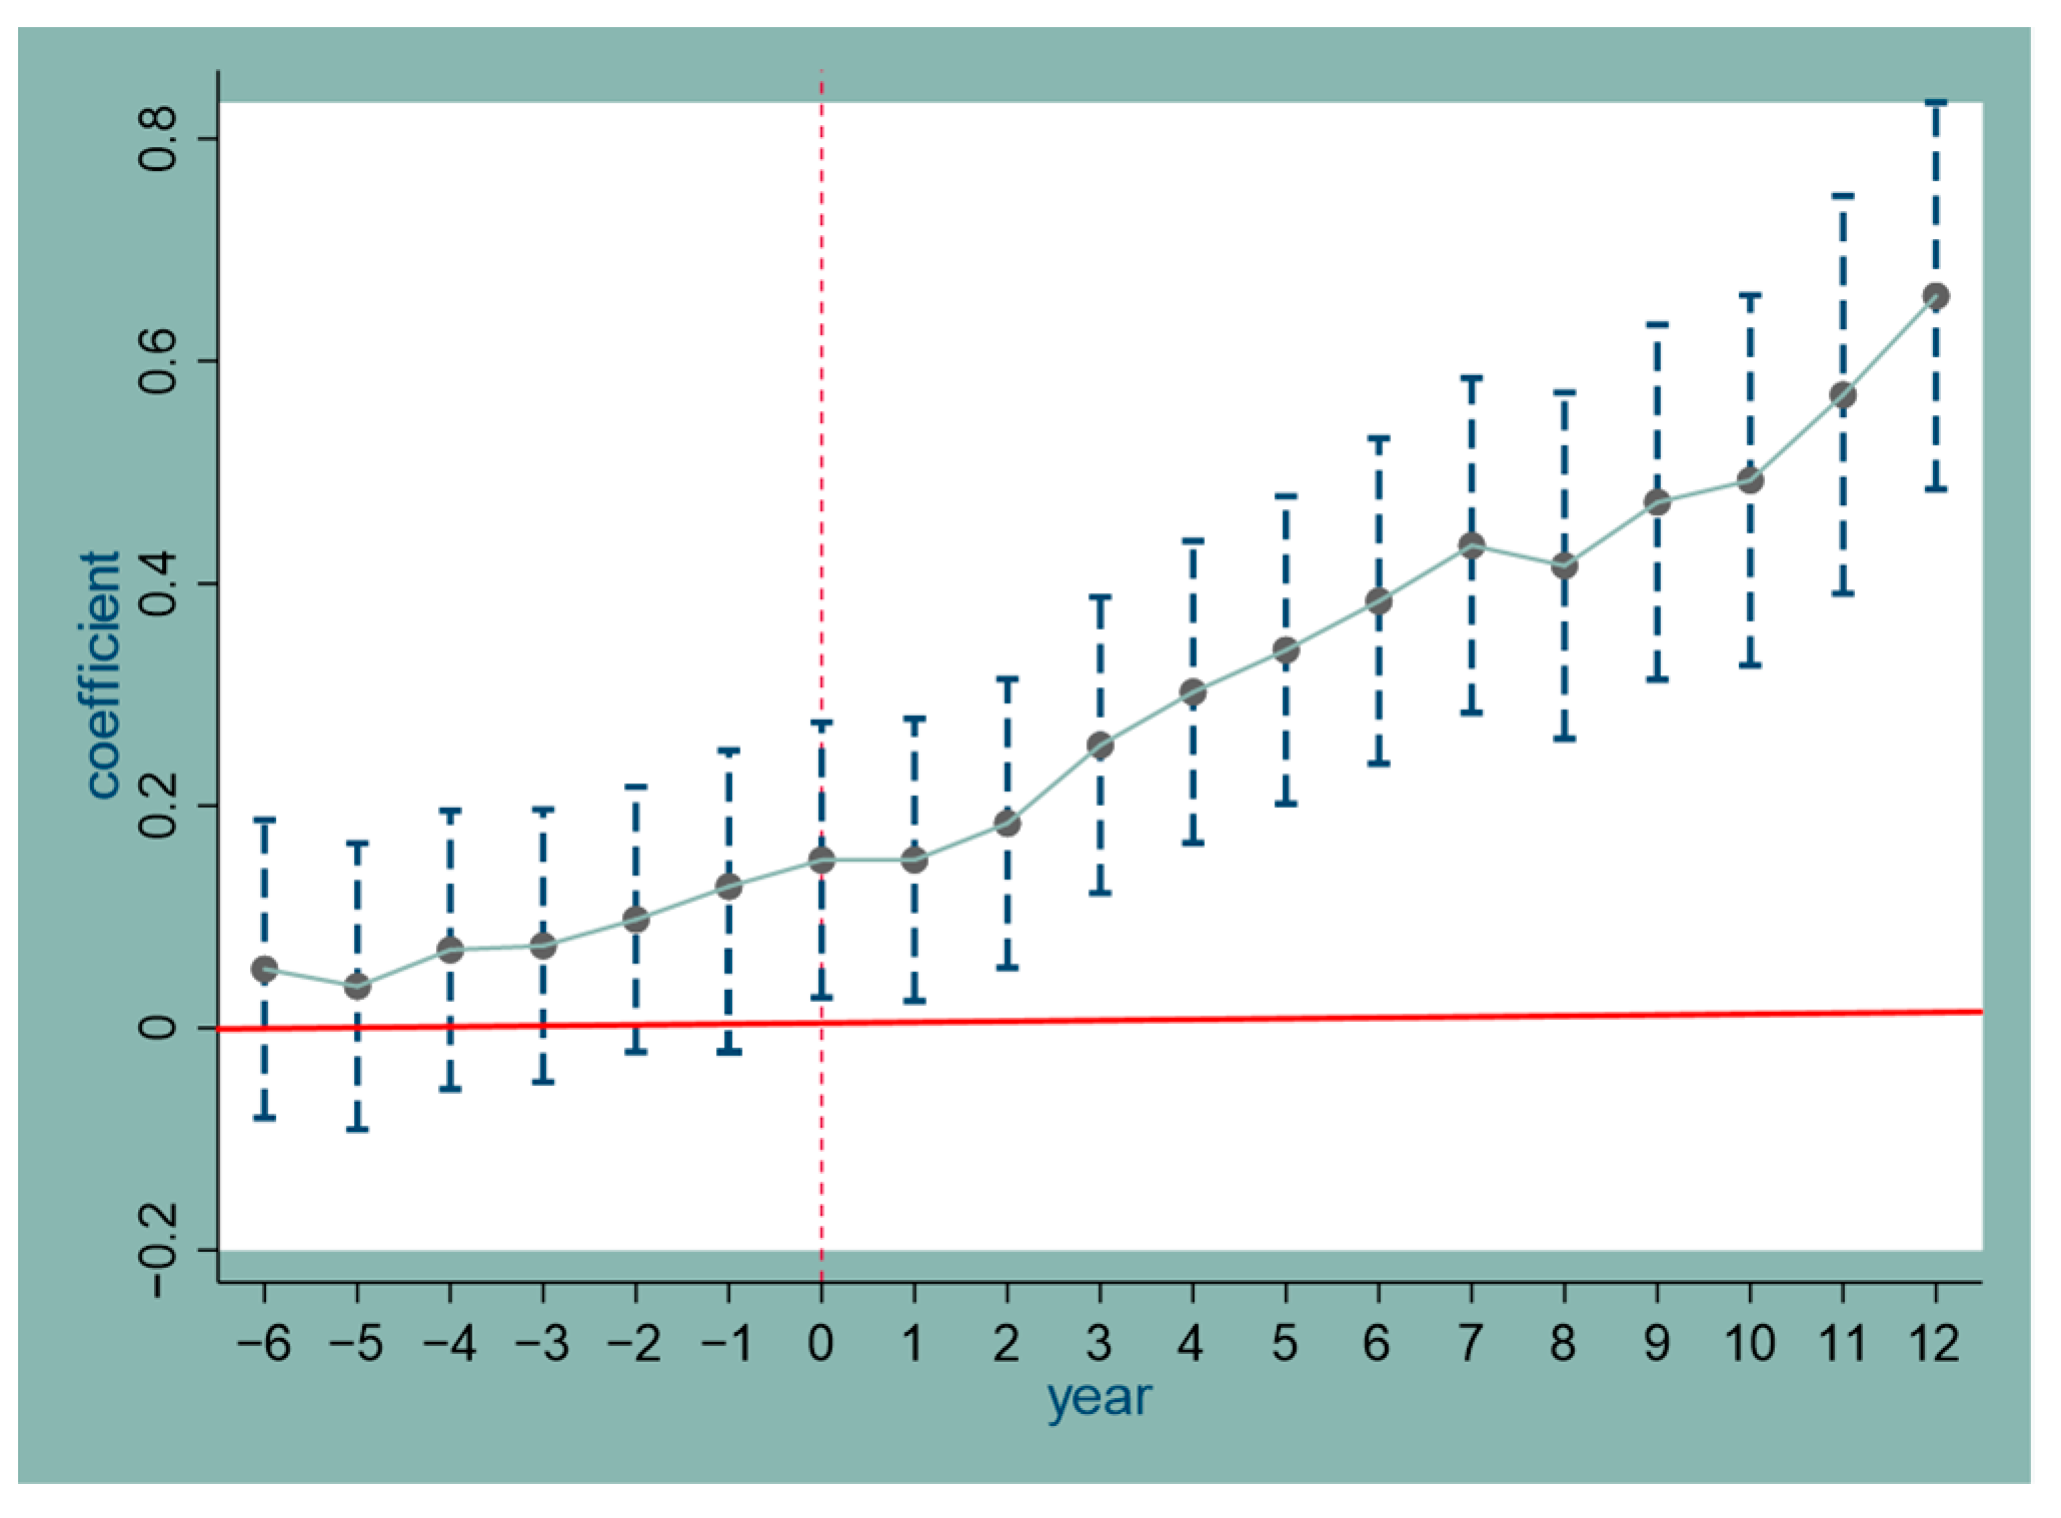
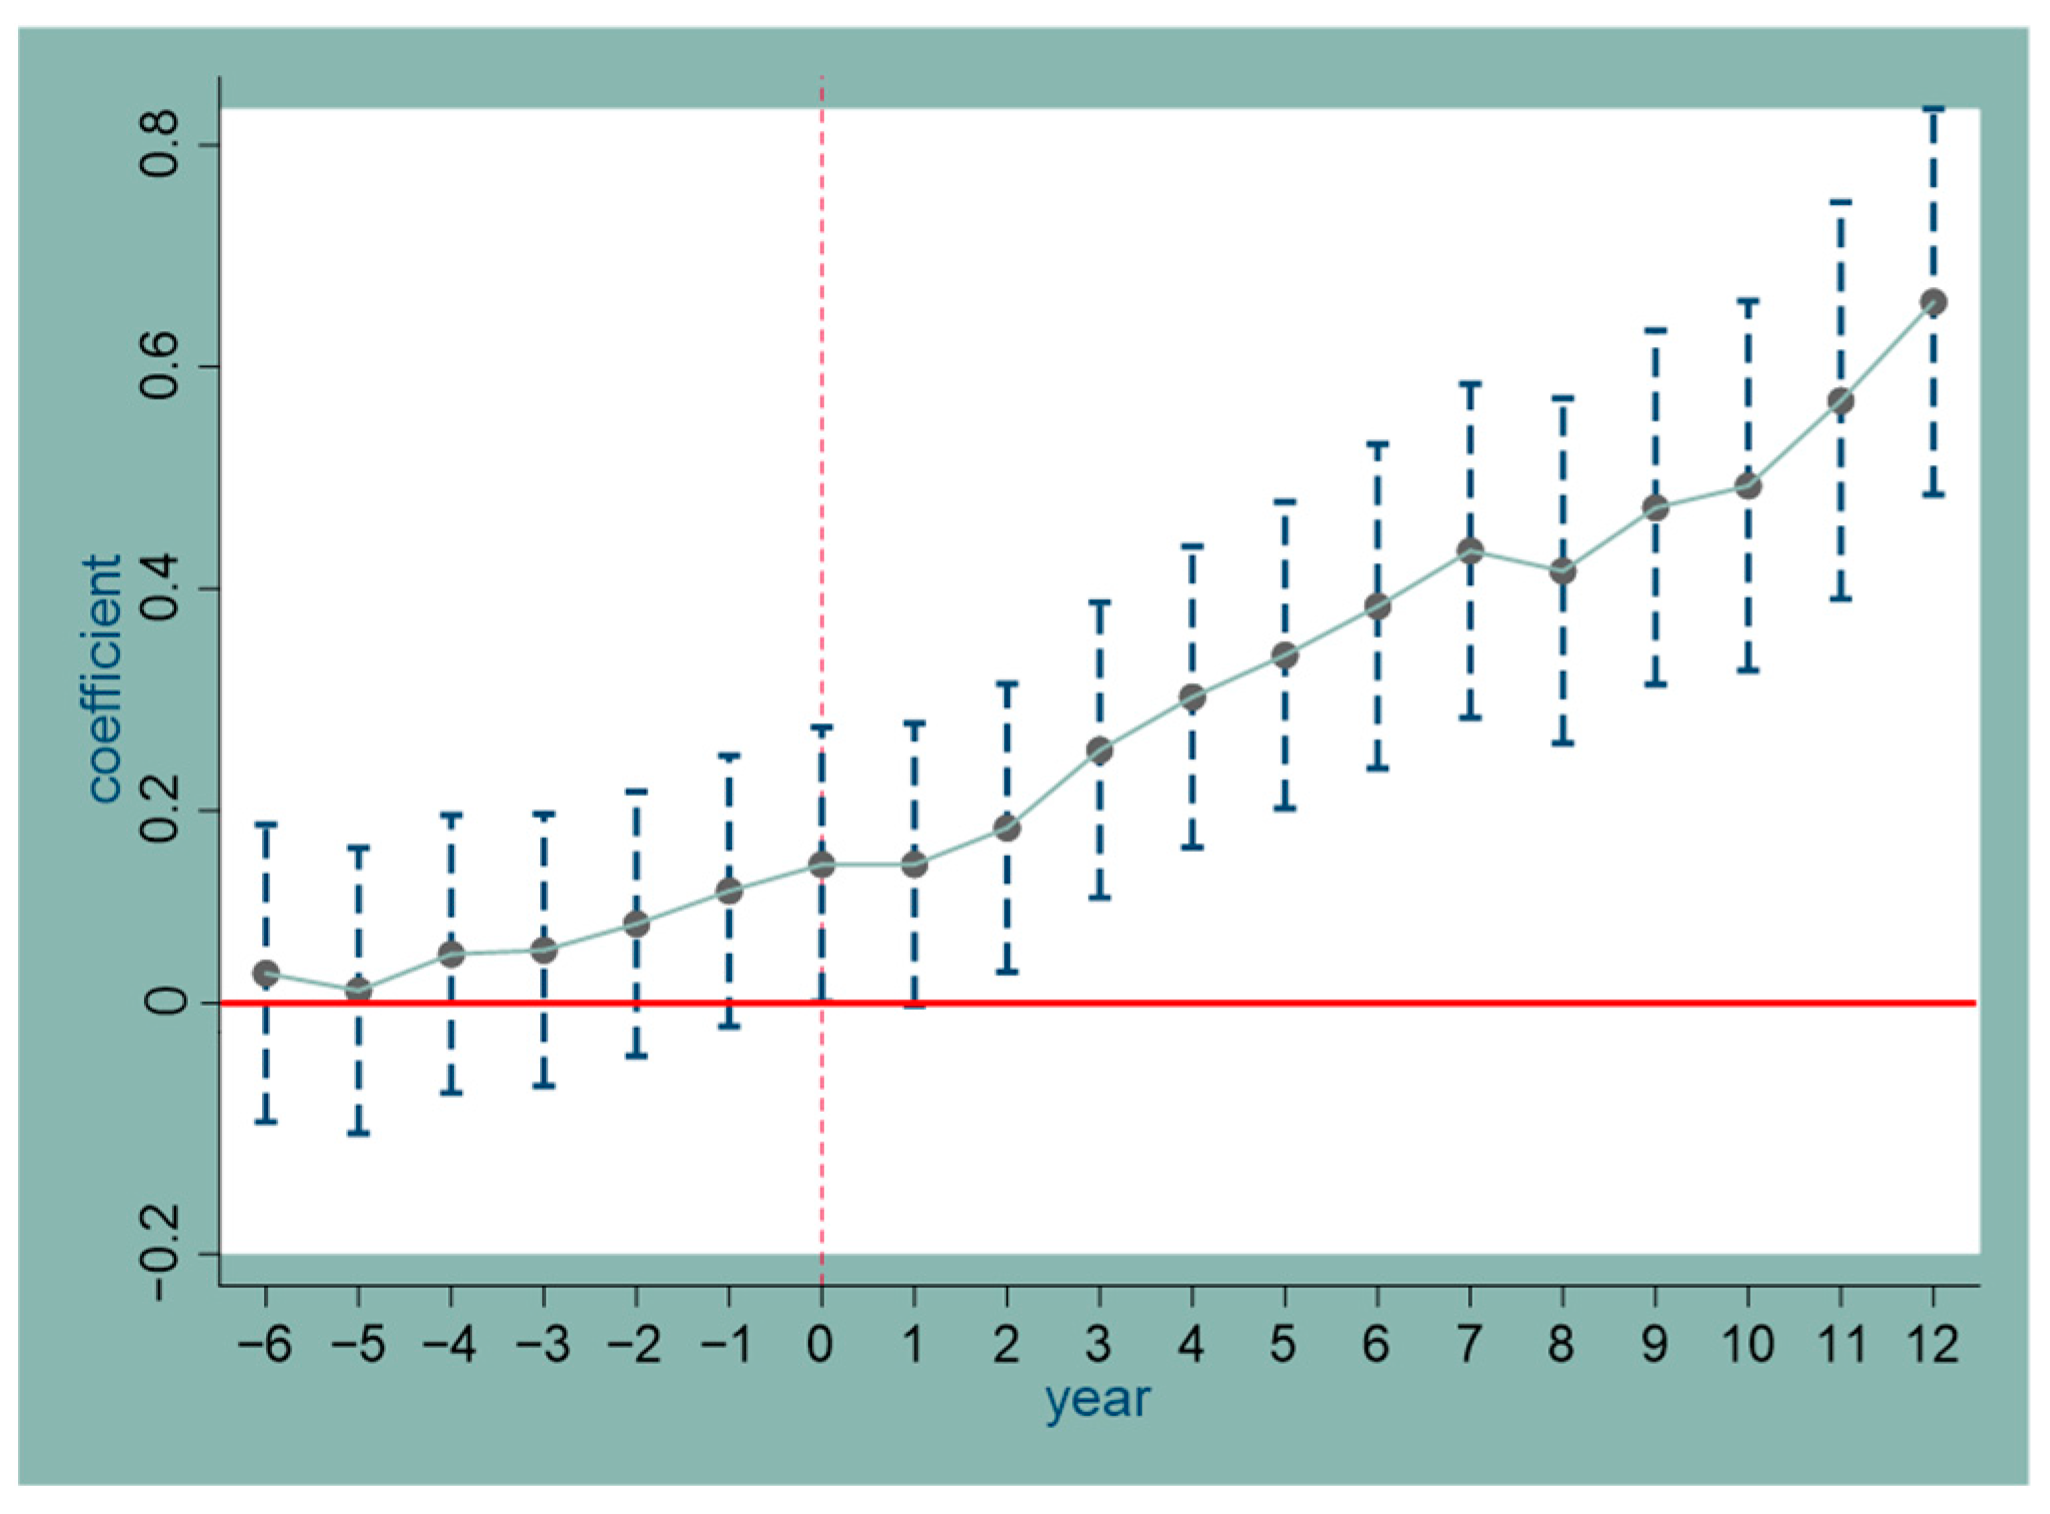
4.1. Parallel Trend Test

The parallel trend test is an important and premise assumption used by the time-varying DID model. For this paper—that is, before the exogenous shock of the opening of the HSR—the change trends of the urban innovation level of the experimental and control groups should be the same. Otherwise, even if the trend of the experimental and control groups changes after the opening of the HSR, this may be caused by other factors rather than policy implementation. Since the opening times of the HSR in each city are inconsistent, verifying the parallel trend according to the traditional DID method is impossible. Therefore, this paper uses Beck’s [48] method to build the following model to test the parallel trend:
y i t = α 1 + T = 1 6 β T H S R i , t T + β H S R i t + T 12 β + T H S R i , t + T + γ j X i t + η t + μ i + ε i t
where T represents the year, and β represents the impact of the opening year of the HSR. β T represents the impact of T years before the opening of the HSR, and β + T represents the impact of T years after the opening of the HSR. H S R i t is a dummy variable, which takes the value of 1 if city i opened its HSR in year t and takes the value of 0 otherwise. X i t represents a series of control variables for city i in year t; η t and μ i represent the time fixed effect and the city fixed effect, respectively; ε i t is the random disturbance item. The results of the parallel trend test are shown in Figure 2 and Figure 3. Figure 1 shows the test result of the parallel trend of the opening of the HSR on the city’s traditional innovation level, and Figure 2 shows the test result of the parallel trend of the HSR on the city’s green innovation level. Figure 1 and Figure 2 both show that, before the opening of the HSR, the 95% confidence interval includes 0, and the coefficient estimates of the experimental group and the control group are insignificant in each period, indicating that this paper can use a multi-period DID model. After the opening of the HSR, the 95% confidence intervals no longer include and are all greater than 0, indicating that the opening of the HSR has a significant positive treatment effect on urban innovation; thus, this paper has passed the parallel trend test. At the same time, after the opening of the HSR, the impact coefficient increases year by year, and the impact of the HSR on the level of urban innovation gradually increases with time.

4.2. Basic Analysis

In this paper, Model 1 is regressed to test the effect of the opening of the HSR on the level of urban innovation. The regression results are shown in Table 2, where (1)–(3) are the regression of the city’s traditional innovation level to the opening of the HSR, and (4)–(6) are the regression of the city’s green innovation level to the opening of the HSR; (1)–(6) are all significantly positive at the 1% confidence level, indicating that the opening of the HSR has improved urban innovation; (2) and (5) did not control fixed effects but added control variables, such as economic development, opening to the outside world, and government support; the regression coefficients were 0.536 and 0.603, respectively, and the regression coefficients were all significantly positive at the 1% confidence level. This shows that the opening of the HSR has significantly improved urban innovation without controlling time and personal effects. Meanwhile, (3) and (6) increase the control variables and control the city fixed effects and time fixed effects; the regression coefficients are 0.202 and 0.288, respectively, and the regression coefficients are all significantly positive at the 1% confidence level. This result shows that, when controlling the two-way fixed effect, the opening of the HSR is still conducive to promoting urban innovation. In addition, by comparing the results of the three regressions, it can be shown that the impact of the opening of the HSR on green innovation is more significant than that on ordinary innovation. The baseline regression results validate Hypothesis 1.
According to the benchmark regression results, the opening of the HSR significantly positively impacts the level of traditional [8] and green innovation [11] in cities, as is consistent with previous research results. However, this paper further concludes that the opening of the HSR has a more significant impact on urban green innovation than on urban traditional innovation. Both financial development and opening to the outside world have significantly promoted the city. This finding shows that the city’s financial development and the government’s support for innovation activities are significant for its innovation and development. Both the level of urbanization and the level of Internet development have no significant impact on traditional urban innovation but have a significant impact on urban green innovation. High-level urbanization can promote the digitization and intelligence of urban infrastructure and promote the application of new technologies in urban management, thereby helping to achieve the goals of urban greening and sustainable development. The development of the Internet has accelerated the updating of electronic products, resulting in more electronic waste, which impedes urban green innovation. It can be seen that different control variables have different impacts on urban traditional innovation and green innovation and cannot be generalized.

4.3. Robustness Test

4.3.1. Regression Analysis Based on the PSM-DID Method

Compared with cities without an HSR, the urban innovation level of cities with an HSR is generally higher. The DID model is policy-oriented, does not have the independence of random experiments, and is prone to sample self-selection bias. The PSM model uses the propensity score to match the treatment group to the control group with similar characteristics as much as possible, making the DID sample more random [49]. Before using PSM-DID, the standard support hypothesis test should first be conducted. The test results of the matching variables showed no significant differences in any variables after matching, and the PSM-DID method could be used for robustness testing. The inspection steps were as follows: First, LnPgdp, Ind, LnFdi, Fin, Urb, LnStu, LnNet, and Sup are selected as matching characteristic variables. Second, logit regression was used to estimate the propensity score, and the one-to-one nearest-neighbor matching method was selected for propensity score matching. Finally, average treatment effects were calculated across the matched samples. The matching results are shown in Table 3. After using the PSM-DID method, the opening of the HSR still had a promoting effect on improving urban innovation. Based on the propensity score matching of the samples, the opening of the HSR had a 2.1% promotion effect on the city’s traditional innovation level and a 3.2% promotion effect on the city’s green innovation level. There was no significant difference between the estimated results of PSM-DID and the baseline regression results, once again showing that the opening of the HSR is conducive to improving urban innovation, and the baseline regression results are robust.

4.3.2. Replace the Dependent Variable

The number of patent applications refers to the number of applications for technical inventions accepted by patent institutions, which reflects whether the city is actively pursuing technological development activities. The higher the number of patent applications, the higher the innovation capability of a city and the more dynamic it is. In this paper, the number of invention patent applications is used instead of the number of invention patent authorizations, and the number of green invention applications is used instead of the number of green invention patent authorizations, so as to regress the basic model and test the robustness of the baseline regression results. The regression results are shown in Table 4. The regression coefficients of the dummy variables for the opening of the HSR in (13)–(18) are all significantly positive at the 1% confidence level, indicating that the opening of the HSR can promote the improvement of the level of urban innovation. Once again, the robustness of the baseline regression results is demonstrated.

4.3.3. Instrumental Variable Method

The opening of the HSR is not entirely random, and there may be two-way causality between the opening of the HSR and the level of urban innovation. In order to ensure the robustness of the regression results, this paper uses the instrumental variable method to solve the endogeneity problem. The average geographical slope index (Slope) belongs to the objectively existing natural geographical conditions, which are not directly related to urban innovation activities and are exogenous. In addition, the average geographic slope index (Slope) directly affects the difficulty and cost of HSR construction and is an essential factor affecting the opening of HSRs in cities. Therefore, the slope meets the selection criteria for instrumental variables. Therefore, this paper uses the two-stage least squares method for regression estimation, and the regression results are shown in Table 5. It can be seen from Table 5 that the impact coefficients of the opening of the HSR on traditional innovation and urban green innovation are still significantly positive. The regression results of the first stage show that, for both ordinary innovation and green innovation, the average geographical slope of the city has a significant negative impact on the opening of the HSR, which confirms the validity of the instrumental variable. In addition, this paper also includes a weak instrumental variable test. Table 5 shows that the Cragg–Donald Wald F statistic value is 17.645, which is greater than 10 and passes the validity test of instrumental variables. The p-values of the Hausman test for traditional innovation and urban green innovation are 0.012 and 0.011, respectively—both less than 0.05, rejecting the null hypothesis that all independent variables are exogenous and confirming the endogenous nature of the model. In the case of endogeneity, the impact of the opening of the HSR on urban innovation still exists.

4.3.4. Tailed Regression

According to the descriptive statistics results shown in Table 1, there are extreme outliers in the variables. In order to avoid the interference of extreme values with the regression results, we carried out 1% and 5% shrinkage regressions on multiple variables. The regression results are shown in Table 6, where (21) and (22) show that, excluding the impact of extreme values, the regression coefficient is still significantly positive at the 1% confidence level, indicating that the opening of the HSR still has a promoting effect on the traditional level of innovation in cities. Meanwhile, (23) and (24) show that, excluding the impact of extreme values, the regression coefficient is still significantly positive at the 1% confidence level, indicating that the opening of the HSR promotes urban green innovation. In summary, the 1% and 5% underrunning regression results on the variables once again prove the robustness of the baseline regression results.

4.4. Mechanism Analysis

4.4.1. Mediating Effect Test Based on Talent Factors

Talent establishes a country and leads businesses to prosper. The location-based advantage of the opening of the urban HSR affects the urban innovation pattern by accelerating the flow and agglomeration of innovation. High-quality talent is essential for knowledge flow and technological innovation in today’s innovation-driven development context. As the core element affecting innovation and development, high-quality talent is knowledge-intensive and technology-intensive. The cross-regional flow of high-quality talent between cities can accelerate the dissemination of knowledge and technology, thereby generating new knowledge, affecting the development of regional innovation activities, and improving innovation performance. In order to test how the opening of the HSR affects urban innovation capabilities through talent factors, this paper constructs the following mediation effect model:
y i t = α 0 + α 1 H S R i t + γ j X j i t + η t + μ i + ε i t
T a l a n t i t = α 2 + α 3 H S R i t + γ j X j i t + η t + μ i + ε i t
y i t = α 4 + α 5 H S R i t + α 6 T a l a n t i t + γ j X j i t + η t + μ i + ε i t
where y i t represents the level of urban innovation, represented by the traditional level of urban innovation and the above level of urban green innovation. T a l a n t i t represents the element of talent, expressed by the sum of the number of employees in the scientific research, technical services, and geological survey industries and the number of students in public colleges and junior colleges in the city’s total population. H S R i t is a dummy variable for the opening of the HSR. The regression results of Models 3–5 are shown in Table 7. Table 7 shows that, for ordinary innovation and green innovation, the opening of the HSR has a significant positive effect on high-quality talent, and the impact of high-quality talent on the urban innovation level also has a significant positive effect. This shows that high-quality talents are the intermediary variable of the HSR affecting urban innovation. The intermediary effect ratio of high-quality talent for traditional innovation in cities is 11.08%. The intermediary effect ratio of high-quality talent for urban green innovation is 10.88%. There is not much difference between the two.
The possible reasons for these findings are as follows: First, the opening of the HSR has promoted population mobility and connections between cities, which are conducive to disseminating knowledge and generating innovation. As people’s travel becomes more and more convenient, the exchange and cooperation of high-quality talent have become more frequent and convenient, resulting in a “learning effect”. This population flow and exchange is conducive to exchanging knowledge and technology and generating innovation among cities, thus promoting the overflow of knowledge. Second, the opening of the HSR has promoted in-depth exchanges between different innovation subjects, and the concept of green and sustainable development has been better disseminated. Different innovation subjects can learn from one another by engaging in communication and cooperation, resulting in an imitation effect and, thus, promoting the dissemination of knowledge and technology and the generation of innovation. Finally, high-quality talent can promote cultural exchanges and academic exchanges between cities. Scholars and researchers in different cities can communicate and cooperate more conveniently and conduct research and innovation jointly. In the process of mutual learning, we can broaden our horizons and see the shortcomings of ourselves and of advanced technology over time. In order to avoid being in a disadvantaged position in the competition, and to improve one’s technological development status, there is an incentive effect. This shows that the cross-regional flow of high-quality talent is an essential mechanism for the opening of the HSR to affect urban innovation, and Hypothesis 2 has been verified.

4.4.2. Inspection of Regulation Mechanisms Based on Communication Infrastructure

The communication infrastructure provides a digital platform for information exchange in relation to urban innovation. The opening of the HSR has accelerated the speed and efficiency of information transmission, making it easier for people to use network services. The question remains as to whether the opening of the HSR will affect the development of communication infrastructure and promote urban innovation. In this paper, the postal telecommunications business is used to indicate the level of communication infrastructure construction, and the postal telecommunications elements and the explanatory variable HSR opening are used to carry out transportation and decentralization. The regression results are shown in Table 8. It can be seen from (31)–(34) that, after introducing the interaction term of H S R × l n I n f , it has a significant positive effect on both traditional and green innovation, and the regression coefficient decreases significantly. This shows a solid complementary relationship between the opening of the HSR and the construction of the communication infrastructure, and the interaction between the two has dramatically stimulated urban innovation. Furthermore, the promotion effect on the city’s green innovation level is stronger than that on the city’s traditional innovation level.
The specific reasons for this finding may be as follows: First of all, the opening of the HSR makes the flow of people, goods, and information between cities more convenient, increasing the demand and the market for the construction of communication infrastructure, and promoting the development of communication infrastructure construction. For example, in cities along HSR lines, communication networks’ coverage and signal quality have been significantly improved. The opening of the HSR has also led to the development of related industries, such as the application of communication technologies such as smartphones and wireless networks. The popularization of these technologies has further promoted the construction of information technology in cities. Second, the opening of the HSR has promoted cooperation and exchanges between cities because, with the opening of the HSR, exchanges between cities have become more frequent and convenient, promoting innovation. For example, cities along HSR lines can promote cooperation and innovation through joint scientific research projects and industrial development. This kind of cooperation can bring about economic benefits, promote the sharing of knowledge and technology, and improve the innovation capacity of cities. Third, the HSR has also impacted the cities’ fixed communication infrastructure. The opening of the HSR requires the support of the communication infrastructure, which will promote the cities’ network construction. In cities along the HSR line, improving network speeds and quality will facilitate the transmission and exchange of information and promote communication between enterprises, as well as between enterprises and consumers. With the acceleration of network construction, the digital transformation of cities will also be accelerated, which will benefit cities’ green innovation and development. In addition, cities along the HSR can jointly explore innovation and business models and enhance their innovation capabilities through innovative practices. In summary, null Hypothesis 3 was verified.

4.5. Heterogeneity Analysis

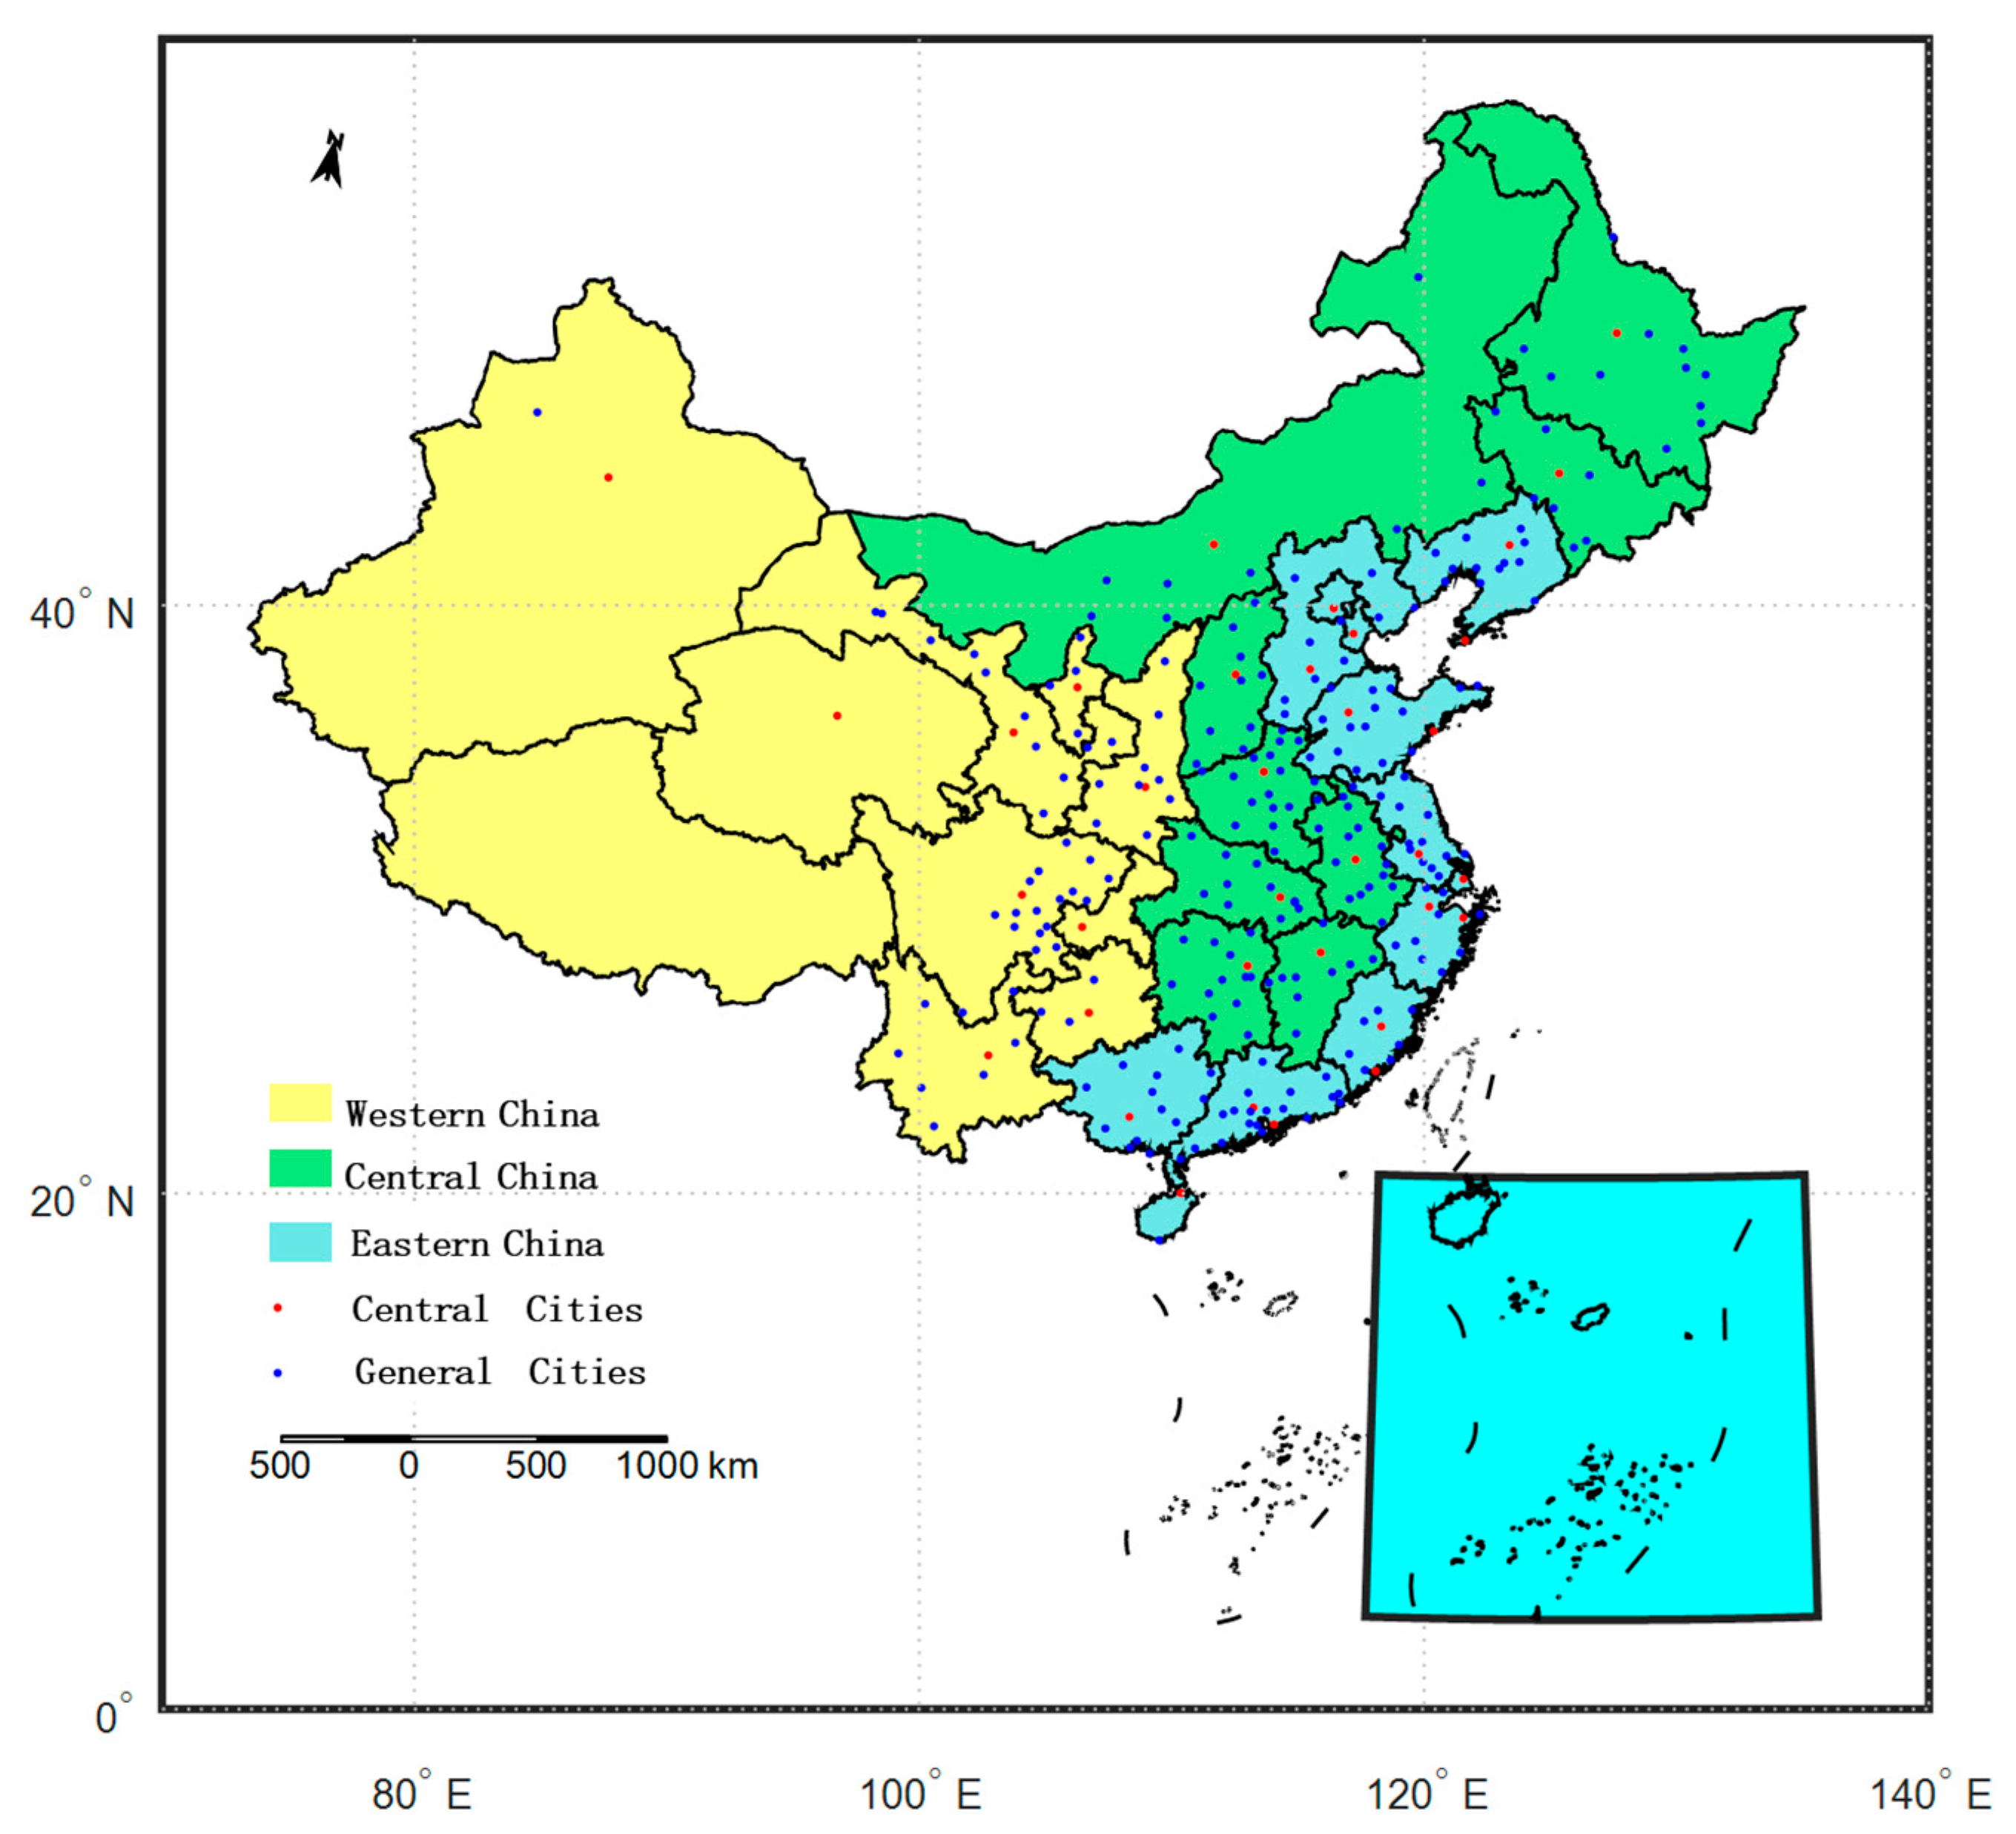
4.5.1. Location Heterogeneity

Considering the development gap between different regions, we divided all samples into eastern, central, and western regions according to urban location and performed regression (Figure 4). The results are shown in Table 9. It can be seen from (35)–(40) that the regression coefficients are significantly positive at the 5% confidence level for traditional and green innovation. Specifically, for traditional innovation in cities, the impact coefficients of the opening of the HSR on the east, middle, and west are 0.087, 0.254, and 0.171, respectively. The opening of the HSR has the most apparent promotion effect on urban innovation in the central region, followed by the west, and the effect is weakest in the east. Regarding urban green innovation, the impact coefficients of the opening of the HSR on the east, middle, and west are 0.159, 0.244, and 0.336, respectively.
The reason for the heterogeneity of traditional innovation locations may be that the cities in the central region have strong agglomeration abilities. There are many cities in the central region, the distance between cities is relatively short, and the urban agglomeration is relatively complete, forming a relatively stable economic and social environment. The opening of the HSR can connect these cities more conveniently, improve the efficiency of exchanges and cooperation, and promote the agglomeration effect. At the same time, the level of urban infrastructure in the central region is relatively low, and the transportation network is comparatively underdeveloped. Inconvenient transportation has become a bottleneck that restricts local development. The opening of the HSR has changed this situation and enhanced the connection and interaction between the central region and other regions. People can reach other cities more quickly and conveniently via the HSR, thereby accelerating the circulation and dissemination of information inside and outside the region, and promoting the occurrence and development of innovative activities. In contrast, the eastern region already had a relatively complete transportation network and a developed economic system in the early days, and its cities were relatively mature and developed, so it was less dependent on the HSR. Moreover, as the urban density in the eastern region is increasing more and more, the impact of the HSR on urban innovation in the eastern region is steadily decreasing. Although the level of urban development is relatively low in the western region, the construction of the HSR has been affected to varying degrees due to geographical constraints and the development history, resulting in a slightly weaker impact on urban innovation than in the central region.
The possible reasons for the location-based heterogeneity of green innovation are as follows: It is clear that the opening of the HSR has the most apparent promotion effect on the urban innovation level in the western region, followed by the central region, and its effect is the weakest in the eastern region. As far as the western region is concerned, due to its geographical location close to the Eurasian continent and far from the inland market, it is relatively backward and requires more funds and resources for development. The operation of the HSR has dramatically shortened the distance, in terms of time and space, between the western region and other regions, enabling enterprises in the western region to deliver products, technologies, and services to other regions more quickly, further promoting the development of the regional economy. The HSR also provides more opportunities for enterprises in the western region to discover market demand, improve products, and innovate services. The impact of the opening of the HSR on urban green innovation is inversely proportional to the level of economic development. The eastern and central regions have higher levels of relative economic development and better transportation infrastructure, and they are less affected by the opening of the HSR. In summary, our original Hypothesis 3 was verified.

4.5.2. City-Level Heterogeneity

There are inherent differences in the economic levels of different cities, and they respond differently to the flow of innovation factors. This paper divides all samples into central and general cities for the heterogeneity analysis (central cities refer to municipalities directly under the central government, provincial capital cities, and sub-provincial cities, while the rest are general cities) (Figure 4). Table 10 shows that, for general cities, the impact coefficients of the opening of the HSR on traditional innovation and urban green innovation are 0.221 and 0.285, respectively, and are significant at the 1% level. This result shows that the opening of the HSR has significantly improved the urban traditional innovation levels and urban green innovation levels of ordinary cities. For central cities, the regression result of the opening of the HSR on urban green innovation is not significant.
The possible reasons for the above results are as follows: The central cities already have a relatively complete transportation network and infrastructure, have gathered high-quality elements such as talent, investment, and technology, and are less dependent on the opening of the HSR. In addition, the industrial structure of central cities is based chiefly on tertiary industry, and the more active promotion of energy-saving and emission-reducing technologies and concepts has formulated a series of related policies and standards, such as energy-saving measures for buildings and transport, and the promotion of low-carbon travel methods, such as new-energy vehicles and intelligent public transportation. The central cities have reduced their energy consumption and greenhouse gas emissions by optimizing their industrial structure and improving their energy efficiency. They have paid more attention to the green and sustainable development of the economy and already possess a significant capacity for urban green development. Therefore, the opening of the HSR has no significant impact on the level of green innovation in central cities. As far as ordinary innovation in cities is concerned, the impact of the opening of the HSR on central cities is lower than that on ordinary cities, at only 10.6%. Because the overall transportation infrastructure in central cities is relatively complete, and the level of urban economic development is relatively high, the impact of the opening of the HSR is relatively small. Hypothesis 4 was further verified.

5. Conclusions and Implications

Innovation is an essential source of strength for sustainable urban development. Using the panel data of 285 prefecture-level cities in China from 2003 to 2019, this paper employed a multi-period DID model to analyze the differences in the impacts and mechanism of the opening of the HSR on traditional innovation and green innovation. The four research hypotheses of the original paper were verified. The research found that, first, the opening of the HSR has promoted urban traditional and urban green innovation, and the opening of the HSR has played a more significant role in promoting urban green innovation. Second, the impact of the opening of the HSR on urban innovation is heterogeneous. The transportation infrastructure in central cities is relatively complete and, compared with ordinary cities, these cities are less strongly affected by the opening of the HSR; sometimes, there is no impact at all. Similarly, the eastern region has the highest levels of economic development and the most advanced rapid transportation infrastructure. Compared with the central and western regions, it is less affected by the opening of the HSR. Third, the impact of the opening of the HSR on urban innovation is affected by the flow of high-quality talent and communication infrastructure, and urban green innovation is more strongly moderated by communication infrastructure.
The opening of the HSR is an essential means of promoting urban innovation, and the construction of the HSR should be promoted in a planned and restrained manner. First, we should focus on strengthening the government’s support for the construction of the HSR in general cities. The government has played an important guiding and promoting role in constructing the HSR. The government should formulate relevant policies, provide financial support, strengthen planning and management, and promote the smooth progress of HSR construction. The opening of the HSR has no significant impact on green innovation in central cities and has little impact on traditional innovation in central cities. The HSR is generally constructed earlier in central cities, and the line network is relatively dense, meaning that it can meet the needs of urban innovation and development. In contrast, there are fewer HSR lines in general cities, and the density of HSR stations is low. The construction of the HSR in general cities should be strengthened, and the integrated development of the HSR and urban innovation should be strengthened to form an effective pattern of mutual promotion and advancement.
Second, the construction of communication infrastructure should be strengthened. Communication infrastructure is an important transmission mechanism whereby the HSR affects urban innovation. We must establish a wide-ranging, high-quality communication network to provide better network connection and communication services. A good communication network will facilitate the efficient operation of postal services, such as express delivery, parcels, and mail, and meet users’ needs for fast and stable communications. By introducing technologies such as the Internet of Things and artificial intelligence, the efficiency and accuracy of logistics operations can be improved, the logistics supply chain can be optimized, logistical services of higher quality can be provided, and urban innovation and development can be promoted.
Finally, we must endeavor to attract high-quality talent. High-quality talent is an important transmission mechanism for the impact of HSRs on urban innovation. By providing generous remuneration and development opportunities and setting up talent introduction policies and incentives, outstanding domestic and foreign scientists, engineers, entrepreneurs, and other talent can be attracted to work and start businesses in cities along the HSR. At the same time, we must strengthen talent exchange and cooperation, establish talent cooperation and exchange platforms with other cities and international organizations, and promote the flow of talent and the sharing of resources.

Author Contributions

Conceptualization, C.M. and K.T.; methodology, C.M.; validation, C.M. and J.H.; resources, C.M.; writing—original draft preparation, C.M.; writing—review and editing, C.M.; supervision, K.T. and J.H. All authors have read and agreed to the published version of the manuscript.

Funding

This research was funded by the China State Railway Group Co., Ltd., grant number N2021X024.

Data Availability Statement

The authors have no data to share.

Conflicts of Interest

The authors declare no conflict of interest.

References

  1. Shaw, S.; Fang, Z.; Lu, S.; Tao, R. Impacts of high-speed rail on railroad network accessibility in China. J. Transp. Geogr. 2014, 40, 112–122. [Google Scholar] [CrossRef]
  2. Yang, X.; Zhang, H.; Lin, S.; Zhang, J.; Zeng, J. Does high-speed railway promote regional innovation growth or innovation convergence? Technol. Soc. 2021, 64, 101472. [Google Scholar] [CrossRef]
  3. Liu, S.; Zhang, Y.; Cai, J. Operation of high-speed rail and reduction of corporate pollution: Evidence from China. Environ. Sci. Pollut. R. 2023, 30, 3562–3575. [Google Scholar] [CrossRef] [PubMed]
  4. Meersman, H.; Nazemzadeh, M. The contribution of transport infrastructure to economic activity: The case of Belgium. Case Stud. Transp. Policy 2017, 5, 316–324. [Google Scholar] [CrossRef]
  5. Ma, J.T.; Liu, T.Y. Does the high-speed rail network improve economic growth? Pap. Reg. Sci. 2022, 101, 183–208. [Google Scholar] [CrossRef]
  6. Lucas, R.E., Jr. On the mechanics of economic development. J. Monet. Econ. 1988, 22, 3–42. [Google Scholar] [CrossRef]
  7. Wang, C.; Wu, J.; Liu, X. High-speed rail and urban innovation: Based on the perspective of labor mobility. J. Asia Pac. Econ. 2022, 1–26. [Google Scholar] [CrossRef]
  8. Li, N.; Lu, H.; Lv, Y. High-speed railway Facilities, Intercity Accessibility and Urban Innovation Level—Evidence from Cities in Three Chinese Megacity Regions. Land 2022, 11, 1132. [Google Scholar] [CrossRef]
  9. Hanley, D.; Li, J.; Wu, M. High-speed railways and collaborative innovation. Reg. Sci. Urban Econ. 2022, 93, 103717. [Google Scholar] [CrossRef]
  10. Zhou, Y.; Fan, Q.; Tao, C. The Impact of High-Speed Rail on Regional Green Innovation Performance-Based on the Dual Perspective of High-Speed Rail Opening and High-Speed Rail Network. Policy J. Environ. Stud. 2023, 32, 106795. [Google Scholar] [CrossRef]
  11. Huang, Y.; Wang, Y. How does high-speed railway affect green innovation efficiency? A perspective of innovation factor mobility. J. Clean Prod. 2020, 265, 121623. [Google Scholar] [CrossRef]
  12. Zhou, Y.; Xu, X.; Tao, L. The impact mechanism of high-speed railway on regional green innovation spillover under multi-dimensional paths. Environ. Impact Asses. 2022, 95, 106795. [Google Scholar] [CrossRef]
  13. Wang, J.; Cai, S. The construction of high-speed rail and urban innovation capacity: Based on the perspective of knowledge Spillover. China Econ. Rev. 2020, 63, 101539. [Google Scholar] [CrossRef]
  14. Cui, J.; Li, T.; Wang, Z. High-speed rail and Collaborative Innovation: Evidence from University Patents in China. SSRN Electron. J. 2020. Available online: https://www.researchgate.net/publication/338660579_High-Speed_Railway_and_Collaborative_Innovation_Evidence_from_University_Patents_in_China (accessed on 7 July 2023).
  15. Zhenkai, S.; Jun, S.; Zhengning, P. Transportation infrastructure and productivity growth: Effects of railway speed-up on firm’s TFP in China. China Econ. 2018, 13, 17–33. [Google Scholar]
  16. Hassink, R. How to unlock regional economies from path dependency? From learning region to learning cluster. Eur. Plan. Stud. 2005, 13, 521–535. [Google Scholar] [CrossRef]
  17. Hassink, R. Regional innovation support systems: Recent trends in Germany and East Asia. Eur. Plan. Stud. 2002, 10, 153–164. [Google Scholar] [CrossRef]
  18. Simandan, D. Options for moving beyond the canonical model of regional path dependence. Int. J. Urban Reg. 2012, 36, 172–178. [Google Scholar] [CrossRef]
  19. Cantos, P.; Gumbau Albert, M.; Maudos, J. Transport infrastructures, spillover effects and regional growth: Evidence of the Spanish case. Transp. Rev. 2005, 25, 25–50. [Google Scholar] [CrossRef]
  20. Scaringella, L.; Chanaron, J. Grenoble–GIANT Territorial Innovation Models: Are investments in research infrastructures worthwhile? Technol. Forecast. Soc. 2016, 112, 92–101. [Google Scholar] [CrossRef]
  21. Tsekouras, K.; Chatzistamoulou, N.; Kounetas, K.; Broadstock, D.C. Spillovers, path dependence and the productive performance of European transportation sectors in the presence of technology heterogeneity. Technol. Forecast. Soc. 2016, 102, 261–274. [Google Scholar] [CrossRef]
  22. Fritsch, M.; Slavtchev, V. Determinants of the efficiency of regional innovation systems. Reg. Stud. 2011, 45, 905–918. [Google Scholar] [CrossRef]
  23. Davis, D.R.; Dingel, J.I. A spatial knowledge economy. Am. Econ. Rev. 2019, 109, 153–170. [Google Scholar] [CrossRef]
  24. Simandan, D. Roads to perdition in the knowledge economy. Environ. Plan. A 2010, 42, 1519. [Google Scholar] [CrossRef]
  25. De Beule, F.; Van Beveren, I. Does firm agglomeration drive product innovation and renewal? An application for Belgium. Tijdschr. Econ. Soc. Ge 2012, 103, 457–472. [Google Scholar] [CrossRef]
  26. Acemoglu, D.; Moscona, J.; Robinson, J.A. State capacity and American technology: Evidence from the nineteenth century. Am. Econ. Rev. 2016, 106, 61–67. [Google Scholar] [CrossRef]
  27. Faber, B. Trade integration, market size, and industrialization: Evidence from China’s National Trunk Highway System. Rev. Econ. Stud. 2014, 81, 1046–1070. [Google Scholar] [CrossRef]
  28. Baum-Snow, N.; Brandt, L.; Henderson, J.V.; Turner, M.A.; Zhang, Q. Roads, railroads, and decentralization of Chinese cities. Rev. Econ. Stat. 2017, 99, 435–448. [Google Scholar] [CrossRef]
  29. Sun, Y.; Razzaq, A.; Kizys, R.; Bao, Q. High-speed rail and urban green productivity: The mediating role of climatic conditions in China. Technol. Forecast Soc. 2022, 185, 122055. [Google Scholar] [CrossRef]
  30. Zhu, Z.; Lin, X.; Yang, H. Corrigendum to “Booming with Speed: High-speed rail and Regional Green Innovation”. J. Adv. Transp. 2022, 2022, 9859614. [Google Scholar] [CrossRef]
  31. Kang, D.; Zhai, X.; Chen, F.; Wang, W.; Lu, J. How to promote the development of a green economy: Talent or technology? —Evidence from China’s high-speed rail. Front. Psychol. 2022, 13, 953506. [Google Scholar] [CrossRef]
  32. Knaap, T.; Oosterhaven, J. Measuring the welfare effects of infrastructure: A simple spatial equilibrium evaluation of Dutch railway proposals. Res. Transp. Econ. 2011, 31, 19–28. [Google Scholar] [CrossRef]
  33. Wu, X.; Mei, L. Policy-driven open strategy: Lessons from China’s high-speed rail industry. J. Eng. Technol. Manag. 2022, 63, 101671. [Google Scholar] [CrossRef]
  34. Gao, Y.; Zheng, J. The impact of high-speed rail on innovation: An empirical test of the companion innovation hypothesis of transportation improvement with China’s manufacturing firms. World Dev. 2020, 127, 104838. [Google Scholar] [CrossRef]
  35. Fan, X.; Xu, Y. Does high-speed rail promote urban innovation? Evidence from China. Socio-Econ. Plan. Sci. 2023, 86, 101464. [Google Scholar] [CrossRef]
  36. Yu, X.; Wan, K. How does the selection of national development zones affect urban green innovation?—Evidence from China. PLoS ONE 2022, 17, e268111. [Google Scholar] [CrossRef]
  37. Liu, S.; Zhang, Y.; Cao, J. Can High-Speed Rail Help Achieve Urban Green Development? From a Spatial Perspective. Front. Env. Sci-Switz. 2022, 10, 894697. [Google Scholar] [CrossRef]
  38. Zhou, Y.; Xu, X. Collaborative evolution of regional green innovation system under the influence of high-speed rail based on Belousov-Zhabotinsky reaction. Environ. Sci. Pollut. R. 2022, 29, 69101–69116. [Google Scholar] [CrossRef]
  39. Charnoz, P.; Lelarge, C.; Trevien, C. Communication costs and the internal organisation of multi-plant businesses: Evidence from the impact of the French high-speed rail. Econ. J. 2018, 128, 949–994. [Google Scholar] [CrossRef]
  40. Yang, X.; Zhang, H.; Li, Y. High-speed railway, factor flow and enterprise innovation efficiency: An empirical analysis on micro data. Socio-Econ. Plan. Sci. 2022, 82, 101305. [Google Scholar] [CrossRef]
  41. Zhao, J.; Yan, J.; Ran, Q.; Yang, X.; Su, X.; Shen, J. Does the opening of high-speed railways improve urban livability? Evidence from a quasi-natural experiment in China. Socio-Econ. Plan. Sci. 2022, 82, 101275. [Google Scholar] [CrossRef]
  42. Zhu, Z.; Lin, X.; Yang, H. Booming with speed: High-speed rail and regional green innovation. J. Adv. Transp. 2021, 2021, 1–22. [Google Scholar] [CrossRef]
  43. Li, Z.; Wang, Q.; Cai, M.; Wong, W. Impacts of high-speed rail on the industrial developments of non-central cities in China. Transp. Policy 2023, 134, 203–216. [Google Scholar] [CrossRef]
  44. Li, F.; Su, Y.; Xie, J.; Zhu, W.; Wang, Y. The impact of High-Speed Rail opening on city economics along the Silk Road Economic Belt. Sustainability 2020, 12, 3176. [Google Scholar] [CrossRef]
  45. Wang, C.; Meng, W.; Hou, X. The impact of high-speed rails on urban economy: An investigation using night lighting data of Chinese cities. Res. Transp. Econ. 2020, 80, 100819. [Google Scholar] [CrossRef]
  46. Autor, D.H. Outsourcing at will: The contribution of unjust dismissal doctrine to the growth of employment outsourcing. J. Labor. Econ. 2003, 21, 1–42. [Google Scholar] [CrossRef]
  47. Lu, Y.; Yang, S.; Li, J. The influence of high-speed rails on urban innovation and the underlying mechanism. PLoS ONE 2022, 17, e264779. [Google Scholar] [CrossRef] [PubMed]
  48. Beck, T.; Levine, R.; Levkov, A. Big bad banks? The winners and losers from bank deregulation in the United States. J. Financ. 2010, 65, 1637–1667. [Google Scholar] [CrossRef]
  49. Rosenbaum, P.R.; Rubin, D.B. The central role of the propensity score in observational studies for causal effects. Biometrika 1983, 70, 41–55. [Google Scholar] [CrossRef]
Figure 1. Map of China’s HSR. (https://www.travelchinaguide.com/china-trains/railway-map.htm, accessed on 7 July 2023).
Land 12 01671 g001
Figure 2. Traditional innovation parallel trend test results.
Land 12 01671 g002
Figure 3. Green innovation parallel trend test results.
Land 12 01671 g003
Figure 4. China’s regional division and city distribution map of HSR openings. (Eastern China: Liaoning, Hebei, Shandong, Jiangsu, Zhejiang, Fujian, Guangdong, Guangxi, Hainan, Beijing, Tianjin, and Shanghai. Central China: Jiangxi, Anhui, Henan, Heilongjiang, Hubei, Hunan, Jilin, Inner Mongolia Autonomous Region, and Shanxi. Western China: Gansu, Guizhou, Ningxia, Qinghai, Shaanxi, Sichuan, Yunnan, Chongqing, and the Xinjiang Uygur Autonomous Region).
Land 12 01671 g004
Table 1. Descriptive statistics for the primary variables.
VariableObsMeanStd. Dev.MinMax
HSR48450.2860.45201
Ln(Innoit + 1)48453.9571.964010.876
Ln(Ginnoit + 1)48452.0681.7508.872
LnPgdp484510.0850.9886.92414.461
Ind48450.3850.0950.0860.835
LnFdi484511.3872.144016.835
Fin48450.3910.0670.0560.861
Urb48450.3540.2410.0341.036
LnStu48454.0030.2821.8415.96
LnNet48454.4931.123−2.8078.206
Sup48450.1960.0490.0110.519
LnInf48456.4770.8803.76610.355
Tal48450.0180.0240.0000.143
Slope484510.6175.5841.59227.139
Table 2. Benchmark regression results.
Variables(1)(2)(3)(4)(5)(6)
Ln(Innoit + 1)Ln(Ginnoit + 1)
HSR0.239 ***0.536 ***0.202 ***0.376 ***0.603 ***0.288 ***
(0.026)(0.029)(0.026)(0.030)(0.031)(0.030)
LnPgdp 0.755 ***0.055 0.574 ***0.022
(0.029)(0.041) (0.030)(0.047)
Ind 2.209 ***−0.524 ** 3.149 ***0.444 *
(0.191)(0.209) (0.199)(0.234)
LnFdi 0.055 ***−0.003 0.059 ***0.004
(0.009)(0.008) (0.009)(0.009)
Fin 1.916 ***1.382 *** 1.841 ***1.073 ***
(0.197)(0.182) (0.207)(0.204)
Urb 0.355 **0.177 0.834 ***0.748 ***
(0.144)(0.166) (0.143)(0.187)
LnStu −0.421 ***0.088 * −0.436 ***−0.015
(0.055)(0.050) (0.058)(0.056)
LnNet 0.361 ***0.0273 0.221 ***−0.094 ***
(0.020)(0.019) (0.021)(0.021)
Sup 3.384 ***3.462 *** 3.971 ***4.369 ***
(0.301)(0.282) (0.315)(0.317)
Constant7.668 ***−6.816 ***5.709 ***6.144 ***−6.817 ***4.105 ***
(0.128)(0.379)(0.539)(0.145)(0.393)(0.606)
ControlsNoYesYesNoYesYes
Year F.E.YesNoYesYesNoYes
City F.E.YesNoYesYesNoYes
R20.83160.78120.83980.73710.69780.7544
Observations484548454845484548454845
Number of id285285285285285285
The judgment basis of the parallel trend test is whether it is significant at the 95% level; ***, **, and * mean that the coefficient is significant at the levels of 1%, 5%, and 10%, respectively.
Table 3. PSM-DID robustness test.
(7)(8)(9)(10)(11)(12)
IndexLn(Innoit + 1)Ln(Ginnoit + 1)
Pre-PolicyPost-PolicyDIDPre-PolicyPost-PolicyDID
Difference0.2040. 2350.0210.2760. 3080.032
S.E.0.0420.0670.0920.0410.0650.087
T-stat4.80.962.852.260.0831.87
P0.000 ***0.2390.007 ***0.000 ***0.2060.003 ***
The judgment basis of the parallel trend test is whether it is significant at the 95% level; *** means that the coefficient is significant at the level of 1%.
Table 4. Robustness tests for substitution explanatory variables.
Variables(13)(14)(15)(16)(17)(18)
Ln(Innoit + 1)Ln(Ginnoit + 1)
HSR0.107 ***0.469 ***0.129 ***0.234 ***0.546 ***0.216 ***
(0.028)(0.033)(0.028)(0.029)(0.031)(0.029)
LnPgdp 0.781 ***0.062 0.769 ***0.117 **
(0.032)(0.044) (0.031)(0.045)
Ind 1.125 ***−1.381 *** 3.051 ***−0.845 ***
(0.212)(0.224) (0.203)(0.229)
LnFdi 0.079 ***−0.014 0.057 ***−0.003
(0.010)(0.008) (0.009)(0.009)
Fin 1.174 ***1.170 *** 1.491 ***1.218 ***
(0.220)(0.195) (0.210)(0.199)
Urb 0.039−0.135 0.278 *0.169
(0.152)(0.178) (0.147)(0.182)
LnStu −0.544 ***0.112 ** −0.428 ***0.054
(0.062)(0.053) (0.059)(0.055)
LnNet 0.494 ***0.130 *** 0.437 ***0.048 **
(0.022)(0.020) (0.021)(0.021)
Sup 2.239 ***1.469 *** 2.786 ***2.923 ***
(0.336)(0.303) (0.321)(0.309)
Constant8.361 ***−5.011 ***7.277 ***6.598 ***−7.913 ***4.436 ***
(0.136)(0.419)(0.578)(0.139)(0.401)(0.591)
ControlsNoYesYesNoYesYes
Year F.E.YesNoYesYesNoYes
City F.E.YesNoYesYesNoYes
R20.83930.76780.84540.83390.78720.8393
Observations484548454845484548454845
The judgment basis of the parallel trend test is whether it is significant at the 95% level; ***, **, and * mean that the coefficient is significant at the levels of 1%, 5%, and 10%, respectively.
Table 5. Instrumental variable method robustness test.
Variables(19)(20)
Ln(Innoit + 1)Ln(Ginnoit + 1)
HSR2.496 ***
(0.826)
2.357 ***
(0.779)
Constant−2.420 ***
(0.798)
−3.297 ***
(0.742)
ControlsYesYes
Year F.E.YesYes
City F.E.YesYes
R20.71070.6954
First-stage regressions IV−0.004 ***
(0.001)
−0.004 ***
(0.001)
Cragg–Donald Wald F statistics17.64517.645
Wu–Hausmanp = 0.012p = 0.011
Observations48454845
The judgment basis of the parallel trend test is whether it is significant at the 95% level; *** means that the coefficient is significant at the level of 1%.
Table 6. Tailed regression robustness test.
Variables(21)(22)(23)(24)
Ln(Innoit + 1)Ln(Ginnoit + 1)
1% 5%1% 5%
HSR0.200 ***0.198 ***0.285 ***0.265 ***
(0.026)(0.027)(0.030)(0.030)
LnPgdp0.009−0.014−0.0150.022
(0.041)(0.039)(0.046)(0.044)
Ind−0.429 **0.2770.508 **1.222 ***
(0.212)(0.223)(0.238)(0.253)
LnFdi0.0100.028 ***0.017 *0.038 ***
(0.009)(0.010)(0.010)(0.011)
Fin1.656 ***1.594 ***1.308 ***1.380 ***
(0.198)(0.218)(0.222)(0.247)
Urb0.174−0.1000.702 ***0.264
(0.167)(0.169)(0.188)(0.191)
LnStu0.062−0.058−0.028−0.064
(0.053)(0.058)(0.060)(0.066)
LnNet0.076 ***0.163 ***−0.067 ***0.025
(0.021)(0.024)(0.024)(0.027)
Sup3.792 ***3.240 ***4.718 ***3.996 ***
(0.299)(0.326)(0.336)(0.370)
Constant4.949 ***3.916 ***3.284 ***1.371**
(0.541)(0.530)(0.607)(0.601)
ControlsYesYesYesYes
Year F.E.YesYesYesYes
City F.E.YesYesYesYes
R20.8410.8410.7510.729
Observations4845484548454845
The judgment basis of the parallel trend test is whether it is significant at the 95% level; ***, **, and * mean that the coefficient is significant at the levels of 1%, 5%, and 10%, respectively.
Table 7. Mediating effect test.
Variables(25)(26)(27)(28)(29)(30)
Ln(Innoit + 1)Ln(Ginnoit + 1)
TalantitLn(Innoit + 1)Ln(Innoit + 1)TalantitLn(Ginnoit + 1)Ln(Ginnoit + 1)
Talantit 0.002 *** 0.002 ***
(0.000) (0.000)
HSR37.356 ***0.582 ***0.655 ***37.356 ***0.627 ***0.704 ***
(6.596)(0.038(0.040)(6.596)(0.036)(0.039)
LnPgdp16.060 ***−0.035−0.00316.060 ***−0.0200.013
(3.901)(0.023)(0.023)(3.901)(0.021)(0.023)
Ind786.585 ***1.404 ***2.932 ***786.585 ***1.534 ***3.146 ***
(30.521)(0.188)(0.186)(30.521)(0.178)(0.178)
LnFdi28.361 ***0.289 ***0.344 ***28.361 ***0.218 ***0.276 ***
(1.308)(0.008)(0.008)(1.308)(0.008)(0.008)
Fin303.185 ***1.352 ***1.941 ***303.185 ***1.347 ***1.968 ***
(37.474)(0.218)(0.228)(37.474)(0.207)(0.219)
Urb316.208 ***−0.342 ***2.273 ***316.208 ***−0.0500.598 ***
(12.506)(0.077)(0.077)(12.506)(0.073)(0.074)
LnStu54.990 ***−0.582 ***−0.475 ***54.990 ***−0.535 ***−0.422 ***
(9.624)(0.056)(0.059)(9.624)(0.053)(0.056)
LnNet−5.8420.674 ***0.663 ***−5.8420.484 ***0.472 ***
(3.717)(0.021)(0.023)(3.717)(0.020)(0.022)
Sup−345.319 ***4.485 ***3.814 ***−345.319 ***3.834 ***3.126 ***
(53.008)(0.307)(0.323)(53.008)(0.291)(0.310)
Constant−974.920 ***−2.027 ***−3.921 ***−974.920 ***−2.648 ***4.646 ***
(54.090) (0.334) (0.342)(56.090) (0.316)(0.328)
Sobel
Goodman-1
0.073 ***(z = 5.505)
0.073 ***(z = 5.500)
0.077 ***(z = 5.534)
0.077 ***(z = 5.553)
Goodman-10.073 ***(z = 5.509)0.077 ***(z = 5.538)
Indirect effect0.073 ***(z = 5.505)0.077 ***(z = 5.534)
Direct effect0.582 ***(z = 15.238)0.627 ***(z = 17.312)
Total effect0.655 ***(z = 16.298)0.704 ***(z = 18.258)
Mediating effect ratio11.08%10.88%
Controls
R2
Observations
Yes
0.516
4845
Yes
0.756
4845
Yes
0.726
4845
Yes
0.516
4845
Yes
0.724
4845
Yes
0.685
4845
The judgment basis of the parallel trend test is whether it is significant at the 95% level; *** means that the coefficient is significant at the level of 1%.
Table 8. Regulatory mechanism test.
Variables(31)(32)(33)(34)
Ln(Innoit + 1)Ln(Ginnoit + 1)
HSR0.202 ***0.173 ***0.288 ***0.225 ***
(0.0263)(0.0277)(0.0295)(0.0310)
LnInf 0.03420.004180.0189
(0.0209)(0.0234)(0.0234)
c.c_HSR#c.c_LnInf 0.0873 *** 0.178 ***
(0.0249) (0.0279)
LnPgdp0.05510.04770.02110.0153
(0.0414)(0.0415)(0.0467)(0.0465)
Ind−0.524 **−0.581 ***0.444 *0.326
(0.209)(0.209)(0.234)(0.234)
LnFdi−0.00281−0.001070.003930.00873
(0.00790)(0.00793)(0.00890)(0.00889)
Fin1.382 ***1.333 ***1.072 ***0.974 ***
(0.182)(0.182)(0.204)(0.204)
Urb0.1770.1660.748 ***0.722 ***
(0.166)(0.166)(0.187)(0.186)
LnStu0.0875 *0.0757−0.0146−0.0417
(0.0498)(0.0499)(0.0560)(0.0560)
LnNet0.02730.0415 **−0.0945 ***−0.0592 ***
(0.0190)(0.0198)(0.0215)(0.0221)
Sup3.462 ***3.267 ***4.371 ***3.942 ***
(0.282)(0.288)(0.318)(0.323)
Constant5.709 ***5.502 ***4.082 ***3.966 ***
(0.539)(0.551)(0.620)(0.618)
ControlsYesYesYesYes
Year F.E.YesYesYesYes
City F.E.YesYesYesYes
R20.83980.84030.75440.7566
Observations4845484548454845
The judgment basis of the parallel trend test is whether it is significant at the 95% level; ***, **, and * mean that the coefficient is significant at the levels of 1%, 5%, and 10%, respectively.
Table 9. Location heterogeneity.
(35)(36)(37)(38)(39)(40)
VariablesLn(Innoit + 1)Ln(Ginnoit + 1)
EasternCentralWesternEasternCentralWestern
HSR0.087 **0.254 ***0.171 ***0.159 ***0.244 ***0.336 ***
(2.143)(5.448)(3.425)(3.249)(4.882)(5.904)
Constant2.358 **3.463 ***1.2000.5401.464 *−0.737
(2.471)(4.240)(1.258)(0.468)(1.675)(−0.680)
ControlsYesYesYesYesYesYes
Year F.E.YesYesYesYesYesYes
City F.E.YesYesYesYesYesYes
R20.8850.8140.8450.8130.7420.720
Observations171717001428171717001428
The judgment basis of the parallel trend test is whether it is significant at the 95% level; ***, **, and * mean that the coefficient is significant at the levels of 1%, 5%, and 10%, respectively.
Table 10. City-level heterogeneity.
Variables(41)(42)(43)(44)
Ln(Innoit + 1)Ln(Ginnoit + 1)
Central CityGeneral CityCentral CityGeneral City
HSR0.106 **0.221 ***0.0840.285 ***
(2.258)(7.632)(1.411)(8.815)
Constant7.504 ***0.5464.870 ***0.198
(6.688)(1.040)(3.417)(0.338)
ControlsYesYesYesYes
Year F.E.YesYesYesYes
City F.E.YesYesYesYes
R20.8850.8140.8450.813
Observations59542505954250
The judgment basis of the parallel trend test is whether it is significant at the 95% level; *** and ** mean that the coefficient is significant at the levels of 1% and 5%, respectively.
Disclaimer/Publisher’s Note: The statements, opinions and data contained in all publications are solely those of the individual author(s) and contributor(s) and not of MDPI and/or the editor(s). MDPI and/or the editor(s) disclaim responsibility for any injury to people or property resulting from any ideas, methods, instructions or products referred to in the content.

