Article

Planting a Linear Vegetation Element in Landscape Using a Forestry and Landscaping Method—Can We Tell Which Deliver Greater Success?

1
Department of Landscape Planning, Faculty of Horticulture, Mendel University in Brno, 691 44 Lednice, Czech Republic
2
Department of Landscape Management, Faculty of Forestry and Wood Technologies, Mendel University in Brno, 613 00 Brno, Czech Republic
*
Author to whom correspondence should be addressed.
Land 2023, 12(9), 1766; https://doi.org/10.3390/land12091766
Submission received: 9 August 2023 / Revised: 28 August 2023 / Accepted: 3 September 2023 / Published: 12 September 2023

Abstract

:
Since the end of the 20th century, the Czech Republic has been developing an ecological network. Areas of ligneous greenery are being established throughout the landscape. The projects use different sizes of planting material: forestry seedlings and landscaping seedlings. In the South Moravian Region, in the vicinity of the village of Šardice, a series of measurements was carried out in 2016–2019 to compare the vitality of the greenery elements established by each of the methods. The height of the seedlings and trunk diameter were measured for the young trees while the shrubs were monitored for the seedling height only. Mortality was recorded successively for all the seedlings. The forestry method demonstrated greater growing vigour as indicated by the ratio of the trunk diameter increment to height while the landscaping method had lower mortality. In the forestry plantations, high mortality was found especially in poplars, oaks and hornbeams while in the landscaping plantations the poplars and oaks had the highest mortality. Elm, sycamore and poplar trees had the highest increments in the forestry plantations (but the latter was planted at different size). In the landscaping plantations, poplar trees (planted at a different size) delivered the best results, followed by maple, elm and lime trees. Shrub mortality was similar in both types of plantings. Hazel had a very high mortality while ivy, privet and honeysuckle had low mortality. Shrub height gain was higher in fenced forestry plantations. In unfenced landscaping plantations, damage by game was evident.

1. Introduction

From the 1970s, the theory of “territorial systems of ecological stability” has been formulated in the former Czechoslovakia. The aim was, through instruments of regional and spatial planning, to secure and enhance landscape biodiversity [1]. In its theory, the ecological stability system issues from the biogeographical theory of islands [2], concept of ecological stability published by I. Míchal [3], and geobiographic differentiation of landscape in context of geobiocenology [4,5]. The territorial systems, referred to with the Czech acronym as ÚSES (hereinafter as ÚSES), incorporate also a concept of landscape patches, corrirors, matrix and networks [6]. The concept of ecological networks has been developed since the early 1990s in other countries of Europe [7]. The concept of ecological networks includes also the “green belts/ways” (greenways) [8] or interconnecting of landscapes for the purpose of protecting biological diversity [9].
In the 1990s, the concept laid down by Löw [1] was further developed in the Czech Republic through other methodological documents, e.g., Lepeška et al. [10]. At the same time there was some first evidence of actual measures delivered in the landscape, as the first wildlife corridors (biological corridors) were planted on farmland [11,12,13]. Plantings of trees and shrubs are delivered by different means and technologies. There are various scientific projects dealing with this issue [11,12]. However, the results of the research often tend to be unclear and difficult to compare, as different parameters are evaluated in individual projects, there are different methodological approaches, and there tend to be initial differences from the very beginning of each project (local conditions, used planting materials or technologies). As early as at that time, one question has never been clearly addressed, that is, whether some of the planting methods are more advantageous in terms of cost and prosperity of the planted trees [14]. In 2007, the evolution of the ecological networks (ÚSES) in the Czech Republic was summarized by Buček, Maděra and Úradníček [15].
In general, establishing woody stands in the landscape can be delivered by two core methods. The first one is the so-called forestry method, when less mature stock is being planted in higher densities, and their further development and control is anticipated through natural processes and additional energies added. This method is often applied for afforestation of farmland with the aim to establish economically managed forest stands. This topic is covered by a number of research papers, e.g., by Nizinski [16], Friedrichsdorf [17], Bartoš and Kacálek [18], Jylhä and Hytönen [19], Leugner [20], Vacek et al. [21] and Deptula et al. [22]. Forestry method of establishing woody stands is also used in the reclamation of land after mining and mineral extraction. Research on such areas has been delivered, e.g., by Dimistrovský and Vesecký [23] or Štýs [24].
The second way is the so-called landscaping (horticultural) method; when mature planting stock is used, planting is delivered in the final spacing grids, and much lower cost on the management of the established stand is anticipated, which is referred to also by Jahn [25].
In practice, many aspects affect the selection of one of these methods, but mostly, it is a reflection of the owner’s or investor’s interest, without any exact assessment of the method’s suitability or convenience. Expert discussion about the convenience and suitability of both the mentioned methods is currently rather empirical and goes on rather in the practitioners’ domain than in the research and scientific community. Here, it is possible to refer to many papers from the regular workshops “ÚSES—zelená páteř krajiny” (ÚSES—the green backbone of landscape) [26].
Regardless, exact knowledge in this area could significantly contribute to a more effective implementation of these features in the landscape, both in terms of their faster onset of delivering their ecosystem functions and in terms of cost-effectiveness (saving funds and capacities).
This paper aims to present the results of four-year-long research within a site of linear planting in the farmland (so-called wildlife corridor), which was intentionally established using both mentioned methods (the forestry method and landscaping method) in segments to allow for such a study. The authors’ idea is to exactly evaluate in the given conditions the effectiveness of both methods of establishing woody stands in terms of their ecosystem functions and to compare the results against some partial results from the assessment of plantings outside forests in the Czech Republic [27,28,29,30,31,32,33,34,35,36,37,38,39].

2. Materials and Methods

2.1. The Site

To assess and evaluate the success of the plantings delivered by means of forestry and landscaping methods, a local wildlife corridor (hereinafter as LBK) of a territorial system of ecological stability referred to as LBK 2, situated in the Czech Republic, South Moravian Region, within the perimeter of the municipality of Kyjov, cadastral area Šardice (see Figure 1), was used. The LBK is situated on the right bank of the Šardický brook, which has been significantly modified (straightened and deepened stream bed with trapezoidal cross-section).
There are two exact sources describing the soil conditions of the locality in general. According to the map server of the Czech Geological Survey [40], it is Phaeozems (CCc) from the Mellisols group. It is a narrow stream floodplain, although the stream is straight and deepened. According to the Czech Famland Classification, fluvisols occur here on fluvial clay-sand sediments. The soils are deep and skeletonless, and the climate of the area belongs to a very warm and dry region [41].
The overall area of the wildlife corridor is 1.0908 ha and length is 750 m. In 2014 and 2015, a total of 2958 shrubs were planted there, 2304 bare-root forest seedlings (height 36–50 cm) and semi-mature trees (height 51–120 cm) along with 500 landscaping stock trees with covered root balls (size 8–10 cm of trunk circumference at 1 m above ground). In addition, an overall area of 6439 m2 of permanent grassland was established as well. The entire LBK is divided into 8 segments with regularly alternating plantings of the forest seedlings and the landscaping stock. Both these types are accompanied by plantings of root-bale landscaping shrubs. The width of the individual segments is equal, 11 m, while the length of the segment varies. The segments with the forestry planting stock are fenced off while the landscaping stock has individual protection of each trunk with a reed mat up to 1.5 m height. Each method follows its own planting scheme that forms the main module, which repeats within each of the segments. The length of the forestry modules is 20 m while in the landscaping plantings it is 14 m. The same tree species have been used throughout both types of planting: Acer campestre, Carpinus betulus, Fraxinus excelsior, Populus alba, Quercus robur, Tilia cordata, Ulmus glabra, Cornus sanguinea, Corylus avellana, Euonymus europaeus, Ligustrum vulgare, Lonicera xylosteum and Rhamnus cathartica. The spacing in the forestry module is 1.5 × 1 m; in the landscaping module it is 3 × 3 m [42]. Figure 2 shows the distribution of the individual modules throughout the wildlife corridor.
To collect data in the field, the seven experimental plots were identified within the central parts of the individual segments with different planting type. Plots A1, A2 and A3 contained forestry plantings while plots B1, B2, B3 and B4 contained landscaping planting stock and methods. No experimental plot was identified in the southernmost segment, as the site conditions there were non-standard compared to the other areas; moreover, a different type of management was applied in the 1st year of the follow-up care).
Each of the experimental plots was 11 × 20 m, which corresponded with one planting module with forestry stock and method applied. The 20 m length was also used for the landscaping planting method to unify the assessed areas and to not increase the number of plants in the landscaping-type plots for statistical processing (the last aspect was supported also by a higher number of segments with the landscaping type of planting method). The individual experimental plots were placed “within” the plantings to prevent influence of the neighbouring segment with different type of planting.
For more details see Supplementary Materials.

2.2. Own Methodology Delivered

The field works were delivered in 2016–2019.
During the individual field research sessions, the following data were collected: indicative air temperature, current weather (e.g., clear sky, cloudy, overcast, after rain, ground frost), the condition of the herbaceous layer was generally assessed, and the vitality of each plant was recorded in prepared field forms (live/dry/absent) along with the measured heights of all the plants and their trunk diameters (not for the shrubs).
The height of the plant was measured to the top live leaf or bud, in cm, with +/−1 cm accuracy for the forestry seedlings and shrubs and with +/−10 cm accuracy for the landscaping plants. To measure the height of the forestry seedlings and shrubs, a standard 2-m measuring tape was used; the landscaping plants were measured with a 5-m telescopic level staff.
The trunk diameter of the forestry seedlings was measured approximately 1.7 cm above the ground with 0.1 mm accuracy (the height of the measuring was equal to the thickness of the index finger at its last joint). On the landscaping plants, the trunk diameter was measured at approximately 1.5 m above ground with 0.1 mm accuracy (measured twice, measurements perpendicular to each other and machine-recalculated to an average value). In the forestry plantings, the measurements were not taken on seedlings, the tops of which had died and had new leaves sprouting from the root base, as the fragile stems could be damaged. Mechanical sliding gauge was used to measure the diameter of the trunks.
In each of the plots with forestry planting, there were 139 observed positions of tree species and 106 shrub species positions. In plots with landscaping stock, there were 30 observed positions with trees and 59 positions with shrubs per one plot. In total, 417 forestry seedlings, 120 landscaping seedlings and 554 shrubs were observed (318 + 236).
The quantitative characteristics observed included mortality, i.e., number of surviving seedlings in specific positions per the individual observational readings. When processing the field data, a sum of live and dead or missing plants per each species and specific site were calculated. This was done per the individual survey periods. In 2017, 2018 and 2019, the number of live plants was reduced by newly added seedlings to capture the trend of mortality of the seedlings planted earlier. The quantity values in pieces were converted to percentages when the number of planted pieces of a species on a specific site was taken as the initial state (100%). From the percentage of the live plants, the mortality of the species was determined per the plot per each survey period as compared to the initial state. Similarly, the summarization per all the plots by planting type was performed. Per each species, sum of all the plants (live vs. dead and missing) was performed on all the plots of the given planting type per the individual survey periods. Again, a conversion to percentage was performed for the mortality of each species in a given time period. The next step was a summarization of all the plants per the given planting type. The procedure was the same as in the previous steps.
The height of the plant and trunk diameter (see above) was determined as the key assessed characteristics; as for the shrubs, only height was recorded. The measured values were processed into spreadsheets allowing observing the development in the changing height and thickness as well as the dynamic of this development in the individual years by the different planting types, both per the individual species and as a summary. The calculations were based on the measured values for all the live plants on the given date, i.e., including plants planted later; with trunk diameter of the forestry plants, those plants were also taken into account, the stem of which had died but new leaves were appearing at the root base. To prevent damage, these plants were not measured for their diameter. Per each plot and per each survey period, arithmetic averages of the height and trunk diameter were calculated from all the measured plants of the given species. These values were converted to the relative increment in percent, as the initial comparison value was the calculated arithmetic average of the height or trunk diameter of a given species in 2016 (expressed as 0). In the case of a specific species in a specific plot, a live plant was absent in 2016 (no comparison of height and trunk diameter was done); the following measurement reading was taken as a basis for comparison. In some cases, a negative value was identified in relation to 2016—a relative decline (commented in Section 4). In the next step, the height and trunk diameter of the individual species per a given planting type was identified, which involved a calculation of an arithmetic average of the height and trunk diameter for all individuals of the given species per the given planting type (forestry plants—trees, forestry plants—shrubs, landscaping plants, shrubs in areas with landscaping plants). Once again, the calculated values were converted to relative increment in percent, when the initial basis for the benchmark value was a calculated arithmetic average of height or trunk diameter of a specific species in 2016 (expressed as 0). The last step was to apply the same procedure to calculate the relative increment in percent for an “average tree” and “average shrub” in both planting types without distinguishing the species.

2.3. Limitations of the Study

The research was carried out within the framework of the distance form of doctoral studies. It was not part of any grant; it was financed from the doctoral student’s private resources. No instrumentation-intensive work or laboratory procedures were carried out. Field investigations were also limited due to synchronisation of the PhD student’s time and the technical assistance available (technicians from the university). The study area was not set up as a research project. It was the implementation of an eco-stabilization measure by a private company following a competitive bidding process. Therefore, the accuracy of the work, the quality of the planting material and the implementation of aftercare were not under control.

3. Results

3.1. Comparison of the Number of Surviving Individuals/Mortality (Quantitative Evaluation)

3.1.1. Trees

The basic quantitative investigation in the tree inventory has basically shown an expected result per the monitored period. In the forestry plantings, there was a significantly higher decline of the plants (mortality) than in the landscaping plantings (Table 1, Figure 3 and Figure 4). In total numbers, this mortality amounted to 30% in the forestry plantings and approximately 5% in the landscaping plantings (Table 1). An interesting phenomenon is a marked differentiation of mortality per the individual species, yet it still follows the same trend in both the planting modes when the highest mortality in the given site is that of Populus alba and Quercus robur. Also worth mentioning is the relatively balanced trend of overall mortality in the forestry plantings compared to the steep increase in the overall mortality in the landscaping mode of planting, first immediately after the planting and then in the fourth year following planting (Figure 3 and Figure 4).

3.1.2. Shrubs

Just as in the tree species, to some degree, the shrub species also followed the quantitative loss of the individual species regardless of their planting method (Table 2, Figure 5 and Figure 6). In the shrubs, this phenomenon is even more pronounced than in the trees; the highest mortality is that of Corylus avellana (94 and 100%, respectively). After the four years of monitoring, the resulting mortality of the shrub species was practically the same in both the cases (approximately 23%), unlike the mortality of the tree species. In this context, the inter-annual mortality trend is interesting: in the case of the forestry plantings, it gradually increases, whereas in the landscaping mode of planting, it is highly volatile.

3.2. Comparison of the Change in Plant Height and Trunk Diameter (Qualitative Assessment)

3.2.1. Forestry Mode of Planting—Trees

As follows from Table 3 and Table 4 and Figure 7, the vitality of the individual species varies greatly in the forestry mode of planting. Species that can be referred to as vigorous, with a regular height and diameter increment, include Populus alba, Ulmus glabra and Acer campestre. On the other hand, species with poor vigor include mainly Tilia cordata and Carpinus betulus.

3.2.2. Landscaping Mode of Planting—Trees

As follows from Table 5 and Table 6 and Figure 8, the vitality of the plants planted in the landscaping mode is significantly lower than that of the plants from the forestry planting method. A regular diameter and height increment is demonstrated only by Populus alba, whereas Ulmus glabra and Acer campestre demonstrate rather just the trunk diameter increment; the vitality of the other species is low. Table 7 shows the coefficients of determination of the trends of linear regression given in graphs of Figure 7 and Figure 8 in particular. It confirms the statement mentioned above.
A comparison of the overall vitality of the plants from both the planting methods in the monitored period through comparing relative diameter and height increments is presented in Figure 9.
Figure 9 refers to a significantly higher vitality of the plants in the forestry mode of planting represented by a continuous increase of both thickness and height (80% thickness, 66% height). The landscaping mode of planting demonstrates very low height increment (5%), whereas the thickness increment is at 32%.

3.2.3. Shrubs

As the quantitative assessment of the shrub layer has provided similar results in the case of both modes of planting, the vitality of the shrub layer has been evaluated parallel for both the modes (Table 8, Figure 10). Quality has only been assessed through the height of the individuals and increments thereof due to the difficulty of measuring the diameter of the thin trunk.
From Figure 10, it follows that also the average vitality of the shrubs is higher in the forestry plantings than in the landscaping plantings. While the relative increment of shrubs per the monitored four-year period in the forestry plantings is almost 57%, in the landscaping plantings, it is only 11%.
For more details see Supplementary Materials.

4. Discussion

A study of the Czech and foreign literature has revealed that there are basically no studies in which the results could be compared with. The published studies:
  • Focus on different species (in Central Europe, that is mainly beech, Norway spruce, larch and pine or alder, cherry and Douglas fir), such as Jylhä, Hytönen [19], Vacek et al. [43] and Deptula et al. [22];
  • Work with a different size of the planting stock (semi-mature seedlings, mature seedlings), e.g., Dostálek et al. (2009) [30];
  • Are delivered either in a forest environment or on specific sites (mine damps, spoil tips);
  • Focus on other plantings with different parameters of height and trunk diameter, e.g., Jelínek, Úradníček [37] and Deptula et al. [22];
  • Focus on the relation between mortality or vitality to another specific factor (specific nutrients in the soil, mode of seedling production in a nursery, shading, etc.), e.g., Dostálek et al. [29] and Tužimský et al. [44];
  • Do not cover shrubs, as presented in Jelínek [34].
Only some studies contain some partial data that could be compared against the results of this study, and rather, they are input data or by-products that were not the aim of the research. These studies are mentioned in the text below.
  • Forestry plantings—Evaluation
  • Acer campestre
The species can be evaluated as successful. As per mortality, in 2019, it achieved 11.36% (3rd lowest rating) while demonstrating good vitality, with both height and trunk diameter values increasing; in 2019, these values made a significant leap (height 72.67–83.75–96.26–142.59 cm, i.e., increased by 96.21% between 2016 and 2019; trunk diameter: 9.35–10.43–13.18–23.19 mm, between years 2016 and 2019, the value increased by 147.96%). This finding is consistent with the description of the species as provided by Chmelař [45] and also corresponds with the data given for the planting material by Dostálek et al. [31].
  • Carpinus betulus
An unwritten experience from practice has been confirmed: this species thrives less when planted on agricultural land, which is demonstrated by the continuous and regularly increasing mortality; from 6.9 in 2016, it increased to the ultimate 37.93% in 2019. Although in absolute numbers this species mortality is not the highest one, its growth is the fastest. This empirical knowledge is not supported by sufficient scientific data, so one can only speculate about the reasons, even though Dostálek et al. [31] also recorded a decrease in height in small Carpinus betulus seedlings in the first two years after planting, and only in the fourth year were the recorded values higher than at the time of planting.
When it comes to vitality expressed by the trunk diameter and plant height, in 2016–2018, the values stagnated, or there was even a slight decrease. This can be explained by the death of larger seedlings and survival of smaller ones. In 2019, there is already a significant increase in values, which could indicate the acclimatization of the seedlings on the site.
  • Fraxinus excelsior
The species demonstrated the lowest mortality of all the tree species (only two individuals died since planting, which indicates 5.13% ultimate mortality).
While the trunk diameter increment was rising relatively regularly throughout the entire measurement period, in 2016–2018, the height increased at a slower rate; in 2019 it made a significant leap, which reflects in the steepness of growth also supported by the linear curve on Figure 7 (the highest of all the tree species). Chmelař [45] states that, on one hand, juvenile seedlings grow faster, but on the other hand, they require shading at a young age. This could explain why, until 2017, the growth was weaker and shot up in 2019 when the seedlings had already adapted while being partially shaded by other species.
  • Populus alba
In the forestry plantings, this species demonstrated the highest mortality since 2016 when it reached 46.15% to increase to 73.08% in 2019. However, as it is a species that generally establishes and thrives well, we can only speculate that the problem could have occurred as early as during the planting, when poor planting material was used. This hypothesis is also supported by the fact that both the surviving and later added individuals demonstrated the highest values in trunk diameter increment and the second highest height increment (after Acer campestre) of all the tree species. Trunk diameter increased from 8.89 mm in 2016 to 22.39 mm (151.8%); height increased from 102.9 cm (semi-matured stock was planted) to 184.42 cm (79.23%). The species is a so-called pioneer tree, which is capable of quickly occupying open sites and is typical in its vigorous growth when young. Chmelař [45] adds that it is one of the fastest-growing indigenous tree species in Central Europe.
  • Quercus robur
Another unwritten knowledge proved to be true with this species: in the first years following planting on agricultural land it suffers a relatively high mortality, especially if care is poor (mainly insufficient or absence watering). On the other hand, oak demonstrates good sprouting ability [45,46]; therefore, some individuals with the dead stem could regenerate from the root base. These individuals were classified as alive.
The fact that the sprouts were classified as living plants and their height was measured partially influenced the overall height of the species (in particular in years 2016 and 2017) that stagnated (37.66 to 38.18 cm) until 2019 when a more significant increase in the value occurred (46.19 cm, i.e., by 22.66% compared to the initial state and by 21.29% inter-annually). This increase is again partially influenced by the faster-growing sprouts. Stagnation in the height increase after planting and consequent gradation was also recorded by Jelínek and Úradníček [37], in whose study the average height of oak seedlings in their monitored wildlife corridor in Stříbrnice was just 33.6 cm four years after planting, whereas after seven years, it had grown to 62.4 cm (by 86%).
The trunk diameter average increased regularly (6.15–6.35–6.49–7.08 mm, increase by 15.16% from the beginning and by 9.63% inter-annually), which was also due to the fact that new and non-woody sprouts were not measured, so no distortion of this characteristic has occurred. The smaller leap in 2019 is probably due to the greater growth dynamic of the already established seedlings.
  • Tilia cordata
In this species, just like in Carpinus betulus, a gradual increase in mortality has been recorded, but it was not very steep (in 2016, the mortality was 6.25%; in 2019, it was 17.5%).
The trunk diameter increase was slight at first, but in 2019, a significant leap has been recorded (from 5.05% and 7.95% to the ultimate 26.12%). In the two measurements taken in 2017, the height increment was actually negative (−3. 84 % and −0.63 %) while in 2016, a significant increase to 36.53% occurred. These results are consistent with the findings of Dostálek et al. [29], who studied the impact of different types of mulch on the thriving of seedlings (an exception was an all-over mulching with straw, in which the increment value continued to increase from the second year on). The slow growth rate in the first years is also mentioned by Chmelař [45].
  • Ulmus glabra
A species with the second lowest mortality recorded (after Fraxinus excelsior), which increased from 5.56% in 2016 to 8.33% in 2019 (this increase is the lowest of all the tree species from the forestry plantings in the monitored period).
The success of this species is further highlighted by the good values of trunk diameter and height growth. Its trunk diameter increment was the third best (from 5.19% in 2017 to 89.43% in 2019), as per the height increment (from 12.74% in 2017 to 65.82% in 2019), it was more of a middle of the notional chart (4th place), very close behind Fraxinus excelsior and Populus alba (only the Acer campestre on the 1st place demonstrates a significantly higher value) and with a significant distance from the other species.
  • Overall evaluation of the forestry plantings
Looking at Figure 7, it is obvious that the individual species split into two groups. The species with regular trunk diameter and height increment are Populus alba, Ulmus glabra and Acer campestre. From the chart, it is clear that, already, the initial values from 2016 signal an increment from the time of planting, where the higher value of Populus alba is due to planting of a different category of seedlings (semi-mature ones). The success of these species is characterized by the length of the interpolated linear curve; the identical slope of all the three curves is interesting as well.
The second group comprises the other species: their curves are short and clustered in a space with significantly lower values of the trunk diameter and height increment. There is a visible stagnation of or even drop in the values in 2016–2018 and a later leap in 2019. Although it might seem that the vitality of these trees is low, it is exactly that leap in 2019 that shows that even these trees are capable of thriving on the site and that their initial poor results were also caused by their general biological characteristics (see the comments on the individual species above).
  • Shrubs in the forestry plantings
Due to the fact that the target community of the wildlife corridor is a stand of trees, the below comments on the shrubs are just general, pointing out just some of the significant abnormalities of the individual species.
In general, the mortality of the shrub species could be evaluated as adequate and non-threatening in the occurrence of the species on the site (the overall mortality of all the shrubs was 25%). An example is Corylus avellana, the ultimate mortality of which was recorded as 94.29%. Higher mortality was also recorded with Cornus sanguinea (32.14%) and Rhamnus cathartica (27.78%). Regarding all these three species, it is necessary to point out that major dying has already occurred between the planting and start of the measurements in 2016 (Corylus—80%, Cornus—23.81%, Rhamnus—22.22%). The reasons are not clear; it could have been a poor-quality planting material, incorrect handling before planting or improper implementation of the actual planting. This hypothesis can be supported by the fact that an identical situation occurred among shrubs in the landscaping plantings (see below). A thriving shrub species is the Ligustrum vulgare (in 2019, the mortality was 4.55%) and mainly Euonymus europaeus (ultimate mortality 1.85%, which means only one piece of all the planted ones). For a comparison with the results of other authors, it was only possible to use the study of Jelínek and Úradníček [34]. Consistency only occurs with certain species and only in initial phases of growth; later, the authors describe a frequent reduction of the shrubs, which they link with the development of the tree layer, the state of the tree canopy and inadequate conditions for shrub growth in permanent shade.
The height increment of the seedlings is initially stagnant or in the lower percentage units of (2017). Some of the seedlings have lost their terminal shoots due to drying and damage by spring frosts. In 2018, half of the species have clearly shown height increment, and in 2019, they all demonstrated a more significant growth. From Figure 10, it is clear that the average height of all the shrubs was increasing (see the interpolated linear curve). Upon comparison with the results of Jelínek and Úradníček [34], who monitored growth increments in a wildlife corridor Vracov between 1993–2007 (relevant data for years 1993 and 1996), it follows that comparable species demonstrated an increment but that its dynamics were, with some exceptions, significantly higher than in Šardice.
  • Landscaping plantings—Evaluation
As this type of planting shares some common characteristics for all the tree species, they are not commented individually.
In general, the mortality is very low; for the Acer campestre, Carpinus betulus, Tilia cordata and Ulmus glabra species, it is zero. For Fraxinus excelsior, Populus alba and Quercus robur, it reaches 4.17/12.5/9.09%, which, with the low numbers of the planted trees, represents one dead piece of Fraxinus excelsior and Populus alba each and four pieces of Quercus robur. As per the Populus alba and Quercus robur, these deaths occurred before the start of the measurements (see Table 1 and Figure 4). These results correspond with the finding of Jelínek and Úradníček [37], who, in their partial plots in the Radějov wildlife corridor, recorded zero or just a minimum mortality of one dead piece of Tilia platyphyllos and T. cordata in the form of landscaping stock plants.
The values of the trunk diameter and plant height parameters do show that only Populus alba had a significant dynamic. The interpolated linear curve in Figure 8 is similar to that of the forestry seedlings of this species, which is caused by the use of the same planting material—matured seedlings. All other species are characterized by the stagnating height of the plants. Individual measurements show a minimum height increment or even a decrease. Decreasing or fluctuating average values of height in the particular measurements can be explained by the death of the terminal shoots of some individuals in the respective years, either due to late frosts in spring or due to periods of heavy drought during the vegetation season (in particular Fraxinus excelsior and Quercus robur). To some degree, the measured values could have also been impacted by an inaccuracy of measuring (+/−10 cm) and weather conditions on the measurement days (on windy days, some of the bent terminals were bending down even more, and per measurements in the leafless state, bent terminals could have given other values than with leaves). The stagnating height increment in large seedlings in the first few years after planting was also observed by Dostálek et al. [30]. Jelínek and Úradníček [35] describe a similar stagnation with a reference to post-planting shock. On the other hand, it is necessary to point out that, at the time of the measurement, the individual seedlings were in solitary positions (full sun on the crowns, the absence of canopy and, therefore, the absence of competition from the surrounding seedlings). Due to this, the plants did not have to invest energy in developing height, but rather on developing the assimilation apparatus in their crowns and in the trunk diameter increment, which is consistent with the recorded values per all the species: these values keep increasing consistently. The most significant trunk diameter increase has again been recorded for Populus alba (216% in 2019 compared to the initial value in 2016), whereas Fraxinus excelsior was the poorest-thriving of all (its ultimate increment in 2019 was only 7%, which can be interpreted as stagnation of the species). In 2019, the increment of the other species ranged between 1/5 and 1/3 of the initial value from 2016. An exception was only Carpinus betulus, which reached an increment of 16.88% at the end of the measurement.
Although the found relative increment values of the landscaping seedlings are lower than those of the forestry seedlings, it does not mean that the landscape seedlings were not vigorous. From the perspective of mortality, on the opposite side, they are more successful than the forestry seedlings.
  • Shrubs in the landscaping plantings
Looking at the mortality values, it is obvious that the situation is not much different from the shrub plantings in forestry enclosures. The high mortality situation repeats with Corylus avellana, which was over 80% in 2016, and in 2019, it was 100%. This similarity between both types of the plantings indicates a poor planting stock or technological error during the planting. Very low values were again reached by Euonymus europaeus (2.08%) and Ligustrum vulgare (3.28%). Even though wildlife damage significantly impacted the landscaping plantings (see below), in the comparison of both the types, it did not affect the overall mortality.
In the evaluation of the seedlings’ height, there is a marked difference compared to shrubs in forestry plantings. In the landscaping plantings, there is visible stagnation, sometimes even a major drop in the measured values. That is determined mainly by browsing damage caused by wildlife on seedlings that were not protected by a fence or any individual protection (the greatest damage was observed generally on Euonymus europaeus); then, there were dead terminal shoots (more commonly of Rhamnus cathartica and Cornus sanguinea) or, to a limited degree, spring frost damage. Summing up, the most vigorously growing shrub was Corylus avellana, but due to the high mortality, these data are not conclusive. The biggest drop was that of Cornus sanguinea (−9.73% in 2019): it has initially shown an impact of dead terminal shorts or entire shoot growth altogether, followed by wildlife damage. A great decrease in Rhamnus cathartica in spring 2017 was caused mainly by the dead terminal shoots and all growth, but it was also caused by high mortality, mainly on plots B1 and B2, when partial replanting (new small seedlings) was delivered. Except Rhamnus cathartica, all other species reacted to damage with very vigorous growth and a large quantity of new shoots.

5. Conclusions

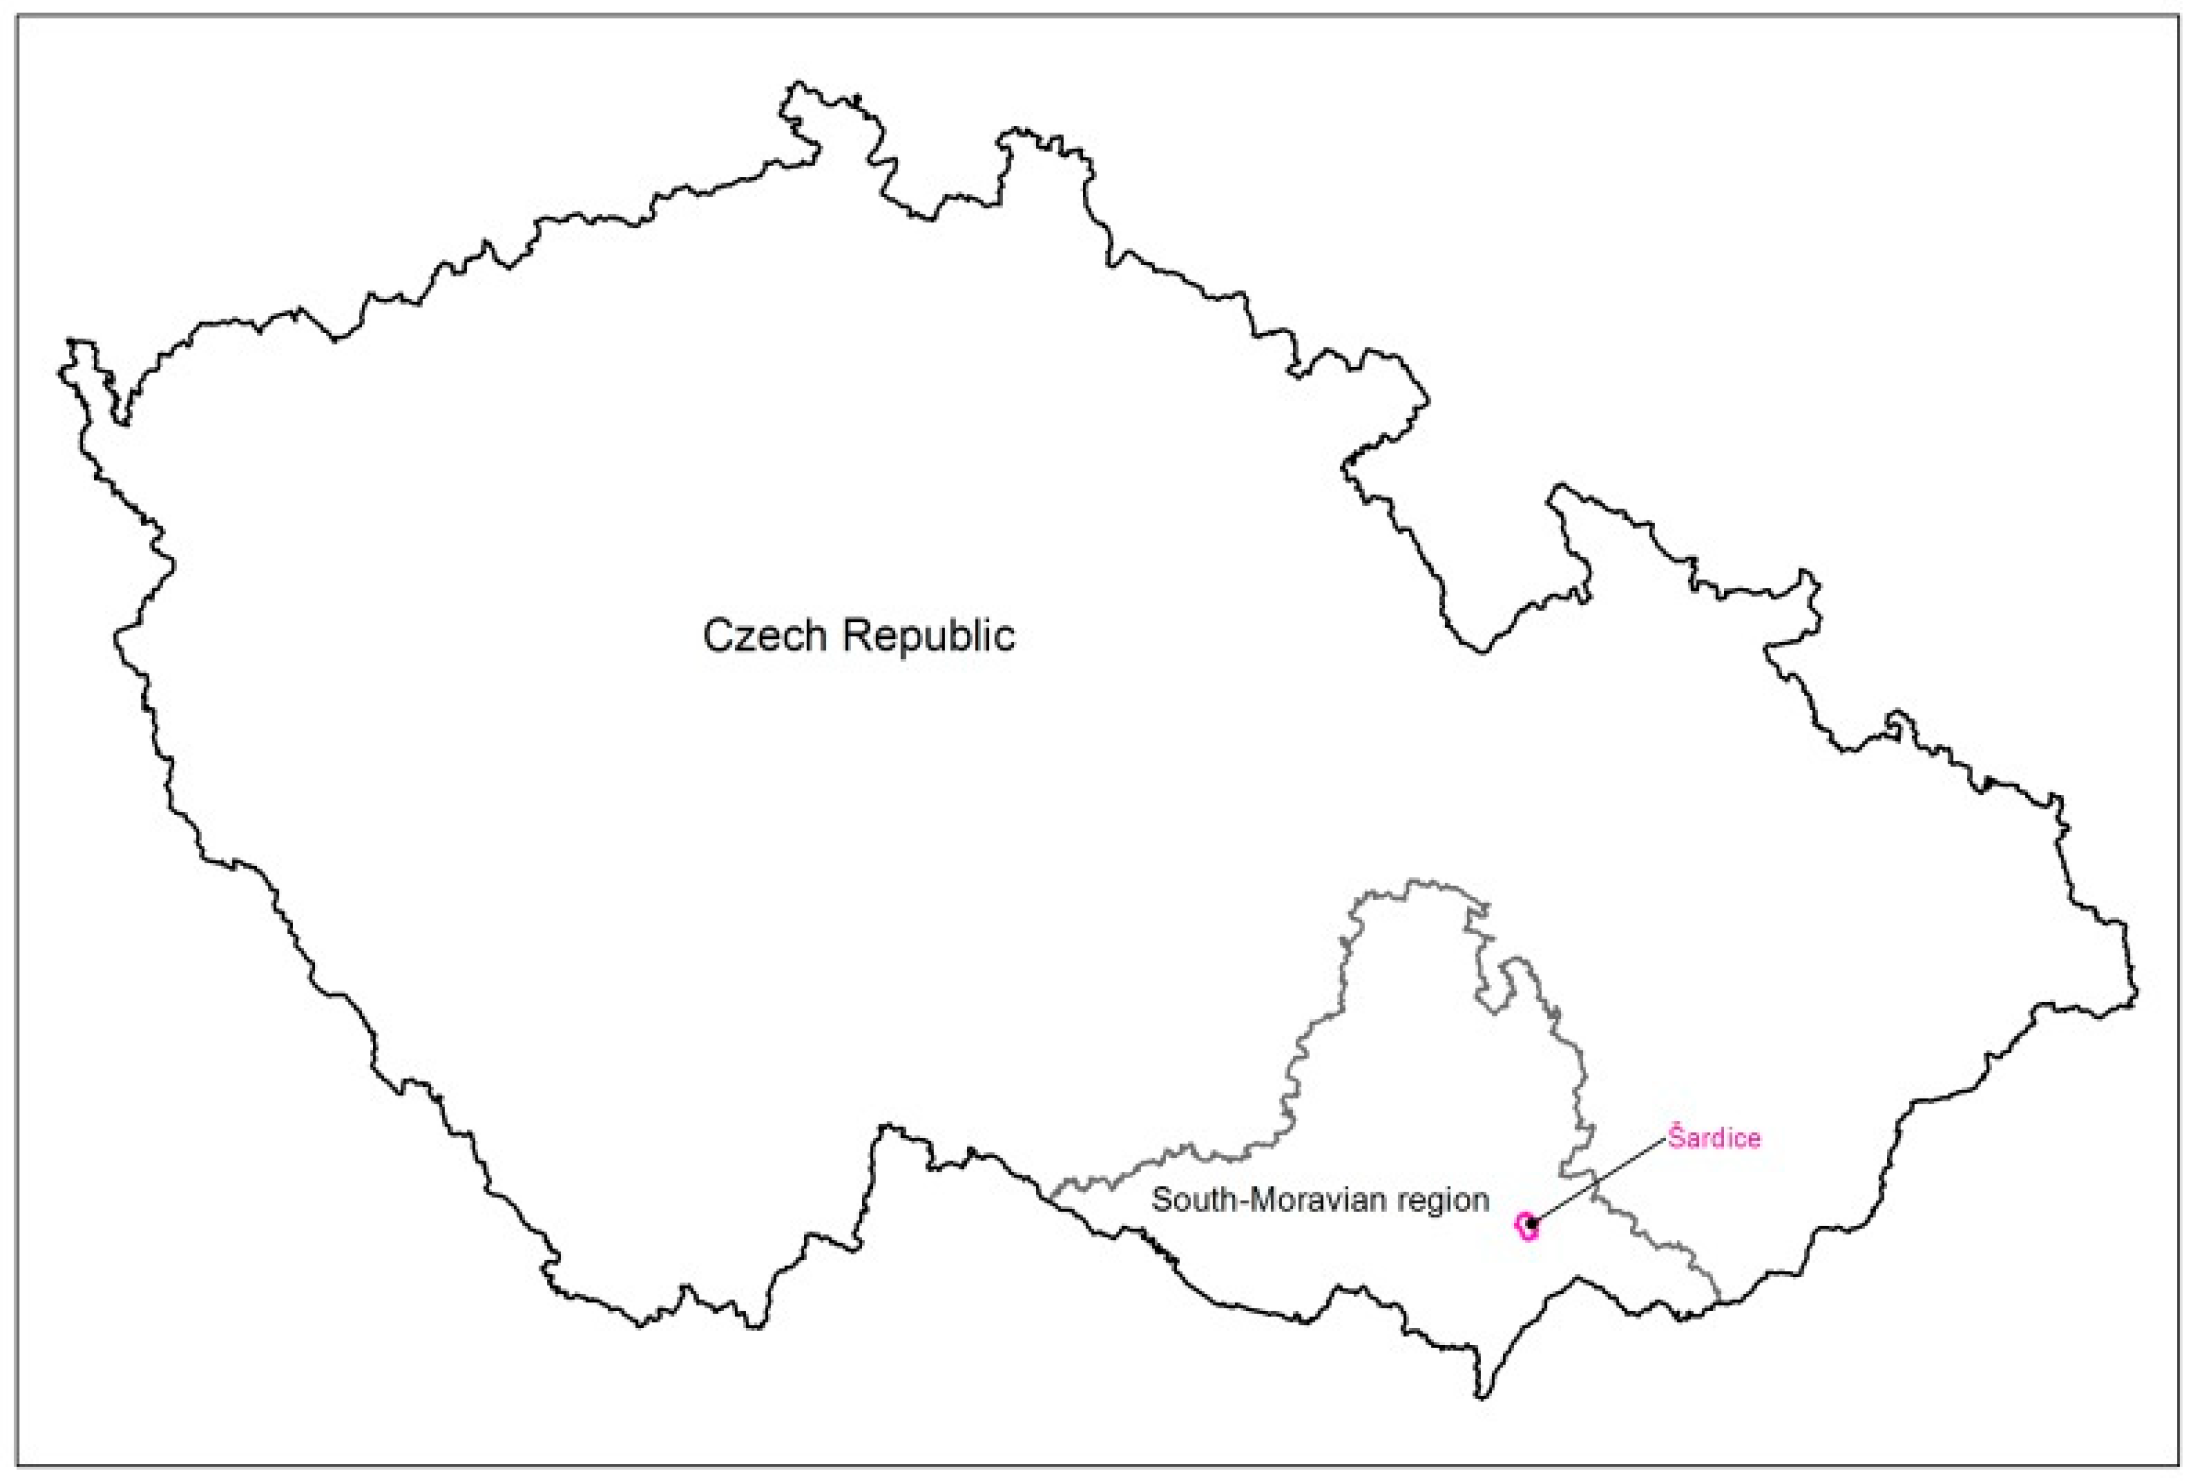
The main and unique aim of the project was to compare and evaluate the suitability of two methods of planting a wildlife corridor on agricultural land, in the identical conditions of single sites (identical soil and climate characteristics of the site, identical influence of the current weather). This initial assignment suggested that every comparison with the results of similar experiments will just be a generalising one, and so, in the search of possible experiments in similar habitat conditions, the selection of potential sites was narrowed down to the Central European region. Due to the historical development and occurrence of large blocks of arable land in some post-socialist countries, this space further narrows down to the former East Germany, Czech Republic, Slovakia, Hungary and, in a limited degree, also to Poland.
Further requirements for comparable works were the used species (or at least genera) of ligneous plants and the age of the plantings at the time of the measurements not exceeding 10 years.
Leaving aside the requirement for comparable conditions of the environment, the requirement for the age of the planting has become significantly limiting for the selection of other works for comparison. Many studies focus on the youngest seedlings as per nursery production, but monitoring of fresh plantings in the countryside de facto does not take place at all. Forestry research deals mainly with large-scale plantings for forest management purposes or for land reclamation purposes. The study of plantings delivered as part of ecological measures in agricultural landscape deals rather with the effects of the established stands on the surrounding environment (mainly regarding soil erosion) or evaluates the success of plantings in relation to a certain factor of the environment (content of a certain element in the soil, hydrological regime, soil conditioning before planting or the type and intensity of care for freshly planted areas).
Due to the above factors, it was very difficult to find comparable experiments within the Czech Republic and within Central Europe.
The plantings in the regional wildlife corridor LBK2 in Šardice can be considered viable regardless of the size of the planting material used.
How does one answer the question in the title of the paper? The answer will not be a definite one. Higher mortality was that of seedlings planted the forestry way, but at the same time, these had a greater dynamic of both height and trunk diameter increments compared to the landscaping stock.
As for the landscaping stock, the empirical experience had been partially confirmed, which was also demonstrated through the measurements: reduction of the root system does affect the increment in the first years following planting. The height increment values were minimal. However, trunk diameter increments were clearly visible on all the species throughout the entire period of measurements. This leads to the question of why a trunk increases but the terminal does not. An answer could perhaps be provided by some experiment that would evaluate the development of these parameters in an area with a significantly denser spacing of the plants, where the seedlings across the planted area would not have solitary positions but would compete against each other.
In the shrub plantings, there was not such a significant difference in mortality between the plantings in areas with forestry seedlings and landscaping stock. There was a significant difference in the measured height, when the absence of protection against wildlife browsing among the landscaping stock was clearly demonstrated. In both the cases, the plantings of Corylus avellana proved to be completely unsuccessful, probably due to an unknown error in the planting technology.
For a successful planting, several important points need to be addressed throughout the process of establishing a vegetation element:
  • The proposed species composition must be appropriate for the site conditions;
  • Quality planting material (appropriate height or size category, absence of growth defects and seedling damage) must be used;
  • Proper handling of planting material before and during planting must occur;
  • Well executed planting operations, including protection of seedlings (fencing or individual trunk protection), must occur;
  • Good aftercare, including the correct timing of individual operations (especially watering, cutting seedlings, checking fencing or stem protection and the correct and functional anchoring of seedlings), must be provided.

Supplementary Materials

The following supporting information can be downloaded at: https://www.mdpi.com/article/10.3390/land12091766/s1, File “Dataset_A.xlsx”—the measurement data (plots A), File “Dataset_B.xlsx”—the measurement data (plots B), Drawing documents [42]: File “Project_forest.pdf”—forestry planting drawing for one module “A” with planting scheme, File “Project_landscape.pdf”—landscaping planting drawing for one module “B” with planting scheme.

Author Contributions

Conceptualization, P.K. and D.L.; methodology, D.L. and P.K.; validation, P.K.; formal analysis, D.L.; investigation, D.L.; resources, D.L. and P.K.; data curation, D.L.; writing—original draft preparation, D.L.; writing—review and editing, P.K.; visualization, P.K. and D.L.; supervision, P.K.; project administration, D.L.; funding acquisition, D.L. All authors have read and agreed to the published version of the manuscript.

Funding

This research received no external funding.

Data Availability Statement

Not applicable.

Acknowledgments

This paper was not supported by any grant, and the presented results are not included in any supported research project. The research was delivered thanks to the “Projekty pro krajinu” company from Brno (Czech Republic) for providing project documentation from the delivery of a local wildlife corridor planting, for financial support of the field measurements and especially for the support of publishing this article. Special thanks to Sylva Dvorakova and Dana Pernicova for their technical assistance during the field measurements.

Conflicts of Interest

The authors declare no conflict of interest. The funders had no role in the design of the study; in the collection, analyses or interpretation of data; in the writing of the manuscript or in the decision to publish the results.

References

  1. Löw, J. Rukověť projektanta ÚSES. In Metodika Pro Zpracování Dokumentace; Nakladatelství Doplněk: Brno, Czech Republic, 1995; ISBN 80-85765-55-1. [Google Scholar]
  2. Mac Arthur, R.H.; Wilson, E.O. The Theory of Island Biogeography; Princeton University Press: Princeton, NJ, USA, 1967. [Google Scholar]
  3. Igor, M. Ekologická Stabilita, 2nd ed.; Ministerstvo Životního Prostředí České Republiky: Praha, Czech Republic, 1994; ISBN 80-7212-303-3.
  4. Zlatník, A. Ekologie Krajiny a Geobiocenologie; Vysoká Škola Zemědělská: Brno, Czech Republic, 1975. [Google Scholar]
  5. Buček, A.; Lacina, J. Geobiocenologie II; MZLU: Brno, Czech Republic, 1999; ISBN 80-7157-417-1. [Google Scholar]
  6. Forman, R.T.T.; Godron, M. Landscape Ecology; John Wiley: New York, NY, USA, 1986; ISBN 0471870374. [Google Scholar]
  7. Jongman, H.G.; Külvik, M.; Kristiansen, I. European ecological networks and greenways. Landsc. Urban Plan. 2004, 68, 305–319. [Google Scholar] [CrossRef]
  8. Smith, D.S.; Hellmund, P.C. (Eds.) Ecology of Greenways: Design and Function of Linear Conservation Areas; University of Minnesota Press: Minneapolis, MN, USA, 1993; 308p, ISBN -10: 0816621578. [Google Scholar]
  9. Hilty, J.A.; Lidicker, W.Z.; Merenlender, A.M. Corridor Ecology: The Science and Practice of Linking Landscapes for Biodiversity Conservation; Island Press: Washington, DC, USA, 2006; ISBN 978-1-55963-096-2. [Google Scholar]
  10. Lepeška, P. Metodika Zapracování ÚSES do Územních Plánů Obcí. Návod na Užívání ÚTP Regionálních a Nadregionálních ÚSES ČR; Ministerstvo Pro Místní Rozvoj České Republiky a Ústav Územního Rozvoje: Brno, Czech Republic, 1998. [Google Scholar]
  11. Bínová, L.; Culek, M.; Glos, J.; Kocián, J.; Lacina, D.; Novotný, M.; Zimová, E. Sledování a Hodnocení Vývoje Založených Prvků Lokálních Územních Systémů Ekologické Stability na Modelových územích—Část l. Metodické Postupy Sledování Nově Založených Částí Lokálních ÚSES; Ústav Pro Životní Prostředí Brno: Brno, Czech Republic, 1992; Not published. [Google Scholar]
  12. Bínová, L.; Culek, M.; Glos, J.; Kocián, J.; Lacina, D.; Novotný, M.; Zimová, E. Sledování a Hodnocení Vývoje Založených Prvků Lokálních Územních Systémů Ekologické Stability na Modelových Územích—Část 2. Výsledky Sledování za Rok 1992; Ústav Pro Životní Prostředí Brno: Brno, Czech Republic, 1992; Not published. [Google Scholar]
  13. Culek, M. Vliv Stanoviště, Polohy a Vysazených Dřevin na Vývoj Realizovaných Biokoridorů; Lesnická Práce: Kostelec nad Černými lesy, Czech Republic, 2012; pp. 11–22. ISBN 978-80-7458-050-5. [Google Scholar]
  14. Zimová, E. Zakládání Místních ÚSES na Zemědělské Půdě: Praktická Příručka Pro Projektanty Územních Systémů Ekologické Stability a Pozemkových Úprav; Lesnická Práce: Kostelec nad Černými lesy, Czech Republic, 2002; ISBN 80-86386-31-7. [Google Scholar]
  15. Buček, A.; Maděra, P.; Úradníček, L. Ecological network creation in the Czech Republic. J. Landsc. Ecol. 2007, 1, 12–24. [Google Scholar]
  16. Nizinski, Z. Management and productivity of stand on former agricultural land as illustrated by Syczecinek Provincial State, Lesne zagospodarowanie gruntach porolnych na przykladzie OZLP w Syczecineku. Sylwan 1991, 134, 89–96. [Google Scholar]
  17. Friedrichsdorf, B. Practical experience with afforestation—Using the example of former agricultural lands in the forest district of Schleswig, Special issue. Afforestation Forst Und Holz 1999, 54, 387–391. [Google Scholar]
  18. Bartoš, J.; Kacálek, D. Růstová prosperita kultur lesních dřevin na zalesněné zemědělské půdě. In Zalesňování Zemědělských půd, Výzva Pro Lesnický Sector; Neuhöferová, P., Ed.; Lesnická Práce: Kostelec nad Černými Lesy, Czech Republic, 2006; pp. 209–214. [Google Scholar]
  19. Jylhä, P.; Hytönen, J. Effect of vegetation control on the survival and growth of Scots pine and Norway spruce planted on former agricultural land. Can. J. For. Res. 2006, 36, 2400–2411. [Google Scholar] [CrossRef]
  20. Leugner, J. Kvalitní sadební material—základ úspěšného založení lesní kultury na zemědělském pozemku. In Zalesňování Zemědělských Půd, Výzva Pro Lesnický Sector; Neuhöferová, P., Ed.; Lesnická Práce: Kostelec nad Černými Lesy, Czech Republic, 2006; pp. 215–220. [Google Scholar]
  21. Vacek, S.; Simon, J. Zakládání a Stabilizace Lesních Porostů na Bývalých Zemědělských a Degradovaných Půdách; Lesnická Práce: Kostelec nad Černými lesy, Czech Republic, 2009; ISBN 978-80-87154-27-4. [Google Scholar]
  22. Deptula, M.; Nienartowicz, A.; Iwicka, M. Biomass of Scots pine-silver birch tree stand 25 years after afforestation of former agricultural land. Ecol. Quest. 2017, 25, 51–66. [Google Scholar] [CrossRef]
  23. Dimitrovský, K.; Vesecký, J. Lesnická Rekultivace Antropogenních Půdních Substrátů; Státní Zemědělské Nakladatelství: Praha, Czech Republic, 1989. [Google Scholar]
  24. Štýs, S. Rekultivace Území Devastovaných Těžbou Nerostů; SNTL: Praha, Czech Republic, 1990; ISBN 80-85087-10-3. [Google Scholar]
  25. Jahn, Z. Výsadba biocenter a interakčních prvků. In Pozemkové Úpravy—Časopis Pro Tvorbu a Ochranu Krajiny: Teorie a Praxe; Ministerstvo Zemědělství ČR—Ústřední Pozemkový Úřad: Praha, Czech Republic, 2016; Volume 24, pp. 2–6. ISSN 1214-5815. [Google Scholar]
  26. SESK. Uplynulé Ročníky. Územní Systém Ekologické Stability [Online]; Společnost Pro Ekologickou Stabilitu Krajiny: Brno, Czech Republic. Available online: https://www.uses.cz/seminar-uses-zelena-pater-krajiny/uplynule-rocniky/ (accessed on 6 June 2023).
  27. Weber, M.; Dostálek, J. Výzkum zakládání dřevinných porostů na zemědělské půdě. In Krajinotvorné Programy; Němec, J., Ed.; VÚKOZ Průhonice: Průhonice, Czech Republic, 2003; pp. 88–98. [Google Scholar]
  28. Dostálek, J.; Weber, C.I.M.; Koželuhová, R.K.; Petruš, C.I.J.; Možný, M. Výsadby Dřevin v Zemědělské Krajině: Případová Studie v Nivě Řeky Valová; Acta Pruhoniciana; VÚKOZ Průhonice: Průhonice, Czechia Republic, 2005; Volume 80, ISBN 80-85116-39-1. [Google Scholar]
  29. Dostálek, J.; Weber, M.; Matula, S.; Frantík, T. Forest stand restoration in the agricultural landscape: The effect of different methods of planting establishment. Ecol. Eng. 2007, 29, 77–86. [Google Scholar] [CrossRef]
  30. Dostálek, J.; Weber, M.; Matula, S.; Frantík, T. Planting different sized tree transplants on arable soil. Cent. Eur. J. Biol. 2009, 4, 574–584. [Google Scholar] [CrossRef]
  31. Dostálek, J.; Weber, M.; Frantík, T. Establishing windbreaks: How rapidly do the smaller tree transplants reach the height of the larger ones? J. For. Sci. 2014, 60, 12–17. [Google Scholar] [CrossRef]
  32. Jelínek, B.; Úradníček, L. The survival and growth rates of woody vegetation in the man-made Vracov biocorridor during the period 1993–2007. J. Landsc. Ecol. 2010, 3, 5–15. [Google Scholar] [CrossRef]
  33. Jelínek, B.; Úradníček, L. Malé nebo velké sazenice? In ÚSES-Zelená Páteř Krajiny; Petrová, A., Ed.; JOLA: Kostelec na Hané, Czech Republic, 2010; pp. 56–62. [Google Scholar]
  34. Jelínek, B.; Úradníček, L. Vývoj a růst keřů na bývalé zemědělské půdě. In ÚSES—Zelená Páteř Krajiny; JOLA: Kostelec na Hané, Czech Republic, 2011; pp. 21–30. ISBN 978-80-86636-33-7. [Google Scholar]
  35. Jelínek, B.; Úradníček, L. Zkušenosti a poučení z dosavadní realizace ÚSES. In ÚSES—Zelená Páteř Krajiny a Ekologické Sítě v Krajině; Petrová, A., Machar, I., Eds.; Univerzita Palackého v Olomouci: Olomouc, Czech Republic, 2012; pp. 42–52. ISBN 978-80-244-3214-4. [Google Scholar]
  36. Jelínek, B.; Úradníček, L. Stav vybraných biokoridorů 20 let od založení. In ÚSES—Zelená Páteř Krajiny 2013; Petrová, A., Ed.; JOLA: Kostelec na Hané, Czech Republic, 2013; pp. 55–63. ISBN 978-80-86636-39-9. [Google Scholar]
  37. Jelínek, B.; Úradníček, L. The Survival and Growth Rates of Woody Vegetation in the Man-Made Radějov Biocorridor During the Period of 1993–2012. Eur. Countrys. 2014, 6, 88–117. [Google Scholar] [CrossRef]
  38. Úradníček, L.; Jelínek, B. Vývoj a růst dřevin na příkladu biokoridoru Vracov. In ÚSES-Zelená Páteř Krajiny; Petrová, A., Ed.; JOLA: Kostelec na Hané, Czech Republic, 2010; pp. 89–95. [Google Scholar]
  39. Úradníček, L. Evaluation of the Woody Component Development of the Model Biocorridor. Ekológia 2004, 23, 351–361. [Google Scholar]
  40. Česká Geologická Služba. Půdní Mapa (Soil Map) 1:50 000 [Online]; Česká geologická služba: Praha, Czech Republic. Available online: https://mapy.geology.cz/pudy/ (accessed on 25 August 2023).
  41. VÚMOP. PŮDA V MAPÁCH [Online]; Výzkumný Ústav Meliorací a Ochrany Půdy: Praha, Czech Republic, 2023; Available online: https://mapy.vumop.cz/ (accessed on 25 August 2023).
  42. Lacina, D. Projekt Založení Lokálního Biokoridoru LBK 2 v k. ú. Šardice. Projektová Dokumentace k Realizaci. Czech Projektová dokumentace k realizaci, 2013; Unpublished work. [Google Scholar]
  43. Vacek, Z.; Vacek, S.; Podrazsky, V.; Král, J.; Bulusek, D.; Putalová, T.; Balas, M.; Kalousková, I.; Schwarz, O. Structural diversity and production of alder stands on former agricultural land at high altitudes. Dendrobiology 2016, 75, 31–44. [Google Scholar] [CrossRef]
  44. Tužinský, M.; Kupka, I.; Podrázský, V.; Prknová, H. Influence of the mineral rock alginite on survival rate and re-growth of selected tree species on agricultural land. J. For. Sci. 2015, 61, 399–405. [Google Scholar] [CrossRef]
  45. Chmelař, J. Dendrologie s ekologií lesních dřevin. In 2. Část., Hospodářsky Významné Listnáče, 2nd ed.; Vysoká Škola Zemědělská: Brno, Czech Republic, 1990. [Google Scholar]
  46. Fischer, H. Damage to oak (Quercus robur) and beech (Fagus sylvatica) grown on former agricultural land, and new sprouts by root collar regeneration. Forst Und Holz 1999, 54, 463–466. [Google Scholar]
Figure 1. Situation of the studied area (created in ArcGIS Desktop 10.5.1).
Land 12 01766 g001
Figure 2. Distribution of the planting types throughout the wildlife corridor [42]. A—forestry planting modules as per planting schemes (white); B—landscaping planting modules as per planting schemes (gray). For more details see Supplementary Materials.
Land 12 01766 g002
Figure 3. Forestry method—number of plants vs. overall mortality [%] (2016–2019).
Land 12 01766 g003
Figure 4. Landscaping method—number of plants vs. overall mortality [%] (2016–2019).
Land 12 01766 g004
Figure 5. Forestry method (shrubs)—number of plants vs. overall mortality [%] (2016–2019).
Land 12 01766 g005
Figure 6. Landscaping method (shrubs)—number of plants vs. overall mortality [%] (2016–2019).
Land 12 01766 g006
Figure 7. Vitality of the tree inventory—forestry mode of planting (Note: The word “Lineární” means a linear trend line).
Land 12 01766 g007
Figure 8. Vitality of the tree inventory—landscaping mode of planting (Note: The word “Lineární” means a linear trend line).
Land 12 01766 g008
Figure 9. Comparison of vitality through relative diameter and height increments 2016–2019 (Note: The word “Lineární” means a linear trend line).
Land 12 01766 g009
Figure 10. Average height and relative increment of shrubs. Note: The word “Lineární” means a linear trend line.
Land 12 01766 g010
Table 1. Evolution of tree seedling numbers and mortality over time.
FORESTRY MODE OF PLANTING
Quantity [Pieces]Mortality [%]
SpeciesPlanned Planted2016 2017 20182019 2016201720182019
Acer campestre5144434040392.279.099.0911.36
Carpinus betulus3029272523186.9013.7920.6937.93
Fraxinus excelsior4239383837372.562.565.135.13
Populus alba3026141410746.1546.1561.5473.08
Quercus robur12313010195836922.3126.9236.1546.92
Tilia cordata8180757270666.2510.0012.5017.50
Ulmus glabra2736343433335.565.568.338.33
TOTAL/average38438433231829626913.5417.1922.9229.95
LANDSCAPING MODE OF PLANTING
Quantity [pieces]Mortality [%]
SpeciesPlanned Planted2016 2017 2018 2019 2016201720182019
Acer campestre1212121212120.000.000.000.00
Carpinus betulus1212121212120.000.000.000.00
Fraxinus excelsior2424242424230.000.000.004.17
Populus alba88777712.5012.5012.5012.50
Quercus robur4444404040409.099.099.099.09
Tilia cordata1616161616160.000.000.000.00
Ulmus glabra4444440.000.000.000.00
TOTAL/average1201201151151151144.174.174.175.00
Table 2. Evolution of shrubs seedling numbers and mortality over time.
FORESTRY MODE OF PLANTING
Quantity [Pieces]Mortality [%]
SpeciesPlanned Planted2016 2017 2018 2019 2016201720182019
Corylus avellana3635775280.0080.0085.7194.29
Cornus sanguinea84846461585723.8127.3830.9532.14
Euonymus europaeus5454545454530.000.000.001.85
Ligustrum vulgare8788868686842.272.272.274.55
Lonicera xylosteum3939373737355.135.135.1310.26
Rhamnus cathartica18181413131322.2227.7827.7827.78
TOTAL/Average31831826225825324417.6118.8720.4423.27
LANDSCAPING MODE OF PLANTING
Quantity [pieces]Mortality [%]
SpeciesPlannedPlanted2016 2017 2018 20192016201720182019
Corylus avellana2422433081.8286.3686.36100.00
Cornus sanguinea48484229363512.5039.5825.0027.08
Euonymus europaeus4848483648470.0025.000.002.08
Ligustrum vulgare6061614559590.0026.233.283.28
Lonicera xylosteum28282520252410.7128.5710.7114.29
Rhamnus cathartica28292013181831.0355.1737.9337.93
TOTAL/Average23623620014618918315.2538.1419.9222.46
Table 3. Trunk diameter and height—forestry seedling (trees).
Average Diameter [mm]Average Height [cm]
Species/Year20162017201820192016201720182019
Acer campestre9.3510.4313.1823.1972.6783.7596.26142.59
Carpinus betulus6.426.286.678.3540.9939.4340.5256.30
Fraxinus excelsior6.627.277.659.0736.5337.8441.6164.29
Populus alba8.8911.2413.2922.39102.90138.56152.89184.42
Quercus robur6.156.356.497.0837.6637.3938.1846.19
Tilia cordata6.707.047.238.4536.7335.3236.5050.15
Ulmus glabra11.3411.9314.6521.4883.8894.56107.19139.08
Average7.938.659.8814.2958.7766.6973.3197.58
Table 4. Increments of trunk diameter and height (trees) in %.
Diameter Increment [%]Height Increment [%]
Species/Year201720182019201720182019
Acer campestre11.5740.91147.9615.2432.4696.21
Carpinus betulus−2.263.9330.05−3.81−1.1637.35
Fraxinus excelsior9.7415.5736.993.6113.9076.02
Populus alba26.3549.50151.8034.6648.5979.23
Quercus robur3.305.5615.19−0.721.3722.66
Tilia cordata5.057.9526.12−3.84−0.6336.53
Ulmus glabra5.1929.1789.4312.7427.8065.82
Average9.1124.6880.2913.4924.7466.04
Table 5. Trunk diameter and height—landscaping seedling (trees).
Average Increment [mm]Average Height [cm]
Species/Year20162017201820192016201720182019
Acer campestre34.434.6338.5145.92412.08408.33409.58424.17
Carpinus betulus28.3929.930.5233.19330.83330335329.17
Fraxinus excelsior33.9934.2634.3936.37366.25361.87364.17344.29
Populus alba9.813.9421.4930.97181.88225253.13327.5
Quercus robur31.4632.0433.3637.85352.18346.62346.31336.87
Tilia cordata32.2233.4236.2842.77340.31341.88345340.63
Ulmus glabra37.0939.8941.9947.26455450448.75466.25
Average29.6231.1533.7939.19348.36351.96357.42366.98
Table 6. Increments of trunk diameter and height (trees) in %.
Average Increment [mm]Average Height [cm]
Species/Year201720182019201720182019
Acer campestre0.6511.9333.48−0.91−0.612.93
Carpinus betulus5.297.516.88−0.251.26−0.5
Fraxinus excelsior0.791.187−1.19−0.57−6
Populus alba42.22119.26216.0123.7139.1880.07
Quercus robur1.826.0220.29−1.58−1.67−4.35
Tilia cordata3.7212.632.720.461.380.09
Ulmus glabra7.5513.2127.44−1.1−1.372.47
Average5.1614.0732.291.032.65.35
Table 7. Coefficients of determination of the trends of linear regression of the tree species vitality within both planting modes.
Linear Regression—Coefficient of Determination R2
Forestry ModeLandscaping Mode
Acer campestre0.99280.8042
Carpinus betulus0.98030.0622
Fraxinus excelsior0.92410.9799
Populus alba0.86770.9774
Quercus robur0.90200.9214
Tilia cordata0.89520.0032
Ulmus glabra0.97960.4608
Average0.93450.6013
Table 8. Height of the plant and increment thereof in years.
FORESTRY MODE OF PLANTING
Average Height [cm]Height Increment [%]
Species/Year20162017201820192016201720182019
Corylus avellana45.4746.0046.3356.0001.171.9123.17
Cornus sanguinea46.6748.3650.5870.3103.628.3650.65
Euonymus europaeus69.4169.6789.04118.6100.3728.2870.89
Ligustrum vulgare67.3568.7777.76106.3502.1115.4657.91
Lonicera xylosteum83.8583.5490.50108.700−0.377.9229.63
Rhamnus cathartica46.2648.0765.22103.3603.9241.00123.44
Average59.8360.7369.9093.8901.5016.8356.91
LANDSCAPING MODE
Average height [cm]Height increment [%]
Species/Year20162017201820192016201720182019
Corylus avellana17.7518.7511.2531.5005.63−36.6277.46
Cornus sanguinea37.3731.8829.7133.740−14.70−20.52−9.73
Euonymus europaeus72.3558.8367.2771.600−18.69−7.03−1.04
Ligustrum vulgare55.0550.7857.6768.850−7.764.7625.07
Lonicera xylosteum69.3576.3076.8976.50010.0110.8710.30
Rhamnus cathartica42.7429.7341.6146.080−30.43−2.647.82
Average49.1044.3847.4054.710−9.62−3.4711.42
Disclaimer/Publisher’s Note: The statements, opinions and data contained in all publications are solely those of the individual author(s) and contributor(s) and not of MDPI and/or the editor(s). MDPI and/or the editor(s) disclaim responsibility for any injury to people or property resulting from any ideas, methods, instructions or products referred to in the content.

