Article

Assessing the Accessibility and Equity of Urban Green Spaces from Supply and Demand Perspectives: A Case Study of a Mountainous City in China

1
School of Tropical Agriculture and Forestry, Hainan University, Haikou 570228, China
2
School of Construction Management and Real Estate, Chongqing University, Chongqing 400045, China
*
Author to whom correspondence should be addressed.
Land 2023, 12(9), 1793; https://doi.org/10.3390/land12091793
Submission received: 20 August 2023 / Revised: 8 September 2023 / Accepted: 13 September 2023 / Published: 15 September 2023

Abstract

:
Urban green space accessibility is an essential consideration in determining environmental liveability and the well-being of individuals, and the spatial inequity of urban green space supply and demand has become a research focus. However, few studies have conducted a multidimensional and comprehensive assessment of the influences on accessibility from the different perspectives of supply and demand. To address this, our study centred on the mountainous Chongqing region and established a comprehensive research framework examining the spatial pattern of accessibility of urban green spaces and its correlation with physical geographical elements and socioeconomic factors. We reveal the spatial distribution characteristics of urban green space accessibility by using Gaussian-based two-step floating catchment area and network analysis methods and further observe the spatial clustering features utilising hotspot analysis. The ordinary least squares (OLS) model and the spatial lag model were used to evaluate the physical geographical and socioeconomic disparities. Our findings reveal explicit blind spots in urban green space accessibility, primarily within the 30 min travel threshold in the city’s marginal area. A discernible supply–demand imbalance existed in the urban core, constituted by implicit blind spots. Furthermore, we identified that the relationship between urban green space accessibility and elevation under different methods is not always consistently significant over space because spatial heterogeneity may exist. Most concerningly, the study found inequities in urban green space accessibility, particularly impacting vulnerable demographics such as the elderly and lower-income groups. These results can inform urban planners and policymakers about the blind spots of urban green space accessibility and sufficiently consider the physical and socioeconomic heterogeneity of the space to determine where and how to implement inclusive urban greening policies or planning schemes. It is also of great significance in increasing awareness of vulnerable groups and preventing environmental inequality.

1. Introduction

An urban green space (UGS) is recognised as an urban element that closely mirrors nature, often associated with recreation, socialisation, aesthetics, cultural heritage and ecological functions. It is a crucial component of urban design [1,2]. The relevance of UGSs for urban ecosystem services, urban sustainability and human happiness has been reaffirmed by an extensive amount of research demonstrating their beneficial effects on the environment and society [3,4,5,6]. UGSs serve key ecological functions, such as the filtration of air [7], temperature regulation [8] and flood control [9]. Given these substantial benefits, it is crucial that all city dwellers have easy access to UGSs [10].
Assessing the availability of UGSs may provide an in-depth awareness of resource distribution. Recent scholarship highlights the challenges posed by urbanisation, including the shrinking or insufficient supply of UGSs [11,12], uneven spatial distribution [13] and environmental injustices related to access [3,14]. The aforementioned phenomena have sparked heightened scholarly and governmental attention towards the assessment of existing patterns of UGS distribution and their spatial variations [1,15,16]. In the meantime, with the acceleration of global urbanisation, high urban population densities place additional pressures on the upkeep and expansion of UGSs, particularly when it comes to quality and quantity [2]. Therefore, a substantial, well-distributed supply of UGSs has become a crucial indicator of the liveability of a city. However, it is crucial to acknowledge that UGSs may not consistently fulfil the diverse requirements of people. To address this issue, the accessibility and distribution of UGSs need to be understood in relation to population density.
As a crucial indicator in spatial equity studies, accessibility is widely considered a useful tool for evaluating the number and equity of UGS, and its assessment methods have been continuously optimised in recent years. As a crucial indicator in spatial equity studies, accessibility is widely considered a useful tool for evaluating the number and equity of UGS, and its assessment methods have been continuously optimised in recent years. Traditionally, the ‘container approach’ calculates the per capita UGS by dividing the overall green space by people residing inside a designated border [17,18]. However, this simplistic method overlooks the geographic spread of UGSs and people’s mobility patterns, such as the walking distance and cross-border effects [19,20]. Research has sought to integrate accessibility into UGS allocation evaluations, recognising that the uneven geographical distribution of supply and demand creates variations in accessibility. Moreover, various approaches and models have been devised to assess UGS accessibility by using geographic information systems (GIS) [21,22,23]. These include the buffer zone approach, the weighted distance method, network analysis and the two-step floating catchment area (2SFCA) model. Among these methods, the network analysis method based on topology and operations research may more accurately reflect the spatial distribution of the service area of UGSs because it considers actual road accessibility. In addition, the 2SFCA method is considered an excellent accessibility method for determining potential spatial differences between supply and demand [10]. It was first proposed by Radke and Mu in 2000 and subsequently revised by Luo and Wang in 2003 [24], followed by Luo and Qi’s improvement of the method to produce enhanced 2SFCA (E2SFCA) [25]. Using a catchment, it explicitly takes into account resource supplies, population demands and their interactions. However, it still proposes uniform accessibility within each travel time zone. To detect deficit areas more efficiently, Dai introduced the Gaussian function into the 2SFCA and discount access to the catchment area [26], thus making it possible to evaluate the accessibility of the UGS. Therefore, in this study, the Gaussian-based 2SFCA was selected to measure accessibility, and multiple modes of transportation were considered to provide a more realistic estimate of accessibility.
However, most academic research places emphasis on analysing the disparities in the accessibility of UGSs across different locations but often fails to thoroughly investigate the factors that contribute to these diverse outcomes. The varying characteristics of physical geographical elements can directly or indirectly influence human activities and consequently shape social development [27,28]. In addition, it is crucial to assess the correlation between socioeconomic factors and the accessibility of UGSs since social development affects living conditions and is the basis for all social activities. Research on UGS demand has increasingly pivoted from a homogenous population to a relationship-centric focus, considering the correlation between green spaces and demographic characteristics. This shift occurred in the context of a broad movement towards people-centred urban construction that emphasises the needs of specific groups [29,30]. Much of this research focused on developed countries and examined the association between UGSs, socioeconomic status [31], religious attributes [32] and age [33]. Consequently, we must analyse UGS distribution and accessibility in relation to physical geographical elements and socioeconomic factors.
Inspired by the current challenges of UGS accessibility indicators and the potential supply–demand imbalance in Chongqing [34,35], this study has three objectives. First, it introduces a more comprehensive framework for evaluating UGS accessibility in terms of supply and demand. Second, it identifies key locations for optimising the distribution of UGS by comparing the results of different methods and identifying explicit and implicit blind spots. Finally, it also discerns the intrinsic relationships between UGS accessibility, physical geographical elements and socioeconomic factors, which assists urban and regional planners in understanding the disparities between them in order to formulate intervention plans.
The ensuing portions of the study are organised in the following manner: Section 2 provides a comprehensive overview of the data gathering and research method used in this research. Section 3 presents and analyses the results of UGS accessibility calculations for different travel modes from the supply and demand perspectives. This section additionally encompasses the statistical analysis of quantitative data derived from spatial analysis. The last two sections, respectively, are where the discussion and the conclusions are presented.

2. Materials and Methods
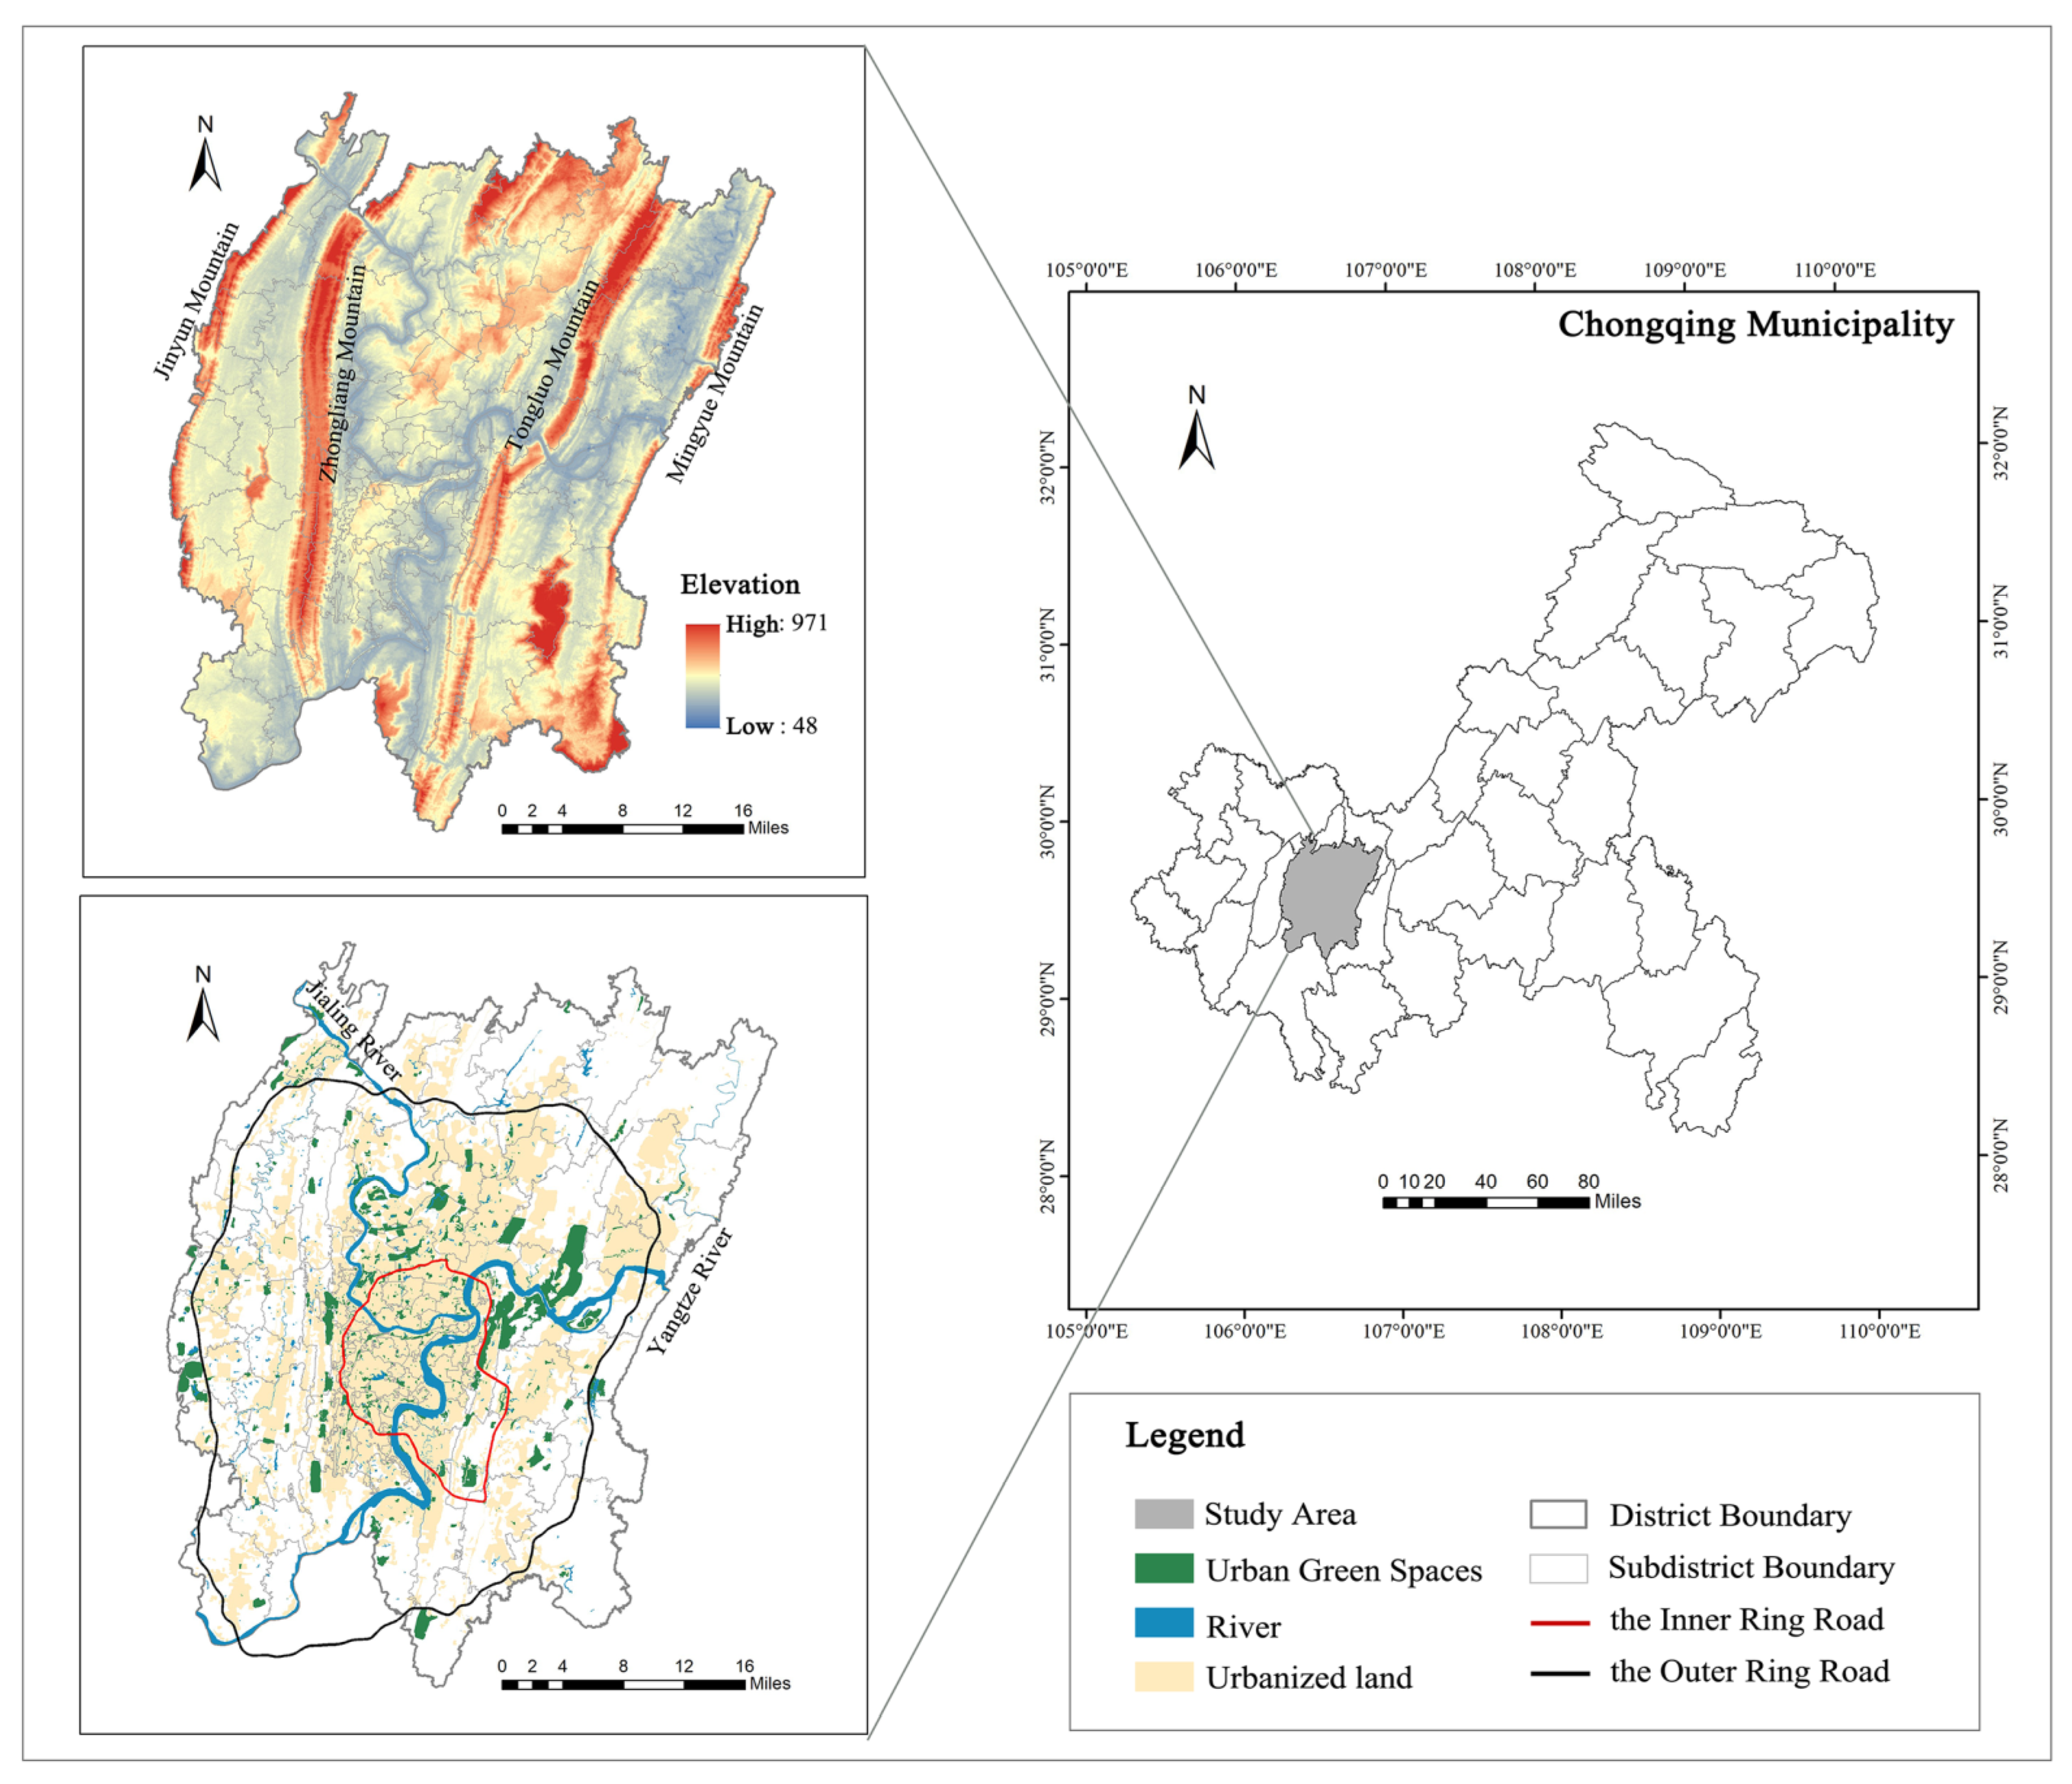
2.1. Study Area

We selected Chongqing, a typical mountainous city with a complex urban environment, as our study site. Moreover, Chongqing is a rapidly urbanising megacity with multiple urban centres, while it has a significantly different environment from that of plain cities, and exemplifies the intensive human–environment relationship in China [34,36] The city is intersected by four north–south mountains (the Jinyun, Zhongliang, Tongluo and Mingyue Mountains) and two west–east rivers (the Jialing and Yangtze Rivers). The city’s complex topography, which is divided by rivers and valleys with a substantial topographical height difference, constrains the city layout, resulting in a dispersed pattern [37,38]. Moreover, the city’s complex transportation systems and limited availability of construction land present challenges to rational UGS planning [39]. Despite these challenges, the point-like three-dimensional layout of green space resources in mountainous cities offers opportunities for an efficient green space supply. The primary area of interest for our study is the Chongqing buildup area, situated predominantly within the outer ring road and consisting of nine administrative districts: Yuzhong, Jiangbei, Yubei, Shapingba, Jiulongpo, Nanan, Dadukou, Beibei and Banan. These districts comprise 128 subdistricts, collectively spanning 3140.28 km2 (Figure 1). On the basis of local knowledge, we have delineated the area encompassed by the inner ring as the core area, the area within the outer ring as the suburbs and the area outside as the urban marginal area. Our study may provide insights that are applicable to other mountainous cities, particularly those in developing countries.
The UGS referred to in the text is a collated green space with a certain scale (>3000 m2) and service function, with the main emphasis on the dimension of its recreational function and more concerned with the close relationship between the green space and the daily life of the residents. In total, 724 UGSs were distinguished within (n = 724) the study area, including parklands and gardens, greenbelts along roads (>5000 m2), greenbelts along rivers, greening squares, green spaces around residences and green spaces around institutions. Water bodies and small green spaces, such as roadside greenery, were not considered.

2.2. Data Collection

The data for this research were compiled from various sources. The first set of data, pertaining to UGSs, was obtained from open street maps. These data were combined with GlobeLand30—a 30-metre resolution land cover dataset of Chongqing for the year 2020—and corroborated and supplemented using geographic data generated by Google Remote Sensing images. To ensure the consistency and accuracy of our study of UGSs information, we referred to the land use survey data (1:10,000 scale) provided by the Land and Resources Bureau. The second set of data, providing details on the residents within each ‘subdistrict’, was sourced from the Sixth National Population Census of the People’s Republic of China 2010, a resource analogous to the US census tracts. The third dataset was obtained from the ‘Baidu Sitemap Generator’ in 2021 and covers the subdistrict network information. Finally, we obtained data about residential communities from Lianjia’s website (http://www.lianjia.com/ (accessed on 29 July 2021)). Lianjia, one of China’s largest housing intermediaries, provides real estate and rental services and offers detailed information about residential communities, such as location, coordinates and prices. We collected data for 5935 residential areas, including name, household number, longitude, latitude and average price attributes.
We categorised the selected variables into two dimensions: physical geographic elements and socioeconomic factors. The first dimension includes factors like elevation and the proportion of UGSs. The second encompasses road network density, residents’ income and the percentage of the population that is at least 65 years old in each subdistrict. Given the unavailability of public income data for Chinese cities, we used home sale prices as a proxy for residents’ income levels [40,41]. Assuming that a higher quality of life is sought by higher-income individuals who can afford commercial housing, while those with lower income opt for affordable housing, provided a basis for our estimations.

2.3. Urban Green Space Accessibility Method

2.3.1. Network Analysis Method

The core purpose of using the network analysis method is to calculate the service area of UGSs to visually determine the level of service at the supply level of UGSs in the study area because it is generally believed that people within the service area are more likely to reach the UGS and enjoy the service. In the traditional radius method, a service area is depicted as a circle with a radius encompassing a UGS. The network analysis method offers a more precise measure than the radius method because it determines a facility’s service area at a specific cost on the basis of a particular travel mode’s road network (either walking or driving a private car) [32]. This method considers actual travel routes, distances and travel friction. For this study, we selected residents’ travel time to UGSs as the defining range of service areas instead of the radius. On the basis of prior research, we set 30 min as the maximum acceptable travel time for residents. We assumed a 5 km/h walking pace [42]. The driving speeds on the highway, the expressway, the main road, the secondary main road and the branch road were set at 100, 80, 60, 40 and 20 km/h, respectively.

2.3.2. Gaussian-Based 2SFCA Method

To further analyse the interaction between the supply of UGS and population demand at different locations, the Gaussian-based 2SFCA approach is employed to assess the UGS accessibility [34]. This method avoids the dichotomy problem that can lead to errors with the 2SFCA approach [26,43]. The formulas used are outlined below.
The initial step involves conducting a search for all population sites i that fall within a specified travel time threshold (d0) from each UGS location j. This process establishes the catchment area for the UGS location j. Individuals at location i will be assigned weights based on a Gaussian function, denoted as G. The projected number of prospective users for UGS at position j may be determined by summing the weighted individuals living within its catchment region. The UGS to population ratio (Rj) is expressed as follows:
R j = S j i d i j d 0 k D i × G d i j ,
D i = K 0 × H i ,
where (Di) denotes the population at site i whose centroid lies inside the catchment (i.e., dijd0) of UGS j, and (Hi) indicates the overall number of households in the residential area. (K0) is the average population per household. According to the average population per household of urban residents in the Chongqing Statistical Yearbook in 2020, the value is 2.98; dij is the distance people have to walk or drive to travel from population location i to UGS site j; UGS capacity (size in square metres) is denoted by Sj; and G is the friction-of-distance listed below:
G d i j , d 0 = e 1 / 2 × d i j / d 0 2 e 1 / 2 1 e 1 2 , d i j d 0 0 , d i j > d 0 ,
Next, the search is conducted for each population site i to identify all UGSs l that fall within the specified time threshold (d0) from i. The Gaussian function G is utilised to discount each R. The summation of discounted R values throughout the region of catchment i is used to ascertain the level of accessibility at population site i, using the following equation:
A i = l d i j d 0 R l × G d i j ,
where Rj denotes all the UGSs serving the population at position i, and all of the other symbols and notations remain consistent with Equation (1). After special weighting, the accessibility value (Ai) can be interpreted as the per capita green area.
The catchment size (d0) is essential in determining whether a UGS is accessible. In this study, six thresholds ranging from 10 to 30 min with a 5 min increment were tested. The reason this increment was chosen was to examine the variation in accessibility resulting from different thresholds, which is consistent with previous studies [15,44]. Meanwhile, the method considers the road routes based on the actual terrain and the resistance of the residents to travelling in the travelling process. In addition, the accessibility of UGSs in each community was determined using the Gaussian-based 2SFCA approach. Then, the accessibility of each subdistrict was calculated by averaging the UGS accessibility of the communities.

2.4. Hot Spot Analysis Using Getis Ord Gi* Statistic

We used a hot spot analysis (Getis-Ord Gi*) tool to identify the geospatial clustering of hot (high) and cold (low) spots of UGS accessibility and to explore the spatial layout of UGS accessibility under different methods and modes of transportation [45]. One of the benefits of utilising this tool is its capability to ascertain localised connections among observations and their neighbouring entities, hence facilitating the visualisation of spatial interaction patterns through the identification of small clusters or minor outliers [46,47]. The following is the formula used to obtain the Getis-Ord Gi* local statistics [48]:
G i * = j = 1 n ω i , j x j X ¯ j = 1 n ω i , j S n j = 1 n ω i . j 2 j = 1 n ω i , j 2 n 1 ,
where the variable xj denotes the attribute value associated with item j. The variable wi,j represents the spatial weight between features i and j. Additionally, the variable n corresponds to the overall amount of traits.
X ¯ = j = 1 n x j n ,
And
S = j = 1 n x j 2 n X ¯ 2 .
For each feature in the dataset, the Gi* statistic returns a z-score as its output. A z-score that is significantly positive shows a pronounced concentration of high values, commonly referred to as a ‘hot spot’. Conversely, a z-score that is slightly negative signifies a notable concentration of low values, often referred to as a ‘cold spot’. This method offers a more comprehensive illustration of the spatial clustering attributes pertaining to the accessibility of UGSs as opposed to solely examining the extreme values of high or low accessibility in isolation.

2.5. Spatial Autoregressive Analyses

To compare the disparities in the calculation of UGS accessibility using the two methods across various influencing factors, the study conducted weight calculations and indicator combinations on the results of two distinct methods. The analysis involved comparing the accessibility results under different travel modes using the entropy weights method. Additionally, we selected variables related to physical geographical elements and socioeconomic factors for statistical analysis. Initially, we constructed an ordinary least squares (OLS) regression model to examine the relationships between the dependent variable (UGS accessibility) and the independent variables (physical geographical elements and socioeconomic factors). For our analysis, we included indicators such as residents’ income, elevation, road network density, the proportion of the elderly and the proportion of UGSs. These indicators were selected based on their significance in defining geosocial conditions and specific groups, as emphasised in prior research [49,50]. Given that population density is already incorporated in the formula for the Gaussian-based 2SFCA method, it was not included in the regression analysis. Subsequently, in order to address the possibility of global autocorrelation in the data, the use of Moran’s I statistic was employed to evaluate the existence of global autocorrelation in both variables that are dependent and the mistakes of the initial OLS models. Spatial regression was conducted when significant spatial autocorrelation was detected in the study area using Moran’s I-statistic. The spatial regression model resolved spatial dependencies that the linear regression analysis was incapable of handling [51]. The utilisation of Lagrange multiplier testing indicated that the spatial lag model (SLM) was the most optimal selection for this study. The selection of the inverse of the distance matrix was considered to be the optimal approach for representing spatial relationships in the data. The equation for the SLM model is as follows:
y = ρ W y + X β + e
where W represents the matrix of spatial weights. The parameter ρ characterises the range of spatial autocorrelation between −1 and 1. Additionally, ρWy quantifies the spatial dependence present in y. The matrix X represents observations on the covariates, with dimensions n × k. β is the k × 1 vector of regression coefficients, and e is an n × 1 vector of errors that have been independently and uniformly distributed.

3. Results

3.1. Spatial Distribution of Urban Green Space Accessibility

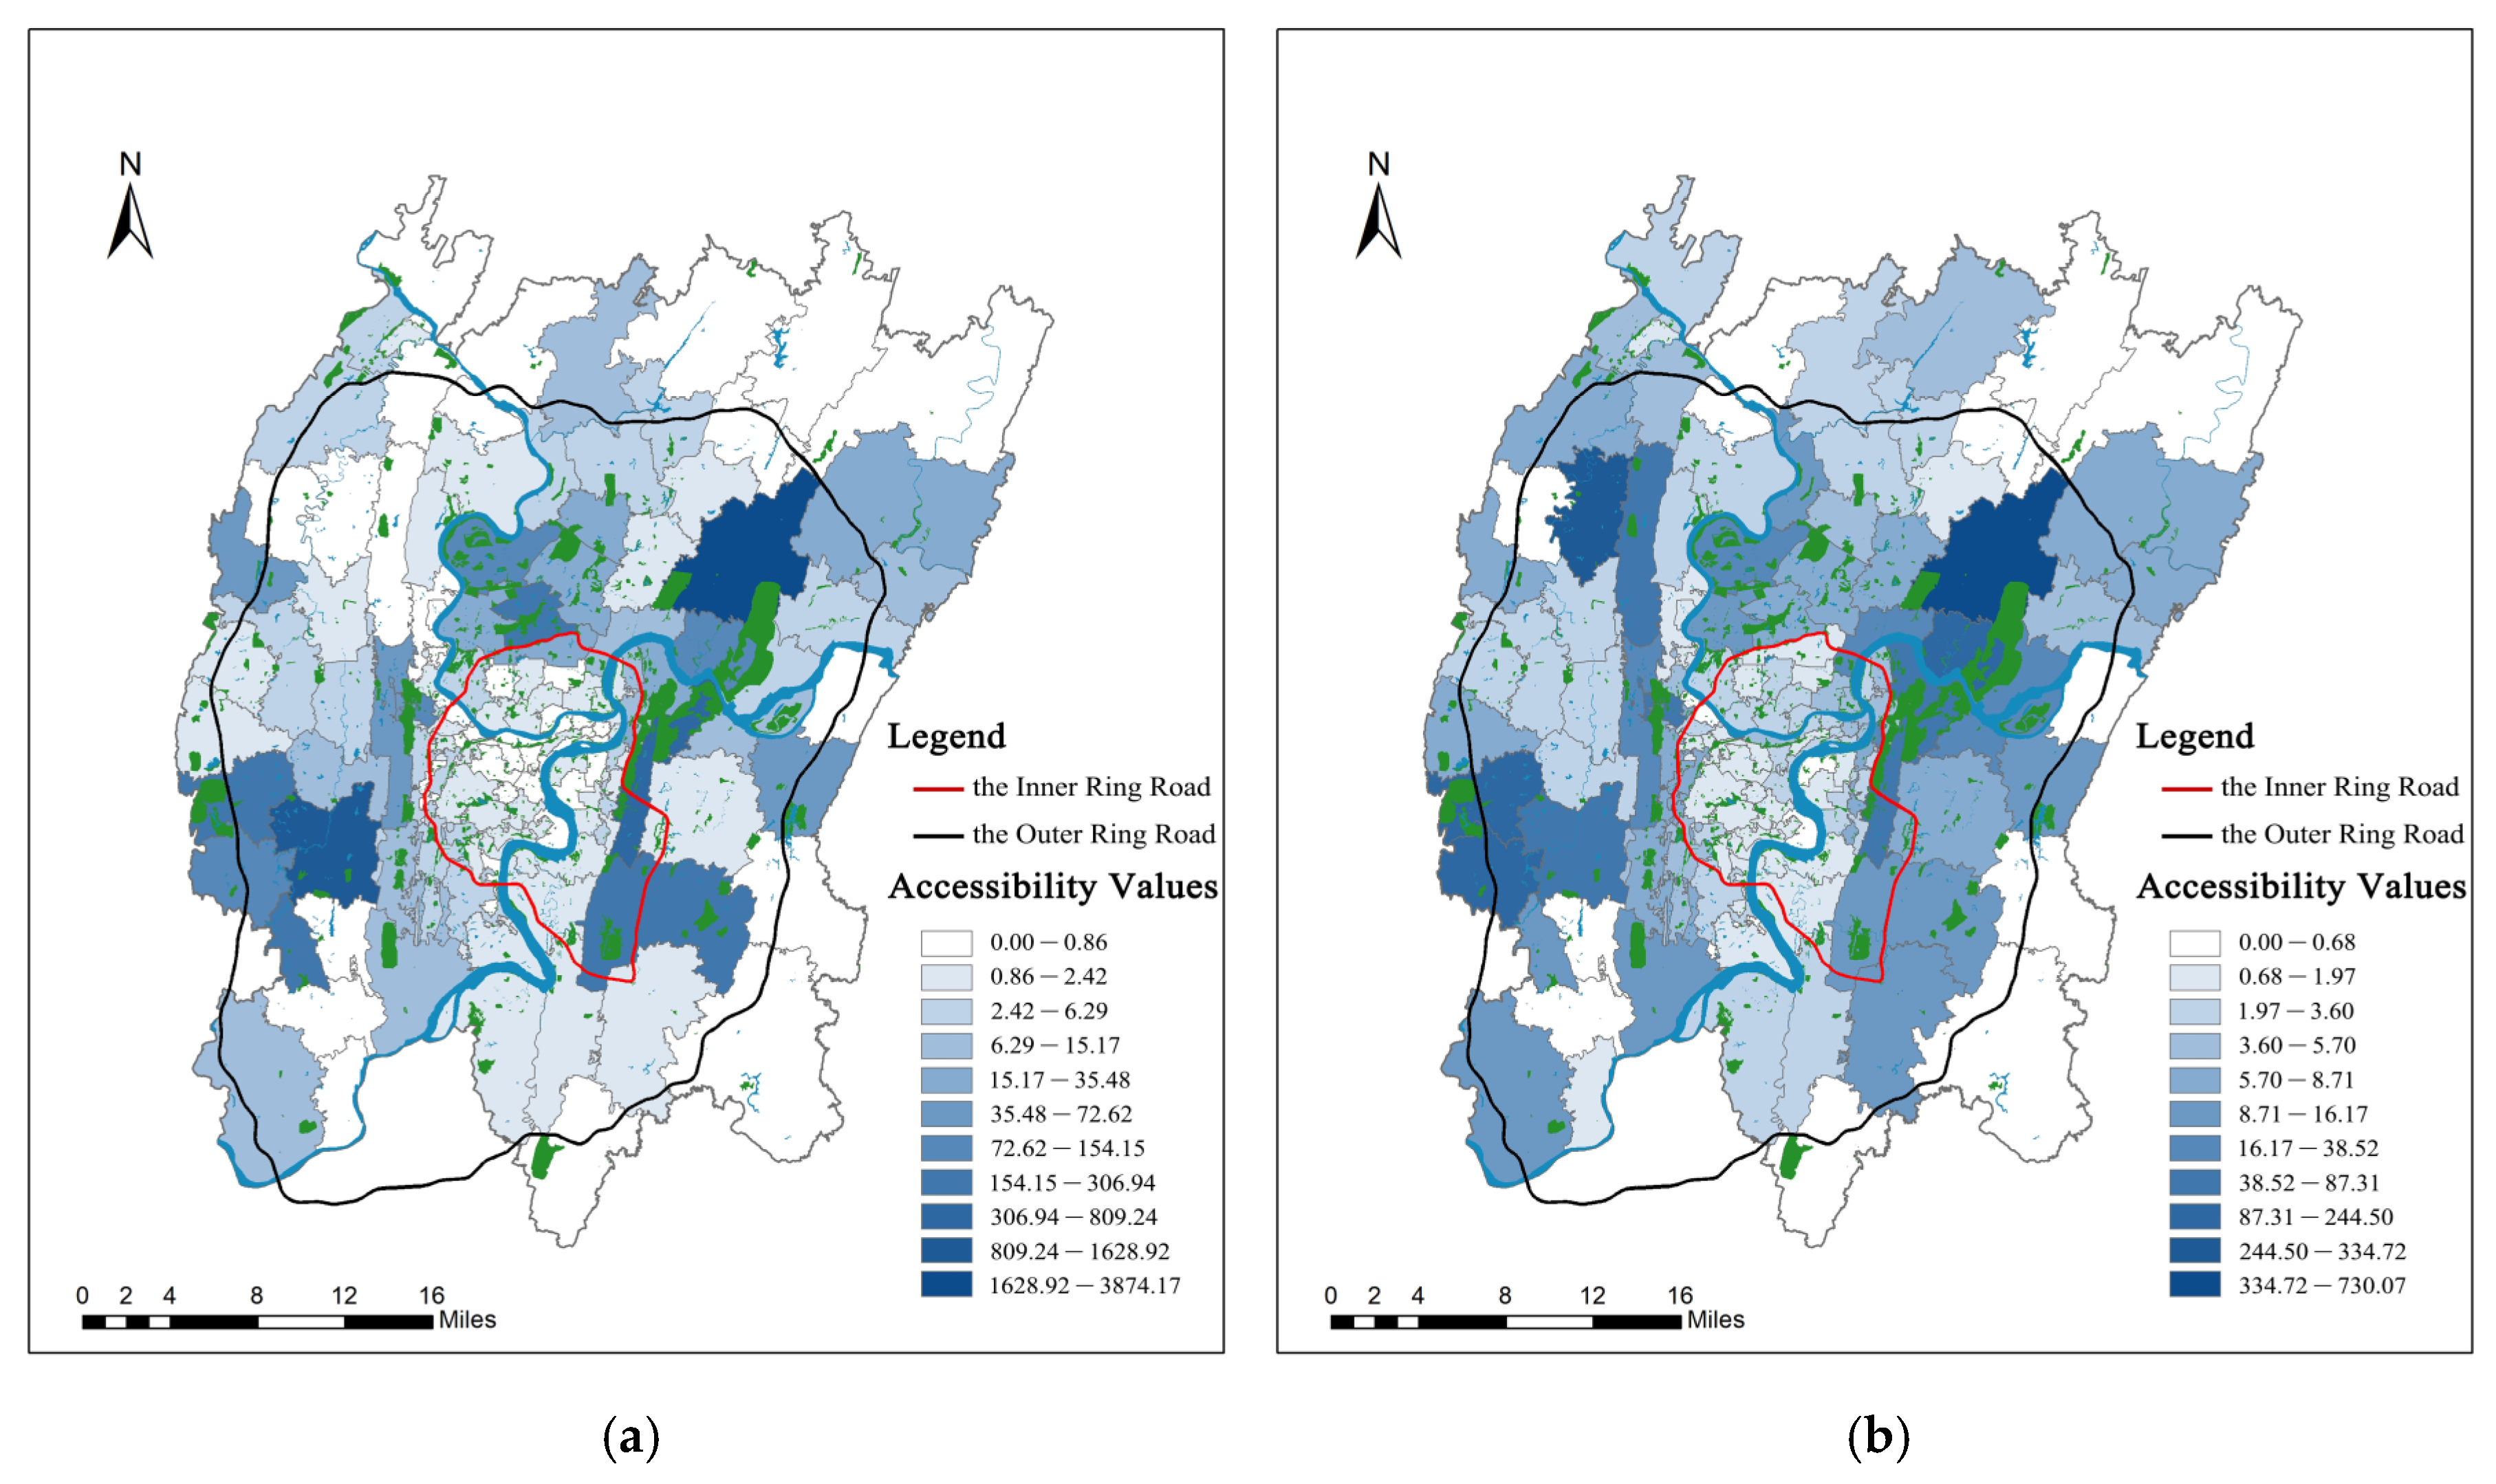
3.1.1. Accessibility Evaluation Based on Supply

The spatial distribution of the accessibility of UGSs is shown in Figure 2, and the coverage of the accessibility of UGSs is illustrated in Table 1, according to the different modes of transportation. Areas not covered by the accessibility range within a certain threshold time are identified as explicit blind spots, meaning ‘no supply’ zones. The findings indicate that there is a decline in the accessibility of UGSs as one moves from the core area towards the urban marginal area. The coverage of accessibility <15 min within the core area is 69.86%; the same coverages in the suburbs and urban marginal area are 12.17% and 2.68%, respectively. As shown in Table 2, a 14.97% coverage requires more than 30 min to reach a UGS within the inner ring road. These uncovered areas are mainly situated southeast, possibly due to the hindrance posed by the Tongluo Mountain Range that traverses this area. Meanwhile, a 30 min walking range covers 29.09% of the area in the suburbs. Although the built-up area of Chongqing is dominated by good accessibility under the driving mode, 28.81% of the area requires 30 min at least to arrive at a UGS, mainly located in areas outside the outer ring road. Under 30 min of walking and driving, the explicit blind spots accounted for 93.06% and 73.90% of the urban marginal area, respectively.

3.1.2. Accessibility Evaluation Based on Supply–Demand

The evaluation of accessibility on the basis of supply indicates that the core area exhibits the highest accessibility within a 15 min threshold for various travel modes, encompassing the largest coverage of access to UGSs. However, considering its population density, the core area does not present a significant advantage. The heterogeneity in accessibility observed from these two perspectives may be attributed to the high population density in the core area, leading to a situation where the residents’ demand for UGSs exceeds the available supply. Figure 3 depicts the spatial distribution of UGS accessibility for pedestrians and drivers obtained using the Gaussian-based 2SFCA method within a 30 min threshold. At the regional scale, subdistricts with good accessibility decline from the suburbs towards the core area, while subdistricts with poor accessibility are predominantly located in the urban marginal area. Analysing at the subdistrict scale, we found that 16 subdistricts (12.5% of all subdistricts) fail to access UGSs within the threshold time when using the walking mode, mainly in the urban marginal area. Additionally, 67 subdistricts exhibit accessibility scores below 2.42, primarily in the core area. In the driving mode, 11 subdistricts (8.59% of all study subdistricts) have no access to UGSs, and these subdistricts are distributed in the urban marginal area. Comparatively, the accessibility of the core area improves in the driving mode but remains dominated by subdistricts with scores below 2. Overall, the explicitly blind spots with zero accessibility are primarily concentrated in the urban marginal area, where the distribution of UGSs is virtually non-existent.

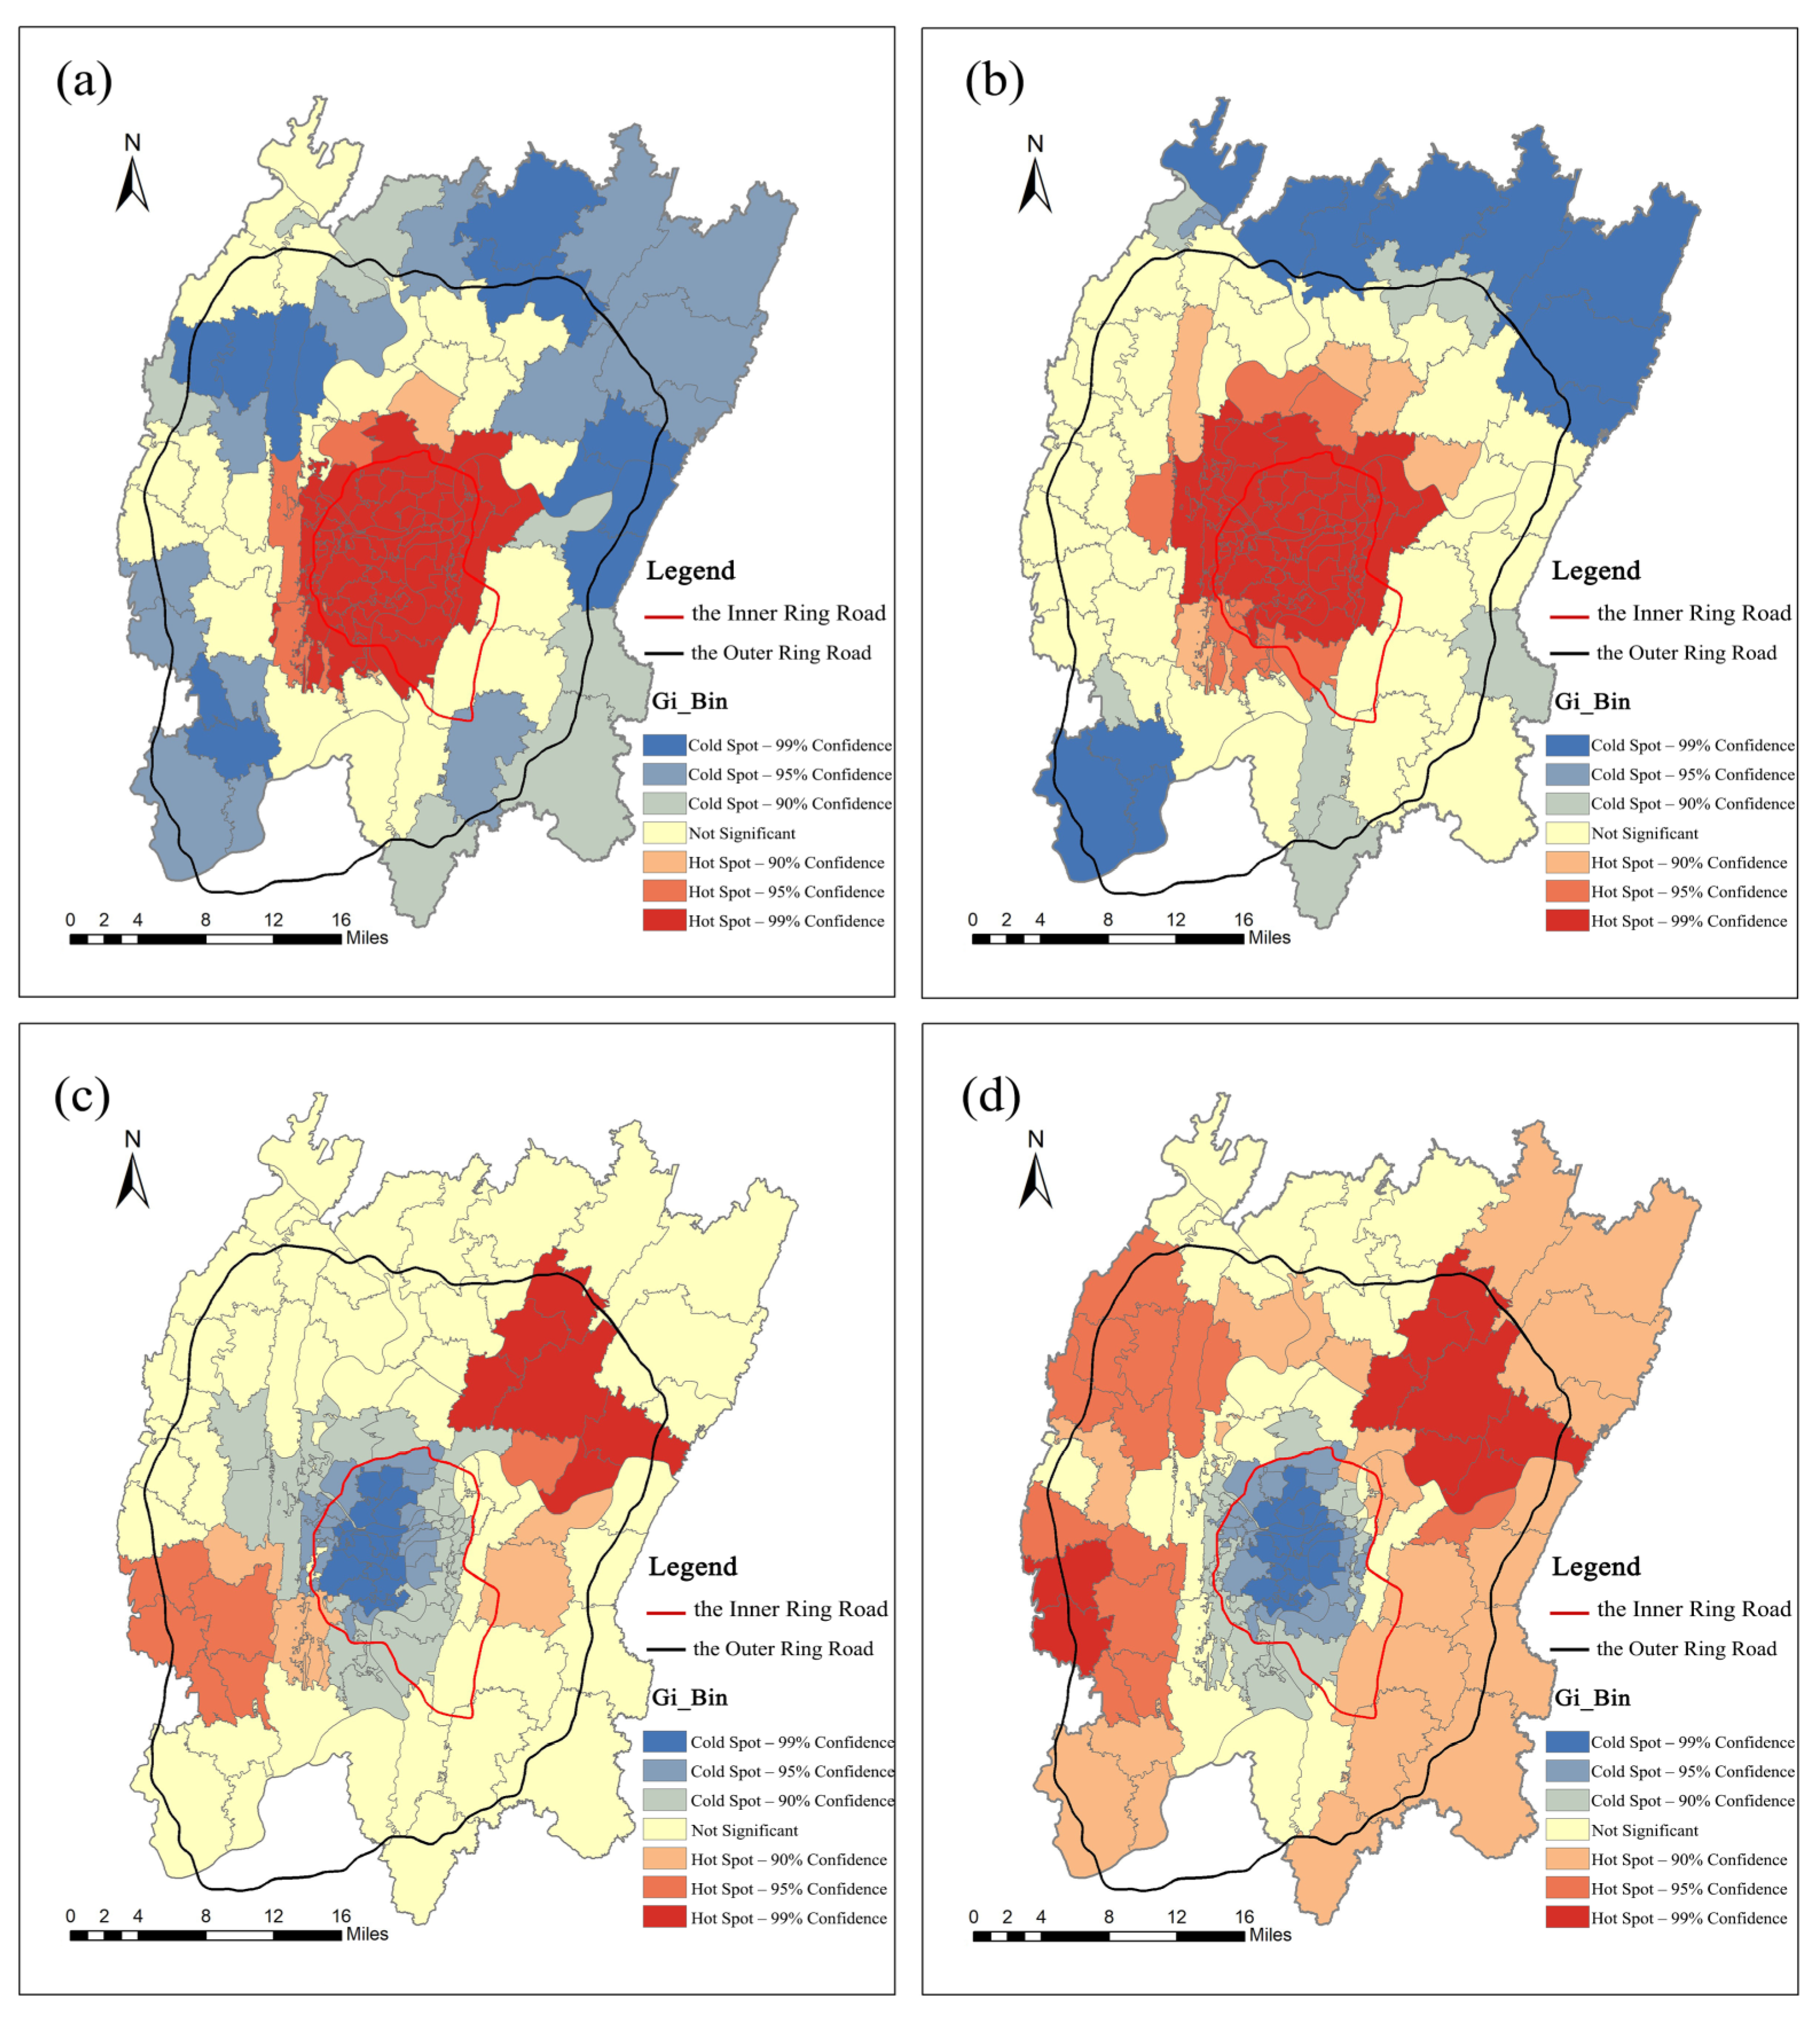
3.2. Spatial Layout of Urban Green Space Accessibility

On the basis of the 30 min walking and driving modes, the accessibility of UGSs exhibits an unclear agglomeration centre, as depicted in Figure 2 and Figure 3. In order to enhance our comprehension of the spatial layout of accessibility at the subdistrict level, we utilised the hot spot analysis tool referred to as Getis-Ord Gi*. A hot spot is defined as a spatial unit characterised by a high value and surrounded by other spatial units with similarly high values. Conversely, a cold spot represents a spatial unit that features a lower value and neighbouring units that also possess low values. In our analysis, we found a distinct spatial mismatch between the two accessibility aggregation patterns. Figure 4a,b illustrate that the urban marginal area primarily comprises cold spot aggregation areas, while the core area exhibits accessible hot spot aggregations from the supply perspective. Notably, for the accessibility evaluation based on supply and demand, the cold spot aggregation area is primarily concentrated in the core area.

3.3. Spatial Correlation between Urban Green Space Accessibility and Related Variables

The findings of the hotspot analysis reveal a spatial mismatch in the accessibility of UGSs as determined by using two distinct methods, with each based on different perspectives. To further investigate the potential influencing factors contributing to variations in accessibility, we examined the physical geographic elements and the socioeconomic factors. As depicted in Figure 5a, the percentage of the population that is aged 65 and older rises from the core area outwards. Figure 5b,d show a similar trend in the way they are distributed, and we find that the core area presents high road density and population density. Moreover, the core area demonstrates a relatively flatter elevation than the surrounding areas. Additionally, the core area has become an implicit blind spot for accessibility partly because of the excessive population density surpassing the capacity of UGSs. Consequently, a significant number of residents lack effective access to UGSs. Figure 5g illustrates the results obtained by normalising and combining these factors, with lower values in the core area compared to other areas.
This study employs a multiple regression model to explore UGS accessibility and the correlations between various physical geographic elements and socioeconomic factors from diverse viewpoints. According to the OLS analysis, the variance inflation factor was below 2, indicating that the explanatory variables were free of multicollinearity issues. However, the significant Moran’s I values obtained from both the network analysis and Gaussian-based 2SFCA methods for the OLS models (Moran’s I = 0.090, z score = 2.091, p < 0.05; Moran’s I = 0.484, z score = 10.509, p < 0.01) suggest spatial autocorrelation within the residuals.
Given this spatial autocorrelation, further analyses were conducted using spatial regressions to examine the correlation between UGS accessibility and the selected independent variables using both methods independently. The spatial autoregressive lag model (SARlag) was chosen for this study based on the Lagrange multiplier test, which demonstrated its superiority to the spatial error regression model. Furthermore, the SARlag model outperformed the OLS model, demonstrated by the elevated R2 and log likelihood values, decreased AIC values and significant spatial lag coefficients (rho), indicating a strong spatial dependence on UGS accessibility. The relationships between UGS accessibility and the index of physical geographic and socioeconomic factors under the two methods showed that the SARlag regression explains about 83.40% and 50.40% of the variations in the changes in UGS accessibility in the 122 subdistricts, respectively.
The regression results (Table 2) show apparent disparities in green space access. For both the OLS and SARlag models, the network analysis method revealed a positive and statistically significant effect of income on UGS accessibility. Notably, a discernible inverse correlation was observed between the proportion of elderly residents and UGS accessibility. Adding a one unit increase in the natural logarithm of the elderly corresponds to an average of 22.0% and 24.3% decrease in the logarithm of accessibility of UGSs under both models. It may be due to the unique features of the mountainous city that the travel behaviours of the elderly are not fully considered in the urban green space planning process, resulting in inequitable urban green space planning for the elderly. The steepness of the mountain cities exacerbates this inequity. However, no correlation existed between elevation and the accessibility of UGSs from a supply-only aspect.
Alternatively, the Gaussian-based 2SFCA method revealed that higher-income residents had substantially greater access to UGSs (p < 0.01), suggesting an income-driven accessibility disparity, which is similar to the results of the network analysis method. Additionally, elevation, a distinguishing geographic factor between mountainous and plain cities, exerted a positive influence on UGS accessibility from a supply and demand perspective. However, contrary to the hypothesis that a higher road network density would enhance accessibility, our findings indicate a negative correlation between these two variables. This unexpected result can be attributed to the overdeveloped street network that imposed restrictions on urban land use and thereby reduced the available UGSs.

4. Discussion

An escalating conflict between supply and demand has arisen in the urban environment due to the increasing constraints and expanding population. Despite studies that have examined the supply and demand of UGS in developed and developing countries [52] and recognised that the inequity of UGS is mainly reflected in the supply and people’s demand for UGS, there is a dearth of knowledge that exists regarding the equitable distribution of resources for UGSs among all city residents [19,52]. The contributions of this paper are mainly reflected in the following aspects: Firstly, based on the existing studies, a more sophisticated analytical framework is proposed to analyse the supply and demand of the urban master plan, which integrates the network analysis method, attenuation coefficients, Gaussian functions and travel modes to provide a more realistic evaluation. Meanwhile, the study further enhances the assessment by considering accessibility under both modes. This contribution offers methodological support and a theoretical reference for the evaluation of UGS accessibility in other cities. Secondly, we utilised multidimensional evaluation indicators to identify the heterogeneity in UGS accessibility according to different physical geographical elements and socioeconomic factors, with particular attention to vulnerable populations. Assessment results provide policymakers and planners with decision-making information conducive to achieving equity in the distribution of UGSs.
The marginal area of Chongqing’s built-up region has the weakest allocation of UGS resources and suffers from significant service deficits. During the examination of spatial distribution, we noted marked polarisation in the UGS accessibility of supply within a 30 min threshold time across different modes of transportation. High accessibility areas are predominantly distributed in the core area, while explicit blind spots persist in the urban marginal area. This is similar to the findings of previous studies [52,53]. Viewing this through a supply–demand lens, subdistricts lacking accessibility are also primarily situated in the urban fringe, validating the efficacy of the network analysis method in identifying explicit blind spots. For these explicit blind spots devoid of supply, especially the urban marginal areas with inferior UGS resources, future successful green space planning can be realised through spatial excavation by reserving space for greening, effectively allocating UGS and anticipating futural demand.
Assessing the spatial layout, the results underscore the spatial incongruity in the accessibility of two distinct categories of UGSs, with a distinct supply–demand imbalance in the core area. Despite the strengths of the core UGS catchment area, there is a deficiency in meeting all of the residents’ daily needs, thus manifesting as an implicit accessibility blind spot. This shortfall is likely attributable to the high population density in the core area that constantly intensifies the pressure on the allocation of UGS and the intensive land development encroaching on the available UGSs. Concurrently, an overly dense road network further restricts and fragments the distribution of UGSs, which discourages the development of UGSs and ultimately hinders efficient resource allocation. Therefore, the mismatch between the supply and demand of UGS needs to be emphasised in the urban greening process. Currently, it may be difficult to build large UGSs due to the fixed and compact land use patterns and land demand restrictions [54,55]. Considering these factors, other greening strategies such as vertical greening and informal green spaces could be implemented in the future to strengthen linkages between nearby green spaces and create more daily recreational opportunities for residents to boost their sense of belonging to a city [56]. Furthermore, the potential for UGS development in the suburbs can be utilised. Population redistribution is facilitated by emphasising the suburbs in order to alleviate land development pressures in the core area. This strategy could enhance the spatial patterns of UGS accessibility in Chongqing and reduce both explicit and implicit blind spots.
According to the findings of the spatial correlation analysis, there is some heterogeneity in the relationship between UGS accessibility and altitude under different methods. Therefore, an effective analysis of the elevation is necessary in order to effectively safeguard access to sufficient green space. Elevation, a crucial physical geographic element that distinguishes mountainous from plain cities, can serve as a foundational parameter for future research on cities in mountainous regions. Chongqing, a city typified by its mountainous and riverine landscape, faces stringent constraints on urban construction land due to its varied topography, including numerous mountains and valleys. Therefore, planning in this city should prominently feature its unique topographical elements. Specifically, in the suburbs—the transition zones between core and marginal regions—where both UGS resources and population density are moderate, planning should accentuate the cities’ mountains and rivers. The steep topography of these areas engenders a three-dimensional, high–low fragmented distribution of UGSs, thereby enhancing their service efficiency. Consequently, future urban development should prioritise three-dimensional space development and maximise green spaces amid densification [57].
The high-density road network fails to consistently have a positive influence on accessibility. On the one hand, as a link between UGSs and residents, transportation networks can affect the efficiency of UGSs in providing services to residents. A properly planned road network system can benefit residents in terms of accessibility of UGSs. On the other hand, an increase in road density fails to consistently improve the accessibility of UGS, and an overdeveloped street network instead restricts land use [5,54], thus reducing the amount of available UGS. At the same time, the economic value of land further increases the pressure on UGS. For example, landowners make more profit from urban commercial, industrial and residential land development than from green infrastructure land. To solve the mentioned problems, landscape planners can increase or improve the existing street green space and pocket parks based on rational design and utilisation of road networks or also design UGSs in some redevelopment projects, such as urban village reform, and rebuild abandoned factories to form high-quality living communities using UGS planning and landscape design as well as to strengthen connections with nearby UGS.
Indeed, the widely available housing sales data in China can serve as a valid indicator for different social groups when studying a city because they can reflect many other socioeconomic conditions, such as income levels [45]. Discrepancies in UGS accessibility have been observed pertaining to specific neighbourhood socioeconomic characteristics [58]. Subdistricts with higher social status are favoured in terms of UGS provision, which is in line with previous research. To be specific, our study clearly demonstrates that UGS accessibility is better in areas where high-income populations are located. We argue that higher-income groups are more capable of choosing resource-rich, high-quality living environments, thus suggesting that economically vulnerable families are being deprived of access to UGSs, exposing social inequities. In addition, this study reveals low UGS accessibility in subdistricts with a high level of population aging. The problems of population ageing will exist for some time in China, which may significantly increase the demand for social infrastructure, including the demand for UGS service resources. In this context, inadequate access to UGSs for the elderly may raise issues of environmental injustices that require pre-awareness and effective countermeasures. Therefore, planning and constructing UGSs solely on the basis of supply or demand optimisation, assuming a homogenous population, fails to provide a comprehensive solution. Considering the accessibility of various social groups is an indispensable aspect of green planning [59]. Therefore, residents of disadvantaged communities should be prioritised for UGS additions, optimising the spatial pattern of accessibility to ensure equity [60,61].
Findings from this study have important policy implications and can provide methodological references and theoretical support for planners and policymakers. Chongqing has prioritised a greening strategy where all residents live within a 15 min walk from the nearest UGS. The Liangjiang New Area and the Jiulongpo District are national pilot districts for the ‘quarter-hour convenient living circle’. The Jiulongpo District encompasses 18 subdistricts, while the Liangjiang New District spans parts of the Jiangbei, Yubei and Beibei Districts in Chongqing, covering a total of 36 subdistricts. This approach aims to provide residents with UGS services within a 15 min walking radius. However, our study identified a gap, with only 69.68% accessibility coverage within a 15 min walking radius in the core area that has the highest population density. Therefore, striving for complete UGS service coverage should be considered a key priority in UGS planning. Simply increasing the size and improving the functions of UGSs may lead to further spatial inequality. It is crucial to comprehensively consider the nature of the land, the amount and type of UGS, the quality of UGS and the level of supply and demand.

5. Conclusions

Taking the buildup area of Chongqing as an example, this study enhanced the evaluation of UGS accessibility from multiple viewpoints. Regarding spatial distribution, we identified explicit blind spots in the threshold time from a supply perspective, especially in urban marginal areas. These marginal areas were also found to be disadvantaged when assessed from the supply–demand perspective. A comparison of the spatial layouts of the two types of accessibility reveals that although the core area has a generous supply of UGSs, it cannot meet the needs of all residents, rendering it an implicit blind spot in UGS accessibility. However, the suburbs exhibit potential for UGS development. The future expansion and development of UGSs in the suburbs can not only extend their service areas to the periphery but also partially alleviate the land and population pressure in the core area. Moreover, our analysis revealed that there is some heterogeneity in the relationship between accessibility and both elevation and road network density, suggesting that elevation and road network density should be considered critical factors in future studies on mountainous cities. Lastly, we observed that vulnerable groups, such as people aged 65 and over and low-income populations, experience disadvantages in accessing UGSs. Insights into the spatial distribution and demand preferences of these groups will undoubtedly aid in promoting future urban social equity.
In summary, our study suggests that an effective UGS planning policy should emphasise three key aspects: (i) implementing targeted measures to mitigate explicit and implicit blind spots from diverse supply and demand perspectives, (ii) paying attention to the unique physical geography of mountainous cities and considering the development of three-dimensional spaces and (iii) enhancing awareness of vulnerable groups and mitigating social inequality.

Author Contributions

Conceptualisation, Y.J. and J.H.; methodology, Y.J. and G.X.; software, Y.J.; validation, R.H., J.H. and D.L.; data curation, Y.J.; writing—original draft preparation, Y.J.; writing—review and editing, J.H. and R.H.; visualisation, Y.J. and G.X.; supervision, R.H.; project administration, R.H. and J.H.; funding acquisition, R.H. All authors have read and agreed to the published version of the manuscript.

Funding

This research was supported by the Hainan Provincial Natural Science Foundation of China (423MS020) and the China Scholarship Council (202207560001).

Data Availability Statement

The source of all the data used in this study is provided in the manuscript.

Conflicts of Interest

The authors declare no conflict of interest.

References

  1. Nasri Roodsari, E.; Hoseini, P. An assessment of the correlation between urban green space supply and socio-economic disparities of Tehran districts—Iran. Environ. Dev. Sustain. 2021, 24, 12867–12882. [Google Scholar] [CrossRef]
  2. Zhang, Y.; Zhang, T.; Zeng, Y.; Yu, C.; Zheng, S. The rising and heterogeneous demand for urban green space by Chinese urban residents: Evidence from Beijing. J. Clean. Prod. 2021, 313, 127781. [Google Scholar] [CrossRef]
  3. Chen, Y.; Yue, W.; La Rosa, D. Which communities have better accessibility to green space? An investigation into environmental inequality using big data. Landsc. Urban Plan. 2020, 204, 103919. [Google Scholar] [CrossRef]
  4. Ma, B.; Zhou, T.; Lei, S.; Wen, Y.; Htun, T.T. Effects of urban green spaces on residents’ well-being. Environ. Dev. Sustain. 2018, 21, 2793–2809. [Google Scholar] [CrossRef]
  5. Fang, X.; Li, J.; Ma, Q. Integrating green infrastructure, ecosystem services and nature-based solutions for urban sustainability: A comprehensive literature review. Sustain. Cities Soc. 2023, 98, 104843. [Google Scholar] [CrossRef]
  6. Lafortezza, R.; Sanesi, G. Nature-based solutions: Settling the issue of sustainable urbanization. Environ. Res. 2019, 172, 394–398. [Google Scholar] [CrossRef]
  7. Kroeger, T.; Escobedo, F.J.; Hernandez, J.L.; Varela, S.; Delphin, S.; Fisher, J.R.B.; Waldron, J. Reforestation as a novel abatement and compliance measure for ground-level ozone. Proc. Natl. Acad. Sci. USA 2014, 111, E4204–E4213. [Google Scholar] [CrossRef]
  8. Rahman, M.A.; Moser, A.; Rötzer, T.; Pauleit, S. Within canopy temperature differences and cooling ability of Tilia cordata trees grown in urban conditions. Build. Environ. 2017, 114, 118–128. [Google Scholar] [CrossRef]
  9. Zolch, T.; Henze, L.; Keilholz, P.; Pauleit, S. Regulating urban surface runoff through nature-based solutions—An assessment at the micro-scale. Environ. Res. 2017, 157, 135–144. [Google Scholar] [CrossRef]
  10. Dony, C.C.; Delmelle, E.M.; Delmelle, E.C. Re-conceptualizing accessibility to parks in multi-modal cities: A Variable-width Floating Catchment Area (VFCA) method. Landsc. Urban Plan. 2015, 143, 90–99. [Google Scholar] [CrossRef]
  11. Chen, Y.; Men, H.; Ke, X. Optimizing urban green space patterns to improve spatial equity using location-allocation model: A case study in Wuhan. Urban For. Urban Green. 2023, 84, 127922. [Google Scholar] [CrossRef]
  12. Haaland, C.; van den Bosch, C.K. Challenges and strategies for urban green-space planning in cities undergoing densification: A review. Urban For. Urban Green. 2015, 14, 760–771. [Google Scholar] [CrossRef]
  13. Krekel, C.; Kolbe, J.; Wüstemann, H. The greener, the happier? The effect of urban land use on residential well-being. Ecol. Econ. 2016, 121, 117–127. [Google Scholar] [CrossRef]
  14. Wüstemann, H.; Kalisch, D.; Kolbe, J. Access to urban green space and environmental inequalities in Germany. Landsc. Urban Plan. 2017, 164, 124–131. [Google Scholar] [CrossRef]
  15. Liu, B.; Tian, Y.; Guo, M.; Tran, D.; Alwah, A.A.Q.; Xu, D. Evaluating the disparity between supply and demand of park green space using a multi-dimensional spatial equity evaluation framework. Cities 2022, 121, 103484. [Google Scholar] [CrossRef]
  16. Nesbitt, L.; Meitner, M.J.; Girling, C.; Sheppard, S.R.J.; Lu, Y. Who has access to urban vegetation? A spatial analysis of distributional green equity in 10 US cities. Landsc. Urban Plan. 2019, 181, 51–79. [Google Scholar] [CrossRef]
  17. Labib, S.M.; Lindley, S.; Huck, J.J. Scale effects in remotely sensed greenspace metrics and how to mitigate them for environmental health exposure assessment. Comput. Environ. Urban Syst. 2020, 82, 101501. [Google Scholar] [CrossRef]
  18. Rigolon, A.; Browning, M.; Lee, K.; Shin, S. Access to Urban Green Space in Cities of the Global South: A Systematic Literature Review. Urban Sci. 2018, 2, 67. [Google Scholar] [CrossRef]
  19. Rigolon, A. A complex landscape of inequity in access to urban parks: A literature review. Landsc. Urban Plan. 2016, 153, 160–169. [Google Scholar] [CrossRef]
  20. Xu, M.; Xin, J.; Su, S.; Weng, M.; Cai, Z. Social inequalities of park accessibility in Shenzhen, China: The role of park quality, transport modes, and hierarchical socioeconomic characteristics. J. Transp. Geogr. 2017, 62, 38–50. [Google Scholar] [CrossRef]
  21. Saghapour, T.; Moridpour, S.; Thompson, R.G. Public transport accessibility in metropolitan areas: A new approach incorporating population density. J. Transp. Geogr. 2016, 54, 273–285. [Google Scholar] [CrossRef]
  22. Sun, C.; Lin, T.; Zhao, Q.; Li, X.; Ye, H.; Zhang, G.; Liu, X.; Zhao, Y. Spatial pattern of urban green spaces in a long-term compact urbanization process—A case study in China. Ecol. Indic. 2019, 96, 111–119. [Google Scholar] [CrossRef]
  23. Ye, C.; Hu, L.; Li, M. Urban green space accessibility changes in a high-density city: A case study of Macau from 2010 to 2015. J. Transp. Geogr. 2018, 66, 106–115. [Google Scholar] [CrossRef]
  24. Luo, W.; Wang, F. Measures of Spatial Accessibility to Health Care in a GIS Environment: Synthesis and a Case Study in the Chicago Region. Environ. Plan. B Plan. Des. 2003, 30, 865–884. [Google Scholar] [CrossRef] [PubMed]
  25. Luo, W.; Qi, Y. An enhanced two-step floating catchment area (E2SFCA) method for measuring spatial accessibility to primary care physicians. Health Place 2009, 15, 1100–1107. [Google Scholar] [CrossRef] [PubMed]
  26. Dai, D. Black residential segregation, disparities in spatial access to health care facilities, and late-stage breast cancer diagnosis in metropolitan Detroit. Health Place 2010, 16, 1038–1052. [Google Scholar] [CrossRef]
  27. Audretsch, B.D.; Belitski, M. The limits to open innovation and its impact on innovation performance. Technovation 2023, 119, 102519. [Google Scholar] [CrossRef]
  28. Xu, C.; Haase, D.; Pribadi, D.O.; Pauleit, S. Spatial variation of green space equity and its relation with urban dynamics: A case study in the region of Munich. Ecol. Indic. 2018, 93, 512–523. [Google Scholar] [CrossRef]
  29. De Haas, W.; Hassink, J.; Stuiver, M. The Role of Urban Green Space in Promoting Inclusion: Experiences From the Netherlands. Front. Environ. Sci. 2021, 9, 618198. [Google Scholar] [CrossRef]
  30. Jennings, V.; Bamkole, O. The Relationship between Social Cohesion and Urban Green Space: An Avenue for Health Promotion. Int. J. Environ. Res. Public Health 2019, 16, 452. [Google Scholar] [CrossRef]
  31. Kimpton, A. A spatial analytic approach for classifying greenspace and comparing greenspace social equity. Appl. Geogr. 2017, 82, 129–142. [Google Scholar] [CrossRef]
  32. Comber, A.; Brunsdon, C.; Green, E. Using a GIS-based network analysis to determine urban green space accessibility for different ethnic and religious groups. Landsc. Urban Plan. 2008, 86, 103–144. [Google Scholar] [CrossRef]
  33. Anderson, V.; Gough, W.A.; Agic, B. Nature-Based Equity: An Assessment of the Public Health Impacts of Green Infrastructure in Ontario Canada. Int. J. Environ. Res. Public Health 2021, 18, 5763. [Google Scholar] [CrossRef]
  34. Diao, Y.; Hu, W.; He, B.J. Analysis of the Impact of Park Scale on Urban Park Equity Based on 21 Incremental Scenarios in the Urban Core Area of Chongqing, China. Adv. Sustain. Syst. 2021, 5, 2100171. [Google Scholar] [CrossRef]
  35. Yu, Y.; Zhou, L.; Zhou, W.; Ren, H.; Kharrazi, A.; Ma, T.; Zhu, B. Decoupling environmental pressure from economic growth on city level: The Case Study of Chongqing in China. Ecol. Indic. 2017, 75, 27–35. [Google Scholar] [CrossRef]
  36. Shi, Y.; Feng, C.C.; Yu, Q.; Guo, L. Integrating supply and demand factors for estimating ecosystem services scarcity value and its response to urbanization in typical mountainous and hilly regions of south China. Sci. Total Environ. 2021, 796, 149032. [Google Scholar] [CrossRef]
  37. Locatelli, B.; Lavorel, S.; Sloan, S.; Tappeiner, U.; Geneletti, D. Characteristic trajectories of ecosystem services in mountains. Front. Ecol. Environ. 2017, 15, 150–159. [Google Scholar] [CrossRef]
  38. Sil, Â.; Rodrigues, A.P.; Carvalho-Santos, C.; Nunes, J.P.; Honrado, J.; Alonso, J.; Marta-Pedroso, C.; Azevedo, J.C. Trade-offs and Synergies Between Provisioning and Regulating Ecosystem Services in a Mountain Area in Portugal Affected by Landscape Change. Mt. Res. Dev. 2016, 36, 452–464. [Google Scholar] [CrossRef]
  39. Mohajeri, N.; Gudmundsson, A. Street networks in relation to landforms: Implications for fast-growing cities. J. Geogr. Sci. 2014, 24, 363–381. [Google Scholar] [CrossRef]
  40. Anguelovski, I.; Connolly, J.J.T.; Masip, L.; Pearsall, H. Assessing green gentrification in historically disenfranchised neighborhoods: A longitudinal and spatial analysis of Barcelona. Urban Geogr. 2017, 39, 458–491. [Google Scholar] [CrossRef]
  41. Miralles-Guasch, C.; Dopico, J.; Delclos-Alio, X.; Knobel, P.; Marquet, O.; Maneja-Zaragoza, R.; Schipperijn, J.; Vich, G. Natural Landscape, Infrastructure, and Health: The Physical Activity Implications of Urban Green Space Composition among the Elderly. Int. J. Environ. Res. Public Health 2019, 16, 3986. [Google Scholar] [CrossRef] [PubMed]
  42. Davis, A.Y.; Belaire, J.A.; Farfan, M.A.; Milz, D.; Sweeney, E.R.; Loss, S.R.; Minor, E.S. Green infrastructure and bird diversity across an urban socioeconomic gradient. Ecosphere 2012, 3, 1–18. [Google Scholar] [CrossRef]
  43. Dai, D. Racial/ethnic and socioeconomic disparities in urban green space accessibility: Where to intervene? Landsc. Urban Plan. 2011, 102, 234–244. [Google Scholar] [CrossRef]
  44. Wright Wendel, H.E.; Zarger, R.K.; Mihelcic, J.R. Accessibility and usability: Green space preferences, perceptions, and barriers in a rapidly urbanizing city in Latin America. Landsc. Urban Plan. 2012, 107, 272–282. [Google Scholar] [CrossRef]
  45. Chen, S.; Zhang, L.; Huang, Y.; Wilson, B.; Mosey, G.; Deal, B. Spatial impacts of multimodal accessibility to green spaces on housing price in Cook County, Illinois. Urban For. Urban Green. 2022, 67, 127370. [Google Scholar] [CrossRef]
  46. Tran, D.X.; Pla, F.; Latorre-Carmona, P.; Myint, S.W.; Caetano, M.; Kieu, H.V. Characterizing the relationship between land use land cover change and land surface temperature. ISPRS J. Photogramm. Remote Sens. 2017, 124, 119–132. [Google Scholar] [CrossRef]
  47. Jalal, H.; Buchanich, J.M.; Roberts, M.S.; Balmert, L.C.; Zhang, K.; Burke, D.S. Changing dynamics of the drug overdose epidemic in the United States from 1979 through 2016. Science 2018, 361, eaau1184. [Google Scholar] [CrossRef]
  48. ESRI. How Hot Spot Analysis (Getis-Ord Gi*) Works? 2016. Available online: http://proarcgis.com/en/pro-app/tool-reference/spatial-statistics/h-how-hot-spot-analysis-getis-ord-gi-spatial-stati.htm (accessed on 16 February 2016).
  49. Krajter Ostoić, S.; Konijnendijk van den Bosch, C.C.; Vuletić, D.; Stevanov, M.; Živojinović, I.; Mutabdžija-Bećirović, S.; Lazarević, J.; Stojanova, B.; Blagojević, D.; Stojanovska, M.; et al. Citizens’ perception of and satisfaction with urban forests and green space: Results from selected Southeast European cities. Urban For. Urban Green. 2017, 23, 93–103. [Google Scholar] [CrossRef]
  50. Sharifi, F.; Nygaard, A.; Stone, W.M. Heterogeneity in the subjective well-being impact of access to urban green space. Sustain. Cities Soc. 2021, 74, 103244. [Google Scholar] [CrossRef]
  51. Guo, A.; Yang, J.; Xiao, X.; Xia, J.; Jin, C.; Li, X. Influences of urban spatial form on urban heat island effects at the community level in China. Sustain. Cities Soc. 2020, 53, 101972. [Google Scholar] [CrossRef]
  52. Fan, P.; Xu, L.; Yue, W.; Chen, J. Accessibility of public urban green space in an urban periphery: The case of Shanghai. Landsc. Urban Plan. 2017, 165, 177–192. [Google Scholar] [CrossRef]
  53. Gu, X.; Tao, S.; Dai, B. Spatial accessibility of country parks in Shanghai, China. Urban For. Urban Green. 2017, 27, 373–382. [Google Scholar] [CrossRef]
  54. Shen, Y.; Sun, F.; Che, Y. Public green spaces and human wellbeing: Mapping the spatial inequity and mismatching status of public green space in the Central City of Shanghai. Urban For. Urban Green. 2017, 27, 59–68. [Google Scholar] [CrossRef]
  55. Chen, W.Y.; Hu, F.Z.Y. Producing nature for public: Land-based urbanization and provision of public green spaces in China. Appl. Geogr. 2015, 58, 32–40. [Google Scholar] [CrossRef]
  56. Federica Gaglione, C.G.; Zucarob, F.; Cottrilla, C. Urban accessibility in a 15-minute city: A measure in the city of Naples, Italy. Transp. Res. Procedia 2022, 60, 378–385. [Google Scholar] [CrossRef]
  57. Tan, P.Y.; Wang, J.; Sia, A. Perspectives on five decades of the urban greening of Singapore. Cities 2013, 32, 24–32. [Google Scholar] [CrossRef]
  58. Li, H.; Liu, Y. Neighborhood socioeconomic disadvantage and urban public green spaces availability: A localized modeling approach to inform land use policy. Land Use Policy 2016, 57, 470–478. [Google Scholar] [CrossRef]
  59. La Rosa, D.; Takatori, C.; Shimizu, H.; Privitera, R. A planning framework to evaluate demands and preferences by different social groups for accessibility to urban greenspaces. Sustain. Cities Soc. 2018, 36, 346–362. [Google Scholar] [CrossRef]
  60. Gupta, K.; Roy, A.; Luthra, K.; Maithani, S.; Mahavir, S. GIS based analysis for assessing the accessibility at hierarchical levels of urban green spaces. Urban For. Urban Green. 2016, 18, 198–211. [Google Scholar] [CrossRef]
  61. Wu, J.; He, Q.; Chen, Y.; Lin, J.; Wang, S. Dismantling the fence for social justice? Evidence based on the inequity of urban green space accessibility in the central urban area of Beijing. Environ. Plan. B Urban Anal. City Sci. 2018, 47, 626–644. [Google Scholar] [CrossRef]
Figure 1. Location of the study area (Chongqing, China).
Land 12 01793 g001
Figure 2. Spatial distribution of service area to urban green spaces under walking and driving modes. (a) Walking mode; (b) Driving mode.
Land 12 01793 g002
Figure 3. Spatial distribution of accessibility of urban green spaces under the Gaussian-based 2SFCA method. (a) Walking mode; (b) Driving mode.
Land 12 01793 g003
Figure 4. Gi* cluster map for the hot spot analysis of urban green space accessibility under walking and driving modes. (a) Accessibility of walking mode under the network analysis method; (b) Accessibility of driving mode under the network analysis method; (c) Accessibility of walking mode under the Gaussian-based 2SFCA method; (d) Accessibility of driving mode under the Gaussian-based 2SFCA method.
Land 12 01793 g004
Figure 5. Spatial distribution of physical geographical elements and socioeconomic factors. (a) Proportion of the elderly; (b) density of population; (c) residents’ income; (d) density of road network; (e) proportion of urban green space; (f) elevation; (g) standardised consolidated values.
Land 12 01793 g005
Table 1. Coverage of accessibility of urban green spaces.
Travel ModesTime Consumption (min)The Core AreaThe SuburbsThe Urban Marginal AreaTotal Coverage
Area (km2)(%)Area (km2)(%)Area (km2)(%)Area (km2)(%)
Walking≤549.1016.6046.922.575.010.49101.043.22
5–1097.3532.9282.904.5311.231.10191.486.10
10–1559.6120.1692.605.0711.101.09163.315.20
15–2019.366.5597.855.3513.071.29130.284.15
20–2514.855.0275.664.1411.091.09101.613.24
25–3011.193.78135.857.4320.031.97167.075.32
Driving≤5152.3151.50363.1419.8628.572.81544.0217.32
5–10114.6538.77600.6332.8646.394.56761.6324.25
10–1528.789.73382.8820.9439.943.93451.6114.38
15–2000155.298.4947.264.65202.556.45
20–2500144.127.8851.795.10195.916.24
25–300028.701.5751.385.0580.082.55
Table 2. Regression results of accessibility with physical geographic elements and socioeconomic factors.
VariablesMultiple RegressionSpatial Lag Regression
Accessibility Based on SupplyAccessibility Based on Supply–DemandAccessibility Based on SupplyAccessibility Based on Supply–Demand
Proportion of the elderly_ln−0.220 **0.173−0.243 **0.212
Income_ln0.049 **0.484 ***0.053 ***0.484 ***
Density of road network_ln0.825 ***−0.736 ***0.596 ***−0.623 **
Proportion of green area_ln0.094 ***0.200 ***0.071 ***0.191 ***
Elevation_ln−0.477 **2.357 ***−0.3732.231 ***
Constant−4.326 ***−22.353 ***−1.844−18.20 ***
Lagged Coeff (Rho)0.591 ***0.494 **
R square0.7970.4530.8340.504
AIC162.5644442.6414149.4884441.5876
BIC179.6766459.7536172.3047464.4039
*** p < 0.01 and ** p < 0.05 indicate significant differences at 1% and 5% test levels, respectively.
Disclaimer/Publisher’s Note: The statements, opinions and data contained in all publications are solely those of the individual author(s) and contributor(s) and not of MDPI and/or the editor(s). MDPI and/or the editor(s) disclaim responsibility for any injury to people or property resulting from any ideas, methods, instructions or products referred to in the content.

