Article

The Influence of Urban Form on Land Surface Temperature: A Comprehensive Investigation from 2D Urban Land Use and 3D Buildings

1
School of Resources and Environment, Henan Agricultural University, Zhengzhou 450046, China
2
Institute for Transport Studies, Leeds University, Leeds LS2 9JT, UK
3
Party Committee Student Work Department, Henan Agricultural University, Zhengzhou 450046, China
4
School of Humanities, Beijing University of Chinese Medicine, Beijing 100029, China
*
Authors to whom correspondence should be addressed.
Land 2023, 12(9), 1802; https://doi.org/10.3390/land12091802
Submission received: 22 July 2023 / Revised: 11 September 2023 / Accepted: 13 September 2023 / Published: 18 September 2023
(This article belongs to the Special Issue Celebrating the 130th Anniversary of Wuhan University on Land Science)

Abstract

:
Urban form plays a critical role in shaping the spatial differentiation of land surface temperature (LST). However, limited research has investigated the underlying driving forces and interactions of multidimensional urban form, specifically considering two-dimensional (2D) urban land use and three-dimensional (3D) buildings, on LST. Furthermore, their multi-scale outcomes remain unclear. Taking the main urban area of Wuhan City as an example, a total of nine indicators—the proportion of administration land (PA), the proportion of commercial land (PB), the proportion of industrial land (PM), the proportion of residential land (PR), the proportion of water area (PE), the building density (BD), the building height (BH), the floor area ratio (FAR), and the sky view factor (SVF)—were selected; this paper used the geographic detector model to investigate the driving force of LST spatial differentiation in winter and summer, as well as the interaction of various influencing factors from a multi-scale perspective. The results showed that (1) the average LST in industrial land was higher than that in commercial land, both in summer and winter. The LST in administration land was higher than that in residential land, while in winter, it is the opposite. (2) The spatial differentiation of summer LST was mainly dominated by 3D buildings, while the spatial differentiation of winter LST was mainly dominated by 2D land use. (3) BD was the leading driving force of LST spatial differentiation in summer, and the interaction between BD and any other indicator showed the most significant explanatory power, which is the same for PM in winter. (4) As scale increased, the explanatory power of 2D urban land use for LST spatial differentiation gradually increased both in winter and summer, while the explanatory power of PE on LST spatial differentiation decreased. The explanatory power of BD, FAR, and SVF on LST spatial differentiation remains basically unchanged. The explanatory power of BH on summer LST spatial differentiation decreases with increasing scale, while the explanatory power of BH on winter LST spatial differentiation remains in a stable state. (5) The interaction among all urban form factors primarily increases as the scale increases, except for the interaction between BH and 2D urban land use in summer, and the interaction between PE and PR in winter. The research can provide scientific decision-making support for the collaborative optimization of multiscale urban forms to improve the urban thermal environment.

1. Introduction

China’s urbanization rate reached 63.89% by the end of 2020 (National Bureau of Statistics of China, 2020), and dramatic urbanization has inevitably resulted in natural landscapes being replaced by artificial surfaces [1,2]. This change directly influences the land surface energy balance and urban microclimate, and hence induces higher temperatures in urban built-up areas than the surrounding non-urban areas, which is called the urban heat island (UHI) effect [3]. The aggravation and deterioration of the urban thermal environment pose a great threat to the improvement of urban residential quality [4,5], public health [6,7], and living safety [8,9]. Therefore, the improvement of the urban thermal environment has become an urgent issue to be addressed, and a clear understanding of the driving factors affecting land surface temperature (LST) is crucial for reducing their harmful effects and promoting sustainable urban development.
Currently, UHI effect studies mainly focus on the formation mechanisms [10], spatiotemporal variation [11], driving factors [12], effective simulation [13], thermal comfort [14], and mitigation measures [15]. There is a consensus that urban form is one of the dominant influencers on the UHI effect, particularly within intra-urban regions [16,17,18,19]. Urban form is a comprehensive concept that covers multiple aspects [20,21]. Normally, the measurement of dimensions and the corresponding selection of metrics are tailed according to the aims of a specific study. For example, a few studies have explored whether the monocentric or polycentric urban form can alleviate the UHI effect [22]. Liu et al. (2022) [23] measured urban form from three aspects—building group, road network, and population distribution—and analyzed its impact on UHI. Chen et al. (2023) [24] found that building morphology contributes most to LST, followed by landscape pattern and social development. Recently, a large number of scholars have studied the impact of urban forms on UHI from two-dimensional (2D) land horizontally and from three-dimensional (3D) buildings vertically [25,26,27]. The existing research on the relationship between urban form and the UHI effect provides a wealth of insights, but there are notable gaps and inconsistencies that warrant further exploration. Specifically, from a 2D perspective, a considerable number of current studies focus on land cover, such as vegetation and impervious surfaces [28,29,30,31,32], rather than land use, which is related to the function and management of land. On the one hand, land cover metrics, such as normalized difference index (e.g., NDVI, NDBI, NDWI, etc.) and landscape structure (e.g., percentage cover of landscape, largest patch index, mean patch shape index, mean patch size, etc.) [33], do not necessarily capture the complexities of human activities, zoning regulations, and urban planning strategies that are encompassed by land use. On the other hand, the prevalent use of these indices, while scientifically rigorous, can be less intuitive for urban planners and policymakers. The translation of these metrics into actionable urban planning strategies can be challenging. There is a pressing need to adopt land use metrics that bridge the gap between research and their practical implications in urban planning. From a 3D perspective, building density (BD), building height (BH), floor area ratio (FAR), and sky view factor (SVF) have been shown significant impact on LST [34,35,36]. However, some studies highlight the traditional urban form with lower BD and SVF exhibiting lower air temperature; others emphasize that the urban form of low BD and medium BH yielded significantly higher LST. Thus, while the current body of literature offers a foundational insight into the nexus between urban form and UHI, it still has gaps and inconsistencies. This highlights an evident need for a more comprehensive examination of the impact of urban form on LST, particularly when considering both 2D urban land use and 3D building dimensions.
Urban areas are dynamic entities that undergo significant changes across seasons. Vegetation cover, human activities, and energy consumption patterns, among other factors, vary from summer to winter. These seasonal shifts may influence how the urban form interacts with LST. Furthermore, urban processes and patterns can manifest differently at various scales; thus, the relationship between urban form and LST may be scale-dependent [24,28]. Understanding the seasonal and scale effects on the urban form–LST relationship has important implications for urban planning. For instance, urban interventions that work effectively in summer might not be as effective in winter. Similarly, strategies effective at a neighborhood scale might not necessarily translate to city-wide benefits. Urban planners and policymakers need this knowledge to craft interventions that are both effective and efficient across seasons and scales.
In terms of research methods, many prior studies have predominantly relied on correlation analysis [37,38] and regression analysis [39,40] to excavate the relationship between LST and its determinants. However, such approaches often oversimplify the interplay of factors, neglecting the fact that spatial differentiation of LST is an intricate outcome stemming from the synergistic effects of myriad determinants [41,42,43,44]. Thus, it becomes imperative to explore how the interaction of urban form affects LST, given the multifaceted nature of urban systems. Accordingly, as mentioned above, previous studies mostly focus on the relationship between land cover and LST [44,45,46,47,48], neglecting the impact of land use on the LST spatial differentiation in the main urban area. In addition, the synergetic effect of land use and building on LST remains unclear. Second, the spatial heterogeneity of LST is affected by 2D land use and 3D buildings with seasonal differences, which should be emphasized. Third, the geographical scale effect [49,50] is always neglected when exploring thermal environmental issues.
To address the aforementioned knowledge gaps, this study focuses on the main urban area of Wuhan. Utilizing Landsat-8 imagery to retrieve LST data for both summer and winter seasons, we delve into the effects of urban form on LST from a comprehensive perspective of 2D land use and 3D building. Subsequently, a geographic detector is employed to unravel the multi-scale drivers shaping the spatial differentiation patterns of LST. Accordingly, this study attempted to answer the following questions: (1) How do 2D urban land use and 3D building independently and jointly affect LST? (2) What are the differences in the impact of urban form on LST in summer and winter, separately? (3) How does the effect of urban form on LST vary with scale effect? (4) What are the implications for urban thermal environment management? Based on these core questions, the research significance is summarized as providing operational multi-scale thermal environment management measures for different seasons by regulating urban planning indicators of both 2D urban land use and 3D building in practice. The specific structure and arrangement of the article are as follows (Figure 1).

2. Materials and Methods

2.1. Study Area

The study area, Wuhan City, located at the confluence of the middle and lower reaches of the Yangtze and Han Rivers, is the commercial and administrative capital of Hubei Province, China (Figure 2). Wuhan has a tropical monsoon climate that is humid with plenty of rain and intense sunshine, and it is extremely muggy in summer. In this paper, we focused on the main urban area rather than the greater metropolitan area, and its total area is about 522.67 km². Figure 2c shows the urban land use distribution in the main urban area of Wuhan. Residential land is the main type of land use in urban built-up areas, accounting for 28.9% of the total area. Most of the industrial land is clustered in Qingshan Industrial Park in the northeast of the city, and the Economic and Technological Development Area is in the southwest; some small industrial land is scattered throughout the inner city. The commercial and service land tends to be distributed in spots along the main traffic route and at its junctions.

2.2. Data

The Landsat8 OLI_TIRS remote sensing images obtained on 13 June 2013 and 23 January 2014 were used as the basic data for retrieving land surface temperature (LST) in summer and winter, with the strip number 123/19, a spatial resolution of 30 m, and a high image quality from the United States Geological Survey (USGS). Data calculation for urban form includes two aspects: urban land use data and building data. Specifically, the urban land use data are from the urban land use survey, which can be divided into 11 types according to the Urban Land Classification and Planning Construction Land Standards in China [51]. Only five land use types—administration land (A), commercial land (B), industrial land (M), residential land (R), and water area (E)—were employed in this study because of their small areas and nonsignificant driving forces. The building data were obtained from the Application Programming Interface (API) from Amap developer platform (https://lbs.amap.com/) accessed on 1 January 2023. There are vector data with the floor area of the building and the number of the building floors, which can be used for the calculation of building density (BD), floor area ratio (FAR), sky view factor (SVF) and building height (BH). For the convenience of calculation [16,30], we set the average height of each floor to 3 m and multiplied it by the total number of building floors to calculate the total height of the building. The calculation process of indicators was completed on the ArcGIS 10.8 platform.

2.3. Two-Dimensional/Three-Dimensional Metrics Selection and Description

In order to detect the influence of urban form on LST, a comprehensive indicator system capturing the multi-dimensional aspects of urban form was developed, encompassing 2D urban land use and 3D building characteristics. Most of these selected indicators are in accordance with the prescriptive regulations of China’s Urban Regulatory Detailed Planning. As an important means to control and guide urban development and construction, urban planning restricts and standardizes urban construction through land use nature (function), building height, building density, floor area ratio and other indicators. Therefore, the indicators selected in this article are highly related to the controlling elements of detailed urban planning in China, which is beneficial for improving the feasibility of optimizing the urban thermal environment. In the horizontal dimension, the planning of land use guides urban development, human activities, and construction intensity, which determines the formation of varied heat islands in terms of heat dissipation for daily life and production, or cold islands provided by ecological land. In the vertical direction, buildings have become the key factors affecting the local climate [52]. On one hand, buildings generate spatial differences in absorbing and blocking heat through their material properties and canopies; on the other hand, building layout affects ventilation, thereby affecting the accumulation and diffusion of heat [26]. Urban planners should understand the role that land development patterns and their spatial distribution area play in the formation of the UHI.
As important components of urban form, five land use indicators were selected, including the proportion of administration land (PA), the proportion of commercial and service facilities land (PB), the proportion of industrial land (PM), the proportion of residential land (PR), and the proportion of water area (PE), which can effectively represent the planning purpose. Among these, industrial areas are typically marked by large, low-rise structures, prevalent use of dark-coloured metal roofing materials, and substantial energy consumption, all of which contribute to urban heat hotspots [53]. On the other hand, administrative, commercial, and residential areas are characterized by different building layouts, green spaces, socio-economic activities, artificial cooling facilities, and different degrees of release and absorption, thereby potentially resulting in varied LST. Conversely, water bodies serve as prominent ‘cold islands’ within cities, playing a crucial role in mitigating the UHI effect [54]. In addition, the data acquisition and previous experience are also the main criteria for selecting 3D building indicators, including building density (BD), building height (BH), floor area ratio (FAR), and sky view factor (SVF) [55]. Specifically, BD represents the building coverage degree, with higher values resulting in stronger absorption of solar radiation at the surface and reduced air circulation [43]; BH represents the 3D roughness of the urban surface, which changes the LST mainly by affecting the shading effect and the efficiency of urban ventilation [24]; FAR represents the ratio of gross floor area to grid area, the impact of which on warming is related to human production and domestic heat emissions [39]; and SVF represents the degree of spatial closure of the city and changes the LST by affecting solar radiation absorption [56]. The formulas and specific connotations of each indicator are shown in Table 1.

2.4. Methodology

2.4.1. Land Surface Temperature Retrieval

The mono-window algorithm with a high accuracy was used to retrieve the surface temperature [64]. The thermal infrared band was first subjected to radiometric calibration, meaning that the digital number (DN) value was converted to the corresponding radiation intensity value L ε :
L ε = g a i n × D N + o f f s e
where L ε the spectral radiance, and gain and offset are the radiometric rescaling coefficients obtained from the header file. This is converted to the corresponding radiation brightness temperature (BT) value T a :
T a = K 2 / ln ( 1 + K 1 / L ε )
where L ε is the spectral radiance, K1 = 774.89 W/(m2⋅sr⋅μm), and K2 = 1321.08 K for Landsat 8 band 10. The LSTs were obtained by using the Ta value from Equation (2) as follows:
T S = a 1 C D + b 1 C D + C + D T a D T b / C
where Ts is the surface temperature, Tb is the brightness temperature, Ta is the average atmospheric action temperature, a and b are considered as constant coefficients to correct the accuracy of surface temperature, with the temperature range of 0–70° (273–343 K) [65], a = −67.35535 and b = 0.45861, and C, D are intermediate variables, calculated by Equations (4) and (5):
C = ε τ
D = 1 τ 1 + 1 ε τ
where ε and τ are the surface emissivity and atmospheric transmissivity of the thermal infrared band, respectively [66]; ε represents the surface emissivity based on NDVI and vegetation coverage [67] and τ represents atmospheric transmissivity calculated based on atmospheric parameters derived from NASA’s website (http://atmcorr.gsfc.uasa.gov/), accessed on 10 January 2023.

2.4.2. Geographic Detector

A geographic detector is a set of statistical methods to detect driving forces and mechanisms of spatial stratified heterogeneity, including four modules: the factor detection, the interaction detection, the risk area detection, and the ecological detection [46]. The most significant advantage of the geographic detector model over other methods is that the relationship between driving factors and the geographic phenomena can be detected without any linear assumptions, and its calculation process and results are not affected by multi-collinearity [68]. In this paper, factor detectors and interaction detectors are used to quantitatively analyze the driving factors of LST in the main urban area of Wuhan City and their interactions.
(1)
Factor detection. Detect the spatial differentiation of variable Y, and the extent to which a factor X explains the spatial differentiation of attributes. Measured by the q value, the expression is
q x , y = 1 1 n σ Y 2 i = 1 m n x , i σ T x , i 2
where q x , y is expressed as the explanatory power of the influence factor X on the surface temperature Y; n is the total number of samples in the study area; σ Y 2 is the variance of surface temperature; m is the number of categories after the discretization of impact factor X; nx,i and σ T x , i 2 are the sample number and surface temperature variance of influence factor X in class i, respectively. The value range of q x , y is [0~1], and the higher the q value, the stronger the explanatory force of the impact factor X on the dependent variable Y.
(2)
Interaction detector. The interaction detector judges the characteristics of the interaction between two variables by comparing the q value of a single factor and the q value of the interaction between two factors. The q(xixj) value is used to determine whether the interaction between factors Xi and Xj will enhance or weaken the explanatory force of surface temperature. The interaction between the two factors is shown in Table 2.

3. Results

3.1. Spatial Distribution of the Land Surface Temperature

The LST spatial distribution in the main urban area of Wuhan in summer and winter is shown in Figure 3. The areas with high summer LST are mainly distributed west of the Yangtze River and north of the Han River, as well as industrial zones and economic development zones located in the northeast and southwest parts of the study area, respectively. The highest surface temperature reached 54.06 °C in summer. The area of the highest LST in winter was relatively small with a concentrated distribution. LST in the central urban area was low, but the industrial zones located in the urban fringe had high surface temperatures. Furthermore, both in winter and summer, the water area showed obvious characteristics of a “cold island”. Under the substrate constraint of the blue-green space in the main urban area of Wuhan, the LST of Wuhan presented a rather fragmented spatial pattern. In order to analyze the relationships between LST and urban form metrics at various scales, ArcGIS 10.8 was employed to create a fishnet to divide five grid units (150 m, 300 m, 500 m, 700 m and 1000 m) as the analysis unit (Figure 4).
The LST was also analyzed in various urban land use types (Figure 5). In summer, the average surface temperature was ranked as M (40.238 °C), B (39.112 °C), R (38.158 °C), A (38.064 °C), and E (30.515 °C), while the average surface temperature in winter is ranked as M (13.728 °C), B (12.119 °C), A (11.992 °C), R (11.604 °C), and E (10.732 °C). It can be found that the average LST of industrial land was the highest both in winter and summer, and the average LST of the commercial land ranked in second place, while the average LST of water area was the lowest. The average LST of administration and public service land use was higher than that of residential land in summer, while it was the opposite in winter.
Previous studies have primarily focused on the urban thermal environment within the context of LCZ or urban function zones, neglecting the influence of land use characteristics on LST [52,69,70,71]. These two pre-classification methods are indeed helpful in facilitating comparisons across different divisions. However, their subjective classification standards can result in inconsistent and incomparable outcomes. Therefore, it is essential to directly study the spatial differentiation of LST based on land use itself. The findings of this study indicated that industrial land exhibited the highest average surface temperature during both winter and summer seasons, followed by commercial land, which is consistent with Li et al. (2020) [72] and inconsistent with Chen et al. (2022) [69].

3.2. Factor Detection at Various Scales

Based on the analysis results of the single factor detector, the q values of nine factors in five scale units were tested and analyzed (Table 3). In summer, the q value of BD with a range of 0.449–0.538 ranked in the first place, followed by FAR, PE and SVF. The q value of PA showed the weakest driving force with a range of 0.046–0.129. Except for the water area, all 2D urban land use metrics showed rather weaker explanatory powers of LST spatial differentiation than that of 3D buildings. Generally, the impact of 3D buildings on LST is much higher than 2D urban land use. In winter, the q value of PM had the largest impact on LST with an explanatory power of 0.226–0.279, followed by PE and BH. The q value of PB had the smallest. In short, the metrics of 3D buildings did not show a stronger explanatory power of LST spatial differentiation compared with those of 2D urban land use in winter.
The q value of each factor is tremendously affected by the scale effect. In summer, the effect of PA, PB, PR, PM, and SVF on LST showed a trend of increasing q value with the increase in grid scale. However, the effect of PE and BH on LST shows a trend of decreasing q value with the increase in scale. The effect of BD and FAR on LST have low sensitivity to the scale transformation, showing relative stability. In winter, PA, PB, PR, PM, and SVF show a trend of increasing q value with the increase in grid scale like that in summer. While PE and BD show a trend of decreasing q value with the increase in scale, BH and FAR exhibit slight fluctuations of q value as the scale increased. Overall, the ranking of the total q values for each factor under the different grid cells in summer was at 1000 m, 500 m, 700 m, 300 m, and 150 m. In winter, the ranking was at 150 m, 300 m, 500 m, 700 m, and 1000 m.

3.3. Interaction Detection at Various Scales

The “interaction detection module” was employed to assess the influence of pairwise interactions. The interaction between any two factors exhibited a stronger explanatory power for the spatial differentiation of LST than any individual urban form metric. In summer, the highest q value was observed for the interaction PE∩BD at 150 m, 300 m, 500 m, and 700 m, while PR∩BD exhibited the highest q value at 1000 m (Figure 6). As illustrated, the q values for PM∩PB, PM∩PR, and PM∩PA at 150 m, 300 m, 500 m, and 700 m, as well as those for PM∩PR and PM∩PA at 1000 m, surpassed the sum of the individual factors, indicating a non-linear mutual enhancement. Another type of interaction observed was bivariate enhancement, in which single factors exhibit an effect lower than the sum of their individual impacts.
Overall, the interaction between metrics of 2D urban land use alone had a lower explanatory power for revealing the spatial differentiation of surface temperature compared to the interaction between metrics of 2D urban land use and 3D buildings, as well as interactions involving 3D building metrics. The stronger interactions were primarily observed in PE∩BD, PM∩BD, PM∩FAR, and PR∩BD at various scales. As the scale increased, PA, PB, and PM exhibited more pronounced interactions with other 2D urban land use indicators compared to PE. Additionally, PA, PB, and PM showed stronger interactions with 3D building indicators, except for BH. The interaction between PE and other 2D urban land use and 3D building indicators demonstrated a significantly higher explanatory power for the spatial differentiation of LST. However, this interaction exhibits an unstable fluctuation state as the scale increases. With increasing scale, the interaction between BH and 2D urban land use indicators exhibited a decreasing trend. On the other hand, the interaction between BH and 3D building indicators demonstrated an increasing trend as the scale expanded. The interaction between SVF and other 2D urban land use and 3D building indicators exhibited a gradually increasing trend as the scale increased. FAR demonstrated a robust interaction with other 2D urban land use and 3D building indicators, and as the scale increased, this interaction became more pronounced. Notably, the explanatory power of FAR in explaining the phenomenon of interaction exceeded 40%.
In winter, the interaction among metrics of 2D urban land use, as well as the interaction among 3D building metrics, had a low explanatory power for LST spatial differentiation (Figure 7). The strongest interactions mainly manifested in the interaction between PM, PE and PR with other urban form metrics at various scales. As the scale increased, the interaction between PM and any other 2D urban land use and 3D building indicators became stronger. The interactions between PE∩PA and PE∩PB gradually intensified with increasing scale, while the interaction between PE∩PR weakened. Additionally, the interactions between PE and any 3D building indicators exhibit an unstable and fluctuating pattern. On the other hand, the interactions of PR∩PA, PR∩PB, PR∩BH, and PR∩SVF strengthened as the scale increased. However, the interactions between PR∩BD and PR∩FAR reached their peak at a scale of 700 m, followed by a slight decline at 1000 m.

4. Discussions

4.1. Driving Forces of Urban Form on LST Spatial Differentiation in Summer and Winter

Urban form plays a key role in LST spatial differentiation [73,74]. However, there is a notable gap in research regarding the spatial differentiation of LST from a comprehensive perspective that includes urban land use and buildings. This study reveals that the LST spatial differentiation in summer and winter is influenced by different dominant factors. The LST spatial differentiation in summer was mainly affected by 3D building elements, while the LST spatial differentiation in winter was mainly affected by 2D land use elements. These seasonal disparities may come from multiple factors. Specifically, during summer, with direct sunlight hitting the ground, buildings and other man-made structures, such as concrete and asphalt, play a pivotal role in modulating the thermal environment. These materials, characterized by their thermophysical properties, exhibit a propensity to absorb and store substantial amounts of heat, leading to a rise in LST. Moreover, urban structures, particularly the height and density of buildings, can impede natural ventilation processes, further exacerbating the urban heat phenomenon [75]. While diverse land use types and their associated socio-economic activities introduce variability in the urban thermal environment, the dominance of impervious surfaces in urban cores largely dictates the LST spatial variations. During winter, the retention effect of buildings is less pronounced compared to summer due to the reduced intensity and duration of winter sunlight. Land use patterns, which determine the distribution of various heat sources and sinks, become more critical. For example, anthropogenic activities, such as heating systems in residential areas, as well as production heat release, are more closely associated with land use types than with building structures [76,77].
Due to the complexity of surface processes, the factors usually do not work independently but interactively. The interactive effect of any two factors also revealed some interesting findings. Specifically, the interaction of pairwise factors has enhanced the explanatory power for LST spatial differentiation both in summer and winter. Although the interaction between 2D and 3D elements was the primary driving force for the spatial differentiation of LST both in summer and winter, the spatial differentiation of summer LST was also influenced by the interaction among 3D building factors, while the spatial differentiation of winter LST was influenced by the interaction among 2D urban land use factors, which is similar to the single factor results. Furthermore, the interaction between BD and any indicator demonstrated the strongest explanatory power for LST spatial differentiation during summer, whereas the interaction between PM and any indicator exhibited the strongest explanatory power for LST spatial differentiation during winter. Notably, the interaction of most factors presented a non-linear enhanced pattern in winter, and this interaction pattern was mainly found among 2D urban land use, which is different from the interaction pattern in summer (mostly two-factor enhancement). This may be due to complex interactions and feedback mechanisms between different land use types. For example, the cooling effect of blue-green spaces extends beyond its immediate location and also impacts the surrounding areas, which will lead to nonlinear LST responses [78,79]. That is to say, the relationship between the structural changes produced by adjustments in land use types and LST is non-linear, meaning that even minor changes in land use can lead to significant changes in LST. Therefore, special attention should be paid to land use adjustments when improving the thermal environment.

4.2. Scale Effect of Urban Form on LST

In-depth assessments of how urban form drivers impact the spatial differentiation of LST across scales are essential for improving the urban thermal environment effectively [80]. As the spatial scale increased, the explanatory power of 2D urban land use elements for the LST spatial differentiation gradually increased both in winter and summer. In contrast, the explanatory power of BD, FAR, and SVF on LST spatial differentiation remained basically unchanged as the spatial scale increased both in summer and in winter, which indicates that 3D building indicators play a robust role in driving the spatial differentiation of thermal environments. The performance of scale effects on 2D and 3D indicators is inconsistent. Specifically, the influence of land use on LST varies with scale for several reasons. On one hand, as the scale increases, the spatial heterogeneity of 2D land use intensifies. This amplification means that distinctions between land use types—such as water bodies, residential zones, and commercial sectors—become more obvious. Each of these categories possesses unique thermal attributes, which can markedly impact the LST [81]. On the other hand, with the scale increases, smaller land use patches tend to be aggregated into broader, more homogenized zones (urban functional zones). This aggregation highlights the influence of the dominant land use type on LST, thereby strengthening the explanatory power of 2D land use. However, the influence of 3D buildings on LST, especially in terms of heat storage and radiation, tends to be more localized and consistent across different scales.
However, there are two exceptions for PE and BH. The explanatory power of the PE on the LST spatial differentiation decreased with the increase in scale. There may be two reasons for this. Firstly, the distribution, shape, and size of water bodies have a significant impact on LST at the micro-scale [76], while in larger research units, these features may be averaged, leading to a decrease in explanatory power for LST spatial differences. Secondly, as the scale increases, spatial heterogeneity gradually increases, with an increasing proportion of other urban elements and decreasing LST differences within the research unit, which reduces the explanatory power of PE for LST spatial differentiation. The explanatory power of BH on the summer LST spatial differential decreased with increasing scale, while the explanatory power of BH on winter LST spatial differentiation remained in a stable state. This is mainly because BH plays a dominant role in summer LST spatial differentiation, and when the scale increased, the difference in BH decreased, resulting in lower explanatory power. However, the 2D urban land use plays a dominant role in winter, so the increase in scale had little impact on the explanatory power of the LST spatial differentiation driven by BH. Consequently, based on the basis of comprehensive consideration of robust indicators and changeable indicators, differentiation and homogenization strategies should be proposed at different scales to achieve multi-level management collaboration, targeting sets of needs tailored to different spatial scales.

4.3. Implications for Urban Planning and Management

The findings in this study can provide effective and practical implications for urban planning and management to help cities enhance their climate adaptation and resilience. The three strategies can be summarized as the Priority of Planning Indicators, the Collaborative Arrangement of Urban Form, and the Specific Adaptation.
Specifically, first of all, our study, utilizing a ranking based on ‘q’ values, delineates the hierarchy of planning indicators essential for urban thermal environment improvement. During summer, BD emerges as a dominant factor, explaining over 50% of LST spatial variations, which is consistent with the main conclusion of relevant research [12,17,35]. Similarly, other indicators like FAR (over 40%) and SVF (over 30%) are identified as significant. While water bodies undoubtedly serve as essential cooling landscapes, the intrinsic natural characteristics of urban areas, coupled with the limitations posed by intensive land development, curtail the expansion of blue-green spaces. Hence, our findings suggest a priority hierarchy for summer LST: 3D indicators (BD > FAR > SVF > BH) over 2D indicators (PE > PM > PR > PB > PA). In contrast, the winter season presents a distinct set of priorities. The emphasis shifts more towards 2D aspects (PM > PE > PR > PA > PB) over 3D (BH > SVF > BD > FAR). This provides a clear understanding of the planning indicators’ priority in shaping the urban thermal environment across different seasons.
Secondly, through interactive detection, our study highlights that the interaction between various urban form indicators can intensify spatial differentiation in the urban thermal environment. This suggests that urban planning practices should pay particular attention to the building characteristics of specific land-use types and the configuration of certain land-use types. It is essential to holistically consider the synergistic effects of both 2D and 3D urban form attributes. For instance, during summer, emphasis should be placed on the configuration of the BD and FAR in industrial areas, as well as the BD and FAR in residential zones. Conversely, in winter, the focus should shift to the BH, SVF, and FAR in industrial lands, and the proportionate configuration of residential and industrial lands within the same planning unit.
Finally, through the examination of scale effects, our study emphasizes that planning and regulatory units are not a “one-size-fits-all” approach for urban thermal environment improvement. The key indicators that need primary consideration vary across different scales. During the summer, the driving force of 2D land use indicators for the LST increases with the expansion of spatial scale. However, 3D building indicators, except for BH, remain relatively consistent across spatial scales. Furthermore, during winter, the influence of urban form on the LST shows minimal variation across scales. This indicates the importance of tailoring land use configurations at smaller scales to optimize thermal benefits.

4.4. Significance and Limitations

The driving mechanism of the LST spatial differentiation is a very complex geographical process [82]. This paper explored the seasonal differences in the effect of urban form on LST with scales. These findings can provide unique insights for policies of urban planning and management in China to improve the thermal environment by using the indicators related to urban planning. In the practice of climate-adaptive urban renewal and planning, the adjustment of land use nature and quantity can be carried out from a macro perspective, while the layout of buildings can be determined based on specific circumstances. Special attention should be paid to controlling BD and PM not only by their own contribution to the thermal environment, but also by their interaction with other indicators. We also provide multi-level thermal environment improvement strategies targeting multiple scales and specific optimization backgrounds (such as various seasons, units, etc.).
However, there are some limitations. The metrics selected in this paper may be insufficient to fully reflect the urban form. More 2D and 3D morphological metrics related to urban planning should be introduced in future research, such as the volume ratio of vegetation and building, the ratio of street height width and other metrics [83,84,85]. Due to the comprehensiveness and complexity of the regional system, the mechanism explained in this paper may not be universally appropriate, which would result in discrepancies in different study case areas. In addition, due to the limitation of data acquisition, this paper did not carry out multi-time series research on the LST. Research on the synergistic mechanism of 2D urban land use and 3D buildings on LST spatial differentiation will strengthen various regions and periods.

5. Conclusions

This study offers a multiscale and comprehensive understanding of the driving forces of LST spatial differentiation from 2D urban land use and 3D buildings using geographic detectors. The findings contributed to enriching the current knowledge on how urban form affects seasonal LST and providing insights on integrating scale dependency into urban thermal environment management to promote sustainability. The main findings are as follows.
(1)
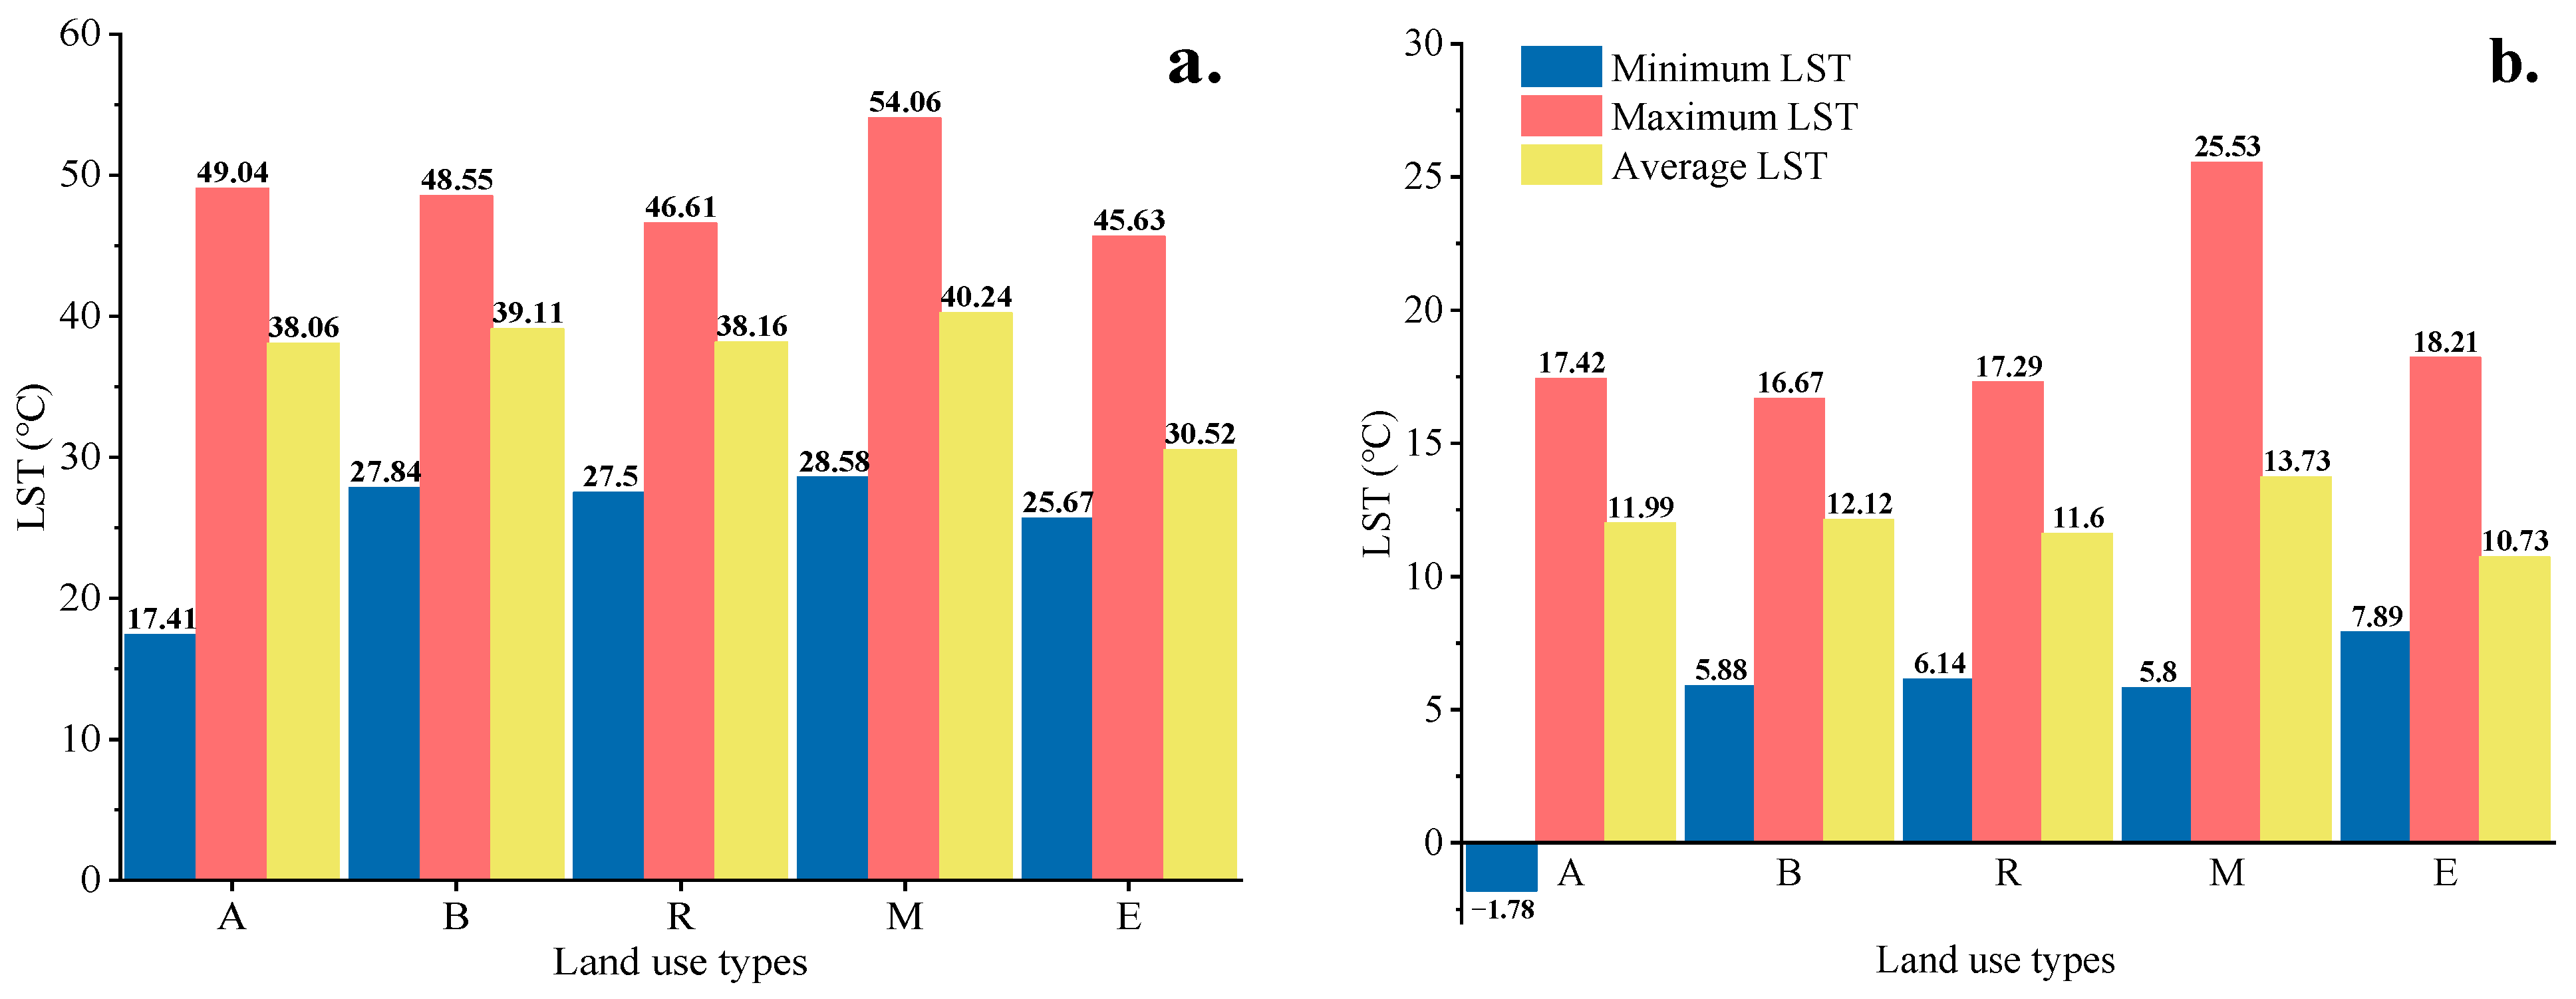
There are significant differences in average LST on different urban land use types. Industrial land has the highest average LST in both summer and winter, followed by commercial land. This finding can provide guidance to urban planners in selecting priority areas for thermal environment regulation.
(2)
The factors that primarily drive and interactively drive the LST spatial differentiation are different in summer and winter. The spatial variation of LST in summer is primarily influenced by 3D buildings, whereas in winter, it is predominantly affected by 2D land use. BD is the leading driving force of LST spatial differentiation in summer, and the interaction between BD and any other indicator shows the most significant explanatory power, which is the same for PM in winter.
(3)
As scale increases, the explanatory power of 2D urban land use for the LST spatial differentiation gradually increases both in winter and summer, except in the case of PE. In contrast, the explanatory power of 3D buildings on LST spatial differentiation remains basically unchanged, except in the case of BH. The interaction among urban form metrics primarily increases as the scale, except for BH and 2D urban land use in summer, and PE and PR in winter.
(4)
A comprehensive strategy of the Priority of Planning Indicators, the Collaborative Arrangement of Urban Form, and the Specific Adaptation was suggested to improve urban thermal improvement, taking into account land use and building, seasonal differences, and scale effects. These strategies can be used as an effective guide for future planners to improve the urban thermal environment and promote urban resilience and climate adaptation. Moreover, future studies should prioritize the development of metrics and models that are not only scientifically robust but also practically relevant and actionable for urban planning and policy formulation.

Author Contributions

Conceptualization, C.Y.; methodology, C.Y.; software, J.Y.; validation, C.Y. and Z.A.; data curation, C.Y.; writing, C.Y. and J.Y.; visualization, J.Y.; revise, C.Y., B.M., Y.Z. and W.C.; supervision, Q.W., Y.L. and L.W.; original language editing, Y.S.; funding acquisition, C.Y. All authors have read and agreed to the published version of the manuscript.

Funding

This research was funded by the Youth Natural Science Foundation of Henan Province, grant number 232300421399 and the Scientific Research Foundation of Henan Agricultural University, grant number 30501051.

Data Availability Statement

Not applicable.

Acknowledgments

We sincerely thank the reviewers for their helpful comments and suggestions about our manuscript.

Conflicts of Interest

The authors declare that they have no known competing financial interests or personal relationships that could have appeared to influence the work reported in this paper.

References

  1. Su, H.; Qi, Z. Polycentric Structure and Urban Thermal Environment: A Large-Scale Study from Multi-Perspectives. Sustain. Cities Soc. 2023, 96, 104657. [Google Scholar] [CrossRef]
  2. Wu, J.; Bai, Z. Spatial and Temporal Changes of the Ecological Footprint of China’s Resource-Based Cities in the Process of Urbanization. Resour. Policy 2022, 75, 102491. [Google Scholar] [CrossRef]
  3. Voogt, J.A.; Oke, T.R. Thermal Remote Sensing of Urban Climates. Remote Sens. Environ. 2003, 86, 370–384. [Google Scholar] [CrossRef]
  4. Gaur, A.; Eichenbaum, M.K.; Simonovic, S.P. Analysis and Modelling of Surface Urban Heat Island in 20 Canadian Cities under Climate and Land-Cover Change. J. Environ. Manag. 2018, 206, 145–157. [Google Scholar] [CrossRef] [PubMed]
  5. Farhadi, H.; Faizi, M.; Sanaieian, H. Mitigating the Urban Heat Island in a Residential Area in Tehran: Investigating the Role of Vegetation, Materials, and Orientation of Buildings. Sustain. Cities Soc. 2019, 46, 101448. [Google Scholar] [CrossRef]
  6. Heaviside, C.; Macintyre, H.; Vardoulakis, S. The Urban Heat Island: Implications for Health in a Changing Environment. Curr. Environ. Health Rep. 2017, 4, 296–305. [Google Scholar] [CrossRef] [PubMed]
  7. Heaviside, C.; Vardoulakis, S.; Cai, X.-M. Attribution of Mortality to the Urban Heat Island during Heatwaves in the West Midlands, UK. Environ. Health 2016, 15, 49–59. [Google Scholar] [CrossRef]
  8. Tan, J.; Zheng, Y.; Tang, X.; Guo, C.; Li, L.; Song, G.; Zhen, X.; Yuan, D.; Kalkstein, A.J.; Li, F. The Urban Heat Island and Its Impact on Heat Waves and Human Health in Shanghai. Int. J. Biometeorol. 2010, 54, 75–84. [Google Scholar] [CrossRef]
  9. Ma, X.; Fukuda, H.; Zhou, D.; Gao, W.; Wang, M. The Study on Outdoor Pedestrian Thermal Comfort in Blocks: A Case Study of the Dao He Old Block in Hot-Summer and Cold-Winter Area of Southern China. Sol. Energy 2019, 179, 210–225. [Google Scholar] [CrossRef]
  10. Han, W.; Li, Z.; Wu, F.; Zhang, Y.; Guo, J.; Su, T.; Cribb, M.; Fan, J.; Chen, T.; Wei, J. The Mechanisms and Seasonal Differences of the Impact of Aerosols on Daytime Surface Urban Heat Island Effect. Atmos. Chem. Phys. 2020, 20, 6479–6493. [Google Scholar] [CrossRef]
  11. Athukorala, D.; Murayama, Y. Urban Heat Island Formation in Greater Cairo: Spatio-Temporal Analysis of Daytime and Nighttime Land Surface Temperatures along the Urban–Rural Gradient. Remote Sens. 2021, 13, 1396. [Google Scholar] [CrossRef]
  12. Guo, A.; Yang, J.; Xiao, X.; Xia, J.; Jin, C.; Li, X. Influences of Urban Spatial Form on Urban Heat Island Effects at the Community Level in China. Sustain. Cities Soc. 2020, 53, 101972. [Google Scholar] [CrossRef]
  13. Zhu, R.; Dong, X.; Wong, M.S. Estimation of the Urban Heat Island Effect in a Reformed Urban District: A Scenario-Based Study in Hong Kong. Sustainability 2022, 14, 4409. [Google Scholar] [CrossRef]
  14. Cheela, V.S.; John, M.; Biswas, W.; Sarker, P. Combating Urban Heat Island Effect—A Review of Reflective Pavements and Tree Shading Strategies. Buildings 2021, 11, 93. [Google Scholar] [CrossRef]
  15. Semenzato, P.; Bortolini, L. Urban Heat Island Mitigation and Urban Green Spaces: Testing a Model in the City of Padova (Italy). Land 2023, 12, 476. [Google Scholar] [CrossRef]
  16. Deng, J.-Y.; He, Y.; Dai, M. Evaluation of the Outdoor Thermal Environment for Three Typical Urban Forms in Nanjing, China. Build. Environ. 2023, 238, 110358. [Google Scholar] [CrossRef]
  17. Liao, W.; Hong, T.; Heo, Y. The Effect of Spatial Heterogeneity in Urban Morphology on Surface Urban Heat Islands. Energy Build. 2021, 244, 111027. [Google Scholar] [CrossRef]
  18. Yuan, C.; Adelia, A.S.; Mei, S.; He, W.; Li, X.-X.; Norford, L. Mitigating Intensity of Urban Heat Island by Better Understanding on Urban Morphology and Anthropogenic Heat Dispersion. Build. Environ. 2020, 176, 106876. [Google Scholar] [CrossRef]
  19. Stuhlmacher, M.; Georgescu, M.; Turner II, B.L.; Goldblatt, R.; Gupta, S.; Frazier, A.E.; Kim, Y.; Balling, R.C.; Clinton, N. Are Global Cities Homogenizing? An Assessment of Urban Form and Heat Island Implications. Cities 2022, 126, 103705. [Google Scholar] [CrossRef]
  20. Liu, H.; Huang, B.; Zhan, Q.; Gao, S.; Li, R.; Fan, Z. The Influence of Urban Form on Surface Urban Heat Island and Its Planning Implications: Evidence from 1288 Urban Clusters in China. Sustain. Cities Soc. 2021, 71, 102987. [Google Scholar] [CrossRef]
  21. Sharifi, A. Urban Form Resilience: A Meso-Scale Analysis. Cities 2019, 93, 238–252. [Google Scholar] [CrossRef]
  22. Yue, W.; Liu, X.; Zhou, Y.; Liu, Y. Impacts of Urban Configuration on Urban Heat Island: An Empirical Study in China Mega-Cities. Sci. Total Environ. 2019, 671, 1036–1046. [Google Scholar] [CrossRef]
  23. Liu, X.; Ming, Y.; Liu, Y.; Yue, W.; Han, G. Influences of Landform and Urban Form Factors on Urban Heat Island: Comparative Case Study between Chengdu and Chongqing. Sci. Total Environ. 2022, 820, 153395. [Google Scholar] [CrossRef] [PubMed]
  24. Chen, Y.; Yang, J.; Yu, W.; Ren, J.; Xiao, X.; Xia, J.C. Relationship between Urban Spatial Form and Seasonal Land Surface Temperature under Different Grid Scales. Sustain. Cities Soc. 2023, 89, 104374. [Google Scholar] [CrossRef]
  25. Jia, Y.; Tang, L.; Xu, M.; Yang, X. Landscape Pattern Indices for Evaluating Urban Spatial Morphology–A Case Study of Chinese Cities. Ecol. Indic. 2019, 99, 27–37. [Google Scholar] [CrossRef]
  26. Shao, L.; Liao, W.; Li, P.; Luo, M.; Xiong, X.; Liu, X. Drivers of Global Surface Urban Heat Islands: Surface Property, Climate Background, and 2D/3D Urban Morphologies. Build. Environ. 2023, 242, 110581. [Google Scholar] [CrossRef]
  27. Liu, Y.; Wang, Z.; Liu, X.; Zhang, B. Complexity of the Relationship between 2D/3D Urban Morphology and the Land Surface Temperature: A Multiscale Perspective. Environ. Sci. Pollut. Res. 2021, 28, 66804–66818. [Google Scholar] [CrossRef] [PubMed]
  28. Estoque, R.C.; Murayama, Y.; Myint, S.W. Effects of Landscape Composition and Pattern on Land Surface Temperature: An Urban Heat Island Study in the Megacities of Southeast Asia. Sci. Total Environ. 2017, 577, 349–359. [Google Scholar] [CrossRef]
  29. Li, J.; Song, C.; Cao, L.; Zhu, F.; Meng, X.; Wu, J. Impacts of Landscape Structure on Surface Urban Heat Islands: A Case Study of Shanghai, China. Remote Sens. Environ. 2011, 115, 3249–3263. [Google Scholar] [CrossRef]
  30. Coseo, P.; Larsen, L. How Factors of Land Use/Land Cover, Building Configuration, and Adjacent Heat Sources and Sinks Explain Urban Heat Islands in Chicago. Landsc. Urban Plan. 2014, 125, 117–129. [Google Scholar] [CrossRef]
  31. Chen, J.; Zhan, W.; Du, P.; Li, L.; Li, J.; Liu, Z.; Huang, F.; Lai, J.; Xia, J. Seasonally Disparate Responses of Surface Thermal Environment to 2D/3D Urban Morphology. Build. Environ. 2022, 214, 108928. [Google Scholar] [CrossRef]
  32. Yu, Z.; Yang, G.; Zuo, S.; Jørgensen, G.; Koga, M.; Vejre, H. Critical Review on the Cooling Effect of Urban Blue-Green Space: A Threshold-Size Perspective. Urban For. Urban Green. 2020, 49, 126630. [Google Scholar] [CrossRef]
  33. Du, H.; Song, X.; Jiang, H.; Kan, Z.; Wang, Z.; Cai, Y. Research on the Cooling Island Effects of Water Body: A Case Study of Shanghai, China. Ecol. Indic. 2016, 67, 31–38. [Google Scholar] [CrossRef]
  34. Cao, S.; Cai, Y.; Du, M.; Weng, Q.; Lu, L. Seasonal and Diurnal Surface Urban Heat Islands in China: An Investigation of Driving Factors with Three-Dimensional Urban Morphological Parameters. GIScience Remote Sens. 2022, 59, 1121–1142. [Google Scholar] [CrossRef]
  35. Guo, G.; Zhou, X.; Wu, Z.; Xiao, R.; Chen, Y. Characterizing the Impact of Urban Morphology Heterogeneity on Land Surface Temperature in Guangzhou, China. Environ. Model. Softw. 2016, 84, 427–439. [Google Scholar] [CrossRef]
  36. Pakarnseree, R.; Chunkao, K.; Bualert, S. Physical Characteristics of Bangkok and Its Urban Heat Island Phenomenon. Build. Environ. 2018, 143, 561–569. [Google Scholar] [CrossRef]
  37. Elkhazindar, A.; Kharrufa, S.N.; Arar, M.S. The Effect of Urban Form on the Heat Island Phenomenon and Human Thermal Comfort: A Comparative Study of UAE Residential Sites. Energies 2022, 15, 5471. [Google Scholar] [CrossRef]
  38. Yuan, S.; Ren, Z.; Shan, X.; Deng, Q.; Zhou, Z. Seasonal Different Effects of Land Cover on Urban Heat Island in Wuhan’s Metropolitan Area. Urban Clim. 2023, 49, 101547. [Google Scholar] [CrossRef]
  39. Zhang, Z.; Luan, W.; Yang, J.; Guo, A.; Su, M.; Tian, C. The Influences of 2D/3D Urban Morphology on Land Surface Temperature at the Block Scale in Chinese Megacities. Urban Clim. 2023, 49, 101553. [Google Scholar] [CrossRef]
  40. Zhang, N.; Zhang, J.; Chen, W.; Su, J. Block-Based Variations in the Impact of Characteristics of Urban Functional Zones on the Urban Heat Island Effect: A Case Study of Beijing. Sustain. Cities Soc. 2022, 76, 103529. [Google Scholar] [CrossRef]
  41. Li, X.; Yang, B.; Xu, G.; Liang, F.; Jiang, T.; Dong, Z. Exploring the Impact of 2-D/3-D Building Morphology on the Land Surface Temperature: A Case Study of Three Megacities in China. IEEE J. Sel. Top. Appl. Earth Obs. Remote Sens. 2021, 14, 4933–4945. [Google Scholar] [CrossRef]
  42. Gao, Y.; Zhao, J.; Han, L. Exploring the Spatial Heterogeneity of Urban Heat Island Effect and Its Relationship to Block Morphology with the Geographically Weighted Regression Model. Sustain. Cities Soc. 2022, 76, 103431. [Google Scholar] [CrossRef]
  43. Yin, C.; Yuan, M.; Lu, Y.; Huang, Y.; Liu, Y. Effects of Urban Form on the Urban Heat Island Effect Based on Spatial Regression Model. Sci. Total Environ. 2018, 634, 696–704. [Google Scholar] [CrossRef] [PubMed]
  44. Wang, J.-F.; Zhang, T.-L.; Fu, B.-J. A Measure of Spatial Stratified Heterogeneity. Ecol. Indic. 2016, 67, 250–256. [Google Scholar] [CrossRef]
  45. Feng, R.; Wang, F.; Wang, K.; Wang, H.; Li, L. Urban Ecological Land and Natural-Anthropogenic Environment Interactively Drive Surface Urban Heat Island: An Urban Agglomeration-Level Study in China. Environ. Int. 2021, 157, 106857. [Google Scholar] [CrossRef] [PubMed]
  46. Wang, J.-F.; Li, X.-H.; Christakos, G.; Liao, Y.-L.; Zhang, T.; Gu, X.; Zheng, X.-Y. Geographical Detectors-based Health Risk Assessment and Its Application in the Neural Tube Defects Study of the Heshun Region, China. Int. J. Geogr. Inf. Sci. 2010, 24, 107–127. [Google Scholar] [CrossRef]
  47. Wang, R.; Wang, M.; Zhang, Z.; Hu, T.; Xing, J.; He, Z.; Liu, X. Geographical Detection of Urban Thermal Environment Based on the Local Climate Zones: A Case Study in Wuhan, China. Remote Sens. 2022, 14, 1067. [Google Scholar] [CrossRef]
  48. Wang, Y.; Yang, D.; Min, J.; Zhai, F.T.; Wang, Y.; Wu, X.J.; Zhang, H.R. Spatial Pattern Analysis and Quantitative Detection of Multi-Factor Influence for Urban Heat Island Effect in a Mountainous City: A Case Study of Chongqing Metropolitan Circle. Geogr. Res. 2021, 40, 856–868. [Google Scholar]
  49. Wu, J. Scale and Scaling: A Cross-Disciplinary Perspective. In Key Topics in Landscape Ecology; Cambridge University Press: Cambridge, UK, 2007; pp. 115–142. [Google Scholar]
  50. Sayre, N.F. Ecological and Geographical Scale: Parallels and Potential for Integration. Prog. Hum. Geogr. 2005, 29, 276–290. [Google Scholar] [CrossRef]
  51. Ministry of Housing and Urban-Rural Development of the People’s Republic of China. Code for Classification of Urban Land Use and Planning Standards of Development Land (GB 50137–2011). Available online: https://www.planning.org.cn/law/uploads/2013/1383993139.pdf (accessed on 29 September 2022).
  52. Kotharkar, R.; Bagade, A.; Singh, P.R. A Systematic Approach for Urban Heat Island Mitigation Strategies in Critical Local Climate Zones of an Indian City. Urban Clim. 2020, 34, 100701. [Google Scholar] [CrossRef]
  53. Lu, Y.; Yue, W.; Huang, Y. Effects of Land Use on Land Surface Temperature: A Case Study of Wuhan, China. Int. J. Environ. Res. Public Health 2021, 18, 9987. [Google Scholar] [CrossRef] [PubMed]
  54. Rinner, C.; Hussain, M. Toronto’s Urban Heat Island—Exploring the Relationship between Land Use and Surface Temperature. Remote Sens. 2011, 3, 1251–1265. [Google Scholar] [CrossRef]
  55. Cai, Z.; Han, G.; Chen, M. Do Water Bodies Play an Important Role in the Relationship between Urban Form and Land Surface Temperature? Sustain. Cities Soc. 2018, 39, 487–498. [Google Scholar] [CrossRef]
  56. Ramírez-Aguilar, E.A.; Souza, L.C.L. Urban Form and Population Density: Influences on Urban Heat Island Intensities in Bogotá, Colombia. Urban Clim. 2019, 29, 100497. [Google Scholar] [CrossRef]
  57. Azhdari, A.; Soltani, A.; Alidadi, M. Urban Morphology and Landscape Structure Effect on Land Surface Temperature: Evidence from Shiraz, a Semi-Arid City. Sustain. Cities Soc. 2018, 41, 853–864. [Google Scholar] [CrossRef]
  58. Keeratikasikorn, C.; Bonafoni, S. Urban Heat Island Analysis over the Land Use Zoning Plan of Bangkok by Means of Landsat 8 Imagery. Remote Sens. 2018, 10, 440. [Google Scholar] [CrossRef]
  59. Fang, Y.; Gu, K. Exploring Coupling Effect between Urban Heat Island Effect and PM 2.5 Concentrations from the Perspective of Spatial Environment. Environ. Eng. Res. 2022, 27, 200559. [Google Scholar] [CrossRef]
  60. Guo, A.; Yue, W.; Yang, J.; He, T.; Zhang, M.; Li, M. Divergent Impact of Urban 2D/3D Morphology on Thermal Environment along Urban Gradients. Urban Clim. 2022, 45, 101278. [Google Scholar] [CrossRef]
  61. Scarano, M.; Mancini, F. Assessing the Relationship between Sky View Factor and Land Surface Temperature to the Spatial Resolution. Int. J. Remote Sens. 2017, 38, 6910–6929. [Google Scholar] [CrossRef]
  62. Chun, B.; Guldmann, J.-M. Spatial Statistical Analysis and Simulation of the Urban Heat Island in High-Density Central Cities. Landsc. Urban Plan. 2014, 125, 76–88. [Google Scholar] [CrossRef]
  63. Guo, J.; Han, G.; Xie, Y.; Cai, Z.; Zhao, Y. Exploring the Relationships between Urban Spatial Form Factors and Land Surface Temperature in Mountainous Area: A Case Study in Chongqing City, China. Sustain. Cities Soc. 2020, 61, 102286. [Google Scholar] [CrossRef]
  64. Wang, F.; Qin, Z.; Song, C.; Tu, L.; Karnieli, A.; Zhao, S. An Improved Mono-Window Algorithm for Land Surface Temperature Retrieval from Landsat 8 Thermal Infrared Sensor Data. Remote Sens. 2015, 7, 4268–4289. [Google Scholar] [CrossRef]
  65. Schneider, K.; Mauser, W. Processing and Accuracy of Landsat Thematic Mapper Data for Lake Surface Temperature Measurement. Int. J. Remote Sens. 1996, 17, 2027–2041. [Google Scholar] [CrossRef]
  66. Valor, E.; Caselles, V. Mapping Land Surface Emissivity from NDVI: Application to European, African, and South American Areas. Remote Sens. Environ. 1996, 57, 167–184. [Google Scholar] [CrossRef]
  67. Singh, P.; Kikon, N.; Verma, P. Impact of Land Use Change and Urbanization on Urban Heat Island in Lucknow City, Central India. A Remote Sensing Based Estimate. Sustain. Cities Soc. 2017, 32, 100–114. [Google Scholar] [CrossRef]
  68. Song, Y.; Wang, J.; Ge, Y.; Xu, C. An Optimal Parameters-Based Geographical Detector Model Enhances Geographic Characteristics of Explanatory Variables for Spatial Heterogeneity Analysis: Cases with Different Types of Spatial Data. GISci. Remote Sens. 2020, 57, 593–610. [Google Scholar] [CrossRef]
  69. Chen, Y.; Yang, J.; Yang, R.; Xiao, X.; Xia, J.C. Contribution of Urban Functional Zones to the Spatial Distribution of Urban Thermal Environment. Build. Environ. 2022, 216, 109000. [Google Scholar] [CrossRef]
  70. Huang, X.; Wang, Y. Investigating the Effects of 3D Urban Morphology on the Surface Urban Heat Island Effect in Urban Functional Zones by Using High-Resolution Remote Sensing Data: A Case Study of Wuhan, Central China. ISPRS J. Photogramm. Remote Sens. 2019, 152, 119–131. [Google Scholar] [CrossRef]
  71. Gao, S.; Zhan, Q.; Yang, C.; Liu, H. The Diversified Impacts of Urban Morphology on Land Surface Temperature among Urban Functional Zones. Int. J. Environ. Res. Public Health 2020, 17, 9578. [Google Scholar] [CrossRef]
  72. Li, T.; Cao, J.; Xu, M.; Wu, Q.; Yao, L. The Influence of Urban Spatial Pattern on Land Surface Temperature for Different Functional Zones. Landsc. Ecol. Eng. 2020, 16, 249–262. [Google Scholar] [CrossRef]
  73. Song, J.; Chen, W.; Zhang, J.; Huang, K.; Hou, B.; Prishchepov, A.V. Effects of Building Density on Land Surface Temperature in China: Spatial Patterns and Determinants. Landsc. Urban Plan. 2020, 198, 103794. [Google Scholar] [CrossRef]
  74. Addas, A. Machine Learning Techniques to Map the Impact of Urban Heat Island: Investigating the City of Jeddah. Land 2023, 12, 1159. [Google Scholar] [CrossRef]
  75. Li, Y.; Schubert, S.; Kropp, J.P.; Rybski, D. On the Influence of Density and Morphology on the Urban Heat Island Intensity. Nat. Commun. 2020, 11, 2647. [Google Scholar] [CrossRef]
  76. Sun, R.; Lü, Y.; Chen, L.; Yang, L.; Chen, A. Assessing the Stability of Annual Temperatures for Different Urban Functional Zones. Build. Environ. 2013, 65, 90–98. [Google Scholar] [CrossRef]
  77. Mohan, M.; Singh, V.K.; Bhati, S.; Lodhi, N.; Sati, A.P.; Sahoo, N.R.; Dash, S.; Mishra, P.C.; Dey, S. Industrial Heat Island: A Case Study of Angul-Talcher Region in India. Theor. Appl. Climatol. 2020, 141, 229–246. [Google Scholar] [CrossRef]
  78. Gao, Y.; Zhao, J.; Han, L. Quantifying the Nonlinear Relationship between Block Morphology and the Surrounding Thermal Environment Using Random Forest Method. Sustain. Cities Soc. 2023, 91, 104443. [Google Scholar] [CrossRef]
  79. Guo, G.; Wu, Z.; Xiao, R.; Chen, Y.; Liu, X.; Zhang, X. Impacts of Urban Biophysical Composition on Land Surface Temperature in Urban Heat Island Clusters. Landsc. Urban Plan. 2015, 135, 1–10. [Google Scholar] [CrossRef]
  80. Mokhtari, Z.; Barghjelveh, S.; Sayahnia, R.; Qureshi, S.; Russo, A. Dynamic and Heterogeneity of Urban Heat Island: A Theoretical Framework in the Context of Urban Ecology. Land 2022, 11, 1155. [Google Scholar] [CrossRef]
  81. Syafii, N.I.; Ichinose, M.; Kumakura, E.; Jusuf, S.K.; Chigusa, K.; Wong, N.H. Thermal Environment Assessment around Bodies of Water in Urban Canyons: A Scale Model Study. Sustain. Cities Soc. 2017, 34, 79–89. [Google Scholar] [CrossRef]
  82. Rajagopal, P.; Priya, R.S.; Senthil, R. A Review of Recent Developments in the Impact of Environmental Measures on Urban Heat Island. Sustain. Cities Soc. 2022, 88, 104279. [Google Scholar] [CrossRef]
  83. Song, J.; Du, S.; Feng, X.; Guo, L. The Relationships between Landscape Compositions and Land Surface Temperature: Quantifying Their Resolution Sensitivity with Spatial Regression Models. Landsc. Urban Plan. 2014, 123, 145–157. [Google Scholar] [CrossRef]
  84. Yao, L.; Li, T.; Xu, M.; Xu, Y. How the Landscape Features of Urban Green Space Impact Seasonal Land Surface Temperatures at a City-Block-Scale: An Urban Heat Island Study in Beijing, China. Urban For. Urban Green. 2020, 52, 126704. [Google Scholar] [CrossRef]
  85. Kolokotsa, D.; Lilli, K.; Gobakis, K.; Mavrigiannaki, A.; Haddad, S.; Garshasbi, S.; Mohajer, H.R.H.; Paolini, R.; Vasilakopoulou, K.; Bartesaghi, C. Analyzing the Impact of Urban Planning and Building Typologies in Urban Heat Island Mitigation. Buildings 2022, 12, 537. [Google Scholar] [CrossRef]
Figure 1. Research framework and process (PA represents proportion of administrative land, PB represents proportion of business land, PR represents proportion of residential land, PM represents proportion of industrial land, PE represents proportion of water area, BD represents building density, SVF represents sky view factor, BH represents building height, and FAR represents floor area ratio).
Land 12 01802 g001
Figure 2. (a) Hubei province in China. (b) Main urban area in Wuhan city. (c) Urban land use in study area.
Land 12 01802 g002
Figure 3. (a) Spatial distribution of LST in summer and (b) spatial distribution of LST in winter.
Land 12 01802 g003
Figure 4. Spatial distribution of land surface temperature based on different grid units.
Land 12 01802 g004
Figure 5. Mean summer (a) and winter (b) LST in the various urban land use types (A represents administration and public service land; B represents commercial and service facilities land; R represents residential land; M represents industrial land; E represents water area).
Land 12 01802 g005
Figure 6. Interactive detection results of urban form metrics on LST in summer (PA represents proportion of administration and public service land, PB represents proportion of business land, PR represents proportion of residential land, PM represents proportion of industrial land, PE represents proportion of water area, BD represents building density, SVF represents sky view factor, BH represents building height, and FAR represents floor area ratio).
Land 12 01802 g006
Figure 7. Interactive detection results of urban form metrics on LST in winter (PA represents proportion of administration and public service land, PB represents proportion of business land, PR represents proportion of residential land, PM represents proportion of industrial land, PE represents proportion of water area, BD represents building density, SVF represents sky view factor, BH represents building height, and FAR represents floor area ratio).
Land 12 01802 g007aLand 12 01802 g007b
Table 1. Summary of metric calculation methods.
TypeMetricCalculationDescriptionReferences
2DLand use type area ratio P L = S a B where S a is the total area of a certain land use type in the unit. B is the total area of the research unit.[57,58,59]
3DBuilding density B D = i = 1 n A i A where Ai is the base area of building i. A is the total area of the study area.[24,39,55,57]
Building height B H = i = 1 n H i n where Hi is the height of building i and n is the number of buildings.[24,39,55,60]
Floor area ratio F A R = i = 1 n A i H i A where Ai is the base area of building i. Hi is the number of floors of building in the unit. A is the total area of the study area.[24,39,43,55,57]
Sky view factor S V F = 1 2 π 0 2 π [ c o s β c o s 2 + s i n β c o s ( α ) ( 90 φ s i n φ c o s φ ) ] d θ The SVF is calculated by 3D vector estimation method, and the calculation process is described in the literature [61,62], which reflects the closeness degree of urban space.[35,40,56,60,63]
Table 2. The type of factor interaction.
JudgementTypes of Interactions
q(X1∩X2) < Min(q(X1), q(X2))Nonlinear weakening
Min(q(X1), q(X2)) < q(X1∩X2) < Max(q(X1), q(X2))Single-factor nonlinear weakening
q(X1∩X2) > Max(q(X1), q(X2))Two-factor enhancement
q(X1∩X2) = q(X1) + q(X2)Independent
q(X1∩X2) > q(X1) + q(X2)Nonlinear enhancement
Table 3. Testing for scale effects.
UnitPAPBPRPMPEBDBHSVFFARSum
SU.1500.0460.0620.0930.1470.4020.4490.3340.2340.3962.163
3000.0700.1040.1270.1740.4250.5150.2630.3300.4272.435
5000.1020.1550.1480.2090.4120.5260.2160.3730.4302.571
7000.1070.1650.1630.2330.2280.5380.1520.3850.4372.408
10000.1290.2140.1700.2740.3400.5180.1300.4240.4322.631
WI.1500.0090.0010.080.2260.1320.0500.1100.0290.0360.673
3000.0260.0050.0930.2540.1300.0640.1090.0520.0280.761
5000.0470.0090.0920.2740.1310.0510.1100.0650.0220.801
7000.0740.0210.1020.2790.1080.0440.1000.0780.0220.828
10000.0870.0230.1240.2720.1110.0360.1250.0690.0260.873
Note: The darker the color of the same indicator in different grid units, the higher the q value. PA represents proportion of administration and public service land, PB represents proportion of business land, PR represents proportion of residential land, PM represents proportion of industrial land, PE represents proportion of water area, BD represents building density, SVF represents sky view factor, BH represents building height, and FAR represents floor area ratio.
Disclaimer/Publisher’s Note: The statements, opinions and data contained in all publications are solely those of the individual author(s) and contributor(s) and not of MDPI and/or the editor(s). MDPI and/or the editor(s) disclaim responsibility for any injury to people or property resulting from any ideas, methods, instructions or products referred to in the content.

