Abstract
As the construction of photovoltaic power plants continues to expand, investors have placed great importance on the suitability assessment of site selection. In this study, we have developed a multi-level evaluation system and proposed an AHP–XGBoost–GIS comprehensive evaluation model for assessing site suitability in the Beijing–Tianjin–Hebei region. The findings revealed that approximately 48,800 km2 (21.59% of the total area) constituted a suitable area in this region, surpassing previous research results. Generally suitable areas accounted for the largest proportion at 35.89%. Suitable areas in Beijing and Tianjin were relatively limited, with most of them concentrated in Baoding City, Zhangjiakou City, and Chengde City on the northwest side of the “Yanshan-Taihang Mountains”, where there are ample wastelands with gentle slopes conducive to constructing photovoltaic power plants southeast of the “Yanshan-Taihang Mountains”, and solar radiation conditions were better. However, ecological and economic factors restricted suitable areas resulting in smaller coverage including cities such as Handan, Xingtai, Qinhuangdao, and Tangshan, among others. This study successfully overcame limitations associated with traditional subjective evaluation methods by providing decision support for regional energy allocation planning and spatial planning efforts, as well as environmental protection endeavors.
1. Introduction
The rapid growth of the global economy necessitates significant resource consumption, while excessive greenhouse gas emissions have led to global climate warming, posing severe threats to the Earth’s ecological environment and human survival. The findings of the IPCC Sixth Assessment Report indicate that between 2011 and 2020, there has been a 1.1 °C increase in global surface temperature compared to the period from 1850 to 1900, primarily due to human activities’ greenhouse gas emissions [1]. China, as the world’s second largest economy, heavily relies on fossil fuel consumption (accounting for over 80%) and ranks first globally in carbon dioxide emissions [2,3,4,5]. In line with its carbon neutrality target, the Chinese government aims to establish a clean and efficient power system by striving for non-fossil energy consumption exceeding 80%, thereby ensuring sustainable social development [6,7]. Solar energy resources possess advantages such as easy accessibility, wide distribution, and low pollution. Their clean and low-carbon attributes play a crucial role in achieving carbon neutrality goals [8]. Furthermore, China’s government-led photovoltaic poverty alleviation project has significantly improved living standards for populations residing in impoverished areas [9,10].
The suitability assessment of photovoltaic power plant sites is a prerequisite for solar energy resource development. Researchers have employed various technological methods such as mathematical modeling, artificial intelligence, and geographic information systems to evaluate the suitability of different regions for photovoltaic power plant site selection. For instance, Naren Huali utilized a fuzzy comprehensive evaluation model to assess the priority levels of different sites [11]. Yanwei Sun et al., considering geographical spatial constraints, used a random forest model to predict optimal installation locations and found that the highly suitable installation areas accounted for 4.6% of China’s total land area [12]. Younes Noorollahi et al. established optimal site selection criteria and employed fuzzy Boolean logic and the Analytic Hierarchy Process (AHP) method to determine the best installation locations for photovoltaic systems in Khuzestan province, Pakistan. The results indicated that Izeh, Bandar-e Mahshahr, and Bagh-e Malek were highly suitable areas for constructing photovoltaic power plants in this province [13]. Simultaneously, numerous studies have been conducted to assess the suitability of photovoltaic power plant sites on various regional scales. Šúri Marcel et al. was the first to evaluate solar resources globally [14]. In recent years, research on photovoltaic power plant construction suitability has focused on regions such as Africa, Southeast Asia, and the European Union [15,16,17,18]. A considerable portion of these studies tends to analyze individual technical factors that influence construction suitability, such as sunlight conditions and slope. Farzam Hasti et al. proposed a GIS-based site selection method to explore the potential of solar photovoltaic generation fields in Kurdistan province, Iran; they discovered that high-suitability areas had the capacity to generate 3.2% of Iran’s total electricity consumption [19]. Brahim Haddad et al. developed a coupled model integrating multi-criteria decision-making techniques with geographic information systems (GIS) to evaluate the suitability of photovoltaic power plants in Algeria [20]; their results proved more scientifically sound than remote sensing index evaluations.
Depending on the chosen criteria, a simple spatial overlay method may overlook the varying degrees of influence of each factor in different regions, leading to an inaccurate assessment of boundary extent. However, relying solely on mathematical modeling or machine learning algorithms to evaluate the weight of influencing factors poses challenges such as data redundancy between indicators, complex calculation processes, high sample requirements and reduced accuracy. In this study, we adopt the horticultural forest frass and photovoltaic complementary space model [21,22,23] proposed by the Chinese government and develop a multi-level site suitability evaluation system based on factors such as urban density, solar radiation conditions, and vegetation coverage. To determine factor weights, we propose a comprehensive evaluation model named AHP–XGBoost–GIS that integrates the subjectivity of the Analytic Hierarchy Process (AHP) with the objectivity of eXtreme Gradient Boosting (XGBoost). The Photovoltaic Development Suitability Index (PDSI) is proposed for the quantitative evaluation of photovoltaic power plant construction suitability. Concurrently, GIS spatial analysis technology is employed to achieve a spatial visualization display, thereby providing scientific recommendations for photovoltaic power plant construction planning.
The Beijing–Tianjin–Hebei region serves as the economic hub of northern China [24,25,26,27], and the establishment of photovoltaic power plants in this area presents an opportunity to reduce power transmission costs and mitigate greenhouse gas emissions [28]. As the scale of photovoltaic power plant construction expands, available land resources are gradually diminishing [29]. Consequently, investors seek to maximize their returns on investment by identifying the most suitable areas for construction [30,31,32,33]. This study aims to develop a suitability evaluation model that streamlines traditional location selection methods, reducing labor and time costs while enabling rapid preliminary assessments of potential photovoltaic power field locations within the study area. Furthermore, this research explores the applicability of the evaluation model across various land types and clarifies operational strategies for integrating parallel photovoltaic power generation with agricultural production on agricultural lands. Through these efforts, this study expands the range of suitable locations for mountainous areas’ photovoltaic electric fields and enhances land potential. In summary, the research findings can offer decision making assistance to investors, practical applications in domains such as mountainous and agricultural land, and technical support for renewable energy institutions to achieve enhanced production efficiency.
2. Materials and Methods
2.1. Study Region
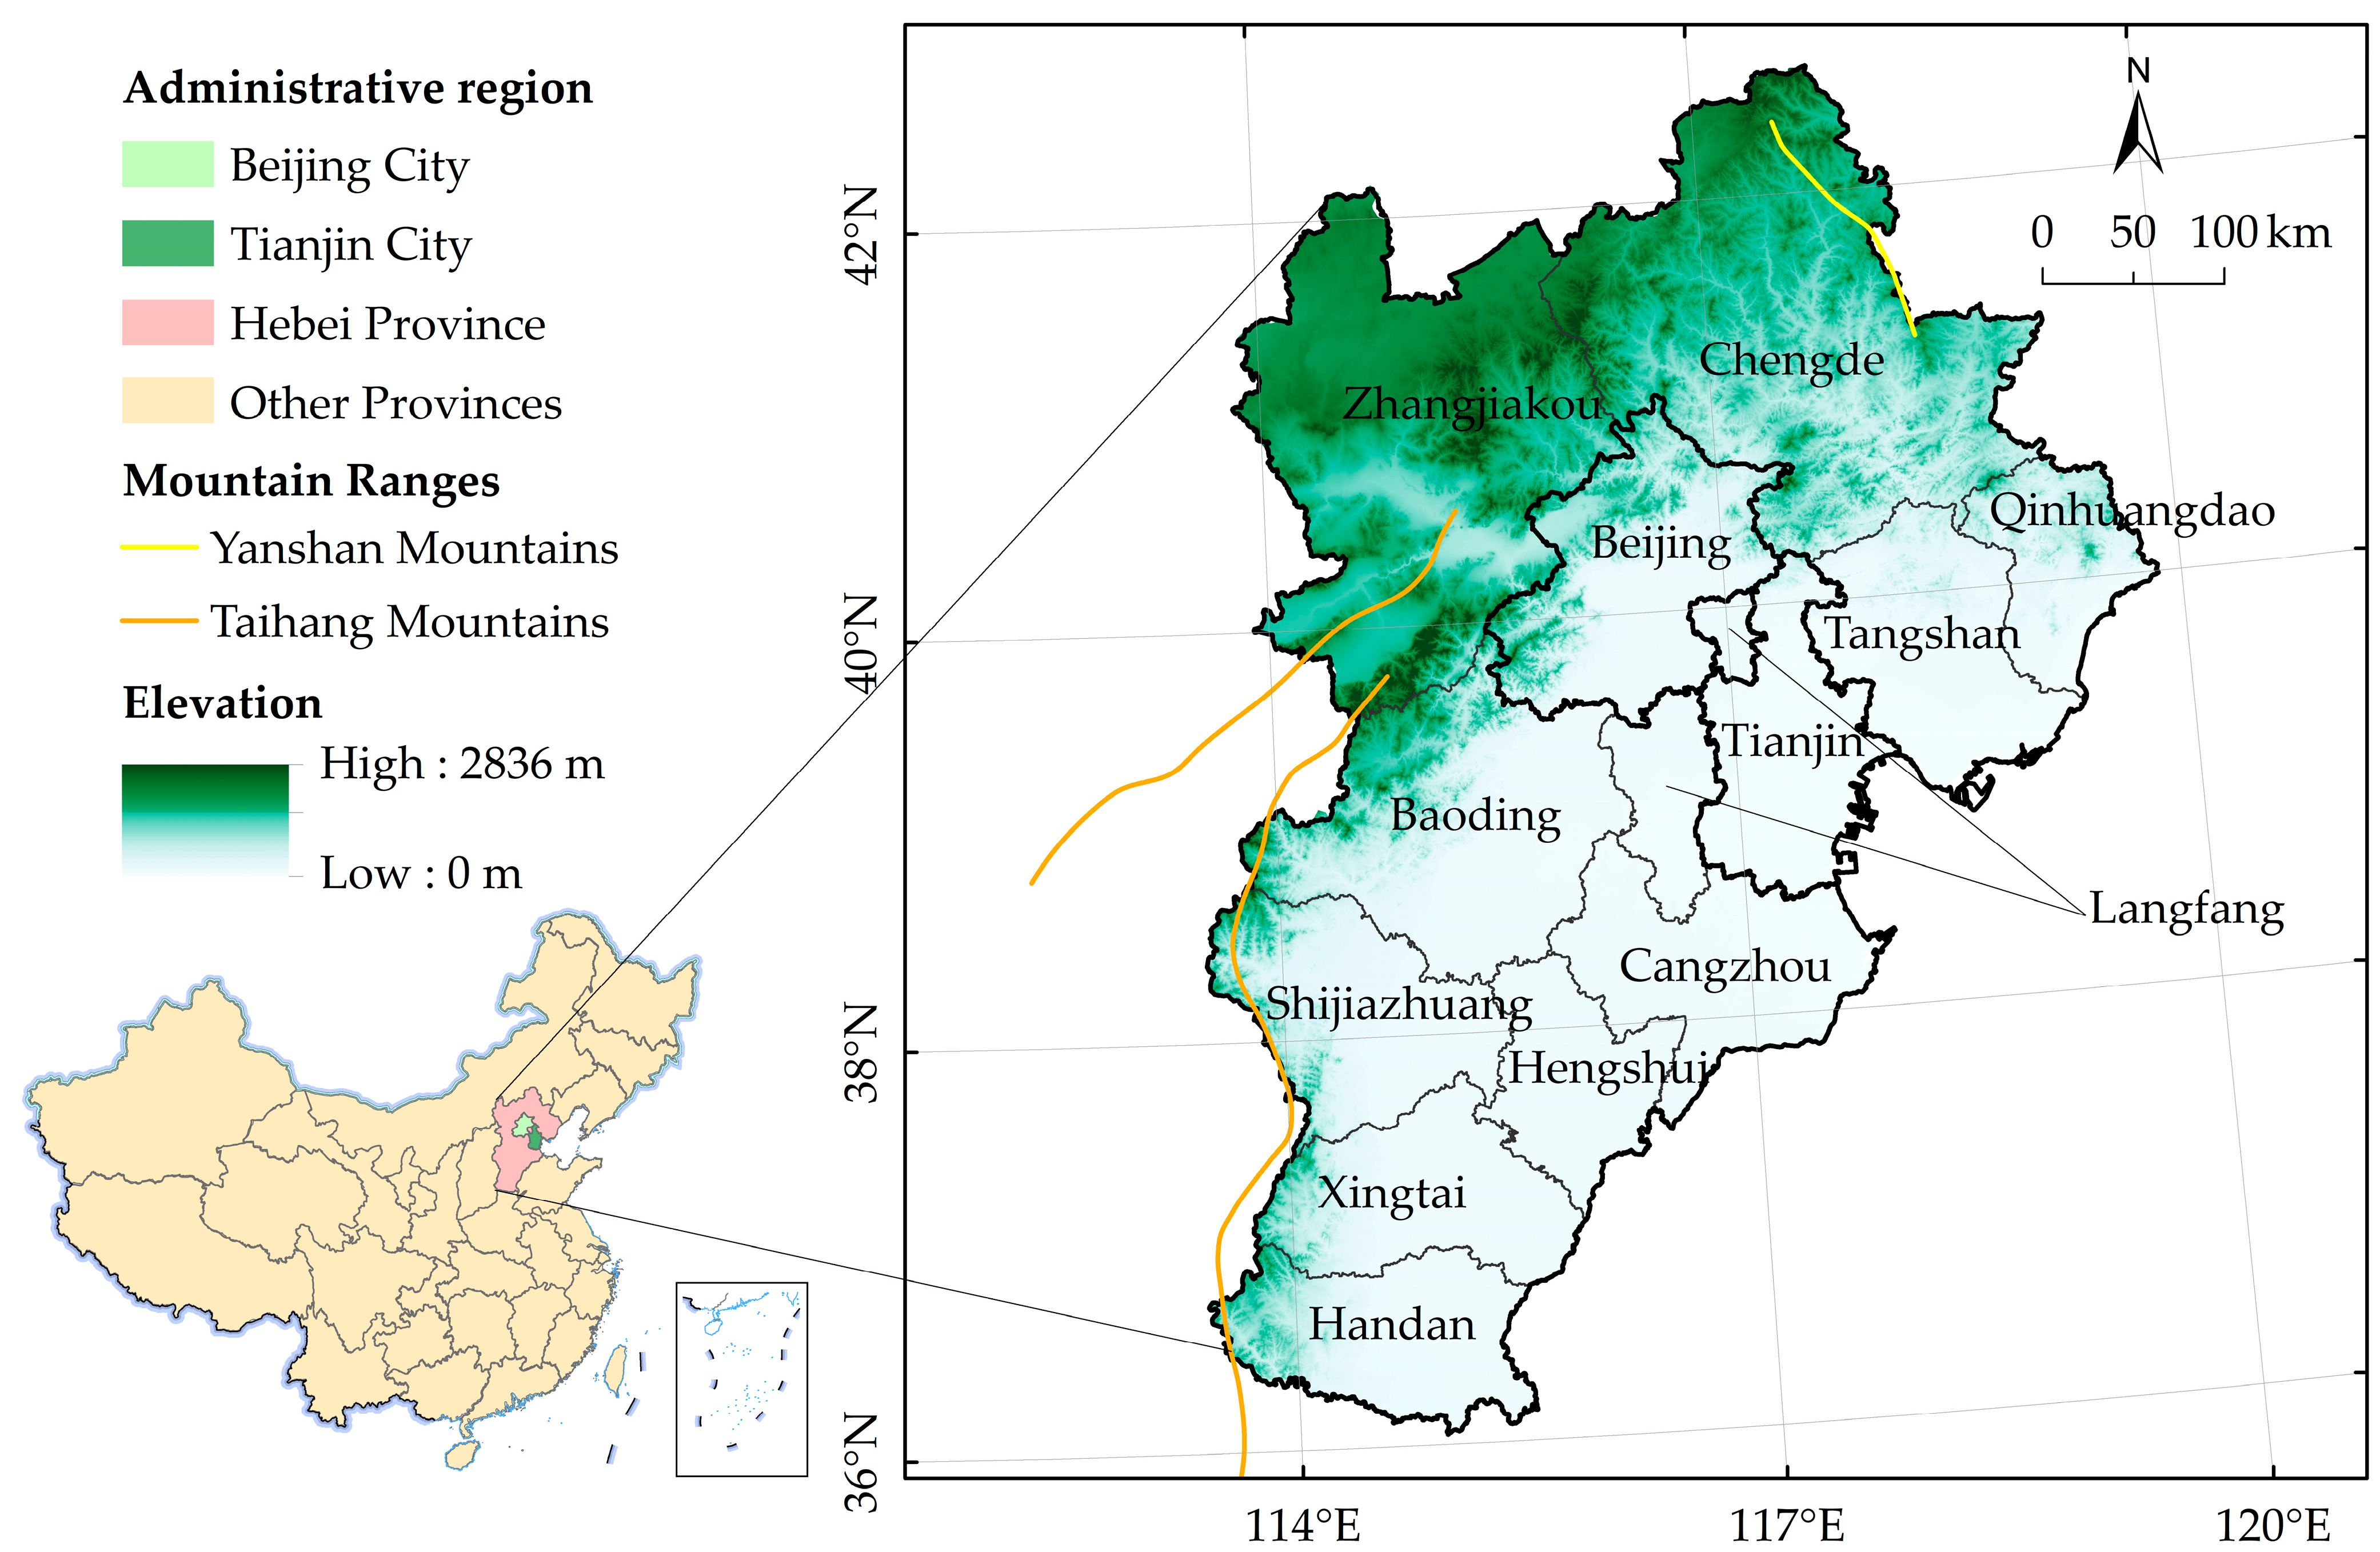
The study region encompasses Beijing, Tianjin, and Hebei Province, situated between 113°04′ and 119°53′ east longitude and 36°01′ and 42°37′ north latitude, covering an expanse of 217,158 km2. Located in the northern part of the North China Plain, the Beijing–Tianjin–Hebei region is bounded by the Yanshan Mountains to the north and the North China Plain to the south. It is flanked by the Taihang Mountains to its west and faces Bohai Bay to its east (Figure 1). The topography gradually slopes from northwest to southeast in this region, benefiting from favorable solar conditions that have resulted in an average annual total solar radiation exceeding 5057.62 MJ/m2 over the past decade [28]. As of 2022, its annual GDP has reached CNY 10,029.3 billion (approximately USD 1.5 trillion), accounting for more than 10% of China’s total GDP [34]. With fossil fuels contributing approximately 86% towards power generation, there exists a pressing imperative for renewable energy development due to an annual electricity consumption rate of 5840 × 108 kWh per year [35].
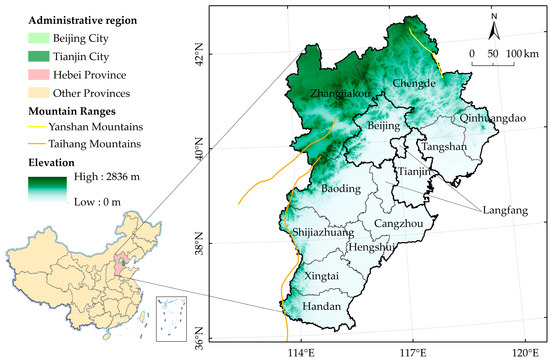
Figure 1.
Location of Beijing–Tianjin–Hebei region.
2.2. Data Source and Preprocessing
The necessary data for this study comprise meteorological data, terrain and landform data, land use data, vegetation index data, nighttime light data, fundamental geographic feature data, and statistical data. Table 1 presents the key data and sources of the aforementioned datasets.

Table 1.
Key data and sources.
To standardize the data, ArcGIS Desktop 10.8.1 software was utilized in this study to extract data from various sources and resample them into 100 m × 100 m grids as the fundamental evaluation unit. The data are current as of 2015.
2.3. Subjective and Objective Comprehensive Suitability Evaluation Method for Photovoltaic Power Plants
The AHP and fuzzy comprehensive evaluation method are commonly used as representative mathematical modeling methods to determine optimal site locations [36,37,38,39,40]. However, these methods face challenges in terms of computational complexity due to excessive evaluation indicators and their inability to address issues such as redundant data among indicators. On the other hand, machine learning algorithms like random forest and supervised learning algorithms are often employed for this purpose but have drawbacks such as high sample requirements and relatively low accuracy.
The present study proposes an integrated evaluation model, AHP–XGBoost–GIS, that combines AHP weights for suitability factors with the XGBoost. We introduce a suitability evaluation indicator called the Photovoltaic Development Suitability Index (PDSI) and use Geographic Information System (GIS) technology for spatial analysis. This model aims to provide scientific recommendations for selecting future photovoltaic power plant sites in the Beijing–Tianjin–Hebei region.
2.3.1. Principle of AHP
AHP is a decision analysis method, which performs qualitative and quantitative analysis by constructing a hierarchical structure and judgment matrix to solve multi-criteria decision problems [41,42,43].
It generally includes the following four steps:
Step 1: establish a hierarchical structure model.
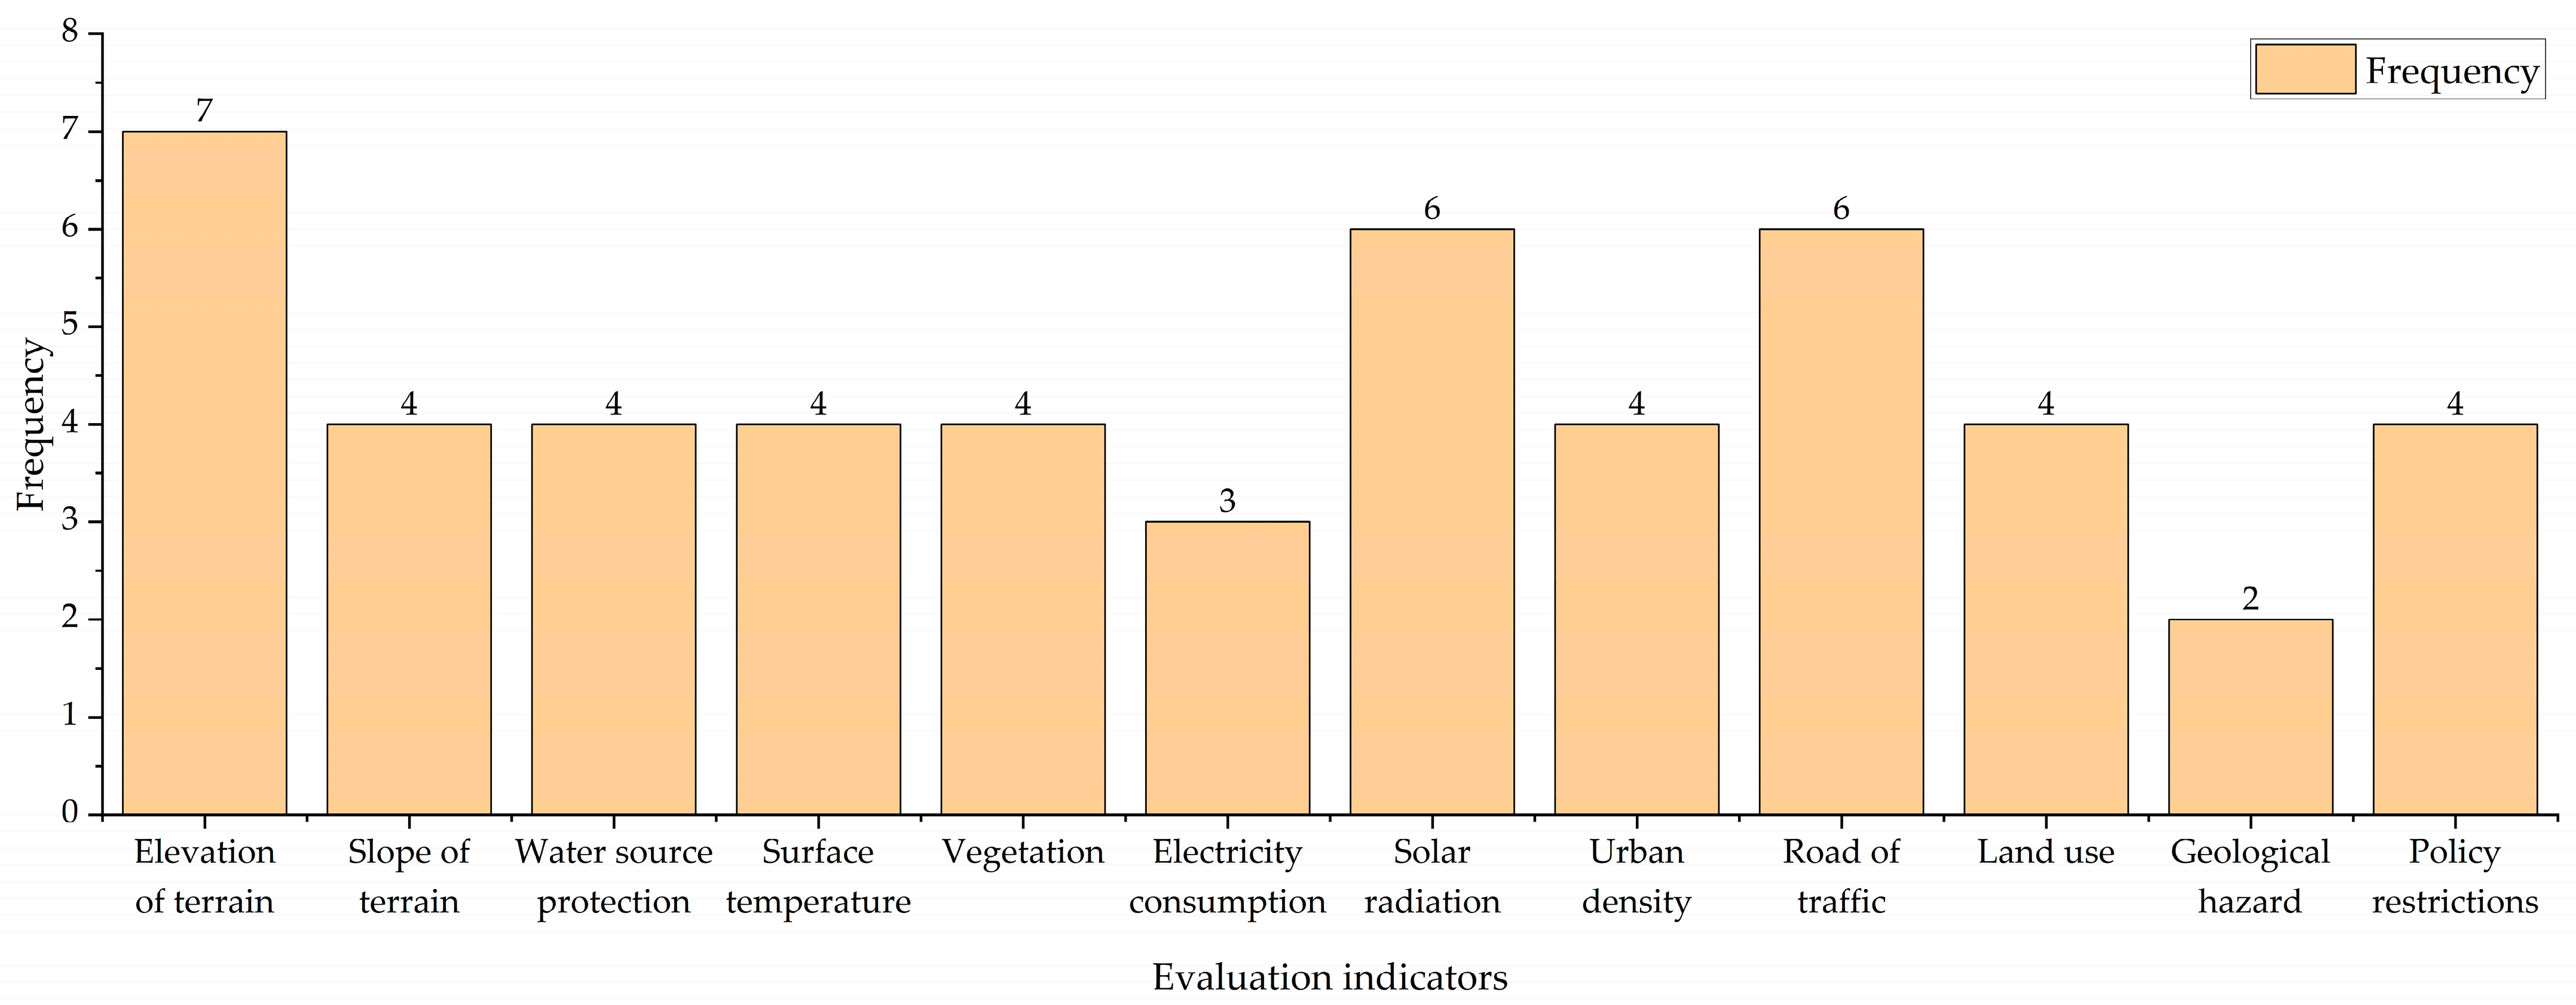
The factors influencing the site selection process of photovoltaic plants are relatively intricate. Currently, the government is actively promoting the rapid construction of high-voltage outgoing channels in the study area, which has significantly reduced the impact of power route accessibility on the suitability of photovoltaic plants [44,45]. Simultaneously, the government encourages ground-based photovoltaic projects to be located in areas with available capacity, thereby exempting the need for energy storage facilities [46]. Consequently, this study extensively analyzed various factors suitable for constructing photovoltaic power stations [36,47,48,49,50,51,52,53,54], and ultimately determined the appropriate factors for the study area (Figure 2). The determination of suitability evaluation factors in this study was based on both their applicability to the study area and their frequency of use as evaluation indicators.
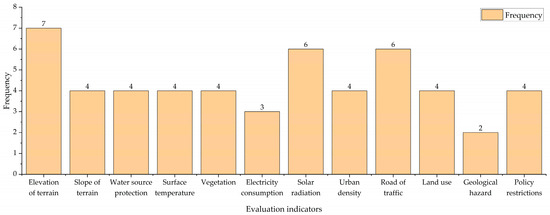
Figure 2.
Frequency statistics of evaluation indicators.
On this basis, a three-layer suitability evaluation system is established, including the target layer, the criterion layer and the index layer. In this study, the suitability assessment system is classified into three hierarchical levels: target level, criterion level, and indicator level (Table 2). The ecological suitability criterion primarily concerns the natural limitations imposed on photovoltaic plants, while economic suitability evaluates the costs associated with constructing and operating a photovoltaic farm. Land suitability considers both land costs and policy constraints related to photovoltaic plants.
Table 2.
Description of evaluation index system for AHP.
Step 2: construct judgment matrix model and assign value.
Based on the Delphi method, this study involves experts scoring the relative importance of indicators within the same level. The scale for relative importance ranges from 1 to 9 [55], with detailed explanations of the assigned values provided in Table 3.
Table 3.
9-level quantitative scaling of indicators.
, . In the formula, represents the comparison result of the factor relative to the j factor; is called the pairwise comparison matrix.
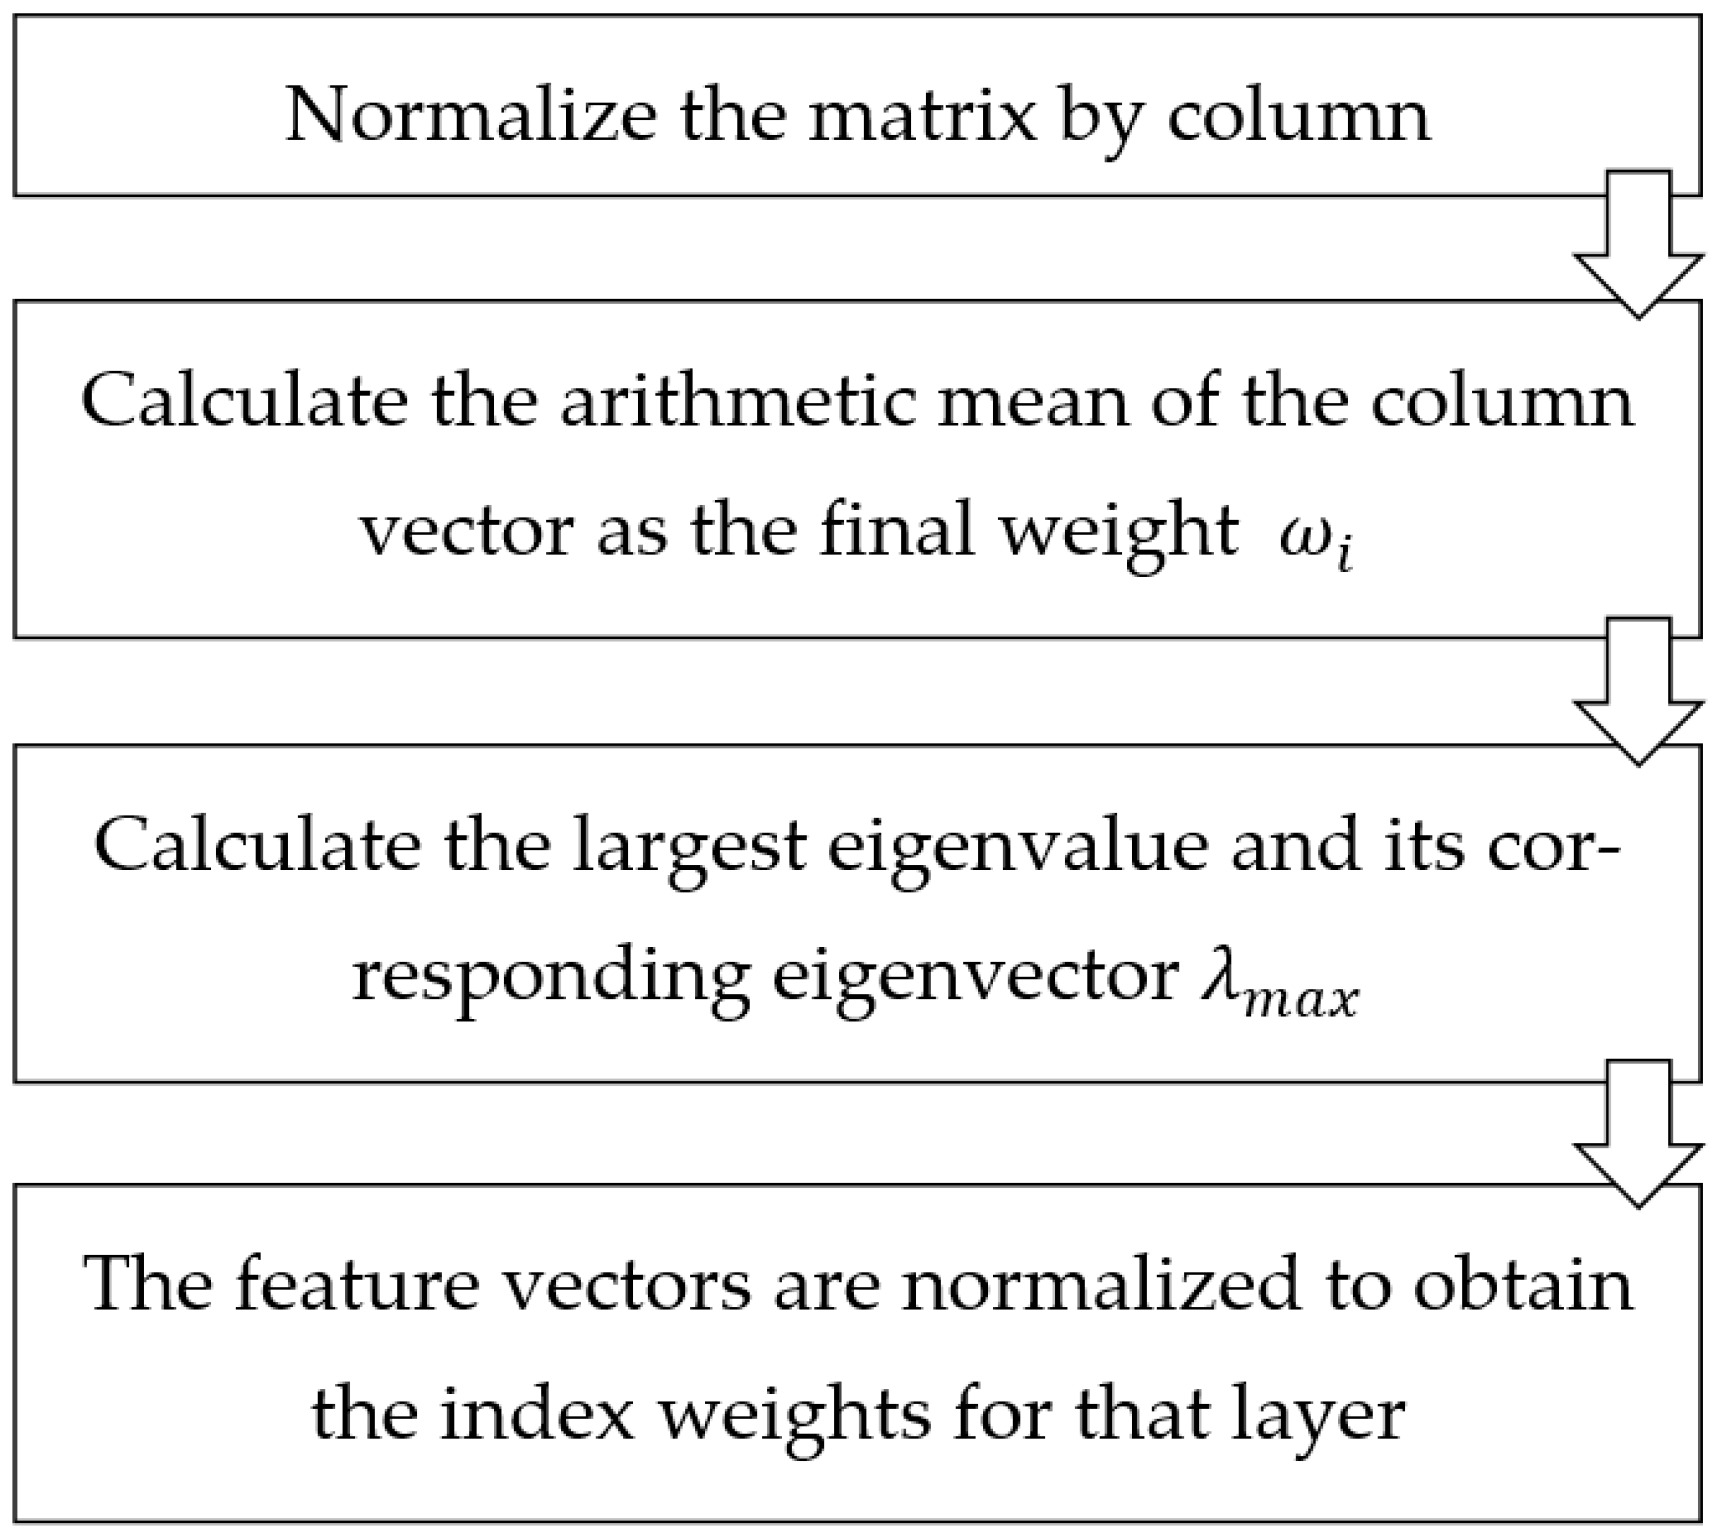
Step 3: hierarchical single sort to calculate the weight vector.
In this study, the sum method is used to calculate the weight vector [56]. The procedure is illustrated in Figure 3.
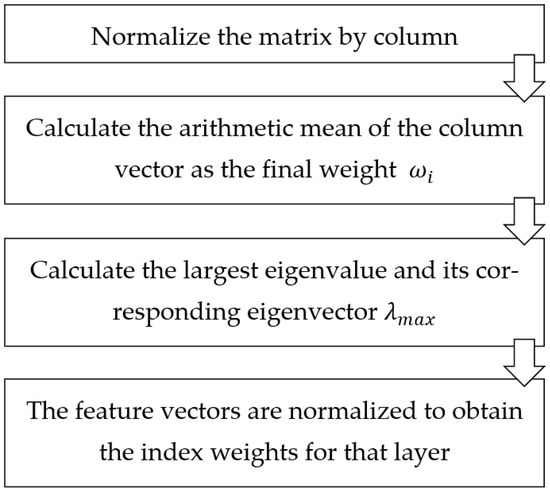
Figure 3.
The procedure for computing the weight vector.
Step 4: consistency test.
Calculate the consistency index ():
Calculate the consistency ratio ():
where n is the order of the judgment matrix. Where is obtained by looking up the table according to the order of the judgment matrix. When , the consistency of judgment matrix is considered acceptable. When , the judgment matrix needs to be modified.
2.3.2. The Principle of the XGBoost Distributed Gradient-Boosting Library
XGBoost is a supervised learning algorithm proposed by Li in 2019 [57]. XGBoost can predict samples with high uncertainty by creating multiple decision trees [58]. The process of evaluating the suitability of photovoltaic power plant construction is as follows:
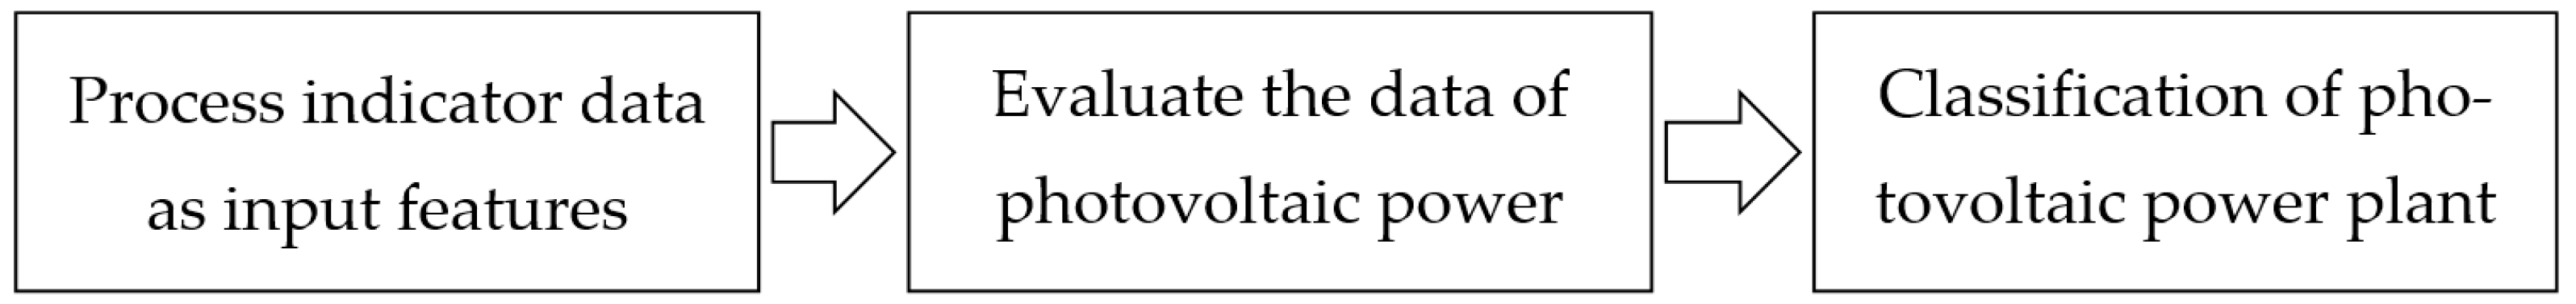
Step 1: data preprocessing.
Taking the index data after correlation analysis and feature selection as input features, according to the selection of state variables and the construction of index system [59], the photovoltaic power plant dataset is proportionally divided into training set and test set (Figure 4).

Figure 4.
The flow of data preprocessing.
Step 2: model parameter optimization.
The photovoltaic power plant location suitability evaluation model is trained and tested using training set data and test set data, respectively. Through the grid search method, the given value interval is searched sequentially, and then the next parameter with great influence is tuned [60] after finding the optimal value, until all the parameters are tuned (Figure 5).

Figure 5.
The flow of model parameter optimization.
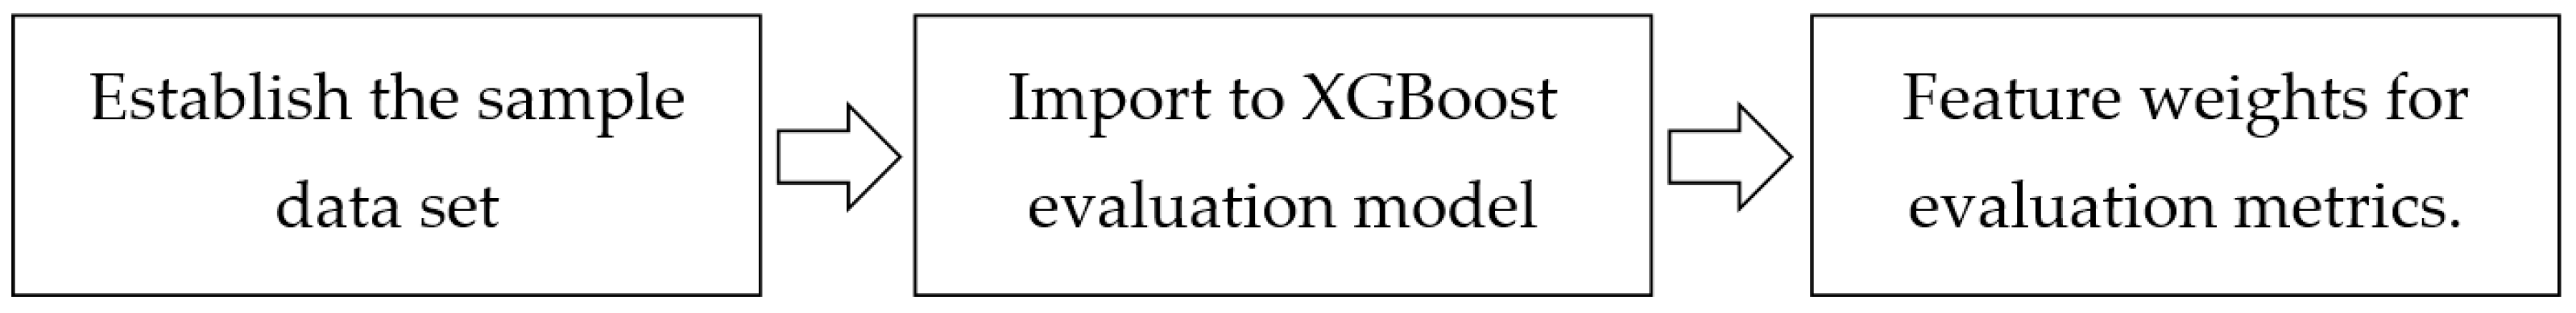
Step 3: model index evaluation after parameter tuning
After parameter tuning, the established sample dataset will be imported into the XGBoost evaluation model, and the XGBoost model uses the black box method to evaluate the feature weight of the index [61] (Figure 6).
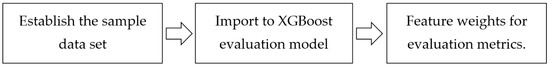
Figure 6.
The flow of model index evaluation.
2.3.3. Principle of Combination Weight Calculation
Assuming that the subjective weight of a target in the evaluation index system is obtained by AHP, then its objective weight can be measured using the XGBoost model, and its comprehensive weight can be measured using the combination weighting method of AHP and XGBoost model.
To minimize discrepancies between the comprehensive weight , subjective weight from the AHP, and objective weight from the XGBoost model, we have devised an objective function to optimize results.
The minimum value of the sum of squared deviations between two variables can be calculated when the first derivative of the objective function equals 0. At this critical point, the optimal solution is achieved with a = 0.5.
The optimal approach for evaluating and selecting photovoltaic field development sites is the combination weighting method, which equally incorporates subjective weights from the AHP and objective weights from the XGBoost model (50% each).
2.3.4. Principle of Evaluation of the Suitability of Solar Power Plants through Geographic Spatial Analysis
The Photovoltaic Development Suitability Index (PDSI) is proposed in this study, which refers to the accumulation of the normalized photovoltaic development suitability index and its corresponding index weight within the study area. This index facilitates the conversion of intricate spatial data into a comprehensive indicator, enabling maximum retention of original information. Additionally, GIS spatial analysis technology enables spatial visualization. The formula is presented as follows:
represents the weight of the -th index.; represents the -th normalized evaluation index. The construction of a photovoltaic power plant is more suitable as the index value increases.
2.4. The Detemination of Weight for Evaluation Indicators
2.4.1. The Weighted Evaluation of Metrics Based on AHP
The weights of each indicator can be calculated by establishing four discrimination matrices: the criterion level discrimination matrix (Matrix A, Table 4), the ecological suitability discrimination matrix (Matrix B1, Table 5), the economic suitability discrimination matrix (Matrix B2, Table 6), and the land suitability discrimination matrix (Matrix B3, Table 7).
Table 4.
Matrix A.
Table 5.
Matrix B1.
Table 6.
Matrix B2.
Table 7.
Matrix B3.
- Criterion level discrimination matrix:
Calculate the maximum eigenvalue:
The eigenvector corresponding to the maximum eigen root:
Pairwise comparison matrix deviates from the consistency index:
Random consistency ratio:
According to the definition of consistency check, a value less than 0.1 confirms good uniformity in the matrix; otherwise, adjustments are necessary. The results indicate that this matrix satisfies the requirements for consistency check and thus validates its reliability.
- 2.
- Indicator level discrimination matrix:
The maximum eigenvalues are calculated, respectively:
The eigenvectors corresponding to the largest eigen root are:
The deviation consistency indices of the pairwise comparison matrix are:
The random consistency ratios are:
According to the definition of consistency check, a value less than 0.1 confirms good uniformity in the matrix; otherwise, adjustments are necessary. The results indicate that this matrix satisfies the requirements for consistency check and thus validate its reliability.
- 3.
- Indicator level discrimination matrix:
Calculate the average of the separate ranking vectors of the 3 indicators at different levels to obtain the optimal result.
The weight vector of each index in the target layer–criterion layer is:
The weight vector of each index in the criterion level–indicator level are:
Let the weight of each indicator in the indicator level about the criterion layer be ; is the criterion layer indicator, and is the indicator of the indicator layer. The weight of the criterion layer with respect to the target layer is ; then, the comprehensive weight of the indicators of the sub-criterion layer with respect to the overall target is , so the weight vector of the total ranking of the indicators of the sub-criterion layer [62] can be calculated as:
2.4.2. The Weighted Evaluation of Metrics Based on XGBoost
According to the hierarchical evaluation system, ecological suitability, economic suitability, and land suitability are chosen as primary indicators (Table 8).
Table 8.
Evaluation index system for XGBoost.
The study includes both operational and non-operational photovoltaic power plants as samples, with the observation period set in 2015. The dataset is categorized into positive samples (labeled as “1”) and negative samples (labeled as “0”), utilizing 10 vulnerability indicators as inputs for the XGBoost algorithm. Two-thirds of the samples are randomly allocated to the training set, one-third to the test set, and an additional 400 sample points are selected at random for validation purposes. By comparing the operational photovoltaic plant samples with the non-operational ones, the results can be seen in Table 9.
Table 9.
Comparative analysis of built photovoltaic samples and unbuilt photovoltaic samples.
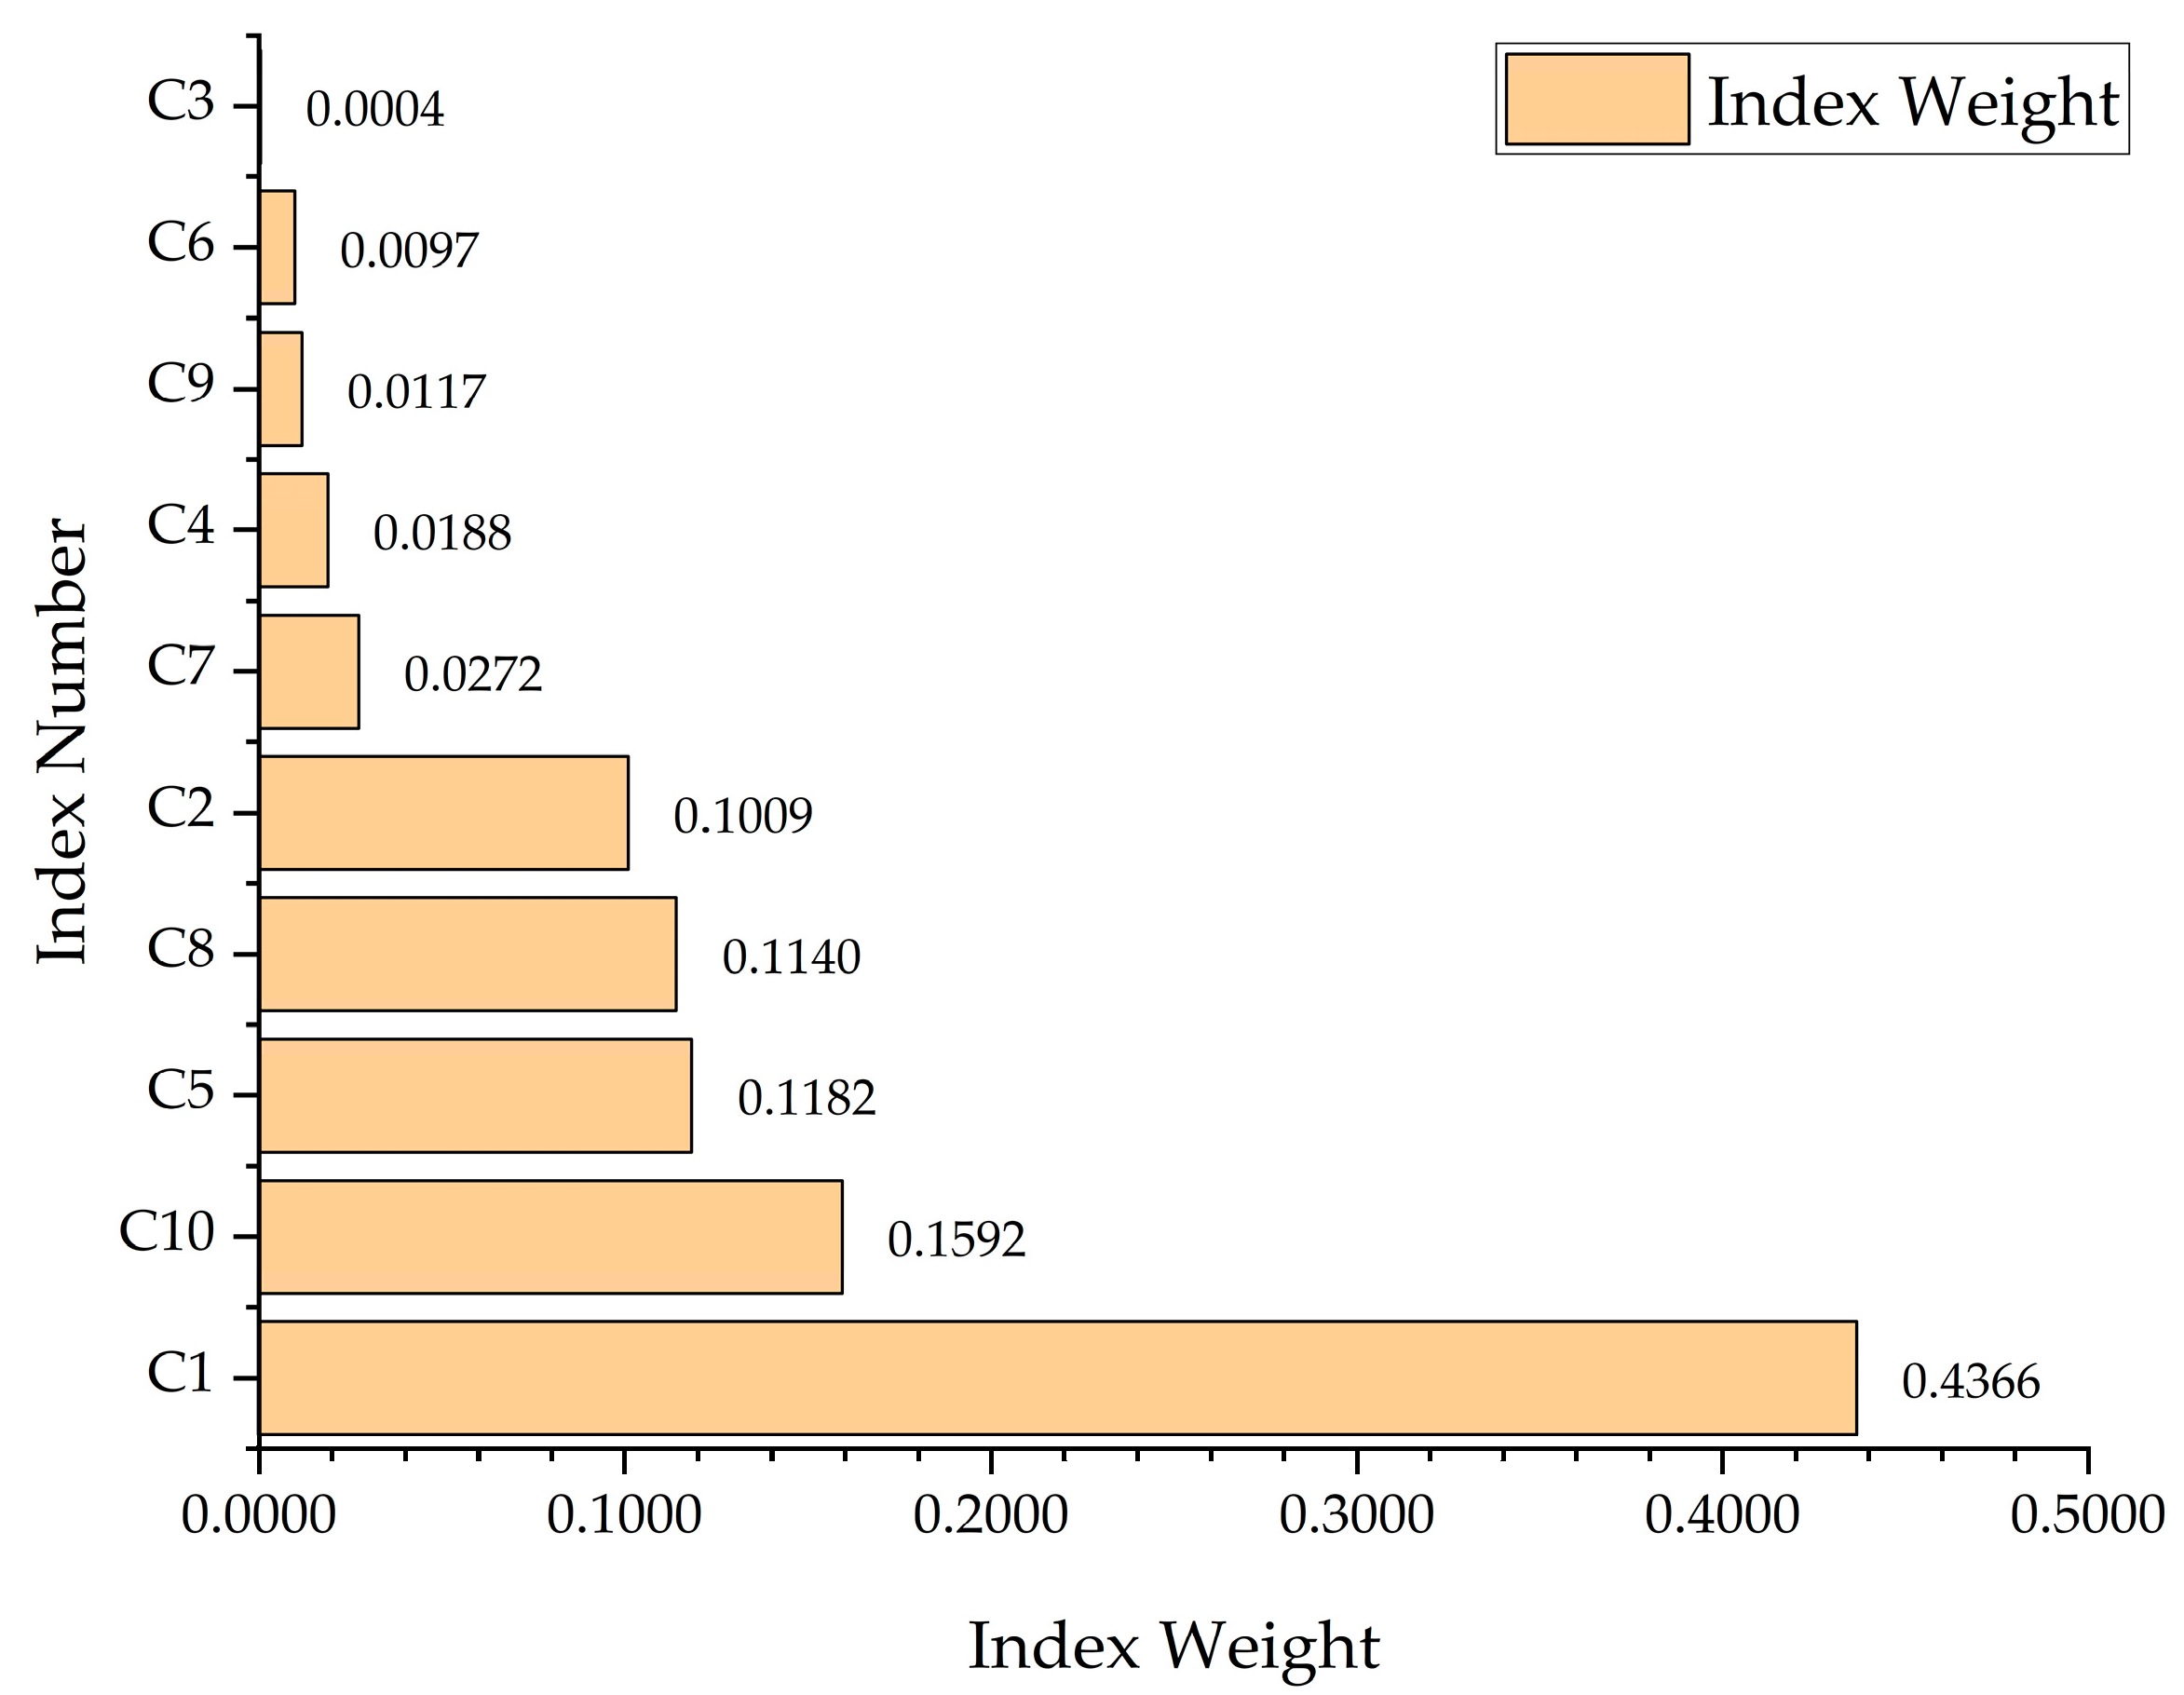
The parameters of the XGBoost evaluation model were optimized by cross-validation [63]. The classification error rate of the training set and the test set was taken as the evaluation index of the model, and the optimal parameters of the evaluation model for the suitability of photovoltaic power plant construction were obtained by multiple parameter adjustment. When n_estimators = 1000, learning_rate = 0.1, max_depth = 5, min_child_weight = 1, gamma = 0, subsample = 0.8, colsample_bytree = 0.7, the XGBoost model has a good modeling result, and based on this, a photovoltaic power plant construction suitability evaluation model is established to evaluate the role of variables (Figure 7). The Combination weight is ultimately derived (Table 10).
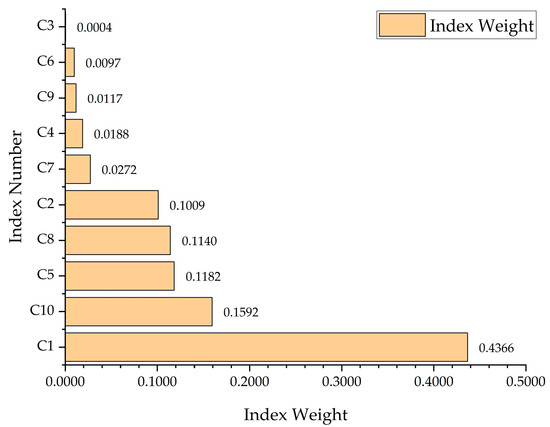
Figure 7.
Importance ranking of overall eigenvalues of XGBoost model.
Table 10.
Weight of Combination.
2.4.3. Evaluation of the Suitability of Solar Power Plants through Geographic Spatial Analysis
The weighted sum of each assessment unit was performed using ArcGis software to obtain the value of each assessment unit. The natural breakpoint method [64] was employed to categorize the index into areas of unsuitability, lower suitability, moderate suitability, higher, and very high suitability, and the overall evaluation of photovoltaic power plant construction in the Beijing–Tianjin–Hebei region was completed.
3. Results and Analysis
3.1. Standardized Processed Data of Suitability Evaluation Factors
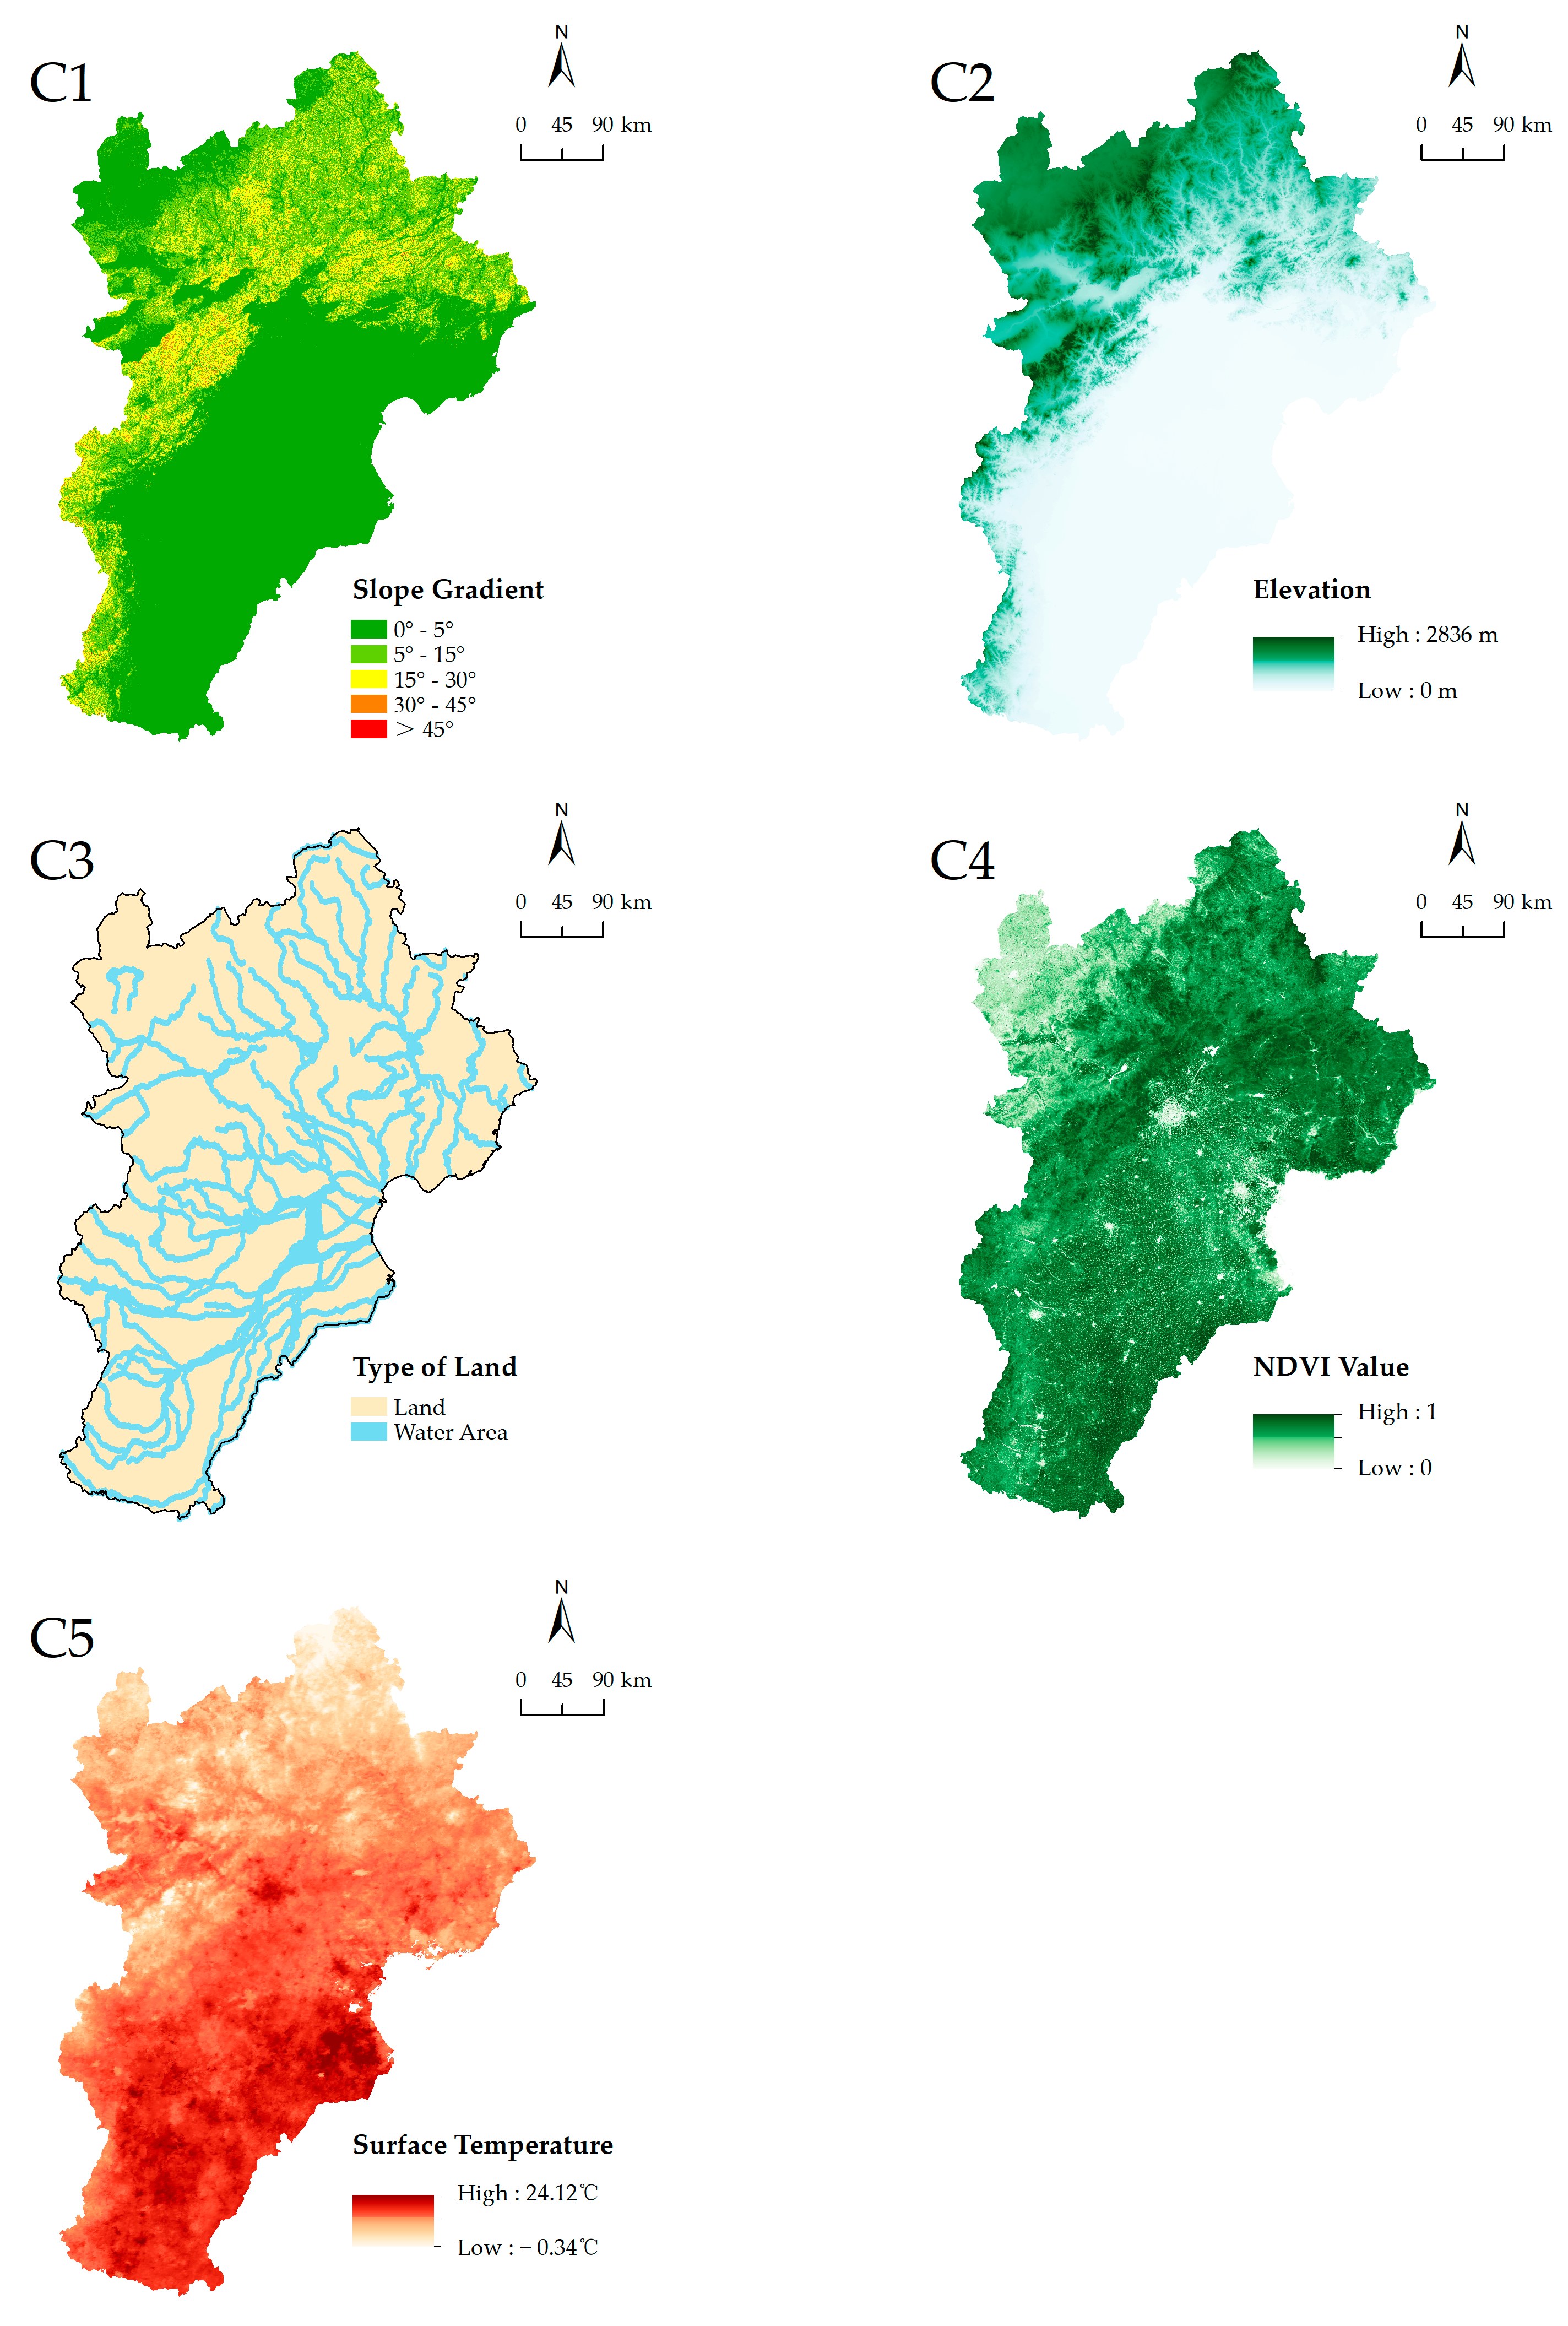
The elements of the ecological suitability assessment encompass sensitivity towards terrain elevation (C1), slope gradient (C2), water source protection area sensitivity (C3), vegetation coverage sensitivity (C4), and surface temperature sensitivity (C5). The factors include variables like slope gradient, terrain elevation, water source protection areas, NDVI values, and surface temperature. This characterization is achieved through geographic spatial processing of the data (Figure 8).

Figure 8.
Ecological suitability assessment factors.
The economic suitability evaluation factors encompass solar radiation conditions (C6), electricity consumption elasticity coefficient (C7), urban density (C8), and transportation convenience (C9). These factors are characterized by the total solar radiation, NLI value, urban core buffer area, and road distribution, respectively. Figure 9 presents the results of geographic spatial analysis conducted on the processed data.
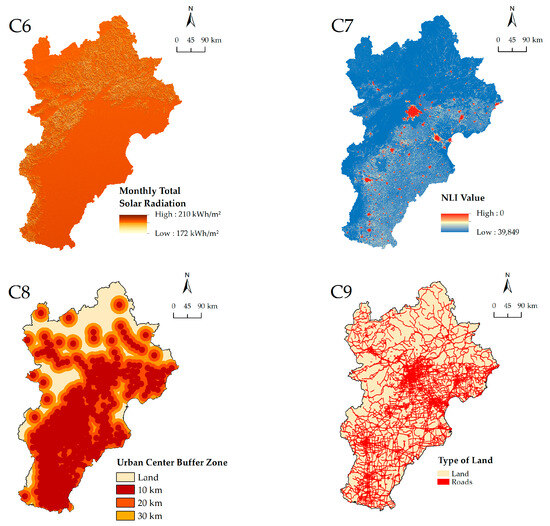
Figure 9.
Economic suitability evaluation factors.
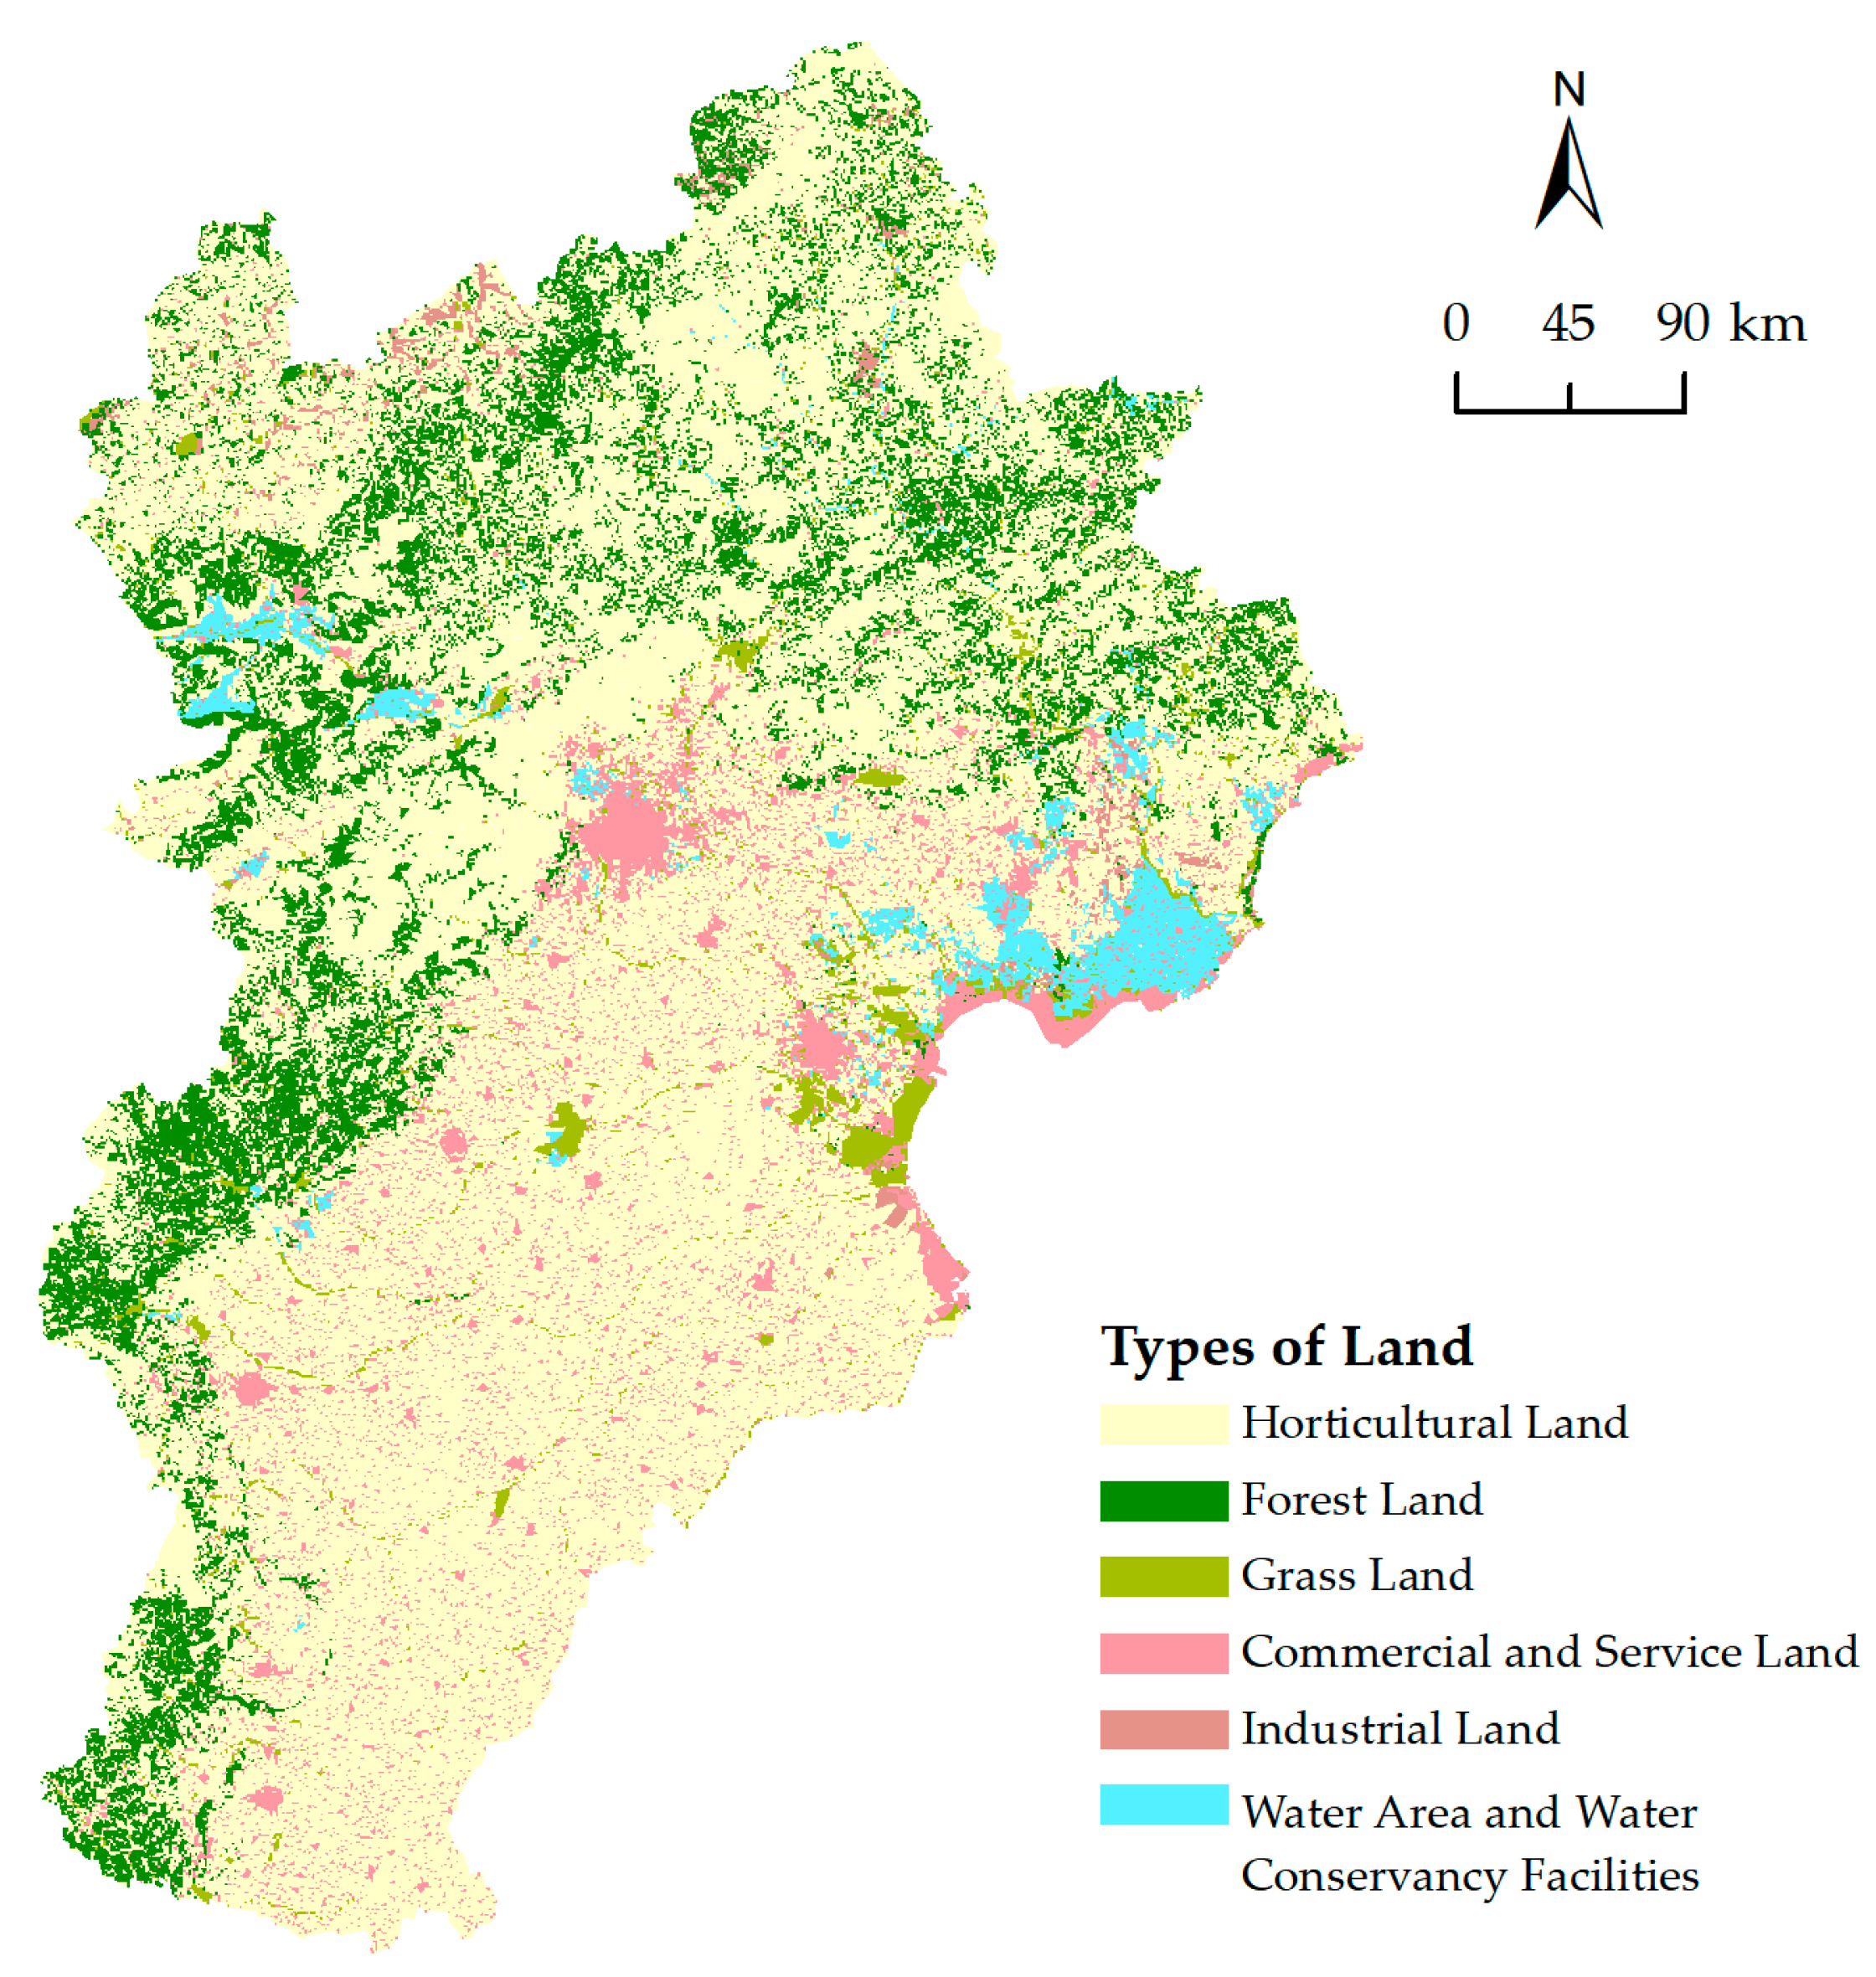
3.2. Standardized Processed Data of Land Cover
The land cover categories in the study area are classified into six distinct types, encompassing horticultural land, forest land, and various other forms of land utilization. Figure 10 illustrates the outcomes of geographical spatial analysis conducted on the processed data.
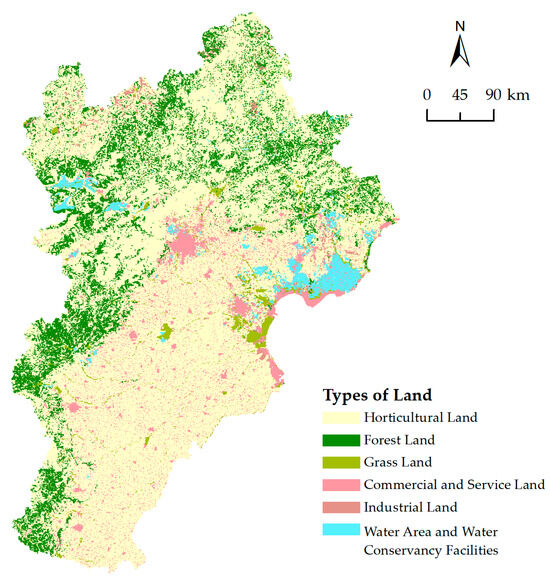
Figure 10.
Elements of land suitability evaluation.
3.3. Evaluation of Photovoltaic Electric Field Location
3.3.1. Overall Evaluation of the Beijing–Tianjin–Hebei Region
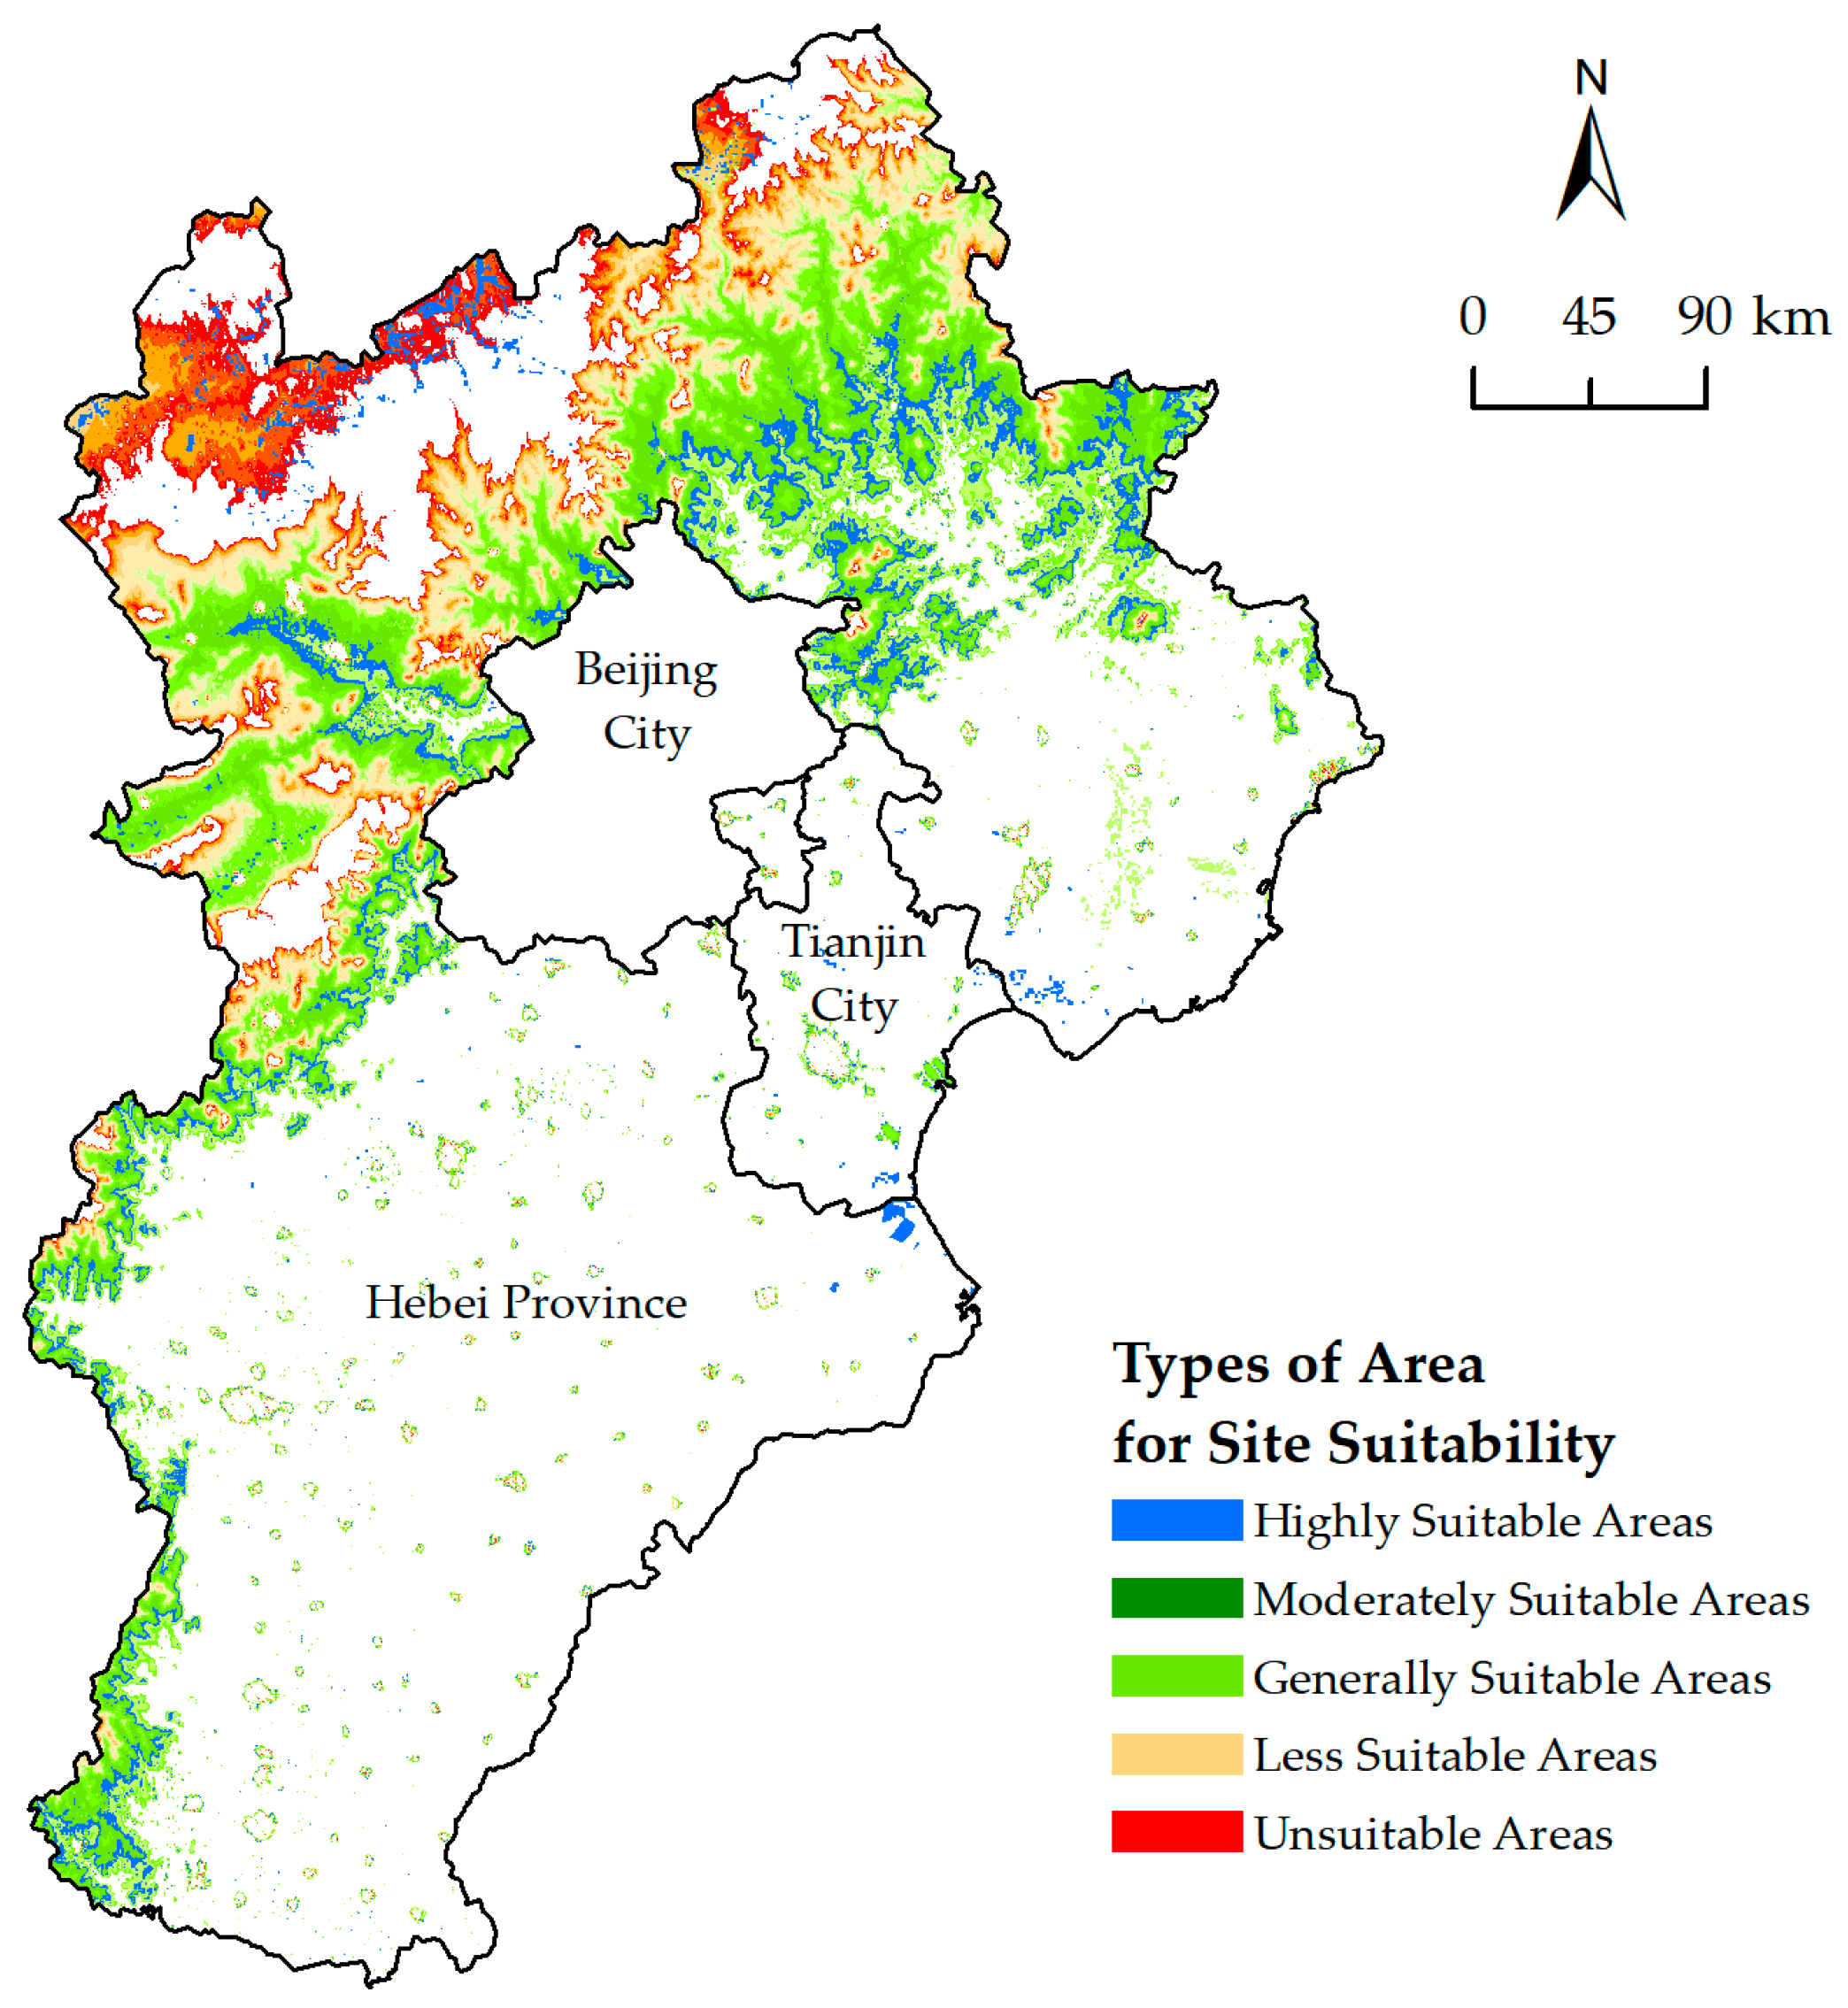
Utilizing the natural breakpoint method, the PDSI range in the Beijing–Tianjin–Hebei region is categorized into unsuitable areas (0.400–0.475), less suitable areas (0.475–0.525), generally suitable areas (0.525–0.695), moderately suitable areas (0.695–0.865), and highly suitable areas (0.865–0.945). The assessment of photovoltaic field development suitability in the Beijing–Tianjin–Hebei region encompasses 34.52% of the total land area. In the evaluated region, the suitable areas encompasses approximately 4.88 × 10⁴ km2, accounting for approximately 62.56% of its total extent. This comprises highly suitable areas (10.51%), moderately suitable areas (16.15%), and generally suitable areas (35.89%). In contrast, the unsuitable area encompasses approximately 2.92 × 10⁴ km2, representing 37.44% of the total area.
The suitability of photovoltaic development in the Beijing–Tianjin–Hebei region gradually decreases from northwest to southeast along the “Yanshan-Taihang Mountains” line (Figure 11). The Yanshan Mountains serve as a natural demarcation, dividing the region into areas deemed suitable (comprising 87% of the total) and unsuitable areas primarily situated in the northwest of Beijing–Tianjin–Hebei regions. Furthermore, due to stringent land protection measures, the entire city of Beijing falls beyond the purview of suitability assessment [65].
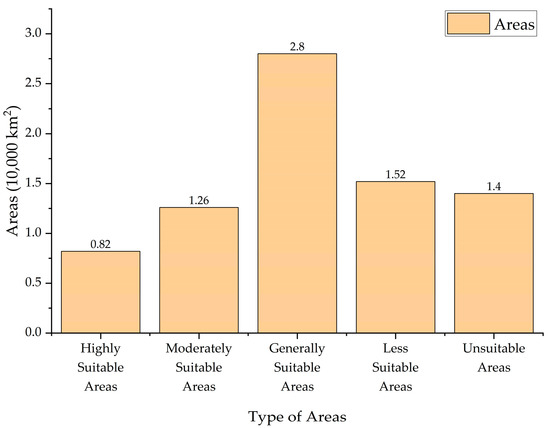
Figure 11.
Statistical chart of suitable photovoltaic electric field development in Beijing–Tianjin–Hebei region.
The government’s policy support has greatly expedited the advancement of the photovoltaic industry in Hebei Province and Tianjin. The implementation of more lenient land management measures in these regions has opened up vast areas, including Chengde City, Zhangjiakou City, and the southern part of Yanshan in Tianjin, which are highly suitable for photovoltaic development (Figure 12). Additionally, the government’s subsidies on electricity prices have further alleviated the construction costs associated with photovoltaic power plants in these areas [66,67]. The topography primarily comprises mountains, hills, and plains with slopes ranging from 15° to 25°. These regions receive over 2500 h of annual sunshine and more than 5800 MJ kWh of total solar radiation per year, providing exceptional natural conditions and an advantageous environment for photovoltaic development. Moreover, their proximity to urban road networks contributes to cost reduction in construction.
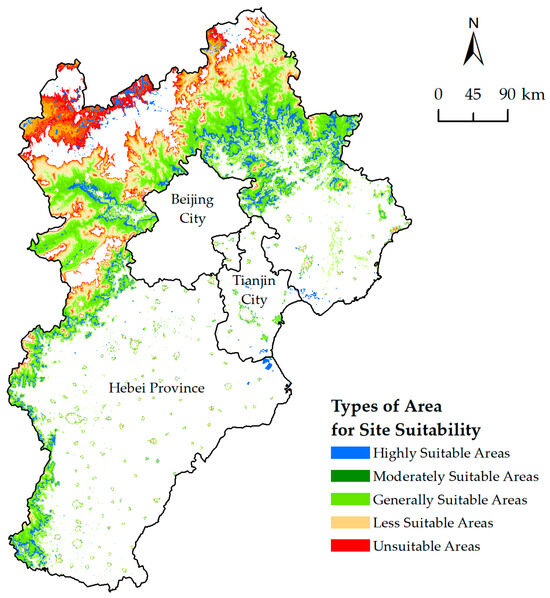
Figure 12.
Adaptability of photovoltaic development in Beijing-Tianjin-Hebei region.
3.3.2. The Assessment of Key Areas for the Suitability of Photovoltaic Power Plants in the Beijing–Tianjin–Hebei Region
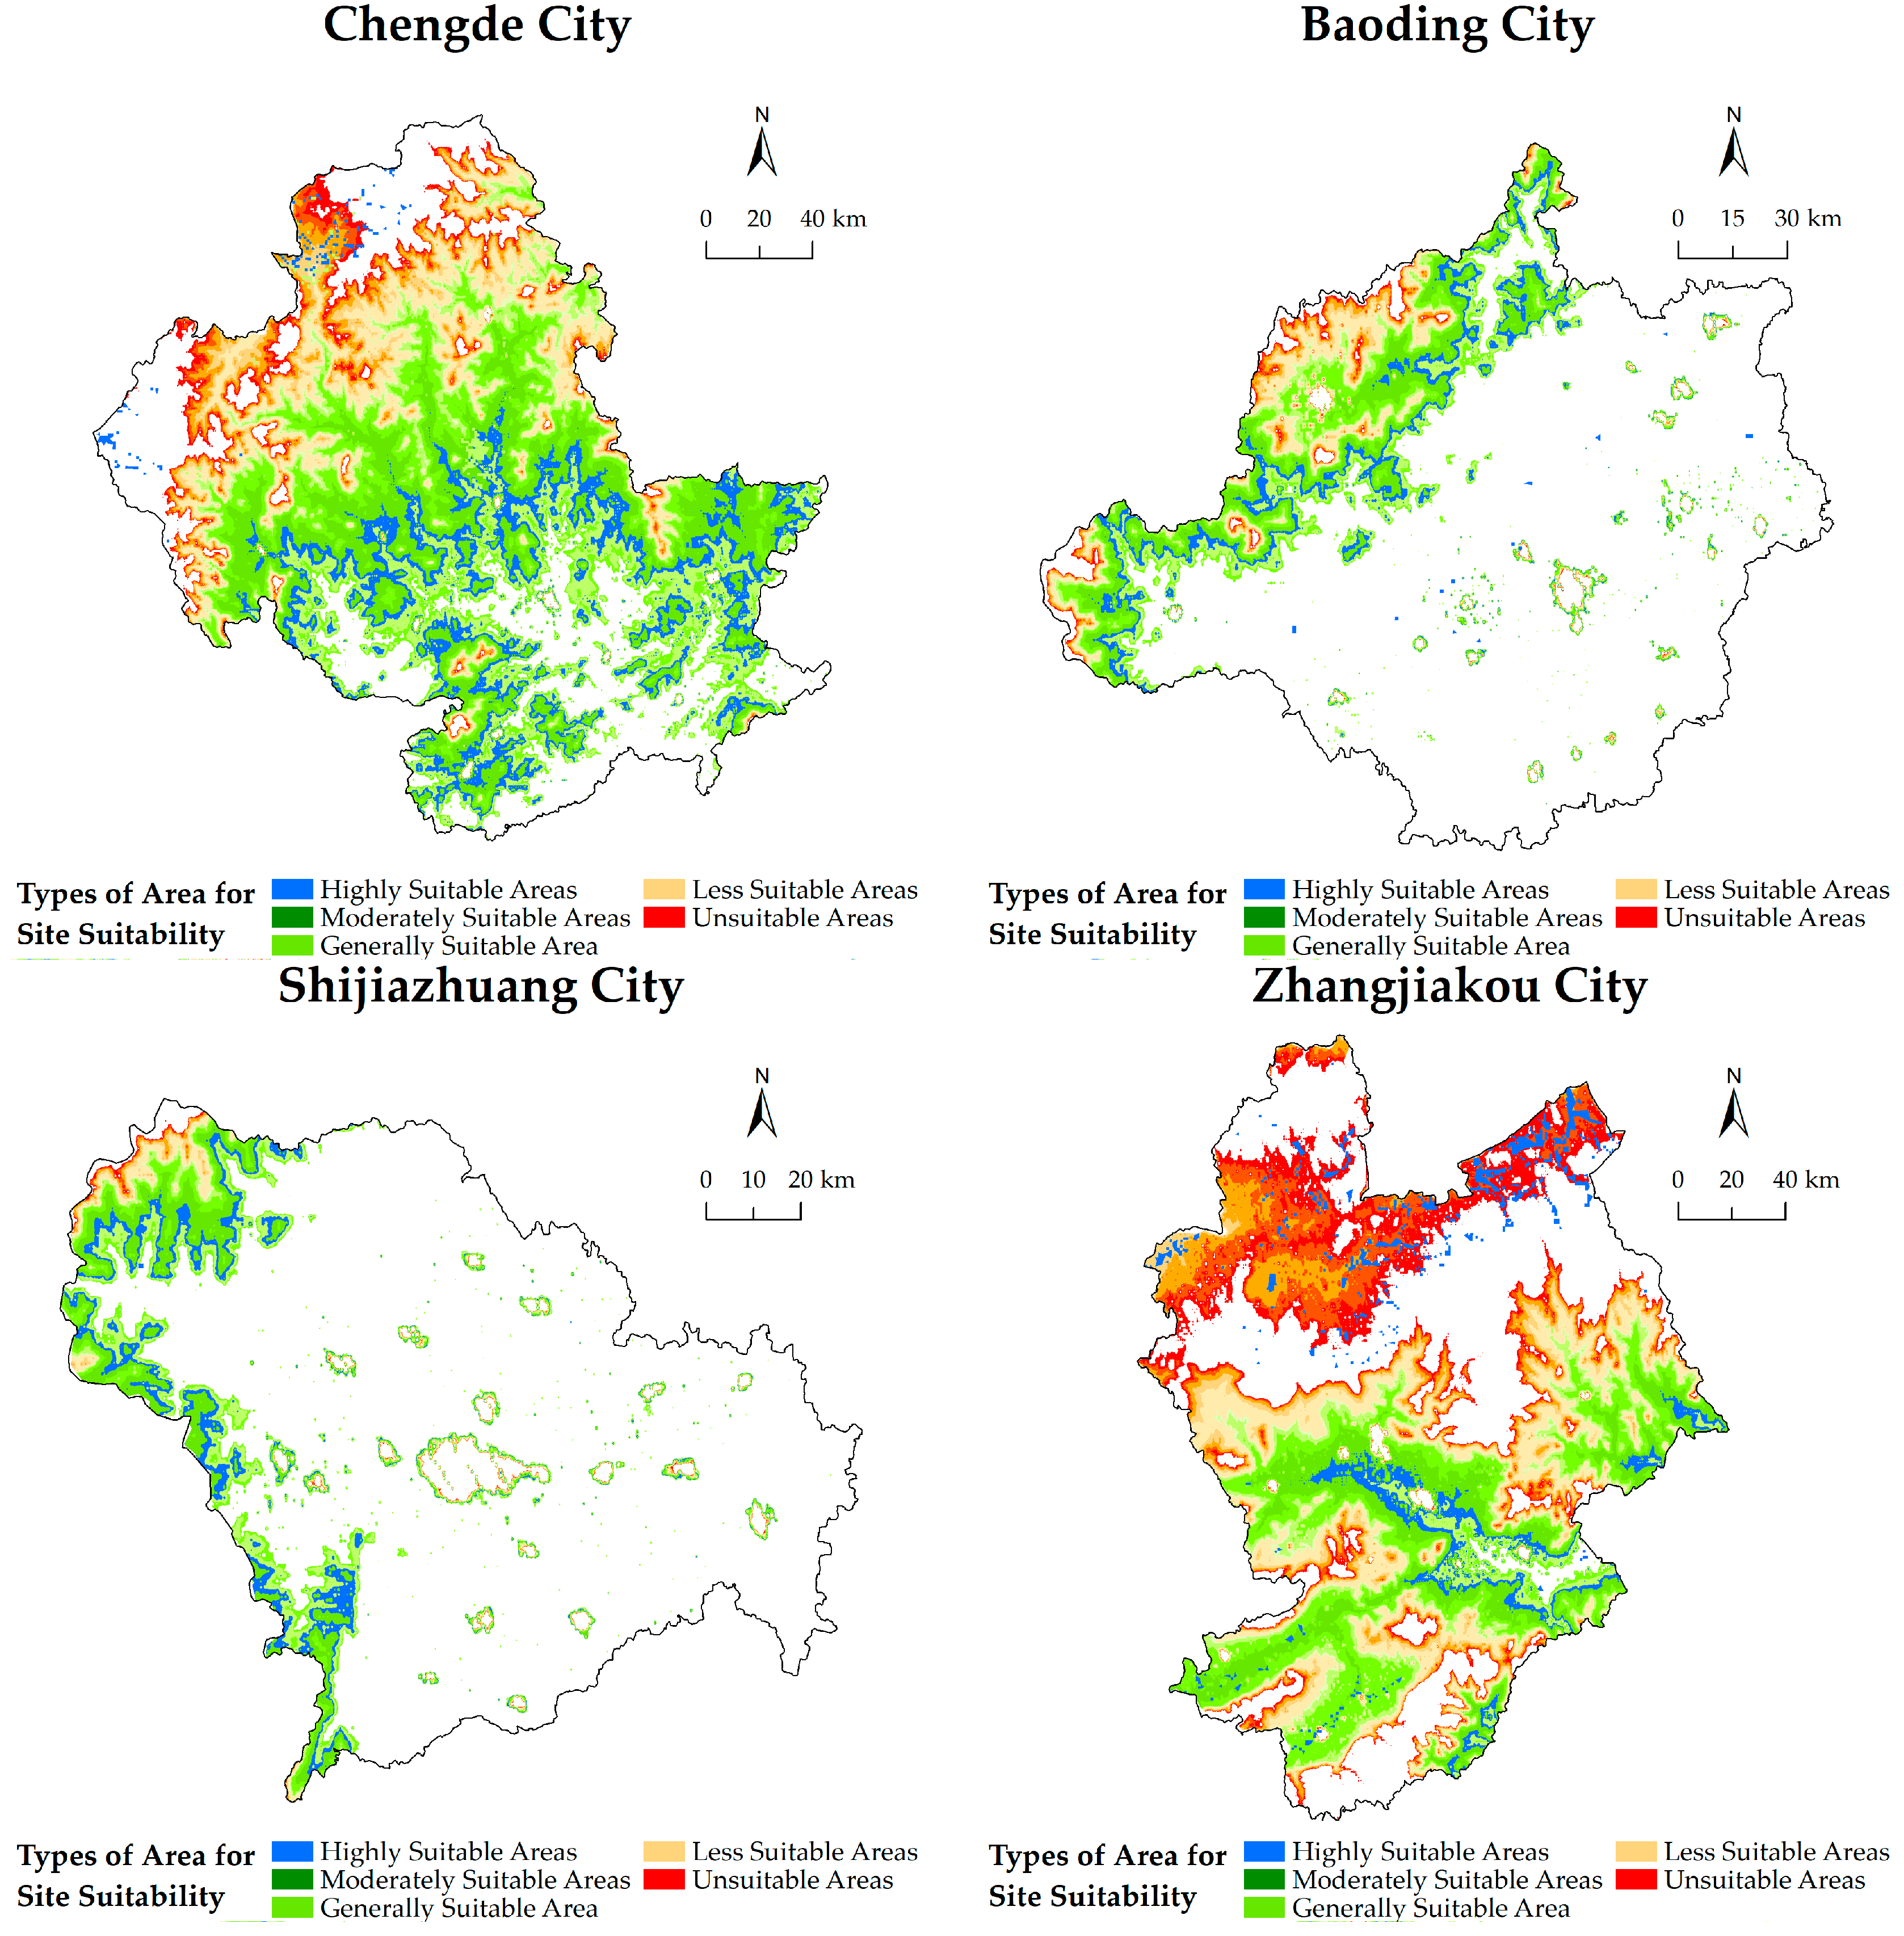
The highly suitable areas exhibit Chengde City as having the largest area, while Baoding, Zhangjiakou, and Chengde are the primary distribution areas in the moderately suitable areas (Table 11). Among the 11 cities within the generally suitable areas, Chengde holds the highest proportion at 40.37%. Shijiazhuang, Xingtai, and Chengde have relatively smaller areas within the unsuitable areas (Table 11).
Table 11.
Area statistics of the top eight cities suitable for photovoltaic development in Beijing–Tianjin–Hebei region (km2).
The cities of Chengde, Zhangjiakou, Baoding, and Shijiazhuang are strategically located along the “Yanshan-Taihang Mountain” line, exhibiting a wide spatial distribution across both generally suitable and moderately suitable areas (Figure 13). Notably, the northern region stands out due to its inherent advantages for photovoltaic development. The presence of barren grasslands contributes to lower land costs and reduced land transactions. Furthermore, the relatively gentle slopes in this area facilitate the construction of large clustered photovoltaic projects. Moreover, Chengde and Zhangjiakou benefit from longer annual sunshine duration and stronger annual total sunlight exposure which enhance power generation capacity and efficiency while minimizing field loss risk. By carefully selecting appropriate distances as well as materials for construction transportation purposes, significant cost reductions can be achieved.
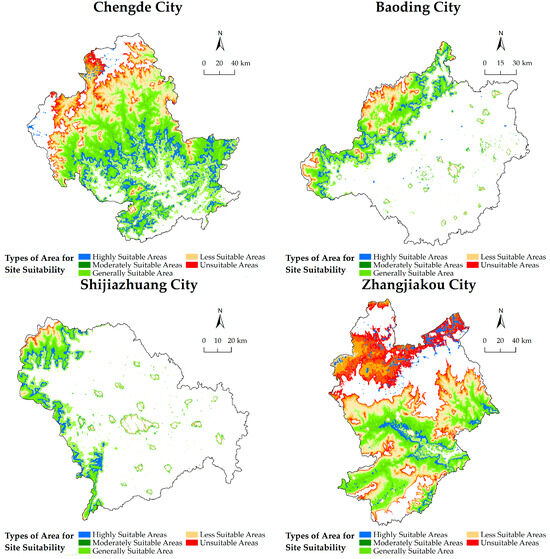
Figure 13.
Preferred cities for photovoltaic power plant development in the Beijing–Tianjin–Hebei region.
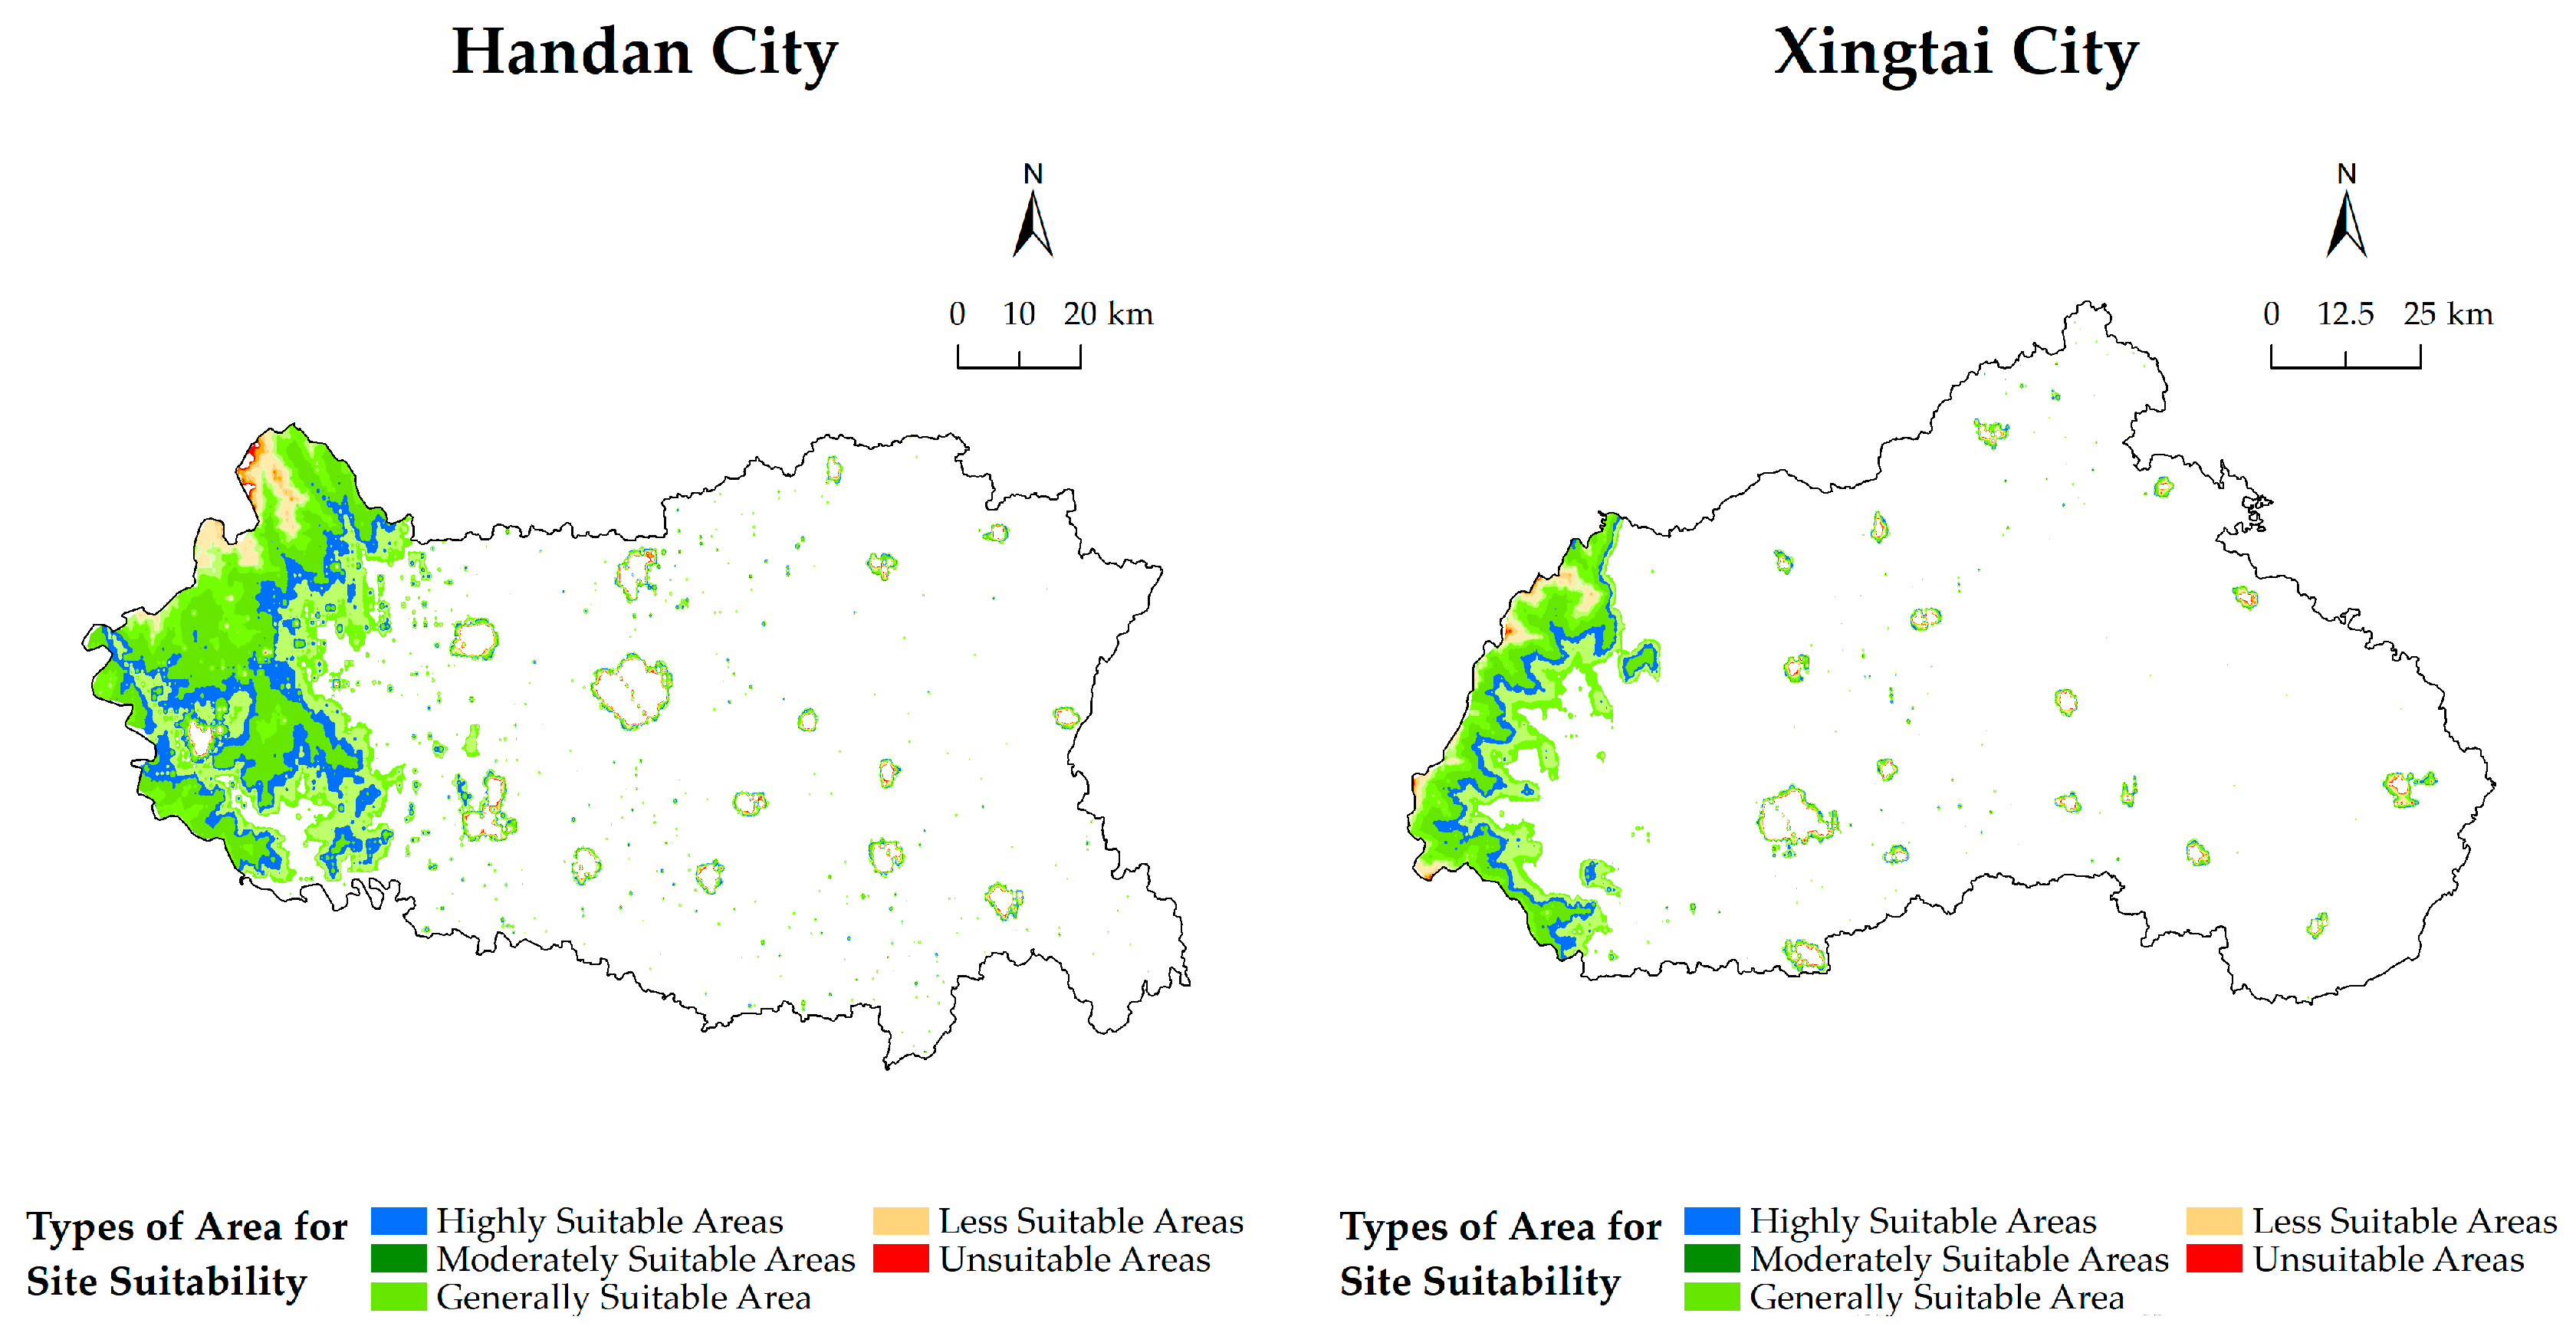
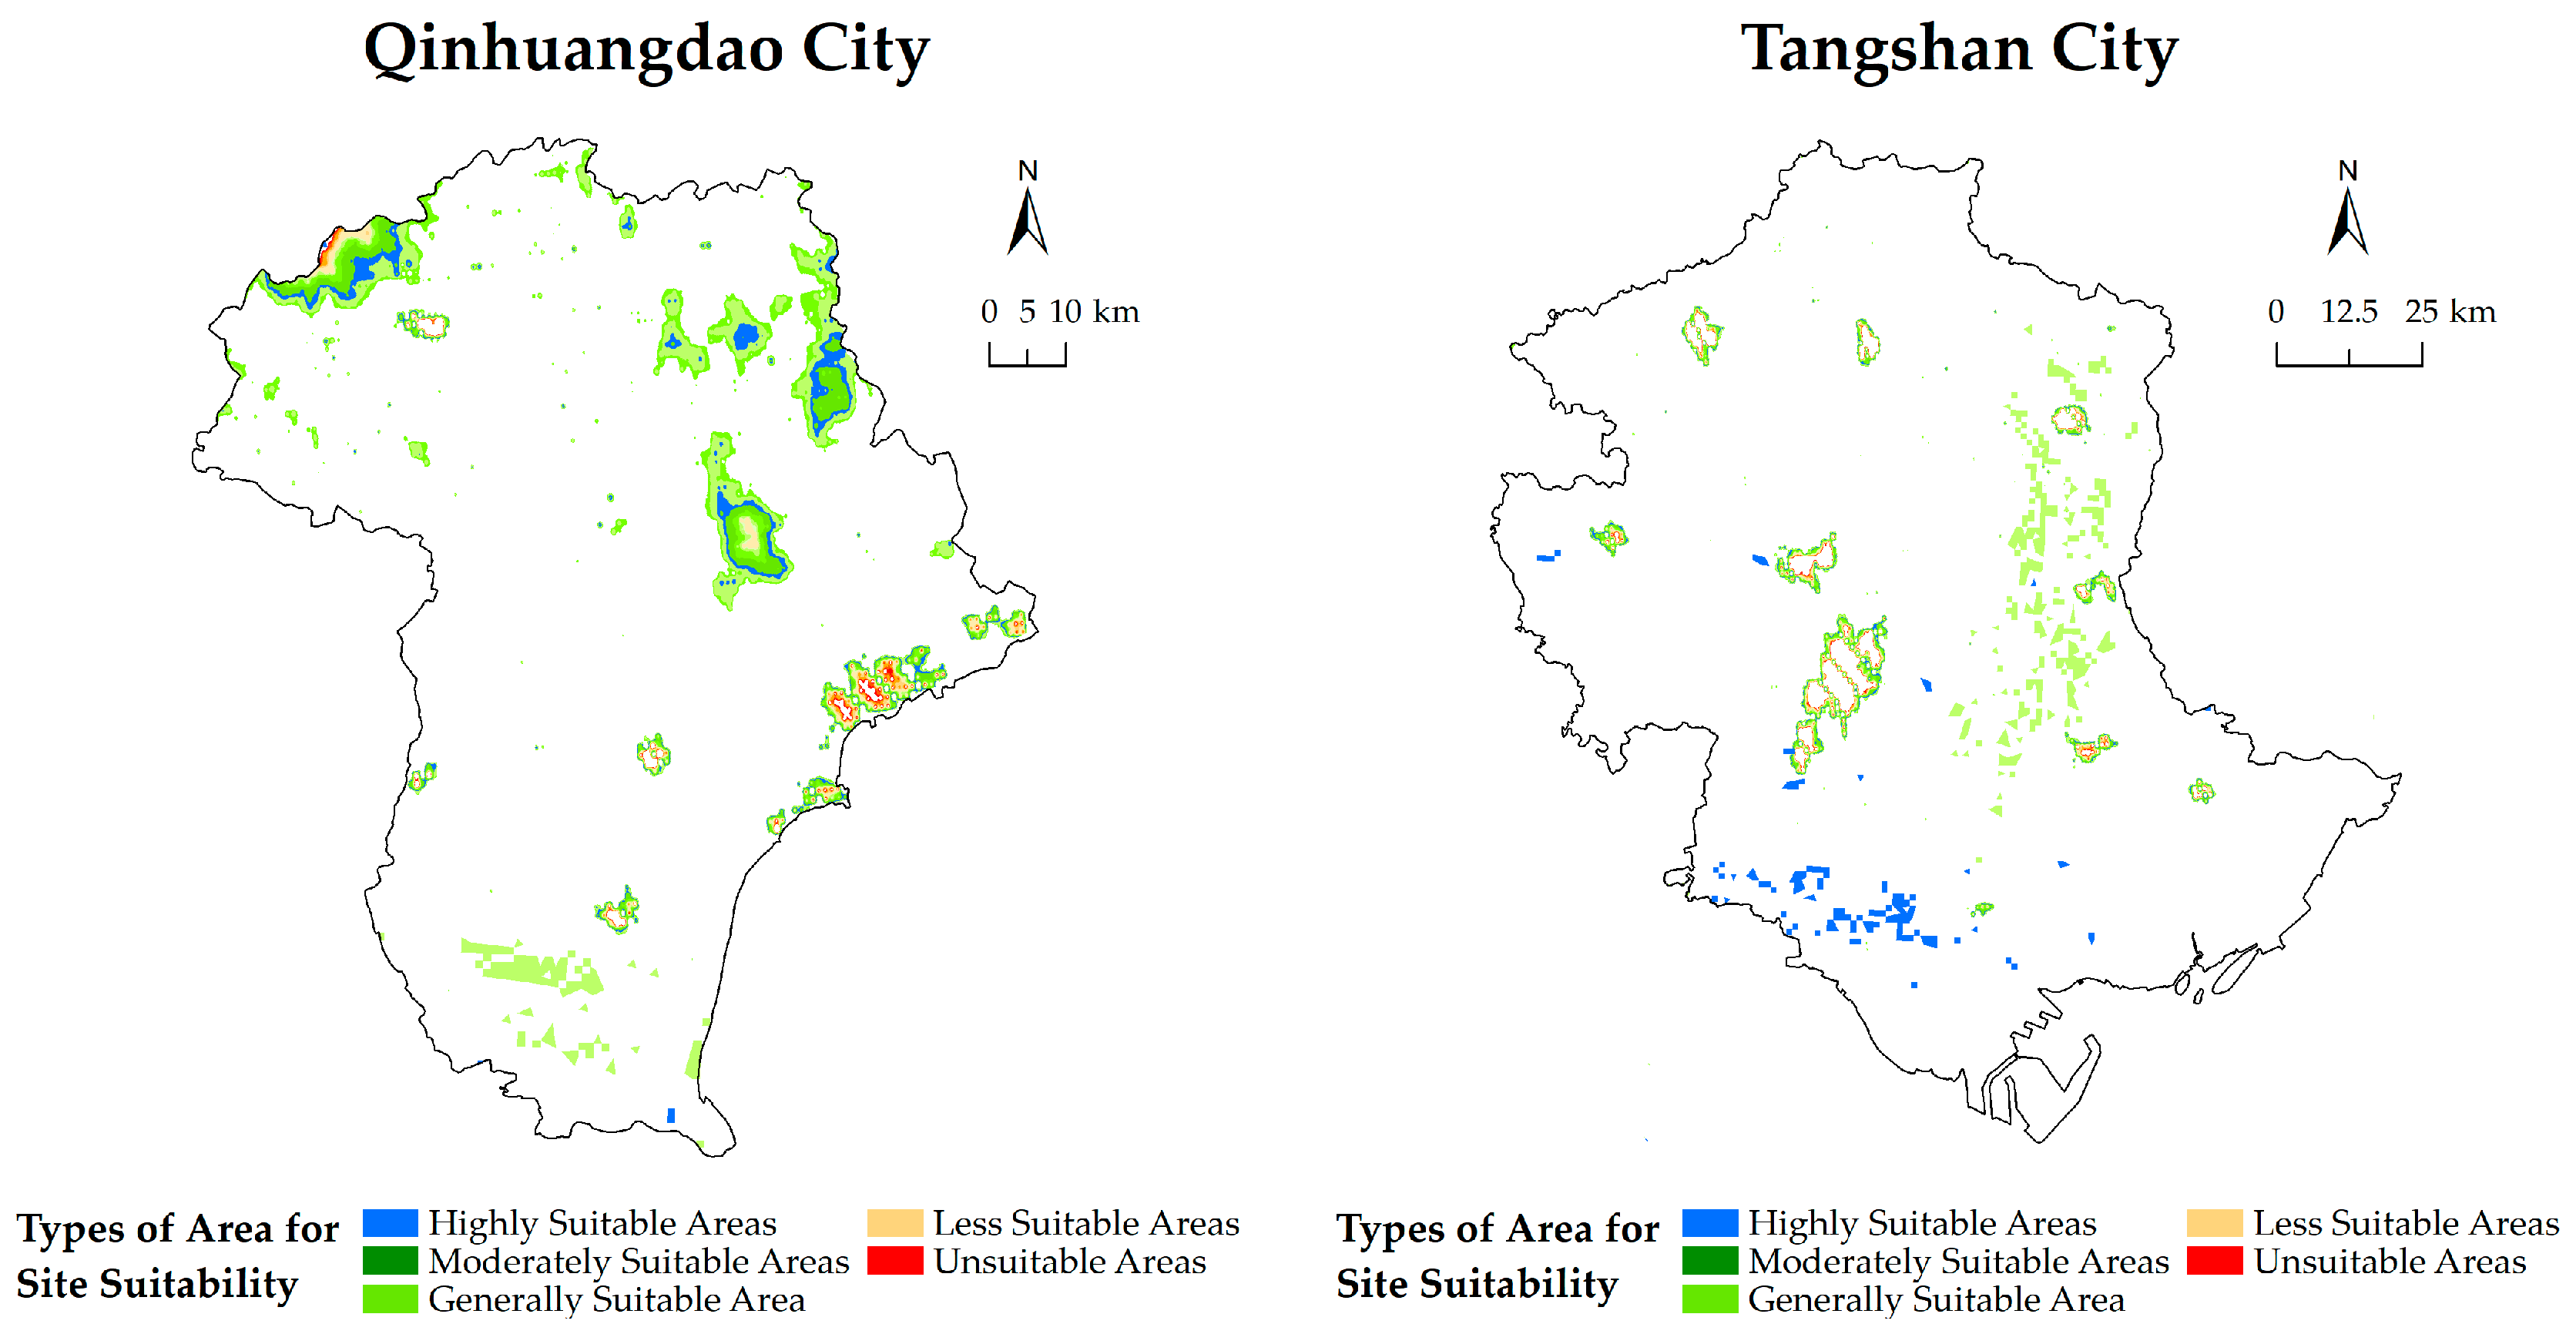
Handan, Xingtai, Qinhuangdao, and Tangshan are situated within the “Yanshan-Taihang Mountain” ecological conservation area, located between the Yanshan Mountains and Taihang Mountains (Figure 14), forming a critical axis for Beijing–Tianjin–Hebei. These areas primarily maintain water resource stability and significantly impact photovoltaic site selection. Although some regions in the western part of the Taihang Mountains possess excellent sunshine duration and solar radiation levels, their complex terrain and distance from urban centers make it challenging to meet large-scale photovoltaic power plant construction requirements while increasing overall costs.
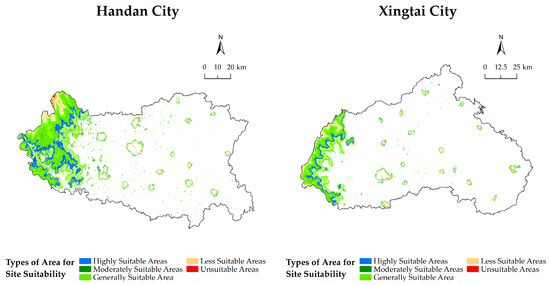
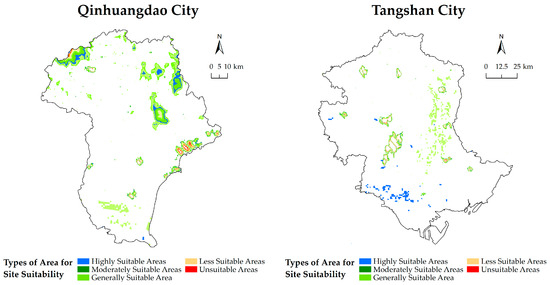
Figure 14.
Secondary cities for the development of photovoltaic power plants in the Beijing–Tianjin–Hebei region.
4. Discussion and Conclusions
The present study constructs a multi-level evaluation system based on the factors of ecological suitability, economic suitability, and land suitability. Subsequently, the AHP–XGBoost–GIS comprehensive evaluation model with subjective and objective weight combination is established, and the quantitative analysis index PDSI is proposed to evaluate the suitability of photovoltaic power stations in the Beijing–Tianjin–Hebei region in detail, which effectively solve the challenges of high economic costs and long project cycles faced by traditional site selection methods.
From the evaluation results, it is evident that contrary to the spatial superposition analysis conclusion suggesting the unsuitability of the Beijing–Tianjin–Hebei region for new energy electric field construction, the combination weighting method-based evaluation results demonstrate a substantial number of suitable areas for photovoltaic power plant development in this region, aligning more closely with actual circumstances [68]. The distribution of these suitable areas within Beijing–Tianjin–Hebei obtained in this study exhibits relatively close proximity [69] and accounts for a slightly higher proportion compared to other research findings (62.56%). This indicates the presence of considerable suitable regions for photovoltaic power station establishment within Xingtai and Handan’s Taihang Mountains area, surpassing previous studies by an additional 6000 km2 [29]. Our research outcomes are more congruent with reality when contrasted against both the scientific nature of comprehensive evaluation models and advancements in new modes of photovoltaic power station construction [70,71,72]. Notably, large-scale photovoltaic power plant construction suitability predominantly lies within mountainous regions, consistent with existing research outcomes, signifying that land policy restrictions should not impede distributed photovoltaic facility development based on local conditions [73]. In light of China’s commitment towards promoting a low-carbon economy, our AHP–XGBoost–GIS comprehensive evaluation model offers novel insights into a regional renewable energy layout and yields significant conclusions as follows:
- (1)
- In the Beijing–Tianjin–Hebei region, approximately 4.88 × 10⁴ km2 of the total area is suitable, accounting for 21.59% of the total area. Divided by the “Yanshan-Taihang Mountains” range, the majority of suitable areas are located in Baoding, Chengde, and Zhangjiakou cities on the northwest of the mountains, while there is a lower distribution of suitable areas in Beijing and Tianjin on the southeast side. Therefore, the government in the formulation of photovoltaic power plant policy or investors in site selection investment, can give priority to Baoding Chengde and Zhangjiakou and other cities.
- (2)
- The suitable areas primarily consist of generally suitable areas, with a predominant presence of mountainous terrain. The complex terrain in mountainous areas puts forward higher technical requirements and costs for project implementation. In addition, the long-term impact of photovoltaic power plant development on the local ecological environment is not clear, so the photovoltaic power plant should be continuously monitored for soil and water conservation and ecological restoration.
- (3)
- The selection of evaluation of indicators in this study fully considers their applicability in the study area, and the quantification of index weights based on the combination method enhances the scientific and targeted nature of the final evaluation results. However, due to regional constraints and data sources, there is a lack of comprehensive consideration for ecological and climatic elements’ impact on suitability. For instance, local rainfall can reduce photovoltaic panel power generation efficiency, a mountain slope aspect can limit photovoltaic panel installation, and a poor geological structure can affect engineering construction economics. The primary objective of photovoltaic is to decrease reliance on fossil fuels while providing greater economic and social benefits to users and investors. Therefore, future research should prioritize the incorporation of additional micro influencing factors into the evaluation indicators to enhance the comprehensiveness of the evaluation system.
Author Contributions
Investigation, S.C.; Data curation, Z.C.; Writing—original draft, L.L.; Writing—review & editing, X.Z. All authors have read and agreed to the published version of the manuscript.
Funding
This research was supported by the Third Xinjiang Scientific Expedition of the Key Research and Development Program by Ministry of Science and Technology of the People´s Republic of China (No. 2022xjkk1104), and the “Deeptime Digital Earth” Science andTechnology Leading Talents Team Funds for the Central Universities for the Frontiers Science Center for Deep-time Digital Earth, China University of Geosciences (Beijing) (Fundamenta Research Funds for the Central Universities; grant number: 2652023001).
Data Availability Statement
Data is contained within the article.
Conflicts of Interest
Author Shijin Chen was employed by the Guangxi Land and Resources Planning and Design Group Co. Ltd.. The remaining authors declare that the research was conducted in the absence of any commercial or financial relationships that could be construed as a potential conflict of interest.
References
- Lee, H.; Calvin, K.; Dasgupta, D.; Krinner, G.; Mukherji, A.; Thorne, P.; Trisos, C.; Romero, J.; Aldunce, P.; Ruane, A.C. CLIMATE CHANGE 2023 Synthesis Report Summary for Policymakers; Intergovernmental Panel on Climate Change: Geneva, Switzerland, 2024. [Google Scholar]
- Allen, M.; Dube, O.P.; Solecki, W.; Aragón-Durand, F.; Cramer, W.; Humphreys, S.; Kainuma, M. Special Report: Global Warming of 1.5 C; Intergovernmental Panel on Climate Change (IPCC): Geneva, Switzerland, 2018. [Google Scholar]
- Crippa, M.; Guizzardi, D.; Banja, M.; Solazzo, E.; Muntean, M.; Schaaf, E.; Pagani, F.; Monforti-Ferrario, F.; Olivier, J.G.J.; Quadrelli, R. CO2 Emissions of All World Countries; JRC Science for Policy Report; European Commission, EUR: Brussels, Belgium, 2022; p. 31182.
- May, B. World Economic Prospects Monthly. Econ. Outlook 2018, 42, 1–33. [Google Scholar]
- Zou, C.; Chen, Y.; Xiong, B.; Liu, H. Mission of new energy under carbon neutrality goal in China. Bull. Chin. Acad. Sci. 2023, 38, 48–58. [Google Scholar] [CrossRef]
- Xu, Y. Research on Power Transition Theory and Planning Method under Interactive Institution-Policy-Technology Regime. Ph.D. Thesis, North China Electric Power University, Beijing, China, 2016. [Google Scholar]
- Zhang, C. China’s “Dual Carbon” Goals and Practices: Forming Logic, Realistic Challenges, Social Risks and Advancing Route. J. Hohai Univ. (Philos. Soc. Sci.) 2022, 24, 78–87+131. [Google Scholar]
- Purohit, P. CO2 Emissions Mitigation Potential of Solar Home Systems under Clean Development Mechanism in India. Energy 2009, 34, 1014–1023. [Google Scholar] [CrossRef]
- He, Y.; Che, Y.; Lyu, Y.; Lu, Y.; Zhang, Y. Social Benefit Evaluation of China’s Photovoltaic Poverty Alleviation Project. Renew. Energy 2022, 187, 1065–1081. [Google Scholar] [CrossRef]
- Liu, Y. Feasibility Evaluation of the Photovoltaic Power Generation ’s Construction from the Perspective of Targeted Poverty Alleviation. J. Beijing Inst. Technol. (Soc. Sci. Ed.) 2017, 19, 37–43. [Google Scholar]
- Na, R. Researching on Location of Wind Power Farm Based on Fuzzy Comprehensive Evaluation Model. Master’s Thesis, North China Electric Power University, Beijing, China, 2015. [Google Scholar]
- Sun, Y.; Zhu, D.; Li, Y.; Wang, R.; Ma, R. Spatial Modelling the Location Choice of Large-Scale Solar Photovoltaic Power Plants: Application of Interpretable Machine Learning Techniques and the National Inventory. Energy Convers. Manag. 2023, 289, 117198. [Google Scholar] [CrossRef]
- Noorollahi, Y.; Senani, A.G.; Fadaei, A.; Simaee, M.; Moltames, R. A Framework for GIS-Based Site Selection and Technical Potential Evaluation of PV Solar Farm Using Fuzzy-Boolean Logic and AHP Multi-Criteria Decision-Making Approach. Renew. Energy 2022, 186, 89–104. [Google Scholar] [CrossRef]
- Šúri, M.; Hofierka, J. A New GIS-Based Solar Radiation Model and Its Application to Photovoltaic Assessments. Trans. GIS 2004, 8, 175–190. [Google Scholar] [CrossRef]
- Doorga, J.R.S.; Hall, J.W.; Eyre, N. Geospatial Multi-Criteria Analysis for Identifying Optimum Wind and Solar Sites in Africa: Towards Effective Power Sector Decarbonization. Renew. Sustain. Energy Rev. 2022, 158, 112107. [Google Scholar] [CrossRef]
- Wang, C.-N.; Nguyen, V.T.; Thai, H.T.N.; Duong, D.H. Multi-Criteria Decision Making (MCDM) Approaches for Solar Power Plant Location Selection in Viet Nam. Energies 2018, 11, 1504. [Google Scholar] [CrossRef]
- Perpiña Castillo, C.; Batista e Silva, F.; Lavalle, C. An Assessment of the Regional Potential for Solar Power Generation in EU-28. Energy Policy 2016, 88, 86–99. [Google Scholar] [CrossRef]
- Ali, S.; Taweekun, J.; Techato, K.; Waewsak, J.; Gyawali, S. GIS Based Site Suitability Assessment for Wind and Solar Farms in Songkhla, Thailand. Renew. Energy 2019, 132, 1360–1372. [Google Scholar] [CrossRef]
- Hasti, F.; Mamkhezri, J.; McFerrin, R.; Pezhooli, N. Optimal Solar Photovoltaic Site Selection Using Geographic Information System–Based Modeling Techniques and Assessing Environmental and Economic Impacts: The Case of Kurdistan. Sol. Energy 2023, 262, 111807. [Google Scholar] [CrossRef]
- Haddad, B.; Díaz-Cuevas, P.; Ferreira, P.; Djebli, A.; Pérez, J.P. Mapping Concentrated Solar Power Site Suitability in Algeria. Renew. Energy 2021, 168, 838–853. [Google Scholar] [CrossRef]
- Min, Z.; Hu, Y.; Liu, Y.; Wang, Z.; Chen, Z.; Li, H.; Jia, X. Suitability of Forest Grass PV Complementary Space and Carbon Fixation and Reduction Benefits in Yan’an. J. Northwest For. Univ. 2023, 38, 57–66. [Google Scholar]
- Ding, Y.A. Preliminary Study on the Construction of Artificial Grassland under Photovoltaic Frame. Master’s Thesis, Inner Mongolia Agricultural University, Hohhot, China, 2018. [Google Scholar]
- An, W. Research on Mechanism and Model of Photovoltaic Industry Poverty Alleviation in China. Master’s Thesis, Shanxi University of Finance & Economics, Taiyuan, China, 2019. [Google Scholar]
- Yang, K.; Fan, B. The Innovative Geographical Foundation of the Relative Decline of Economic Growth in Beijing-Tianjin-Hebei Region. Acta Geogr. Sin. 2022, 77, 1320–1338. [Google Scholar]
- Zhao, L.; Zhang, G. Evaluation and Welfare Effect of Coordinated Ecological Development of the Beijing–Tianjin–Hebei Region. Chin. J. Popul. Resour. Environ. 2021, 19, 283–290. [Google Scholar] [CrossRef]
- Zhang, J.; Zheng, Y. The Flexibility Pathways for Integrating Renewable Energy into China’s Coal Dominated Power System: The Case of Beijing-Tianjin-Hebei Region. J. Clean. Prod. 2020, 245, 118925. [Google Scholar] [CrossRef]
- Han, H.; Guo, L.; Zhang, J.; Zhang, K.; Cui, N. Spatiotemporal Analysis of the Coordination of Economic Development, Resource Utilization, and Environmental Quality in the Beijing-Tianjin-Hebei Urban Agglomeration. Ecol. Indic. 2021, 127, 107724. [Google Scholar] [CrossRef]
- Liu, C.; Deng, X.; Zhu, B.; Yin, C. Characteristics of GSR of China’s Three Major Economic Regions in the Past 10 Years and Its Relationship with O3 and PM2.5. China Environ. Sci. 2018, 38, 2820–2829. [Google Scholar]
- Liu, L.; Sun, Z.; Wu, F.; Zhang, X.; Zhang, Q. Evaluation of Suitability and Emission Reduction Benefits of Photovoltaic Development in Beijing-Tianjin-Hebei Region. Acta Geogr. Sin. 2022, 77, 665–678. [Google Scholar]
- Zhao, S.; Yu, L.; Zhang, Z. Photovoltaic Supply Chain and Government Subsidy Decision-Making Based on China’s Industrial Distributed Photovoltaic Policy: A Power Perspective. J. Clean. Prod. 2023, 413, 137438. [Google Scholar] [CrossRef]
- Xiong, Y.; Yang, X. Government Subsidies for the Chinese Photovoltaic Industry. Energy Policy 2016, 99, 111–119. [Google Scholar] [CrossRef]
- Lin, B.; Luan, R. Do Government Subsidies Promote Efficiency in Technological Innovation of China’s Photovoltaic Enterprises? J. Clean. Prod. 2020, 254, 120108. [Google Scholar] [CrossRef]
- Corwin, S.; Johnson, T.L. The Role of Local Governments in the Development of China’s Solar Photovoltaic Industry. Energy Policy 2019, 130, 283–293. [Google Scholar] [CrossRef]
- Nation Bureau of Statistics. Statistical Bulletin on the National Economy and Social Development of the People’s Republic of China in 2021; Nation Bureau of Statistics: Beijing, China, 2022.
- Editorial Committee of China Electric Power Yearbook. China Electric Power Yearbook 2020; China Electric Power Press: Beijing, China, 2022. [Google Scholar]
- Dang, R.; Li, X.; Li, C.; Xu, C. A MCDM Framework for Site Selection of Island Photovoltaic Charging Station Based on New Criteria Identification and a Hybrid Fuzzy Approach. Sustain. Cities Soc. 2021, 74, 103230. [Google Scholar] [CrossRef]
- Li, Y.; Yu, X.; Wang, Z. Risk Assessment on Photovoltaic Power Generation Project by Grey Correlation Analysis and TOPSIS Method. Power Syst. Technol. 2013, 37, 1514–1519. [Google Scholar]
- Liao, H.; Qin, R.; Wu, D.; Yazdani, M.; Zavadskas, E.K. Pythagorean Fuzzy Combined Compromise Solution Method Integrating the Cumulative Prospect Theory and Combined Weights for Cold Chain Logistics Distribution Center Selection. Int. J. Intell. Syst. 2020, 35, 2009–2031. [Google Scholar] [CrossRef]
- Ren, C.; Yue, W.; Liang, X.; Liang, Y.; Liang, J.; Lin, X. Risk assessment of wildfire disaster in Guilin based on XGBoost and combination weight method. J. Saf. Environ. 2023, 23, 1–9. [Google Scholar] [CrossRef]
- Zhang, J.; Huang, D.; You, Q.; Kang, J.; Shi, M.; Lang, X. Evaluation of Emergency Evacuation Capacity of Urban Metro Stations Based on Combined Weights and TOPSIS-GRA Method in Intuitive Fuzzy Environment. Int. J. Disaster Risk Reduct. 2023, 95, 103864. [Google Scholar] [CrossRef]
- Elboshy, B.; Alwetaishi, M.; Aly, R.M.H.; Zalhaf, A.S. A Suitability Mapping for the PV Solar Farms in Egypt Based on GIS-AHP to Optimize Multi-Criteria Feasibility. Ain Shams Eng. J. 2022, 13, 101618. [Google Scholar] [CrossRef]
- Jafari, S.; Aghel, M.; Sohani, A.; Hoseinzadeh, S. Geographical Preference for Installation of Solar Still Water Desalination Technologies in Iran: An Analytical Hierarchy Process (AHP)-Based Answer. Water 2022, 14, 265. [Google Scholar] [CrossRef]
- Salman, M.; Chauhan, R.; Singh, T.; Prabakaran, R.; Kim, S.C. Experimental Investigation and Optimization of Dimple-Roughened Impinging Jet Solar Air Collector Using a Novel AHP-MABAC Approach. Environ. Sci. Pollut. Res. 2022, 30, 36259–36275. [Google Scholar] [CrossRef]
- The Notice on the Issuance of “Hebei Province’s 14th Five-Year Plan for New Energy Storage Development” by the Hebei Provincial Development and Reform Commission. Available online: https://info.hebei.gov.cn/hbszfxxgk/6898876/6898925/6899014/6907489/7019023/index.html (accessed on 26 December 2023).
- The Hebei Province Development and Reform Commission Has Issued A notice on the “New Energy Storage Development Plan” for the 14th Five-Year Plan Period in Hebei Province. Available online: https://gxt.hebei.gov.cn/sme/zc/snzc91/896589/index.html?eqid=a262766000176aec00000003648585fa (accessed on 26 December 2023).
- The Notice on the Organization of Ground Distributed Photovoltaic Project Application by Hebei Province Development and Reform Commission. Available online: http://hbdrc.hebei.gov.cn/nsjg/snyj/xnyc/gzdt_886/202310/t20231024_102142.html (accessed on 26 December 2023).
- Li, F. Analysis of Factors Affecting the Location and Layout of Photovoltaic Power Stations. Econ. Res. Guide 2019, 36, 21–22+34. [Google Scholar]
- Wu, J.; Chen, J. Site Selection Planning of Photovoltaic Power Station:a Case Study of Wuhu City. J. Ludong Univ. (Nat. Sci. Ed.) 2019, 35, 59–65+89. [Google Scholar]
- Heo, J.; Moon, H.; Chang, S.; Han, S.; Lee, D.-E. Case Study of Solar Photovoltaic Power-Plant Site Selection for Infrastructure Planning Using a BIM-GIS-Based Approach. Appl. Sci. 2021, 11, 8785. [Google Scholar] [CrossRef]
- Hashemizadeh, A.; Ju, Y.; Dong, P. A Combined Geographical Information System and Best–Worst Method Approach for Site Selection for Photovoltaic Power Plant Projects. Int. J. Environ. Sci. Technol. 2020, 17, 2027–2042. [Google Scholar] [CrossRef]
- Fang, H.; Li, J.; Song, W. Sustainable Site Selection for Photovoltaic Power Plant: An Integrated Approach Based on Prospect Theory. Energy Convers. Manag. 2018, 174, 755–768. [Google Scholar] [CrossRef]
- Zambrano-Asanza, S.; Quiros-Tortos, J.; Franco, J.F. Optimal Site Selection for Photovoltaic Power Plants Using a GIS-Based Multi-Criteria Decision Making and Spatial Overlay with Electric Load. Renew. Sustain. Energy Rev. 2021, 143, 110853. [Google Scholar] [CrossRef]
- Heo, J.; Song, K.; Han, S.; Lee, D.-E. Multi-Channel Convolutional Neural Network for Integration of Meteorological and Geographical Features in Solar Power Forecasting. Appl. Energy 2021, 295, 117083. [Google Scholar] [CrossRef]
- Wu, Y.; Deng, Z.; Tao, Y.; Wang, L.; Liu, F.; Zhou, J. Site Selection Decision Framework for Photovoltaic Hydrogen Production Project Using BWM-CRITIC-MABAC: A Case Study in Zhangjiakou. J. Clean. Prod. 2021, 324, 129233. [Google Scholar] [CrossRef]
- Cheng, L. The application of analytic hierarchy process (AHP) and geographic information system (GIS) in lightning disaster risk-zoning in Henan province. J. Nanjing Univ. Inf. Sci. Technol. 2019, 11, 234–240. [Google Scholar]
- Ming, J. Research on the Location-Allocation Model for Urban Fire Stations under Fire Risk. Ph.D. Thesis, University of Science and Technology of China, Hefei, China, 2022. [Google Scholar]
- Li, Z.; Liu, Z. Feature selection algorithm based on XGBoost. J. Commun. 2019, 40, 101–108. [Google Scholar]
- Rocha, P.A.C.; Santos, V.O. Global Horizontal and Direct Normal Solar Irradiance Modeling by the Machine Learning Methods XGBoost and Deep Neural Networks with CNN-LSTM Layers: A Case Study Using the GOES-16 Satellite Imagery. Int. J. Energy Environ. Eng. 2022, 13, 1271–1286. [Google Scholar] [CrossRef]
- Li, X.; Ma, L.; Chen, P.; Xu, H.; Xing, Q.; Yan, J.; Lu, S.; Fan, H.; Yang, L.; Cheng, Y. Probabilistic Solar Irradiance Forecasting Based on XGBoost. Energy Rep. 2022, 8, 1087–1095. [Google Scholar] [CrossRef]
- Kim, Y.; Byun, Y. Predicting Solar Power Generation from Direction and Tilt Using Machine Learning XGBoost Regression. J. Phys. Conf. Ser. 2022, 2261, 012003. [Google Scholar] [CrossRef]
- Wang, Q. Prediction and Analysis on the Direction of Stock Rate Return Using Machine Learning. Master’s Thesis, University of Science and Technology of China, Hefei, China, 2019. [Google Scholar]
- Yan, B.; Sun, J.; Wang, X.; Li, X.; Sun, F.; Fu, D. Suitability Zoning of Groundwater Source Heat Pump in Shijiazhuang Based on GIS-FAHP. J. Jilin Univ. (Earth Sci. Ed.) 2021, 51, 1172–1181. [Google Scholar] [CrossRef]
- Huang, Q.; Tan, C.; Yang, B. Research on the Evaluation Method of Ecotourism Suitability in Subtropical Regions based on XGBoost Algorithm. J. Geo-Inf. Sci. 2023, 28, 1–15. [Google Scholar]
- Li, J.; Yuan, W. Assessment of Urban Land Ecological Security in Yinchuan City Based on the Grid Method. J. Nat. Resour. 2017, 32, 988–1001. [Google Scholar]
- Wang, F.; Shi, X.; Zheng, H.; Wu, Y. A Crucial Question and Ten Relationships: Explorations on the Transformation of Beijing City Master Plan (2016–2035). City Plan. Rev. 2017, 41, 9–16+32. [Google Scholar]
- Regulations on Promoting the Development of New Energy in Hebei Province. Available online: http://www.lvsefazhan.cn/index.php/guozijianguan/2400.html (accessed on 31 October 2023).
- Department of Ecology and Environment of Hebei Province. Hebei Province Pollution Reduction and Carbon Reduction Synergy Implementation Plan; Department of Ecology and Environment of Hebei Province: Zhengzhou, China, 2023. [Google Scholar]
- Zhang, Y.; Ren, J.; Pu, Y.; Wang, P. Solar Energy Potential Assessment: A Framework to Integrate Geographic, Technological, and Economic Indices for a Potential Analysis. Renew. Energy 2020, 149, 577–586. [Google Scholar] [CrossRef]
- Zhang, J. Assessment of Renewable Energy Potentials Based on GIS and RS: A Case Study in China. Ph.D. Thesis, Technische Universität, Dortmund, Germany, 2015. [Google Scholar]
- Liu, J.; Shuai, J.; Shuai, C.; Wang, Z.; Huang, F. Impacts of Solar Photovoltaic Projects on Sustainable Livelihoods: Evidence from Rural China. Energy Sustain. Dev. 2023, 74, 314–327. [Google Scholar] [CrossRef]
- Wang, Y.; Cui, X.; Huang, H. Spatial Patterns and Environmental Benefits of Photovoltaic Poverty Alleviation Programs in China. Environ. Impact Assess. Rev. 2023, 103, 107272. [Google Scholar] [CrossRef]
- Wang, J. Large Distributed Photovoltaic Powergeneration Project Comprehensive Evaluation. Master’s Thesis, Beijing University of Chemical Technology, Beijing, China, 2017. [Google Scholar]
- Yang, Q.; Huang, T.; Wang, S.; Li, J.; Dai, S.; Wright, S.; Wang, Y.; Peng, H. A GIS-Based High Spatial Resolution Assessment of Large-Scale PV Generation Potential in China. Appl. Energy 2019, 247, 254–269. [Google Scholar] [CrossRef]


Disclaimer/Publisher’s Note: The statements, opinions and data contained in all publications are solely those of the individual author(s) and contributor(s) and not of MDPI and/or the editor(s). MDPI and/or the editor(s) disclaim responsibility for any injury to people or property resulting from any ideas, methods, instructions or products referred to in the content. |
© 2024 by the authors. Licensee MDPI, Basel, Switzerland. This article is an open access article distributed under the terms and conditions of the Creative Commons Attribution (CC BY) license (https://creativecommons.org/licenses/by/4.0/).