Article

Striped Field Mouse Invading Human-Modified Environments of Lithuania during Last Five Decades

by
Linas Balčiauskas
and
Laima Balčiauskienė
*
Nature Research Centre, Akademijos 2, 08412 Vilnius, Lithuania
*
Author to whom correspondence should be addressed.
Land 2024, 13(10), 1555; https://doi.org/10.3390/land13101555
Submission received: 29 August 2024 / Revised: 21 September 2024 / Accepted: 23 September 2024 / Published: 25 September 2024

Abstract

:
The striped field mouse (Apodemus agrarius) is expanding in several European countries, but the details of this process are not always documented due to a lack of long-term studies. We conducted an analysis of changes in relative abundances and proportions of A. agrarius in small mammal communities in nine different habitat groups in Lithuania during 1975–2023. We found an increase in the abundance and proportion of A. agrarius, increasing synanthropization of the species, and tolerance to anthropogenization of habitats. Temporal variations in the relative abundance and proportion of species were observed, with lower values in February–July and higher values in September–January. The main finding is a remarkable increase in species presence in the country after the 1990s, with a peak observed in the 2010s–2020s, confirmed by eight local studies. During these decades, it was the third most abundant species, representing 19.8–20.0% of the individuals caught. It is also important to note that A. agrarius has recently been most abundant in commensal habitats (0.029 ± 0.006 individuals/trap day), with the highest species proportion in agricultural areas (24.8 ± 1.8%). There are many indications that the expansion of A. agrarius in Lithuania is becoming invasive.

1. Introduction

The recent changes in land use and climate have been observed to affect the distribution ranges and abundances of numerous animal species [1,2]. One such species is the striped field mouse (Apodemus agrarius), which has been observed to expand its range across several European countries [3,4,5]. The phenomenon of species colonization of new regions and habitats has been observed on multiple occasions [6]. However, the specifics of these processes are not always adequately documented in the absence of long-term studies [4,7]. Despite the well-documented spread of A. agrarius, it is not currently included in the Global Invasive Species Database [8]. The range of the species has expanded enormously in several countries. The transfer of A. agrarius individuals with agricultural production has been reported only exceptionally, so that new areas are mostly colonized by natural spread. Nevertheless, some authors have classified it as a “dangerous invasive alien species in the expanding part of the range” [6,9].
The Palaearctic region has two distinct range fragments of A. agrarius. The first is located in China and the Far East, while the second spans Europe, reaching as far west as West Siberia [10]. The western portion of the species’ range in Europe extends through Denmark, Germany, Czechia, Slovakia, and the southern region through Greece, Ukraine, and Georgia. The northern limit is situated in the south of Finland [11,12]. As observed by V. Petrosyan et al., range expansions occurred in Austria, Azerbaijan, Czechia, Germany, Hungary, Italy, Moldova, Kyrgyzstan, Slovakia, Slovenia, and Ukraine during the 20th and 21st centuries [13]. The species’ phylogeography and demographic history indicate that it is “an oriental wildlife newcomer in Europe”, rendering it susceptible to becoming invasive as it expands its range [10,14].
The species name is derived from the Latin words “ager”, meaning “field” or “land”. In English, as well as in numerous other languages, the term “agrarian” is associated with agriculture or farming. Consequently, the species name suggests a proclivity for agricultural terrain, including fields, grasslands, and farmlands, where it is typically found [11]. Additionally, it has been observed in wetlands, forest edges, gardens, rural areas, and urban areas, and it prefers moist environments [12].
The process of synurbization for this species is thought to have commenced in the mid-20th century [15,16,17]. However, it is predominantly associated with the western region of the species’ range [18]. The process of living in commensal habitats necessitates adjustments at the behavioral [19] and hormonal [20] levels. These adjustments are influenced by the genetic structure of urban and rural populations [21], as well as the anthropogenic pressure gradient [22]. Therefore, the species is well-adapted to human-modified habitats.
In accordance with the dietary structure, A. agrarius has been identified as a granivore within the temperate climatic zone [23,24]. The diet of the species in question encompasses seeds, grains, fruits, insects, and other small invertebrates, with the consumption of animal matter occurring primarily during the spring season [4]. The potential for A. agrarius to transition to an animal-based diet, with up to 40% of its food consisting of animal matter, as observed by V. Holišová [25], enhances the species’ competitive advantage. Consequently, some studies have classified this species as a generalist [26]. However, there is a lack of quantitative studies on the diet of A. agrarius, so a definitive conclusion on its omnivory is not possible.
The spread of A. agrarius is associated with health concerns, as this species is capable of transmitting a range of zoonotic diseases to humans and other animals, including the causative agents of hemorrhagic fever with renal syndrome [6]. Among these, A. agrarius carries Hantaan and Dobrava viruses, both of which are transferrable to humans [27,28]. Additionally, other dangerous pathogens, including Babesia, Anaplasma, Ehrlichia, Leptospira, Rickettsia, Orientia, and Bartonella, have been identified [29,30]. Consequently, the colonization of new areas increases the risk of disease transmission [10].
Mass outbreaks in numbers of A. agrarius are known to occur. In the mixed forest stand of the Kampinos National Park in Poland, such an outbreak was documented in 1959. In comparison to the figures recorded in 1958 and 1960, the abundance was found to be 20–30 times higher, and the suppression of the bank vole (Clethrionomys glareolus) occurred simultaneously [31]. Two additional Polish studies corroborated the avoidance behavior exhibited by A. agrarius towards C. glareolus [5,32] and the potential for competition between A. agrarius and the common shrew (Sorex araneus) [33] within forest habitats. The potential for competition between A. agrarius and the yellow-necked mouse (Apodemus flavicollis), the species with which it shares the greatest ecological similarity, is mitigated by interspecific behavioral responses [34] and different spatial organization [35]. At the community level, it was reported that an increased dominance of A. agrarius resulted in a decrease in the values of diversity and evenness indices [5].
The first documented evidence of A. agrarius in Lithuania dates back to the period between 1949 and 1954. The species was captured in a variety of habitats, including shrubby riparian areas, reedbeds, reclamation ditches, and crop fields [36]. In crop fields, the species proportion in the small mammal community ranged from 5.6% to 19.4%, with an average of 12.7%. No peaks in species abundance were observed; however, data on other habitats were not presented. In the same period, the proportion of A. agrarius in the pellets of the rough-legged buzzard (Buteo lagopus) was 1.0% [36]. Four decades later, the species was observed to exhibit a preference for fragmented habitats and an avoidance of large crop fields. During the winter season, the species was observed to interact with humans [37].
The current status of A. agrarius in Lithuania, along with the observed changes in other small mammal species over the past five decades, has been summarized in [38]. This account presents a comprehensive review of all available published data but lacks a detailed analysis. It was demonstrated that the increase in the proportion of A. agrarius from 1.0% during the period of 1975–1980 to 25.3% in 2021 was accompanied by an increase in the proportion of another granivore, A. flavicollis, and a significant decrease in the proportions of common vole (Microtus arvalis), C. glareolus, and S. araneus. Concurrently, the proportion of species in owl prey increased from zero in the 1970s to 3.4% in the 1990s and 2.0% in the 2000s [38].
The objective of this study was to examine the dynamics of A. agrarius in Lithuania (Northern Europe, Baltic Sea region) over the past six decades, particularly in the context of the ongoing conversion of natural ecosystems to agricultural land. This involved an assessment of changes in the relative abundances and proportions of species within small mammal communities in the main habitats.

2. Materials and Methods

2.1. Study Site and Habitats

The data in this study encompass small mammal trapping activities conducted between 1975 and 2023. During this period, 1822 distinct trapping sessions (defined as a unique combination of year, season, and locality) were carried out, with 1 to 88 sessions per site. We used dataset originating from both published [38] and unpublished sources. The trapping sites span the entire territory of Lithuania (Figure 1A).
To maintain compatibility with our previous publications, we used habitat groupings in nine categories: agricultural, commensal, disturbed, forest, meadow, mixed, riparian, shrub, and wetland. When a single trap line did not fit into a single habitat, the combination of these fragments was characterized as mixed habitat. At the same time, all mixed habitats are fragmented because several different patches fit into a 125 m line. A detailed description of the habitats used can be found in [39]. Equal trapping effort across habitats was not ensured in the long term (Table 1).

2.2. Small Mammal Trapping

Most of the dataset was generated during the inventory of mammals in protected areas carried out in 1970s–2010s, the monitoring of small mammals in the region of the Ignalina nuclear power plant in the 1980s, and the monitoring of small mammals within the National Environmental Monitoring Program in 1993–2005 (with gaps of some years). In the 1970s–1980s and 2010s–2020s, small mammals were trapped as hosts for parasitological studies; all this material is available in the dataset. Nationwide trapping to fill gaps for the Lithuanian Mammal Atlas and inventory of potentially biodiversity-rich areas in several districts of the country was conducted in 1995–1997. Other major data collections were made during the study of meadow-forest succession in 2007–2012, the study of Great Cormorant (Phalacrocorax carbo) colonies in 2011–2023, the inventory of commercial orchards in 2018–2023, and the study of commensal habitats in 2019–2024. Inventories of small mammals in meadows were carried out in the 1970s, and irregular and uncoordinated trapping of small mammals were carried out in the 1970s and 1990s–2010s.
As a standard for small mammal trapping in Lithuania during the whole period, snap traps were used in lines of 25 traps 5 m apart. The trapping effort was 1–12 such lines per habitat. Exceptions are trapping sessions in commensal habitats, especially inside buildings, and in certain habitats too small to accommodate the standard number of traps. In most cases, traps were set for three days, checked once a day in the morning or twice a day, morning and evening. Shorter trapping sessions (1–2 days), mostly during bad weather, were considered non-standard. They were rare and only occurred under unavoidable circumstances. Traps were baited with brown bread and crude sunflower oil, and only in a few trapping sessions in the 1970s–1980s with carrot, apple, or other plant material.
Material from captured individuals has been and continues to be used for diet, reproductive, genetic, gut microbiome, and various pathogen studies. Some of the material has been used in collaboration with research institutions in other countries and in joint publications. The by-catch of birds and amphibians did not exceed a few dozen during the entire period, and the number of weasels (Mustela nivalis) killed was only a few.

2.3. Study Periods and Sample Size

Our study periods include different temporal scales. Each trapping session was assigned to a month and season: winter (December–February), spring (March–May), summer (June–August), and autumn (September–November). Maximum trapping effort was observed in September and October, as well as in May (Table 2). This corresponds to the monitoring practice in Lithuania, where spring and autumn monitoring are the most common. The other small mammal projects, such as species inventory, were mainly conducted in autumn.
Trapping years were grouped into decades: 1970s (1975–1979), 1980s (1980–1989), 1990s (1990–1999), 2000s (2000–2009), 2010s (2010–2019), and 2020s (2020–2023). Highest trapping effort was in 1990s and 2000s (Table 3). The highest trapping effort occurred in the 1990s and 2000s (Table 3).

2.4. Case Study Sites

We selected eight case sites to represent all parts of the country (eastern, northern, western, central, and southern) and a selection of different habitats (Figure 1B). These cases either span several years or include at least two different decades to compare the status of A. agrarius. All sites are characterized by considerable trapping effort, large numbers of small mammals captured, and small mammal species richness (Table 4).

2.4.1. Site 1: Žagarė Forest and Žagarė Regional Park

The first study of small mammals in northern Lithuania, Žagarė Forest, was conducted in 1975 [40], before the Regional Park was established. Habitats surveyed were various types of forests, clearcuts, meadows, and grasslands around reclamation ditches. In the second study, 2008–2012, the habitats in the Regional Park were the same: forests, clearcuts, and meadows, but also the area of abandoned farmsteads [41].

2.4.2. Site 2: Vicinity of Biržų Giria Forest

In site 2, northern Lithuania, the first study in 1977 covered mainly open habitats on the farmstead, such as mowed meadow, shrubby meadow, old orchard, and shrubby area between forest and farmstead. In the second study, 1997–2005, small mammals were trapped in abandoned farm, abandoned orchard, natural and mowed meadows, as well as shrub meadows, riparian meadows, and forest–meadow ecotone. In both periods, abandoned, non-mowed meadows predominated.

2.4.3. Site 3: Dzūkija National Park

This site represents southern Lithuania. The first study period, 1978–1980, covered wetlands, coniferous, deciduous and mixed forests, and meadows [42]. In the period 1991–1995, the standard monitoring approach was used, with forest, wetland, and meadow used for small mammal trapping [43,44]. In the third period, 1999–2004, coniferous and deciduous forests, meadows, and riparian habitats were surveyed as part of the National Environmental Monitoring Program [45]. Additional surveys were conducted in 2002, covering different habitats [46].

2.4.4. Site 4: Ignalina Region

We used data from small mammal monitoring in eastern Lithuania, in the region of the Ignalina nuclear power plant. Seven sites within a radius of about 10 km were used [47]: four of them in 1981–1990, and the remaining three in 1984–1990. In all sites, small mammals were sampled three times a year (in May, July, and October) with the same trapping effort in forest, meadow, and wetland habitats. In some sites, additional trapping was carried out irregularly in agricultural and commensal habitats.

2.4.5. Site 5: Žemaitija National Park

Monitoring of small mammals in northwestern Lithuania, Žemaitija National Park, was carried out in two periods: 1993–1995, covering the standard set of habitats, forest, wetland, and meadow [43], and 1997–2004, when forest and meadow were covered. In addition, a targeted study of mammals was conducted in 1997–1998, when small mammals were trapped in forests, wetlands, meadows, reedbeds, and riparian habitats [48].

2.4.6. Site 6: Lipliūnai Environs

As part of the National Environmental Monitoring Program, small mammal trapping was conducted in 1997–2004 in central Lithuania, Lipliūnai environs. A standard set of forest, meadow, and agricultural habitats was covered two times per year, in May and October, with standard trapping effort, 150 trap days per session [45].

2.4.7. Site 7: Zarasai Region

We compare the results of three studies conducted in the Zarasai region of eastern Lithuania. In the first one, 2000–2005, small mammals were trapped in forest fragments and surrounding meadows in summer and fall, from June to October [49]. In 2004–2009, the main habitats were meadows near abandoned farms. This study covered the non-vegetation period from November to April, i.e., including winter trapping [50]. The third study investigated changes in the mammal community during meadow–forest succession, so the three habitats covered were meadows, overgrown meadows with shrub and tree saplings, and young forest, all sampled in June to October, 2007–2012 [51].

2.4.8. Site 8: Rusnė Environs

This is the longest study of small mammals at the same site in western Lithuania, conducted during 2004–2020 near to Rusnė settlement. Initially, different habitats were covered, including flooded meadows, riparian habitats, flooded forests, reedbeds, shrubs, agricultural habitats, and fallow land [52]. In 2008–2020, the same flooded meadow was studied with multiple disturbances, flooding, and conversion to pasture [53]. Small mammals were trapped from August to October.

2.5. Data Analyses

The relative abundance (RA) of A. agrarius was expressed as the number of individuals per single trap day. We tested the normality of the data on the RA of A. agrarius and found the best fit to be a gamma function (Kolmogorov–Smirnov d = 0.0047, χ2 = 3.39, df = 9, p = 0.49). Based on this, we run GLM with RA of A. agrarius as the dependent factor, decade, season, and habitat group as categorical factors and trapping effort as continuous predictor. We assessed the significance of these factors using F and p, and the effect size using partial eta-squared (η2). Graphical presentation was carried out using mean and 95% confidence intervals (CI). Differences in dependent variables between categories of categorical factors were performed using post hoc analysis (Tukey HSD with unequal N). The simultaneous influence of trapping decade on both RA and proportion was assessed using Wilks’ lambda to determine whether the mean vectors were equal for both dependent variables. The minimum significance level was set at p < 0.05.
We tested whether the number of A. agrarius captured in different habitats was consistent with the expected number, calculated as a function of trapping effort. The consistency was tested using the χ2 statistic. We hypothesized that in some habitats, the observed number of captured individuals exceeds the expected number. The null hypothesis was rejected at p < 0.05.
The cyclicity of A. agrarius RA was assessed visually from the plot of annual means and confirmed by autocorrelation analysis.
Chi-square test, test for normality of BCI distribution, and autocorrelation were calculated using PAST version 4.13 (Museum of Paleontology, Oslo College, Oslo, Norway) [54]. All other calculations were performed using Statistica for Windows, version 6.0 (StatSoft, Inc., Tulsa, OK, USA) [55].

3. Results

GLM for A. agrarius RA and proportions in small mammal communities are both weak but significant. Relative abundances were related to season (F3,1800 = 9.75, η2 = 0.037), habitat (F8,1800 = 8.09, η2 = 0.035), and decade (F5,1800 = 9.77, η2 = 0.025, all p < 0.0001). Similarly, proportions of A. agrarius in the small mammal community were related to season (F3,1800 = 12.6, η2 = 0.047), habitat (F8,1800 = 8.33, η2 = 0.036), and decade (F5,1800 = 8.61, η2 = 0.023, all p < 0.0001). The influence of trapping effort in both cases was not significant.

3.1. Temporal Changes in Striped Field Mouse Population

We analyzed the monthly, seasonal, annual, and long-term dynamic in A. agrarius in Lithuania, comparing observed RA and proportions with those expected according to the trapping effort.

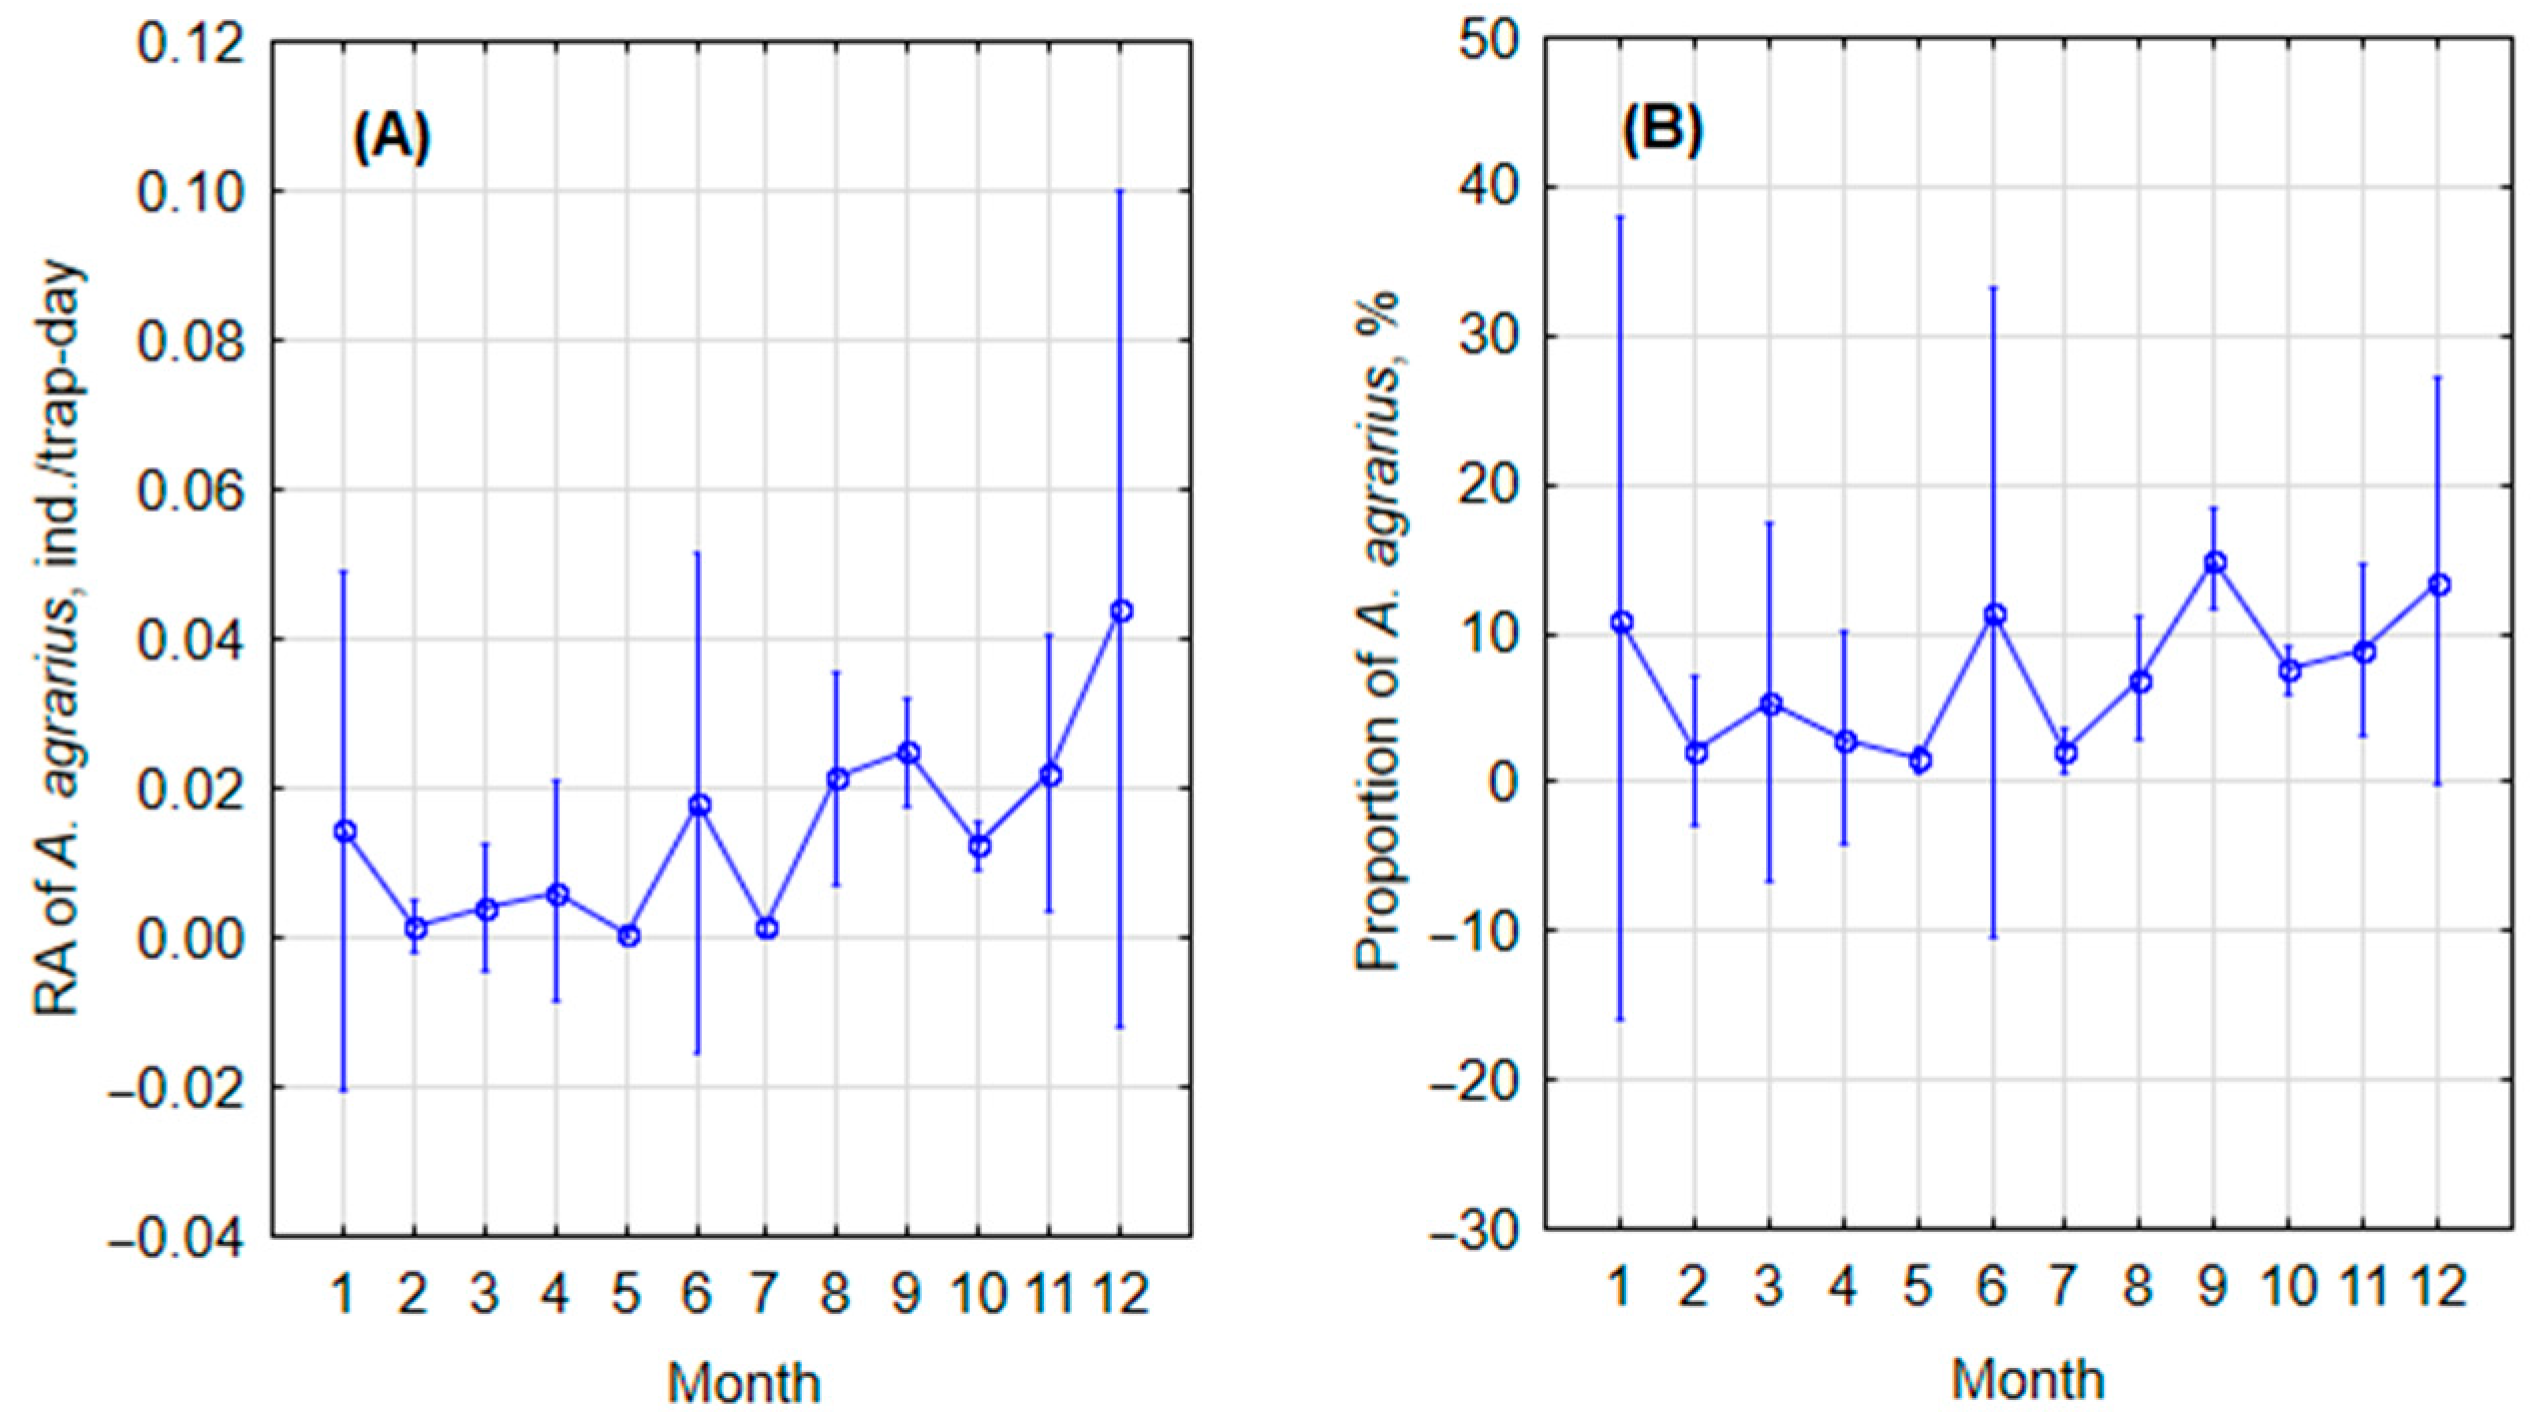
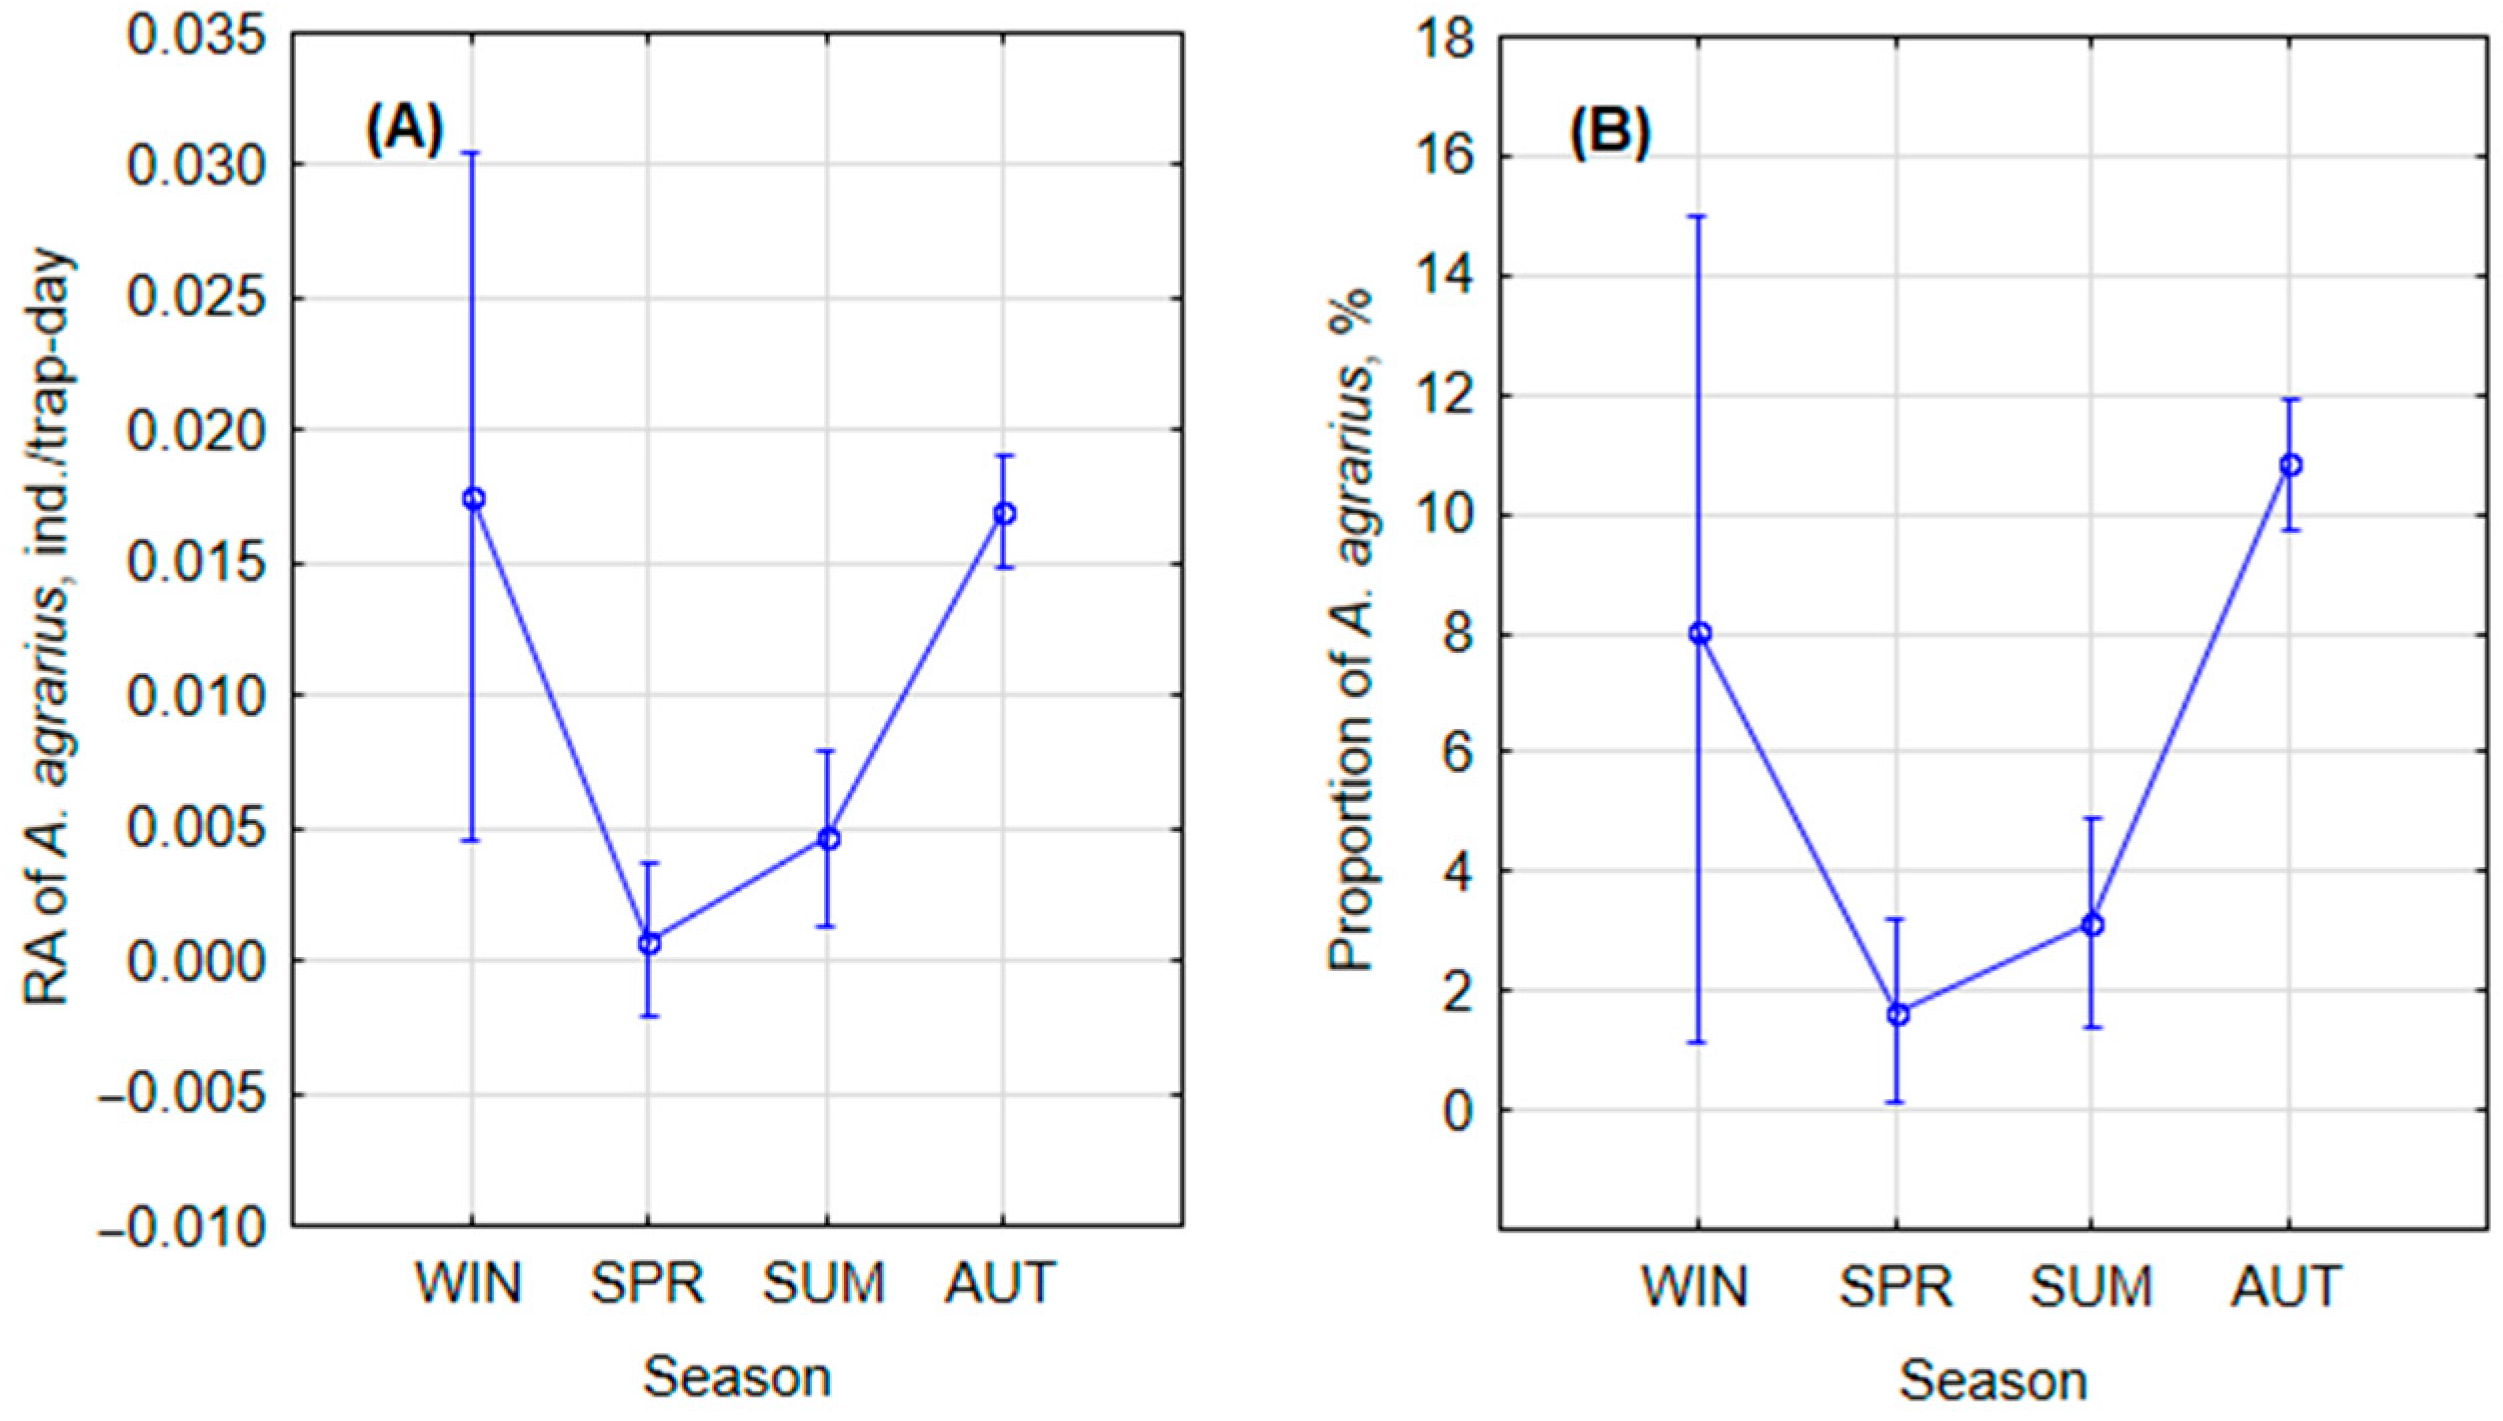
3.1.1. Monthly and Seasonal Trends

The monthly pattern in RA of A. agrarius was not clear. Relative abundance of A. agrarius was shown to increase from late summer to winter, but these changes lacked significance when accounting for habitat and decade covariates (Figure 2A). Minimum RA was observed in May, which was significantly lower than in December and January (post hoc, p < 0.001). Similarly, the proportion of species in the small mammal community showed a minimum from February to May and in July, increasing with a maximum in September. However, based on post hoc, significant differences were only between A. agrarius proportions in May and July as minimum and those in September and October (p < 0.02). Other differences were not significant due to parameter variation after accounting for covariates (Figure 2B).
Seasonally, both RA (Figure 3A) and proportion (Figure 3B) of A. agrarius decreased from a maximum in fall and winter to a minimum in spring. In spring and summer, the minimum values of both RA and proportion were significantly lower than in the other two periods (post hoc, p < 0.0001).

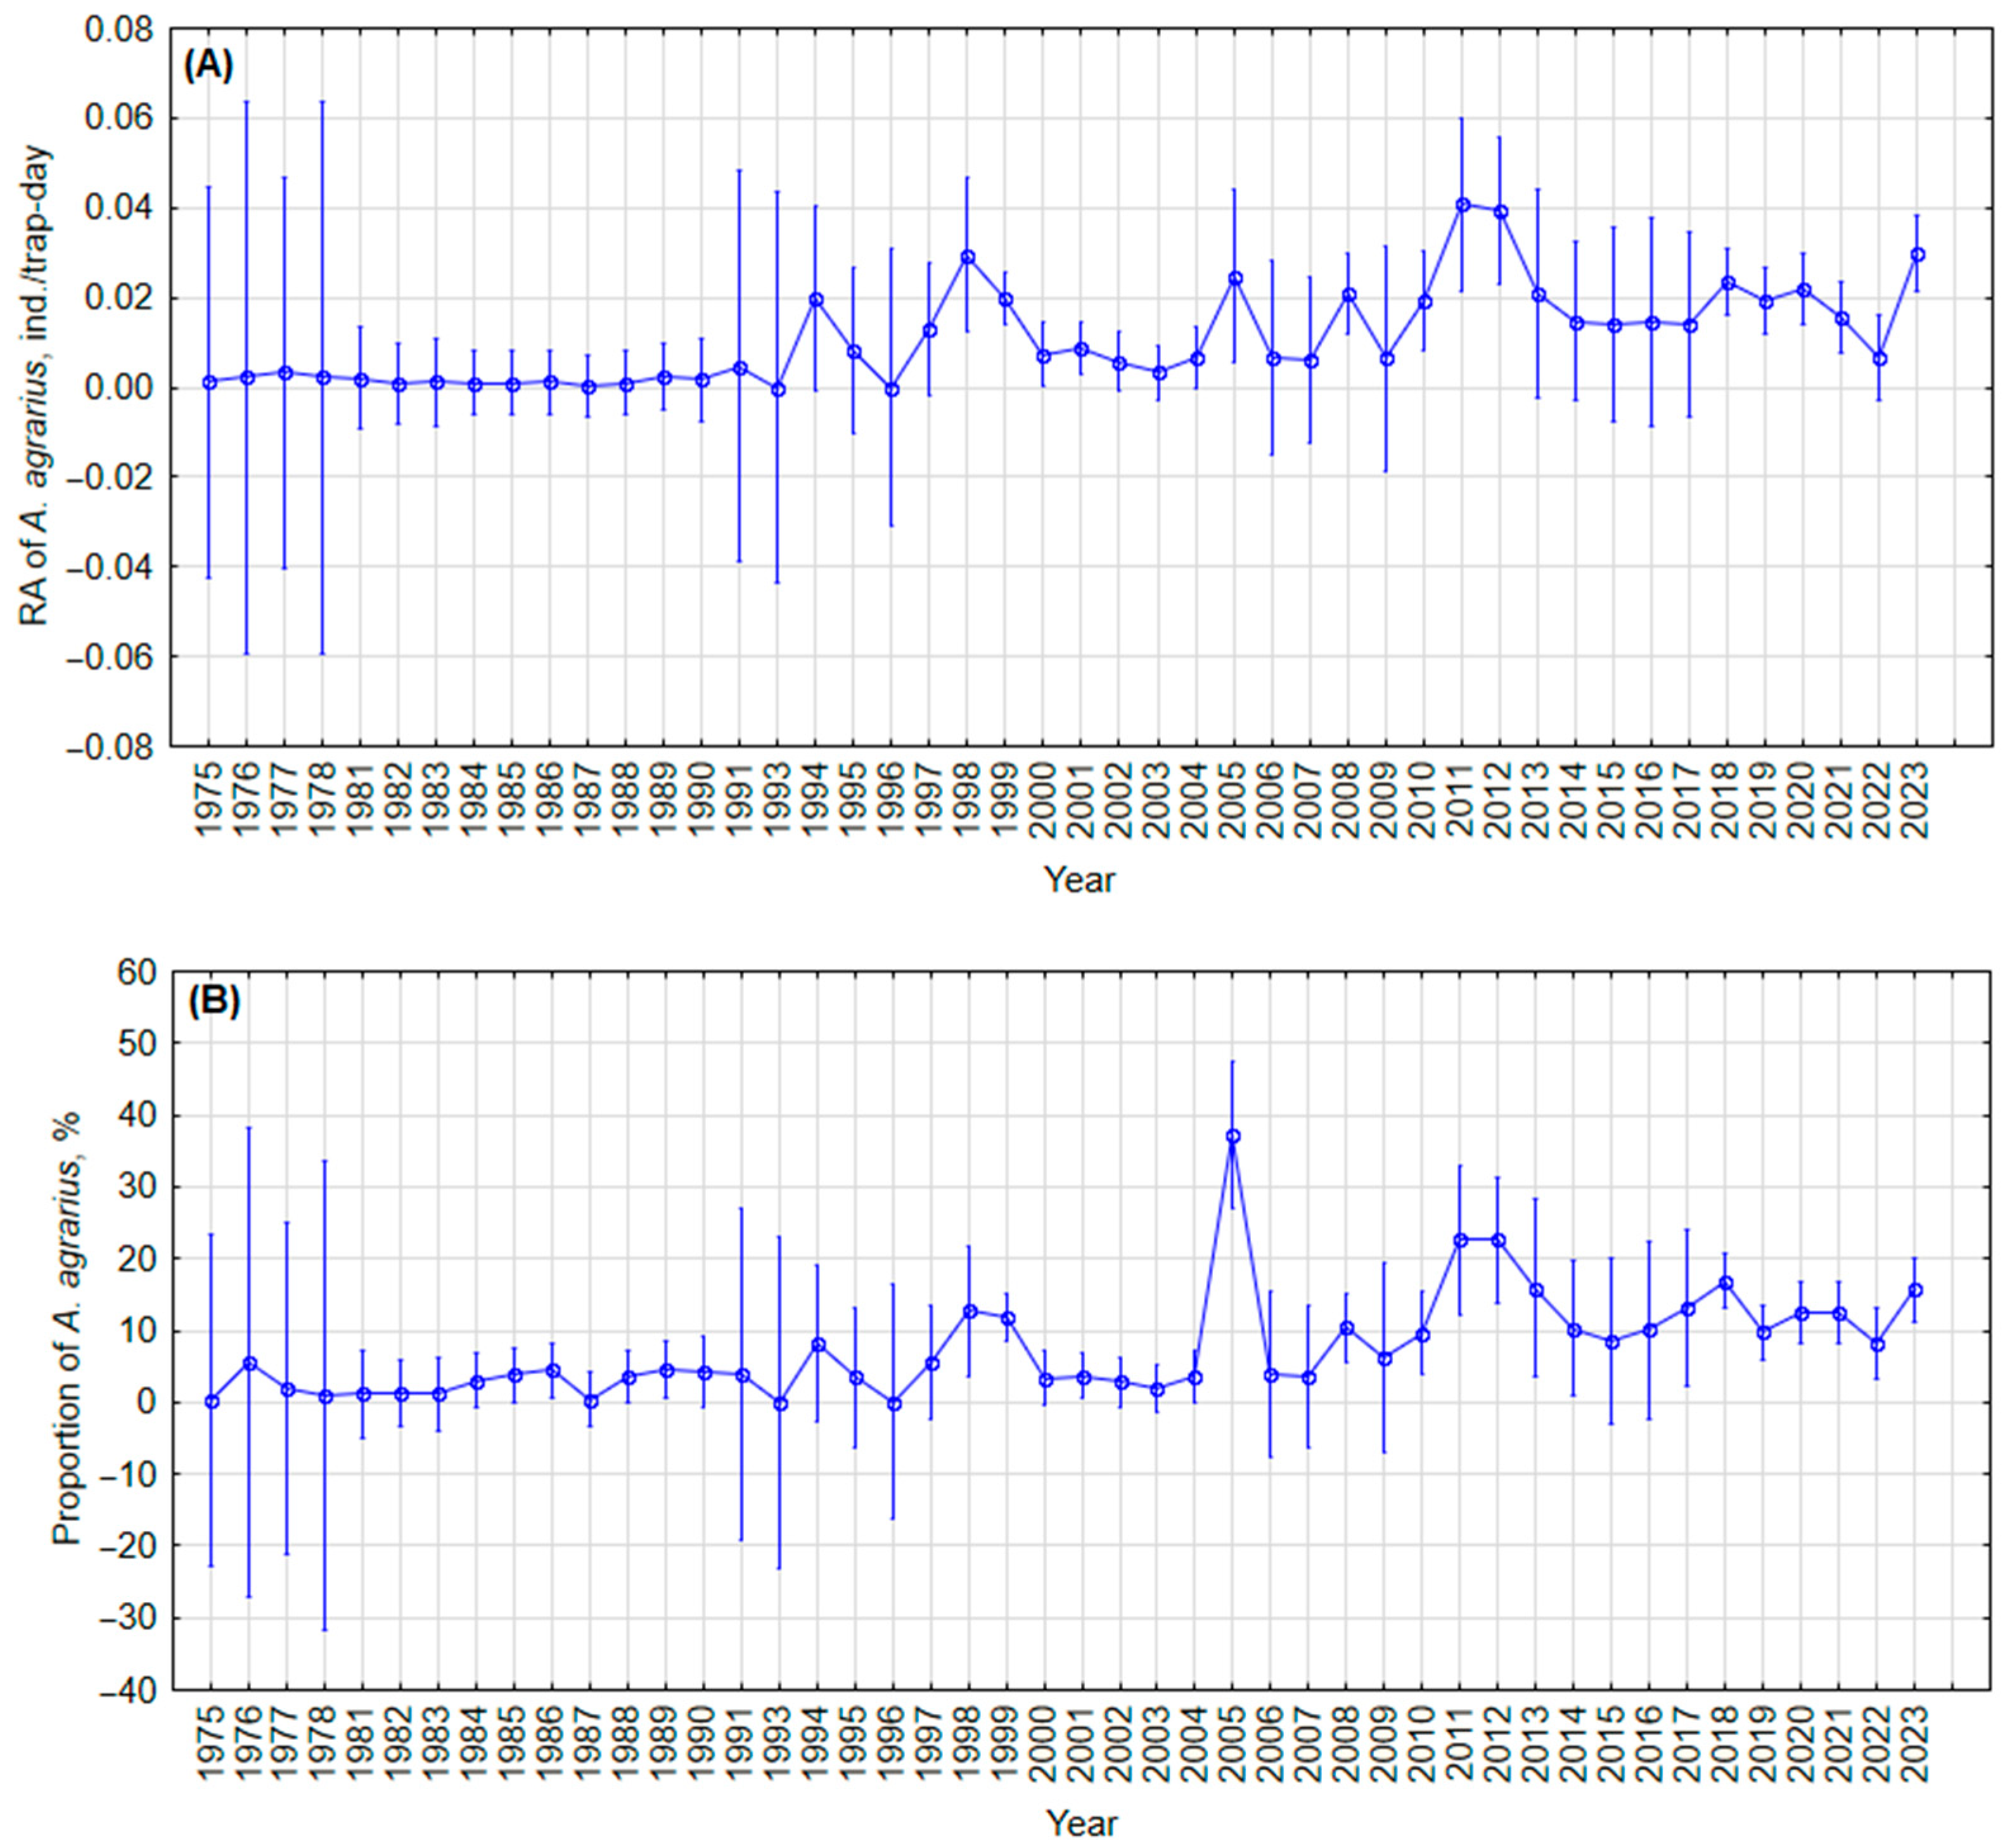
3.1.2. Annual Fluctuations

We did not observe regular changes in annual RA of A. agrarius during 1975–2023 in Lithuania. Until 1993 RA was very low, close to zero, during 1994–2000 two three-year long cycles were observed, and in the last two decades, fluctuations were noticeable but irregular (Figure 4A).
The proportion of A. agrarius in its dynamics reflects most of the changes in RA (Figure 4B). The spike in abundance in 2005 was associated with a sharp decline in the abundance of other small mammal species, where even small numbers of A. agrarius formed a significant part of the community.

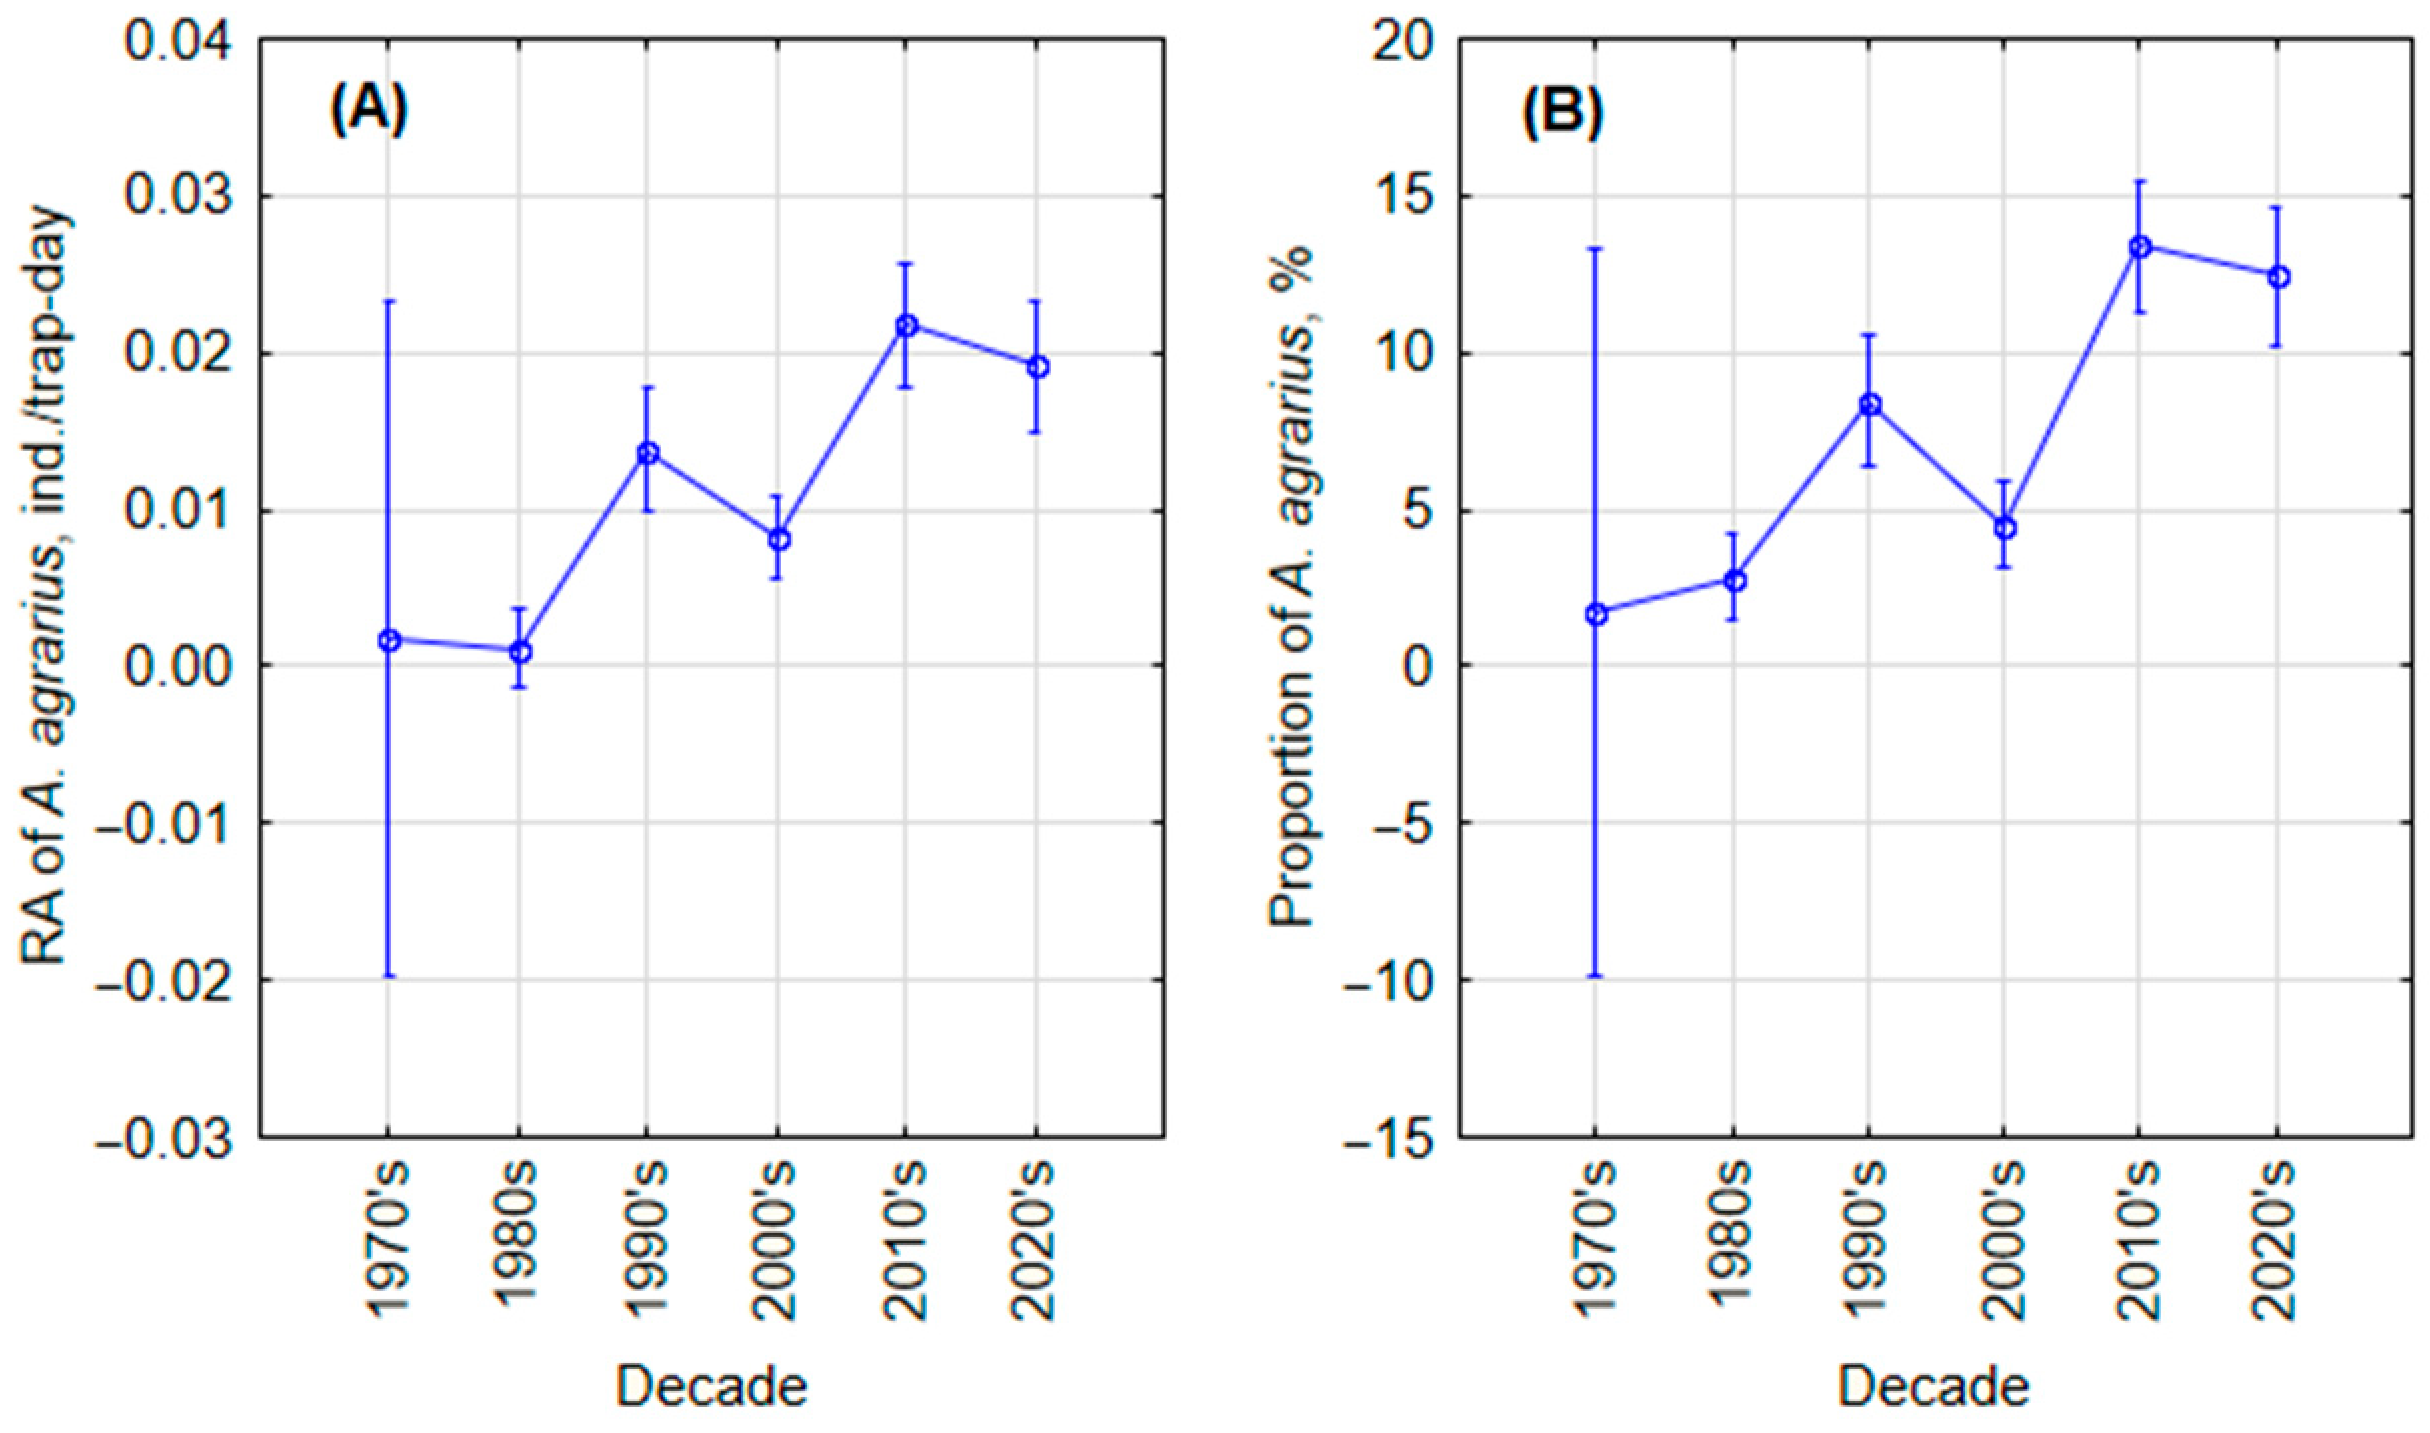
3.1.3. Long-Term Changes

Both RA and proportion of A. agrarius showed similar long-term increasing changes over the six decades analyzed (Wilks lambda = 0.93, F10,3628 = 13.1, p < 0.0001). Each of these indices had three distinct periods with no difference in values within them (Figure 5A,B).
The 1970s–1980s, with RA values of 0.001–0.002 ind./trap day, were two decades of minimum species abundance, followed by intermediate abundances in the 1990s–2000s (0.008–0.014 ind./trap day), and after the 2010s (0.019–0.022 ind./trap day), a period of maximum abundance was observed (Figure 5A). According to post hoc analysis, the RA differences between these periods were significant (p < 0.005).
Similarly, the average proportion of A. agrarius increased from 1.7–2.8% in the 1970s–1980s, to 4.5–8.5% in the 1990s–2000s, and 12.4–13.4% in the 2010s–2020s, with all differences between periods being significant (post hoc, p < 0.003). In the first two decades, A. agrarius was not trapped in 90.7% of trapping sessions, in the 1990s–2000s in 71.1%, and after 2010s in 59.3% of trapping sessions. Expected and observed numbers of trapped A. agrarius were significantly different in these periods (χ2 = 10,883, p < 0.0001). In the 1970s–1980s, the number of individuals captured was 9.1–9.2 times less than expected. In 1990s–2000s, observed and expected numbers did not differ. In 2010s–2020s, we caught 1.5–2.2 times more A. agrarius than expected according to trapping effort.
In the 1970s, A. agrarius was the seventh species in the small mammal community according to the number of captured individuals, in the 1980s it was the fifth species, with a lower number than the pigmy shrew (Sorex minutus). In 1990s–2000s A. agrarius was the 4th species, after S. araneus, A. flavicollis and the dominant, C. glareolus. By the 2010s–2020s, A. agrarius was already in third place, behind only A. flavicollis and C. glareolus.

3.2. Local Changes in Striped Field Mouse Populations

Analysis of A. agrarius trends in local populations also shows an increase in both RA and proportion of the species in small mammal communities (Table 5), with the exception of the 2000s when the species was not captured in natural overgrown meadows at Site 2.
Thus, in Site 1, the RA of A. agrarius increased 10.5 times over 30 years, the proportion increased 17.6 times, after 35 years–11.5 and 24.2 times, respectively.
In Site 2, comparing to 1970s, after two decades, the increase in A. agrarius RA and proportion was 8 and 5.6 times, after four decades, it was 8 and 7.8 times higher. All this time, the habitats were similar, mainly overgrown meadows and commensal habitats such as abandoned farmsteads, cottages, and gardens. In trappings of 2000s, however, A. agrarius was not captured.
In Site 3, A. agrarius was not found in the 1970s, but between the 1990s and 2000s its RA increased 5.6-fold, while the proportion doubled.
Site 5 was the only case where A. agrarius were present in the 1990s, but not found in the 2000s (Table 5). However, from 1993–1995 and 1997–2004, all A. agrarius were captured in 1997, when different habitats were intensively surveyed for small mammals. In the remaining years, the species was not found, although all years included meadows among the habitats surveyed.
In Site 6, small mammals were monitored exactly in the same habitats during 1997–2004, and comparing decades, the increase in RA was 1.6 times, that of proportion 2.2 times. Out of 103 individuals of A. agrarius, 86 were captured in agricultural habitat, 17 in mowed meadow, and the species was not present in the forest.
In Site 7, the increase in A. agrarius RA was 4.3, that of proportion 7.4 times comparing two decades, 2000s and 2010s, and the species was equally present in forest fragments, commensal and meadow habitats (36, 30 and 39 individuals, respectively).
In Site 4, surveys were conducted over a decade, in the same habitats during 1981–1990. During this period, 58 A. agrarius were trapped in wetlands, 37 in meadows, and only 6 individuals in forests, all three habitats with the same trapping effort. An increasing trend in RA was observed in wetlands (Figure 6A) and a decreasing trend in meadows (Figure 6B), while the proportion of species showed an increasing trend in both habitats (Figure 6C,D). Year-to-year differences, however, were not significant due to parameter variation. Fluctuations were irregular in both wetlands and meadows.
In site 8, both RA (Figure 7A) and proportion of A. agrarius (Figure 7B) increased significantly in flooded habitats from 2004 to 2020. Trends were not cyclical, only irregular fluctuations were observed. Relative abundances peaked in 2011, significantly higher than in 2004 (post hoc, p < 0.05), and in 2018–2020, higher than in all other years except 2011–2012 (post hoc, p < 0.05). The proportion of species peaked in 2005, 2011 and 2018–2020, all of these peaks being higher than the initial value in 2004 (post hoc, p < 0.05). In the last years the anthropogenic influence on the habitat reached its maximum. In 2020, the meadow was converted into cattle pasture.

3.3. Habitats of Striped Field Mouse in Lithuania

Expected and observed numbers of captured A. agrarius were significantly different (χ2 = 3817.7, p < 0.0001). The number of trapped individuals in meadows and commensal habitats was 1.7 times higher and in agricultural habitats 1.5 times higher than expected. In mixed habitats, the number of trapped individuals did not differ from the expected number. In forest, the number of trapped individuals was 3.9 times, in shrub 3.1 times, in disturbed habitats and wetlands 2.0 times, while in riparian habitats 1.7 times less than expected according to trapping effort.
In forest, wetland, shrub, and riparian habitats, A. agrarius was not captured in 81.6–86.2% of trapping sessions. In grasslands, 73.9% of trap sessions were null, in disturbed and agricultural habitats 63.2–68.3%, in commensal habitats 51.0%, and in mixed habitats 42.3% yielded no A. agrarius.
The commensal habitat stood out in terms of the highest A. agrarius RA, outperforming all other habitats (post hoc, p < 0.05), except the mixed habitats (Figure 8A). Mixed, agricultural, and meadow habitats were characterized by intermediate RA (within group, differences in RA not significant). Forest, shrub, riparian, wetland, and disturbed habitats were characterized by the lowest RA, with no within-group differences. Covariates such as decade and season of capture were considered.
After accounting for covariates, the proportions of A. agrarius differed statistically by habitat in the same way as shown visually (Figure 8B). The highest proportion, over 20% of all small mammals captured, was found in agricultural habitats, surpassing all others except meadows and commensal habitats (post hoc, p < 0.05), and meadows, higher than forest, shrub, riparian, disturbed, and mixed habitats (post hoc, p < 0.05). Forest, shrub, riparian, disturbed, mixed, and wetland habitats form a group with A. agrarius proportions below 10% (no differences within this group according to post hoc). Commensal habitats are intermediate between the two groups.
In the best studied habitats, the proportion of A. agrarius in the small mammal community increased throughout the study period (Figure 9). Comparing 1970s and 2020s, increase was 24.4-fold in meadows, 18.8-fold in commensal habitats, and 11.5-fold in forests. From 1970s to 2010s, the increase in species proportions in mixed habitats was 19.8 times, and from 1980s to 2010s in wetlands was 6.9 times.

4. Discussion

Our results indicate that the increasing trends in A. agrarius in Lithuania are related to the anthropogenic landscape, i.e., agricultural and commensal habitats and meadows, with the minimum abundances and species proportions in forests, shrubs, or wetlands. In Poland, it has been shown that A. agrarius is not characteristic of continuous forests, although the association of the species with agricultural habitats also determines its occurrence in the nearest forest fragments [56]. In general, underutilized agricultural areas, such as abandoned meadows, can have a strong impact on small mammal communities [57].
Fragmentation of agricultural landscapes and the mosaic of cultivated, set-aside, and stable land increases species richness and diversity of small mammal communities [58]. However, the negative influence of intensive agriculture is mostly related to the diversity of small mammal assemblages, not to the overall abundance [59]. These authors observed an increasing abundance of A. agrarius in natural environments. Our results were the opposite (see Figure 8). This difference was probably due firstly to the abundance of A. sylvaticus in their study area (in Lithuania, it is a rare species), and secondly, to the different diet of A. agrarius (the authors describe it as a specialist species [59], while in Lithuania, this species is a generalist one).
We cannot directly compare results from southern countries on agricultural intensity and the diversity of small mammal communities, due to different species composition (A. agrarius not present). Long-term changes in Italy, comparing 1994–1995 and 2015–2016, show a strong decrease in shrews and an increase in brown rats (Rattus norvegicus) and house mice (Mus domesticus), although species richness and diversity indices remain similar [60]. These authors exclude both large-scale land use and climate change as drivers, emphasizing changes in agricultural practices, such as the use of herbicides and insecticides, as well as the expansion of maize fields. Small mammal communities are simplified under increasing human pressure and decreasing cover of seminatural areas [61]. In Portugal, it has been found that the species richness of small mammals is maintained by seminatural areas with a minimum of anthropogenic disturbance, coupled with a patchy and heterogeneous mosaic of different land uses [62].
Trapping small mammals is the main tool for understanding their long-term changes, but it is a laborious process; case studies that include trapping at the same sites over decades are not numerous, or do not include data on our target species, A. agrarius. In addition to the results of small mammal trapping, changes in small mammals may be reflected in the diets of various owl and other raptor species. As demonstrated in Great Britain, the diet of barn owls (Tyto alba) indicates changes in small mammal communities for two decades, between 1974 and 1997. The main changes in the diets were related to a significant increase in Apodemus spp. mice, C. glareolus and S. minutus, while S. araneus decreased. These changes “since 1974 were independent of land-class group” and were discussed “in relation to intensification of agriculture and other changes in land management” [63]. The decrease in insectivores in the diet of T. alba for four decades was also confirmed in Italy [64]. Therefore, in addition to the small mammal traps already mentioned in the introduction, we also refer to some of the many analyses of owl pellets related to an increase in the presence of A. agrarius in different regions.
In the synanthropic environments and agricultural landscape of Slovakia, the share of A. agrarius in the prey of T. alba was only 1.5% during five decades [65]. In the neighboring region of Podillia in southwestern Ukraine, the proportion of A. agrarius in the pooled diet of long-eared owl (Asio otus), little owl (Athene noctua), tawny owl (Strix aluco), and eagle owl (Bubo bubo), was also low, only 1.3% [66]. In Baranja, Croatia, the proportion of A. agrarius in the diet of T. alba remained constant in 2007 and 2016 at 4.82% and 4.67%, respectively. As landscape structure did not change, trends in other small mammal species were related to changes in agricultural practices, such as frequent mowing of meadows, regulation of rodenticide use, and the depopulation of villages. These changes did not affect A. agrarius [67].
At the Neusiedler See in Austria, T. alba pellets show the arrival of A. agrarius in 2006, and since then, its presence in pellets has increased every year [68]. In Poland, the proportion of A. agrarius in the diet of S. aluco decreased with the degree of urbanization, from 16.8% in the countryside to 14.8% in urban habitats [69]. Synurbization of A. agrarius in Poland has been known for a long time [16,17]. In forested areas of Warsaw, the share of A. agrarius in the diet of S. aluco decreased from 20.1% in 1995–2007 to 11.7% in 2010–2018; outside the city, the decrease was from 3.2% to 2.6% [70]. In the suburbs of Warsaw, the share of A. agrarius was 9.2% [71].
Thus, our previous results, 2.0–3.4% of A. agrarius in S. aluco diet in agricultural landscape and small forest fragments in Central Lithuania [38], are in agreement with the cited data. However, the results of small mammal trapping at the same place and time as the owl diet study show 5.3–11.8% of A. agrarius in all small mammals in Central Lithuania. We agree with the opinion that owls are more effective in assessing the composition of small mammal communities than conventional traps [72]. However, the most commonly used owl species, T. alba and S. aluco, are both generalists. Since A. agrarius is most likely not their preferred prey, pellet composition may misrepresent the actual proportions of this species in the owl hunting area. For example, in the Mediterranean region, A. agrarius never dominated the diet of T. alba [73].
The other results of the current analysis, related to temporal aspects of the A. agrarius population, are novel for areas to the north of Lithuania Temporal variations in the relative abundance and the proportion of species are typical, with low values observed in February–July and high values in September–January. Similar changes have been observed in Poland [32]. In Lithuania, the annual dynamics of this species, in general and according to local long-term studies, were not cyclic. Cyclic changes in A. agrarius were also not observed in Poland [33,74], although peaks in numbers were observed in the former period [31]. In the north of Lithuania, “regular density fluctuations every one to three years with an amplitude of five to 21 times” were reported in A. agrarius [75]. Damping of small mammal cycles in Latvia was found by [76], although their data do not specifically refer to A. agrarius.
Recently, expansions of A. agrarius were observed in both western and southern parts of European species range [9]. Encroachment and entrenchment into arable lands [77], and synurbization of the species [16,17,18,19,20,21], allow some authors to consider species prone to invasions [10,17] or being invasive [6,9].
According to our results, can A. agrarius be considered an invasive species in the country, or should the process only be called “expansion” as in Slovakia according to [4,5]? For example, in Site 8, the RA of A. agrarius increased almost 100-fold in less than two decades, and the species represented 76–93% of all captured small mammals, despite the continuous anthropogenic transformation of the habitat. Such an increase could be considered a typical invasion. In Lithuania, A. agrarius fulfilled all stages of species invasion according to [5]: it is distributed all over the country, occupies all habitats, and can dominate in meadows, agricultural land, and commensal habitats. The presence of this mice in houses and other buildings is confirmed throughout the year. The influence of A. agrarius on small mammal communities in Lithuania is associated with a decrease in species richness and diversity [38,53], although detailed analyses are still needed. Damage caused by A. agrarius was reported in the 1950s and 1980s [36,37]; however, no further research on this issue was conducted. In Lithuania, it is a host of various pathogens, including viruses, bacteria, protozoa, and helminths, as well as ectoparasites, such as ticks, fleas, and mites [78,79,80]. At the current stage of research, the listed traits of A. agrarius are close to defining it as invasive in Lithuania, although species introductions by human activities in the country are not known. However, as stated by [81], “expanding native species may be functionally indistinguishable from invading alien species in many respects”, so we postpone the final classification until more data are collected.
Based on 29 years of monthly trapping series in the southeastern part of the A. agrarius range in China, population dynamics were found to respond to changes in the agricultural system, climate change, and the cumulative effect of both [82]. While the seasonal dynamics are not comparable to European populations, the responses to agricultural practices are similar. Abundance of A. agrarius increases with landscape complexity at a small spatial scale, which provides a higher proportion of agricultural habitats than the coarser scale [83]. Several initiatives in the EU, such as the EU Biodiversity Strategy for 2030 [84], restoration of perennial grasslands [85,86], an biodiversity-friendly agricultural practices [87], will continue and increase the acceptability of the landscape for small mammals, especially for those species that are already familiar with agricultural habitats. Increasing the area of protected areas in the EU to 30% of the territory will require the designation of new areas in semi-natural ecosystems and even on productive/agricultural land [88]. Given that even relatively small, protected areas are positive for the small mammal community [89], we can expect further expansion of A. agrarius in Europe westwards and northwards.

5. Conclusions

Based on long-term data on small mammal trapping in Lithuania, we have found (1) an increase in the abundance and proportion of A. agrarius in the community, (2) increasing synanthropization of the species, and (3) tolerance of anthropogenization of habitats. Many signs point to the expansion of A. agrarius in Lithuania becoming invasive.

Author Contributions

Conceptualization, L.B. (Linas Balčiauskas); methodology and investigation, L.B. (Linas Balčiauskas) and L.B. (Laima Balčiauskienė); formal analysis, L.B. (Linas Balčiauskas); writing—original draft preparation, L.B. (Linas Balčiauskas) and L.B. (Laima Balčiauskienė); writing—review and editing, L.B. (Linas Balčiauskas) and L.B. (Laima Balčiauskienė). All authors have read and agreed to the published version of the manuscript.

Funding

The work of the authors was funded by the budget of Nature Research Centre.

Institutional Review Board Statement

The study used historical material on small mammal trapping and material collected for other projects. It was conducted in accordance with Lithuanian legislation (the Republic of Lithuania Law on the Welfare and Protection of Animals No. XI-2271, “Requirements for the Housing, Care and Use of Animals for Scientific and Educational Purposes”, approved by Order No. B1-866, 31 October 2012 of the Director of the State Food and Veterinary Service (Paragraph 4 of Article 16) and European legislation (Directive 2010/63/EU) on the protection of animals, and was approved by the Animal Welfare Committee of the Nature Research Centre, protocols Nos. GGT-7 and GGT-8).

Informed Consent Statement

Not applicable.

Data Availability Statement

This is ongoing research; therefore, data are available from the corresponding author upon request.

Acknowledgments

We acknowledge the help of P. Alejūnas, M. Jasiulionis, and V. Stirkė in small mammal trapping, and Andrius Kučas for making maps. We also acknowledge all former staff of Laboratory of Theriology, and the staff of Regional Parks of Lithuania, who took part in small mammal monitoring programs.

Conflicts of Interest

The authors declare no conflicts of interest.

References

  1. Van der Putten, W.H.; Macel, M.; Visser, M.E. Predicting species distribution and abundance responses to climate change: Why it is essential to include biotic interactions across trophic levels. Philos. Trans. R. Soc. B 2010, 365, 2025–2034. [Google Scholar] [CrossRef] [PubMed]
  2. Williams, J.J.; Newbold, T. Local climatic changes affect biodiversity responses to land use: A review. Divers. Distrib. 2020, 26, 76–92. [Google Scholar] [CrossRef]
  3. Spitzenberger, F.; Engelberg, S. A new look at the dynamic western distribution border of Apodemus agrarius in Central Europe (Rodentia: Muridae). Lynx 2014, 45, 69–79. [Google Scholar]
  4. Tulis, F.; Ambros, M.; Baláž, I.; Žiak, D.; Sládkovičová, V.H.; Miklós, P.; Dudich, A.; Stollmann, A.; Klimant, P.; Somogyi, B.; et al. Expansion of the Striped field mouse (Apodemus agrarius) in the south-western Slovakia during 2010–2015. Folia Oecologica 2016, 43, 64–73. [Google Scholar]
  5. Tulis, F.; Ševčík, M.; Jánošíková, R.; Baláž, I.; Ambros, M.; Zvaríková, L.; Horváth, G. The impact of the striped field mouse’s range expansion on communities of native small mammals. Sci. Rep. 2023, 13, 753. [Google Scholar] [CrossRef]
  6. Khlyap, L.A.; Dinets, V.; Warshavsky, A.A.; Osipov, F.A.; Dergunova, N.N.; Petrosyan, V.G. Aggregated occurrence records of the invasive alien striped field mouse (Apodemus agrarius Pall.) in the former USSR. Biodivers. Data J. 2021, 9, e69159. [Google Scholar] [CrossRef]
  7. Herzig-Straschil, B.; Bihari, Z.; Spitzenberger, F. Recent changes in the distribution of the field mouse (Apodemus agrarius) in the western part of the Carpathian basin. Ann. Naturhistorischen Mus. Wien. Ser. B Für Bot. Und Zool. 2003, 105, 421–428. [Google Scholar]
  8. Global Invasive Species Database. Available online: https://www.iucngisd.org/gisd/ (accessed on 26 August 2024).
  9. Petrosyan, V.; Osipov, F.; Feniova, I.; Dergunova, N.; Warshavsky, A.; Khlyap, L.; Dzialowski, A. The TOP-100 most dangerous invasive alien species in Northern Eurasia: Invasion trends and species distribution modelling. NeoBiota 2023, 82, 23–56. [Google Scholar] [CrossRef]
  10. Latinne, A.; Navascués, M.; Pavlenko, M.; Kartavtseva, I.; Ulrich, R.G.; Tiouchichine, M.L.; Catteau, G.; Sakka, H.; Quéré, J.P.; Chelomina, G.; et al. Phylogeography of the striped field mouse, Apodemus agrarius (Rodentia: Muridae), throughout its distribution range in the Palaearctic region. Mamm. Biol. 2020, 100, 19–31. [Google Scholar] [CrossRef]
  11. Kaneko, Y.; Kryštufek, B.; Zagarondnyuk, I.; Vohralík, V.; Batsaikhan, N.; Avirmed, D.; Sukhchuluun, G. Apodemus agrarius (errata version published in 2017). In The IUCN Red List of Threatened Species 2016; IUCN: Gland, Switzerland, 2016; p. e.T1888A115057408. [Google Scholar] [CrossRef]
  12. Mitchell-Jones, A.J.; Mitchell, J.; Amori, G.; Bogdanowicz, W.; Kryštufek, B.; Reijnders, P.H.; Spitzenberger, F.; Stubbe, M.; Thissen, J.; Vohralík, V.; et al. (Eds.) The Atlas of European Mammals; Academic Press: London, UK, 1999; pp. 1–484. [Google Scholar]
  13. Petrosyan, V.; Dinets, V.; Osipov, F.; Dergunova, N.; Khlyap, L. Range Dynamics of Striped Field Mouse (Apodemus agrarius) in Northern Eurasia under Global Climate Change Based on Ensemble Species Distribution Models. Biology 2023, 12, 1034. [Google Scholar] [CrossRef]
  14. Yalkovskaya, L.; Sibiryakov, P.; Borodin, A. Phylogeography of the striped field mouse (Apodemus agrarius Pallas, 1771) in light of new data from central part of Northern Eurasia. PLoS ONE 2022, 17, e0276466. [Google Scholar] [CrossRef] [PubMed]
  15. Nikitina, N.A. Features of the territory using by striped field mice (Apodemus agrarius Pall.). Zool. Zhurnal 1958, 37, 1387–1408. [Google Scholar]
  16. Andrzejewski, R.; Babińska-Werka, J.; Gliwicz, J.; Goszczyński, J. Synurbization processes in population of Apodemus agrarius. I. Characteristics of populations in an urbanization gradient. Acta Theriol. 1978, 23, 341–358. [Google Scholar] [CrossRef]
  17. Babińska-Werka, J.; Gliwicz, J.; Goszczyński, J. Synurbization processes in a population of Apodemus agrarius. II. Habitats of the striped field mouse in town. Acta Theriol. 1979, 24, 405–415. [Google Scholar] [CrossRef]
  18. Karaseva, E.V.; Tikhonova, G.N.; Bogomolov, P.L. Distribution of the Striped field mouse (Apodemus agrarius) and peculiarities of its ecology in different parts of its range. Zool. Zhurnal. 1992, 71, 106–115. [Google Scholar]
  19. Dammhahn, M.; Mazza, V.; Schirmer, A.; Göttsche, C.; Eccard, J.A. Of city and village mice: Behavioural adjustments of striped field mice to urban environments. Sci. Rep. 2020, 10, 13056. [Google Scholar] [CrossRef]
  20. Łopucki, R.; Klich, D.; Ścibior, A.; Gołębiowska, D. Hormonal adjustments to urban conditions: Stress hormone levels in urban and rural populations of Apodemus agrarius. Urban Ecosyst. 2019, 22, 435–442. [Google Scholar] [CrossRef]
  21. Gortat, T.; Rutkowski, R.; Gryczynska-Siemiatkowska, A.; Kozakiewicz, A.; Kozakiewicz, M. Genetic structure in urban and rural populations of Apodemus agrarius in Poland. Mamm. Biol. 2013, 78, 171–177. [Google Scholar] [CrossRef]
  22. Gortat, T.; Rutkowski, R.; Gryczyńska, A.; Pieniążek, A.; Kozakiewicz, A.; Kozakiewicz, M. Anthropopressure gradients and the population genetic structure of Apodemus agrarius. Conserv. Genet. 2015, 16, 649–659. [Google Scholar] [CrossRef]
  23. Abt, K.F.; Bock, W.F. Seasonal variations of diet composition in farmland field mice Apodemus spp. and bank voles Clethrionomys glareolus. Acta Theriol. 1998, 43, 379–389. [Google Scholar] [CrossRef]
  24. Butet, A.; Delettre, Y.R. Diet differentiation between European arvicoline and murine rodents. Acta Theriol. 2011, 56, 297. [Google Scholar] [CrossRef]
  25. Holišová, V. The food of Apodemus agrarius (Pall.). Zool. Listy 1967, 16, 1–14. [Google Scholar]
  26. Pineda-Munoz, S.; Alroy, J. Dietary characterization of terrestrial mammals. Proc. R. Soc. B-Biol. Sci. 2014, 281, 20141173. [Google Scholar] [CrossRef] [PubMed]
  27. Nemirov, K.; Vapalahti, O.; Lundkvist, Å.; Vasilenko, V.; Golovljova, I.; Plyusnina, A.; Niemimaa, J.; Laakkonen, J.; Henttonen, H.; Vaheri, A.; et al. Isolation and characterization of Dobrava hantavirus carried by the striped field mouse (Apodemus agrarius) in Estonia. J. Gen. Virol. 1999, 80, 371–379. [Google Scholar] [CrossRef] [PubMed]
  28. Klempa, B.; Avsic-Zupanc, T.; Clement, J.; Dzagurova, T.K.; Henttonen, H.; Heyman, P.; Jakab, F.; Kruger, D.H.; Maes, P.; Papa, A.; et al. Complex evolution and epidemiology of Dobrava-Belgrade hantavirus: Definition of genotypes and their characteristics. Arch. Virol. 2013, 158, 521–529. [Google Scholar] [CrossRef] [PubMed]
  29. Fischer, S.; Mayer-Scholl, A.; Imholt, C.; Spierling, N.G.; Heuser, E.; Schmidt, S.; Reil, D.; Rosenfeld, U.M.; Jacob, J.; Nöckler, K.; et al. Leptospira genomospecies and sequence type prevalence in small mammal populations in Germany. Vector-Borne Zoonotic Dis. 2018, 18, 188–199. [Google Scholar] [CrossRef]
  30. Jeske, K.; Herzig-Straschil, B.; Răileanu, C.; Kunec, D.; Tauchmann, O.; Emirhar, D.; Schmidt, S.; Trimpert, J.; Silaghi, C.; Heckel, G.; et al. Zoonotic pathogen screening of striped field mice (Apodemus agrarius) from Austria. Transbound. Emerg. Dis. 2022, 69, 886–890. [Google Scholar] [CrossRef] [PubMed]
  31. Andrzejewski, R.; Wrocławek, H. Mass occurrence of Apodemus agrarius (Pallas, 1771) and variations in the number of associated Muridae. Acta Theriol. 1961, 5, 173–184. [Google Scholar] [CrossRef]
  32. Chełkowska, H.; Walkowa, W.; Adamczyk, K. Spatial relationships in sympatric populations of the rodents: Clethrionomys glareolus, Microtus agrestis and Apodemus agrarius. Acta Theriol. 1985, 30, 51–78. [Google Scholar] [CrossRef]
  33. Zub, K.; Jędrzejewska, B.; Jędrzejewski, W.; Bartoń, K.A. Cyclic voles and shrews and non-cyclic mice in a marginal grassland within European temperate forest. Acta Theriol. 2012, 57, 205–216. [Google Scholar] [CrossRef]
  34. Simeonovska-Nikolova, D.M. Interspecific social interactions and behavioral responses of Apodemus agrarius and Apodemus flavicollis to conspecific and heterospecific odors. J. Ethol. 2007, 25, 41–48. [Google Scholar] [CrossRef]
  35. Vukićević-Radić, O.; Matić, R.; Kataranovski, D.; Stamenković, S. Spatial organization and home range of Apodemus flavicollis and A. agrarius on Mt. Avala, Serbia. Acta Zool. Acad. Sci. H. 2006, 52, 81–96. [Google Scholar]
  36. Likevičienė, N. Lietuvos TSR Peliniai Graužikai. Ph.D. Thesis, Vilnius University, Vilnius, Lithuania, 1959. [Google Scholar]
  37. Prūsaitė, J. Fauna of Lithuania. Mammals; Mokslas: Vilnius, Lithuania, 1988; pp. 121–123. [Google Scholar]
  38. Balčiauskas, L.; Balčiauskienė, L. Small Mammal Diversity Changes in a Baltic Country, 1975–2021: A Review. Life 2022, 12, 1887. [Google Scholar] [CrossRef] [PubMed]
  39. Balčiauskas, L.; Balčiauskienė, L. Habitat and Body Condition of Small Mammals in a Country at Mid-Latitude. Land 2024, 13, 1214. [Google Scholar] [CrossRef]
  40. Maldžiūnaitė, S. Small mammals in Žagarė reserve. In Žagarės Forest; Lekavičius, A., Jankevičienė, R., Tučienė, A., Eds.; Mokslas: Vilnius, Lithuania, 1980; pp. 48–50. [Google Scholar]
  41. Balčiauskas, L.; Alejūnas, P. Small mammal species diversity and abundance in Žagarė Regional Park. Acta Zool. Litu. 2011, 21, 163–172. [Google Scholar] [CrossRef]
  42. Čepkelių Rezervato Žinduolių bei Roplių Tyrimas ir jų Apsaugos Priemonių Nustatymas; Ataskaita; Zoologijos ir Parazitologijos Institutas: Vilnius, Lithuania, 1980.
  43. Mažeikytė, R.; Balčiauskas, L.; Baranauskas, K.; Ulevičius, A. Smulkiųjų žinduolių rūšių įvairovė ir gausumas integruoto monitoringo teritorijose ir agrostacionaruose. In Aplinkos Monitoringas, 1993–1995; Stoškus, L., Ed.; Lietuvos aplinkos apsaugos ministerija: Vilnius, Lithuania, 1996; pp. 73–79. [Google Scholar]
  44. Balčiauskas, L.; Juškaitis, R. Diversity of small mammal communities in Lithuania (1. A review). Acta Zool. Litu. 1997, 7, 29–45. [Google Scholar] [CrossRef]
  45. Smulkiųjų Žinduolių Monitoringas. Available online: https://aaa.lrv.lt/lt/veiklos-sritys/aplinkos-monitoringas/gyvosios-gamtos-monitoringas/smulkiuju-zinduoliu-monitoringas/ (accessed on 20 August 2024).
  46. Ulevičius, A.; Juškaitis, R. Dzūkijos nacionalinio parko žinduoliai (išskyrus šikšnosparnius). Theriol. Litu. 2003, 3, 11–29. [Google Scholar]
  47. Balčiauskas, L. Results of the long-term monitoring of small mammal communities in the Ignalina Nuclear Power Plant Region (Drūkšiai LTER site). Acta Zool. Litu. 2005, 15, 79–84. [Google Scholar] [CrossRef]
  48. Ulevičius, A.; Juškaitis, R.; Pauža, D.; Balčiauskas, L.; Ostasevičius, V. Žemaitijos nacionalinio parko žinduoliai. Theriol. Litu. 2002, 2, 1–20. [Google Scholar]
  49. Šinkūnas, R.; Balčiauskas, L. Small mammal communities in the fragmented landscape in Lithuania. Acta Zool. Litu. 2006, 16, 130–136. [Google Scholar] [CrossRef]
  50. Balčiauskas, L.; Gudaitė, A. Diversity of Small Mammals in Winter Season in North East Lithuania. Acta Zool. Litu. 2006, 16, 137–142. [Google Scholar] [CrossRef]
  51. Čepukienė, A. Small Mammal Community Changes during Early Forest Succession Stages. Ph.D. Dissertation, Vilnius University, Vilnius, Lithuania, 2014. [Google Scholar]
  52. Balčiauskas, L.; Balčiauskienė, L.; Janonytė, A. The influence of spring floods on small mammal communities in the Nemunas River Delta, Lithuania. Biologia 2012, 67, 1220–1229. [Google Scholar] [CrossRef]
  53. Balčiauskas, L.; Balčiauskienė, L. Long-term changes in a small mammal community in a temperate zone meadow subject to seasonal floods and habitat transformation. Integr. Zool. 2022, 17, 443–455. [Google Scholar] [CrossRef]
  54. Past 4—The Past of the Future. Available online: https://www.nhm.uio.no/english/research/resources/past/ (accessed on 1 January 2024).
  55. TIBCO Software Inc. Data Science Textbook. Available online: https://docs.tibco.com/data-science/textbook (accessed on 15 January 2024).
  56. Kozakiewicz, M.; Gortat, T.; Kozakiewicz, A.; Barkowska, M. Effects of habitat fragmentation on four rodent species in a Polish farm landscape. Landsc. Ecol. 1999, 14, 391–400. [Google Scholar] [CrossRef]
  57. Panzacchi, M.; Linnell, J.D.; Melis, C.; Odden, M.; Odden, J.; Gorini, L.; Andersen, R. Effect of land-use on small mammal abundance and diversity in a forest–farmland mosaic landscape in south-eastern Norway. For. Ecol. Manag. 2010, 259, 1536–1545. [Google Scholar] [CrossRef]
  58. Heroldová, M.; Bryja, J.; Zejda, J.; Tkadlec, E. Structure and diversity of small mammal communities in agriculture landscape. Agric. Ecosyst. Environ. 2007, 120, 206–210. [Google Scholar] [CrossRef]
  59. Gentili, S.; Sigura, M.; Bonesi, L. Decreased small mammals species diversity and increased population abundance along a gradient of agricultural intensification. Hystrix 2014, 25, 39–44. [Google Scholar] [CrossRef]
  60. Balestrieri, A.; Gazzola, A.; Formenton, G.; Canova, L. Long-term impact of agricultural practices on the diversity of small mammal communities: A case study based on owl pellets. Environ. Monit. Assess. 2019, 191, 725. [Google Scholar] [CrossRef]
  61. Paniccia, C.; Carranza, M.L.; Frate, L.; Di Febbraro, M.; Rocchini, D.; Loy, A. Distribution and functional traits of small mammals across the Mediterranean area: Landscape composition and structure definitively matter. Ecol. Indic. 2022, 135, 108550. [Google Scholar] [CrossRef]
  62. Barão, I.; Queirós, J.; Vale-Gonçalves, H.; Paupério, J.; Pita, R. Landscape characteristics affecting small Mammal occurrence in heterogeneous Olive Grove Agro-ecosystems. Conservation 2022, 2, 51–67. [Google Scholar] [CrossRef]
  63. Love, R.A.; Webon, C.; Glue, D.E.; Harris, S.; Harris, S. Changes in the food of British Barn Owls (Tyto alba) between 1974 and 1997. Mammal Rev. 2000, 30, 107–129. [Google Scholar] [CrossRef]
  64. Milana, G.; Luiselli, L.; Amori, G. Forty years of dietary studies on barn owl (Tyto alba) reveal long term trends in diversity metrics of small mammal prey. Anim. Biol. 2018, 68, 129–146. [Google Scholar] [CrossRef]
  65. Obuch, J.; Danko, Š.; Noga, M. Recent and subrecent diet of the barn owl (Tyto alba) in Slovakia. Raptor J. 2016, 10, 1–50. [Google Scholar] [CrossRef]
  66. Drebet, M. Monitoring of the mammal fauna by studying owl pellets: A case of small mammals in protected areas of Podillia. Theriol. Ukr. 2022, 24, 16–27. [Google Scholar] [CrossRef]
  67. Szép, D.; Krčmar, S.; Purger, J.J. Possible causes of temporal changes in the diet composition of Common Barn-owls Tyto alba (Scopoli, 1769) (Strigiformes: Tytonidae) in Baranja, Croatia. Acta Zool. Bulgar. 2021, 73, 87–94. [Google Scholar]
  68. Stefke, K.; Landler, L. Long-term monitoring of rodent and shrew communities in a biodiversity hot-spot in Austria using barn owl (Tyto alba) pellets. Acta Oecol. 2020, 109, 103660. [Google Scholar] [CrossRef]
  69. Grzędzicka, E.; Kus, K.; Nabielec, J. The effect of urbanization on the diet composition of the tawny owl (Strix aluco L.). Pol. J. Ecol. 2013, 61, 391–400. [Google Scholar]
  70. Lesiński, G.; Gryz, J.; Krauze-Gryz, D.; Stolarz, P. Population increase and synurbization of the yellow-necked mouse Apodemus flavicollis in some wooded areas of Warsaw agglomeration, Poland, in the years 1983–2018. Urban Ecosyst. 2021, 24, 481–489. [Google Scholar] [CrossRef]
  71. Romanowski, J.; Lesiński, G.; Bardzińska, M. Small mammals of the suburban areas of Warsaw in the diet of the tawny owl Strix aluco. Stud. Ecol. Bioethicae 2020, 18, 349–354. [Google Scholar] [CrossRef]
  72. Heisler, L.M.; Somers, C.M.; Poulin, R.G. Owl pellets: A more effective alternative to conventional trapping for broad-scale studies of small mammal communities. Methods in Ecol. Evol. 2016, 7, 96–103. [Google Scholar] [CrossRef]
  73. Goutner, V.; Alivizatos, H. Diet of the Barn Owl (Tyto alba) and Little Owl (Athene noctua) in wetlands of northeastern Greece. Belg.J. Zool. 2003, 133, 15–22. [Google Scholar]
  74. Kozakiewicz, M.; Kozakiewicz, A. Long-term dynamics and biodiversity changes in small mammal communities in a mosaic of agricultural and forest habitats. Ann. Zool. Fenn. 2008, 45, 263–269. [Google Scholar] [CrossRef]
  75. Pupila, A.; Bergmanis, U. Species diversity, abundance and dynamics of small mammals in the Eastern Latvia. Acta Univ. Latv. 2006, 710, 93–101. [Google Scholar]
  76. Avotins, A.; Avotins, A., Sr.; Ķerus, V.; Aunins, A. Numerical Response of Owls to the Dampening of Small Mammal Population Cycles in Latvia. Life 2023, 13, 572. [Google Scholar] [CrossRef]
  77. Neronov, V.M.; Khlyap, L.A.; Tupikova, N.V.; Warshavskii, A.A. Formation of rodent communities in arable lands of Northern Eurasia. Russ. J. Ecol. 2001, 32, 326–333. [Google Scholar] [CrossRef]
  78. Jeske, K.; Schulz, J.; Tekemen, D.; Balčiauskas, L.; Balčiauskienė, L.; Hiltbrunner, M.; Drewes, S.; Mayer-Scholl, A.; Heckel, G.; Ulrich, R.G. Cocirculation of Leptospira spp. and multiple orthohantaviruses in rodents, Lithuania, Northern Europe. Transbound. Emerg. Dis. 2022, 69, e3196–e3201. [Google Scholar] [CrossRef]
  79. Prakas, P.; Stirkė, V.; Šneideris, D.; Rakauskaitė, P.; Butkauskas, D.; Balčiauskas, L. Protozoan Parasites of Sarcocystis spp. in Rodents from Commercial Orchards. Animals 2023, 13, 2087. [Google Scholar] [CrossRef] [PubMed]
  80. Kitrytė, N. Diversity of Small Mammal Parasites and Factors Shaping Their Communities. Ph.D. Thesis, Vilnius University, Vilnius, Lithuania, 2022. [Google Scholar]
  81. Nackley, L.L.; West, A.G.; Skowno, A.L.; Bond, W.J. The nebulous ecology of native invasions. Trends Ecol. Evol. 2017, 32, 814–824. [Google Scholar] [CrossRef]
  82. Wang, D.; Anderson, D.P.; Li, K.; Guo, Y.; Yang, Z.; Pech, R.P. Predicted population dynamics of an indigenous rodent, Apodemus agrarius, in an agricultural system. Crop Prot. 2021, 147, 105683. [Google Scholar] [CrossRef]
  83. Fischer, C.; Thies, C.; Tscharntke, T. Small mammals in agricultural landscapes: Opposing responses to farming practices and landscape complexity. Biol. Conserv. 2011, 144, 1130–1136. [Google Scholar] [CrossRef]
  84. Hermoso, V.; Carvalho, S.B.; Giakoumi, S.; Goldsborough, D.; Katsanevakis, S.; Leontiou, S.; Markantonatou, V.; Rumes, B.; Vogiatzakis, I.N.; Yates, K.L. The EU Biodiversity Strategy for 2030: Opportunities and challenges on the path towards biodiversity recovery. Environ. Sci. Policy 2022, 127, 263–271. [Google Scholar] [CrossRef]
  85. Török, P.; Dembicz, I.; Dajic-Stevanovic, Z.; Kuzemko, A. Grasslands of eastern Europe. Encycl. World’s Biomes. 2020, 3, 703–713. [Google Scholar]
  86. Schils, R.L.M.; Bufe, C.; Rhymer, C.M.; Francksen, R.M.; Klaus, V.H.; Abdalla, M.; Milazzo, F.; Lellei-Kovács, E.; Berge, H.; Bertora, C.; et al. Permanent grasslands in Europe: Land use change and intensification decrease their multifunctionality. Agric. Ecosyst. Environ. 2022, 330, 107891. [Google Scholar] [CrossRef]
  87. Lomba, A.; Da Costa, J.F.; Ramil-Rego, P.; Corbelle-Rico, E. Assessing the link between farming systems and biodiversity in agricultural landscapes: Insights from Galicia (Spain). J. Environ. Manag. 2022, 317, 115335. [Google Scholar] [CrossRef] [PubMed]
  88. Müller, A.; Schneider, U.A.; Jantke, K. Evaluating and expanding the European Union’s protected-area network toward potential post-2020 coverage targets. Conserv. Biol. 2020, 34, 654–665. [Google Scholar] [CrossRef]
  89. Viteri, M.C.; Hadly, E.A. Spatiotemporal impacts of the Anthropocene on small mammal communities, and the role of small biological preserves in maintaining biodiversity. Front. Ecol. Evol. 2022, 10, 916239. [Google Scholar] [CrossRef]
Figure 1. Small mammal trapping sites in Lithuania, 1975–2023, with indication of agricultural areas (A), and positions of the case study sites (B), with indication of grasslands: 1—Žagarė forest and Žagarė Regional Park, 2—vicinity of Biržų Giria forest, 3—Dzūkija National Park, 4—Ignalina region, 5—Žemaitija National Park, 6—Lipliūnai environs, 7—Zarasai region, 8—Rusnė environs.
Land 13 01555 g001
Figure 2. Relative abundances (A) and proportions of A. agrarius in the small mammal community (B) by month. Vertical bars denote 95% CI.
Land 13 01555 g002
Figure 3. Relative abundances (A) and proportions of A. agrarius in the small mammal community (B) by season. Vertical bars denote 95% CI.
Land 13 01555 g003
Figure 4. The annual relative abundances of A. agrarius (A) and total relative abundances of all small mammal species (B) independent of habitat. Vertical bars denote 95% CI.
Land 13 01555 g004
Figure 5. Relative abundances (A) and proportions of A. agrarius in the small mammal community (B) by decade. Vertical bars denote 95% CI.
Land 13 01555 g005
Figure 6. Relative abundances (A,B) and proportions (C,D) of A. agrarius in the small mammal community in wetlands and meadows of Site 4, 1981–1990. Red lines indicate trends. Vertical bars denote SE.
Land 13 01555 g006
Figure 7. Relative abundances (A) and proportions (B) of A. agrarius in the small mammal community in flooded meadows of Site 8, 2004–2020. Red lines indicate increasing trends. Vertical bars denote SE.
Land 13 01555 g007
Figure 8. Relative abundances (A) and proportions (B) of A. agrarius in the small mammal community by habitat. Whiskers of horizontal bars denote SE.
Land 13 01555 g008
Figure 9. Trends in proportions of A. agrarius in the small mammal community by habitat.
Land 13 01555 g009
Table 1. Trapping effort (TE, trap days) and number of trapped specimens of A. agrarius (N) according habitat: Agr—agricultural, Com—commensal, Dis—disturbed, For—forest, Mea—meadow, Mix—mixed, Rip—riparian, Shr—shrub, Wet—wetland habitats.
AgrComDisForMeaMixRipShrWetTotal
TE36,80626,51619,525110,075125,865137,0409069420040,968510,064
N6345341123322493156363162365983
Table 2. Trapping effort and number of A. agrarius specimens captured by month and season. Samples containing traps from more than one month or season are not included; therefore, the totals do not correspond to Table 1.
Month, SeasonTrapping Effort, Trap DaysA. agrarius, Specimens
January132010
February13101
March13003
April14605
May69,94531
June9009
July28,96043
August30,903288
September112,1011675
October114,0732353
November5164101
December112022
Winter *679536
Spring73,14554
Summer 79,463361
Autumn270,0814803
* We were not able to break down some retrospective data to a single month or season, e.g., data containing pooled totals of spring and autumn trappings, or were referred as winter, but month of trapping is not known. Such data were analyzed separately and are not presented in the table.
Table 3. Trapping effort (TE, trap days) and number of trapped specimens of A. agrarius (N) according to decade. Totals correspond to Table 1.
1970s1980s1990s2000s2010s2020s
TE27,93090,690126,335143,25683,99337,860
N36116136415892198680
Table 4. Summary of the local cases of investigation: TE—trapping effort, trap days; NSM—number of small mammals trapped; S—species richness during the whole study period; NAA—number of A. agrarius trapped.
SiteTime PeriodTENSMSNAA
11975; 2008–201216,778398714292
21977; 1997–200518505291330
31978–1980; 1991–1995; 1999–200415,5501764133
41980–199075,550341316102
51993–1995; 1997–20048300793114
61997–20047650114412214
72000–2005; 2007–201218,12227761395
82004–202022,6433550131627
Table 5. Changes in relative abundances (RA, ind./trap day) and proportions (%, of total number of small mammals trapped) in A. agrarius populations at case study sites: 1—Žagarė forest and Žagarė Regional Park, 2—vicinity of Biržų Giria forest, 3—Dzūkija National Park, 4—Ignalina region, 5—Žemaitija National Park, 6—Lipliūnai environs, 7—Zarasai region, 8—Rusnė environs.
Site1970s1980s1990s2000s2010s2020s
RA%RA%RA%RA%RA%RA%
10.0020.41* 0.0217.220.0239.93
20.0051.25 0.047.02000.049.77
300 0.0000.200.0010.43
4 0.0014.29
5 0.0045.8400
6 0.0105.280.01611.81
7 0.0031.860.01113.85
8 0.02321.430.12861.72
*—blank cells mean no trapping.
Disclaimer/Publisher’s Note: The statements, opinions and data contained in all publications are solely those of the individual author(s) and contributor(s) and not of MDPI and/or the editor(s). MDPI and/or the editor(s) disclaim responsibility for any injury to people or property resulting from any ideas, methods, instructions or products referred to in the content.

