Abstract
Patchiness is known to affect soil water and soil temperature, and may trigger or accelerate alpine meadow degradation. However, there is a lack of direct evidence concerning the role of the size and type of patches on soil conditions. Here, we estimated the effects of typical patch types on the critical factors of soil water and soil temperature through an in situ survey and then analyzed the potential impacts of patchiness on alpine meadow degradation. The results showed that (1) the soil water storage (SWS) of typical patch types was remarkably different, and vegetation patches had higher SWS than bare patches; (2) with abundant precipitation, the isolated vegetation patch (IV) had higher SWS than the original vegetation patch (OV), accompanied by a decrease in the SWS of the surrounding medium bare patch (MP); (3) patchiness significantly altered the surface soil temperature, with the IV having the highest soil temperature (ST), followed by the OV and bare patches; and (4) the maximum mean value of evapotranspiration was observed in IV (3.85 mm/day), about 12.78% and 46.66% higher than in the bare patches and OV. Our findings indicated that patchiness intensified the heterogeneity of soil water and soil temperature. The IV could absorb soil water from surrounding MP for excessive evapotranspiration through constant high ST, potentially inducing or aggravating degradation. Increasing the connectivity of IV and preventing the transition of OV to IV is important for the stability and restoration of alpine meadow.
1. Introduction
The Qinghai–Tibetan Plateau (QTP), regarded as the third pole and the highest unique territorial unit on Earth, is an important eco-region in both China and the world [1,2,3]. Alpine meadow (7 × 10⁵ km2) covers more than 50% of the available pastures on the QTP and provides important ecological functions and services [4]. Its stability plays an important role in the lives of local pastoralists, regional climate regulation, soil water retention, and biodiversity conservation [5,6].
Unfortunately, the alpine meadow ecosystem is fragile and vulnerable to external disturbances [7]. The patchiness of alpine meadow due to the coupled effects of climate change, livestock overgrazing, and rodent damage has become common on the QTP [8,9]. Patches with various sizes and types intensify the heterogeneities of vegetation coverage and soil physical and chemical properties [10,11]. These differences cause the vertical and horizontal exchange of energy and water fluxes among the atmosphere, ground surface, and underneath the soil, thereby altering pedogenic processes and affecting the eco-healthy development of alpine meadow [5,12].
In this context, the restoration of degraded alpine grassland is urgently needed. To design restoration strategies properly, a reliable diagnosis of the coupling relationship between the patchiness and degradation and the underlying soil water and soil temperature transmission mechanisms should be implemented [13]. Previous studies focus on exploring the formation mechanisms, the ecological and hydrological effects of bare patches, and their impacts on the restoration of degraded grasslands [14,15]. One typical viewpoint concluded that the “black soil land” degraded grassland would generate a black hole of soil moisture storage and soil thermal capacity, leading to the loss of soil water and soil temperature [16].
As research progresses, it becomes clear that it is not only bare patches that significantly affect soil water and soil temperature, but the ecological and hydrological effects produced by vegetation patches also vary with different scales and spatial forms [17,18]. It has been found that isolated vegetation patches differ from original vegetation patches in terms of soil moisture and physical properties, such as bulk density and hydraulic conductivity [18]. Notably, soil temperature is also an important prerequisite for the growth of alpine meadow [19,20]. Clarifying the diversity in soil temperature among various patch types and the underlying influence mechanism is of great practical significance for alpine grassland restoration and management [15,21]. Although the heterogeneity of soil physical properties and soil moisture affects soil temperature, there is still a lack of direct evidence to indicate the role of the size and type of vegetation patches on soil temperature.
Under such circumstances, we conducted comprehensive and continuous in situ observations to monitor the critical factors of soil processes in fragmented alpine meadow. The specific objectives were to (1) assess the differences in soil water storage (SWS), soil temperature (ST), soil temperature gradient (STG), and evapotranspiration among five typical patch types; (2) explore the potential water movement between isolated vegetation patches and surrounding bare soil; and (3) explore the underlying impacts on alpine meadow degradation.
2. Materials and Methods
2.1. Study Area
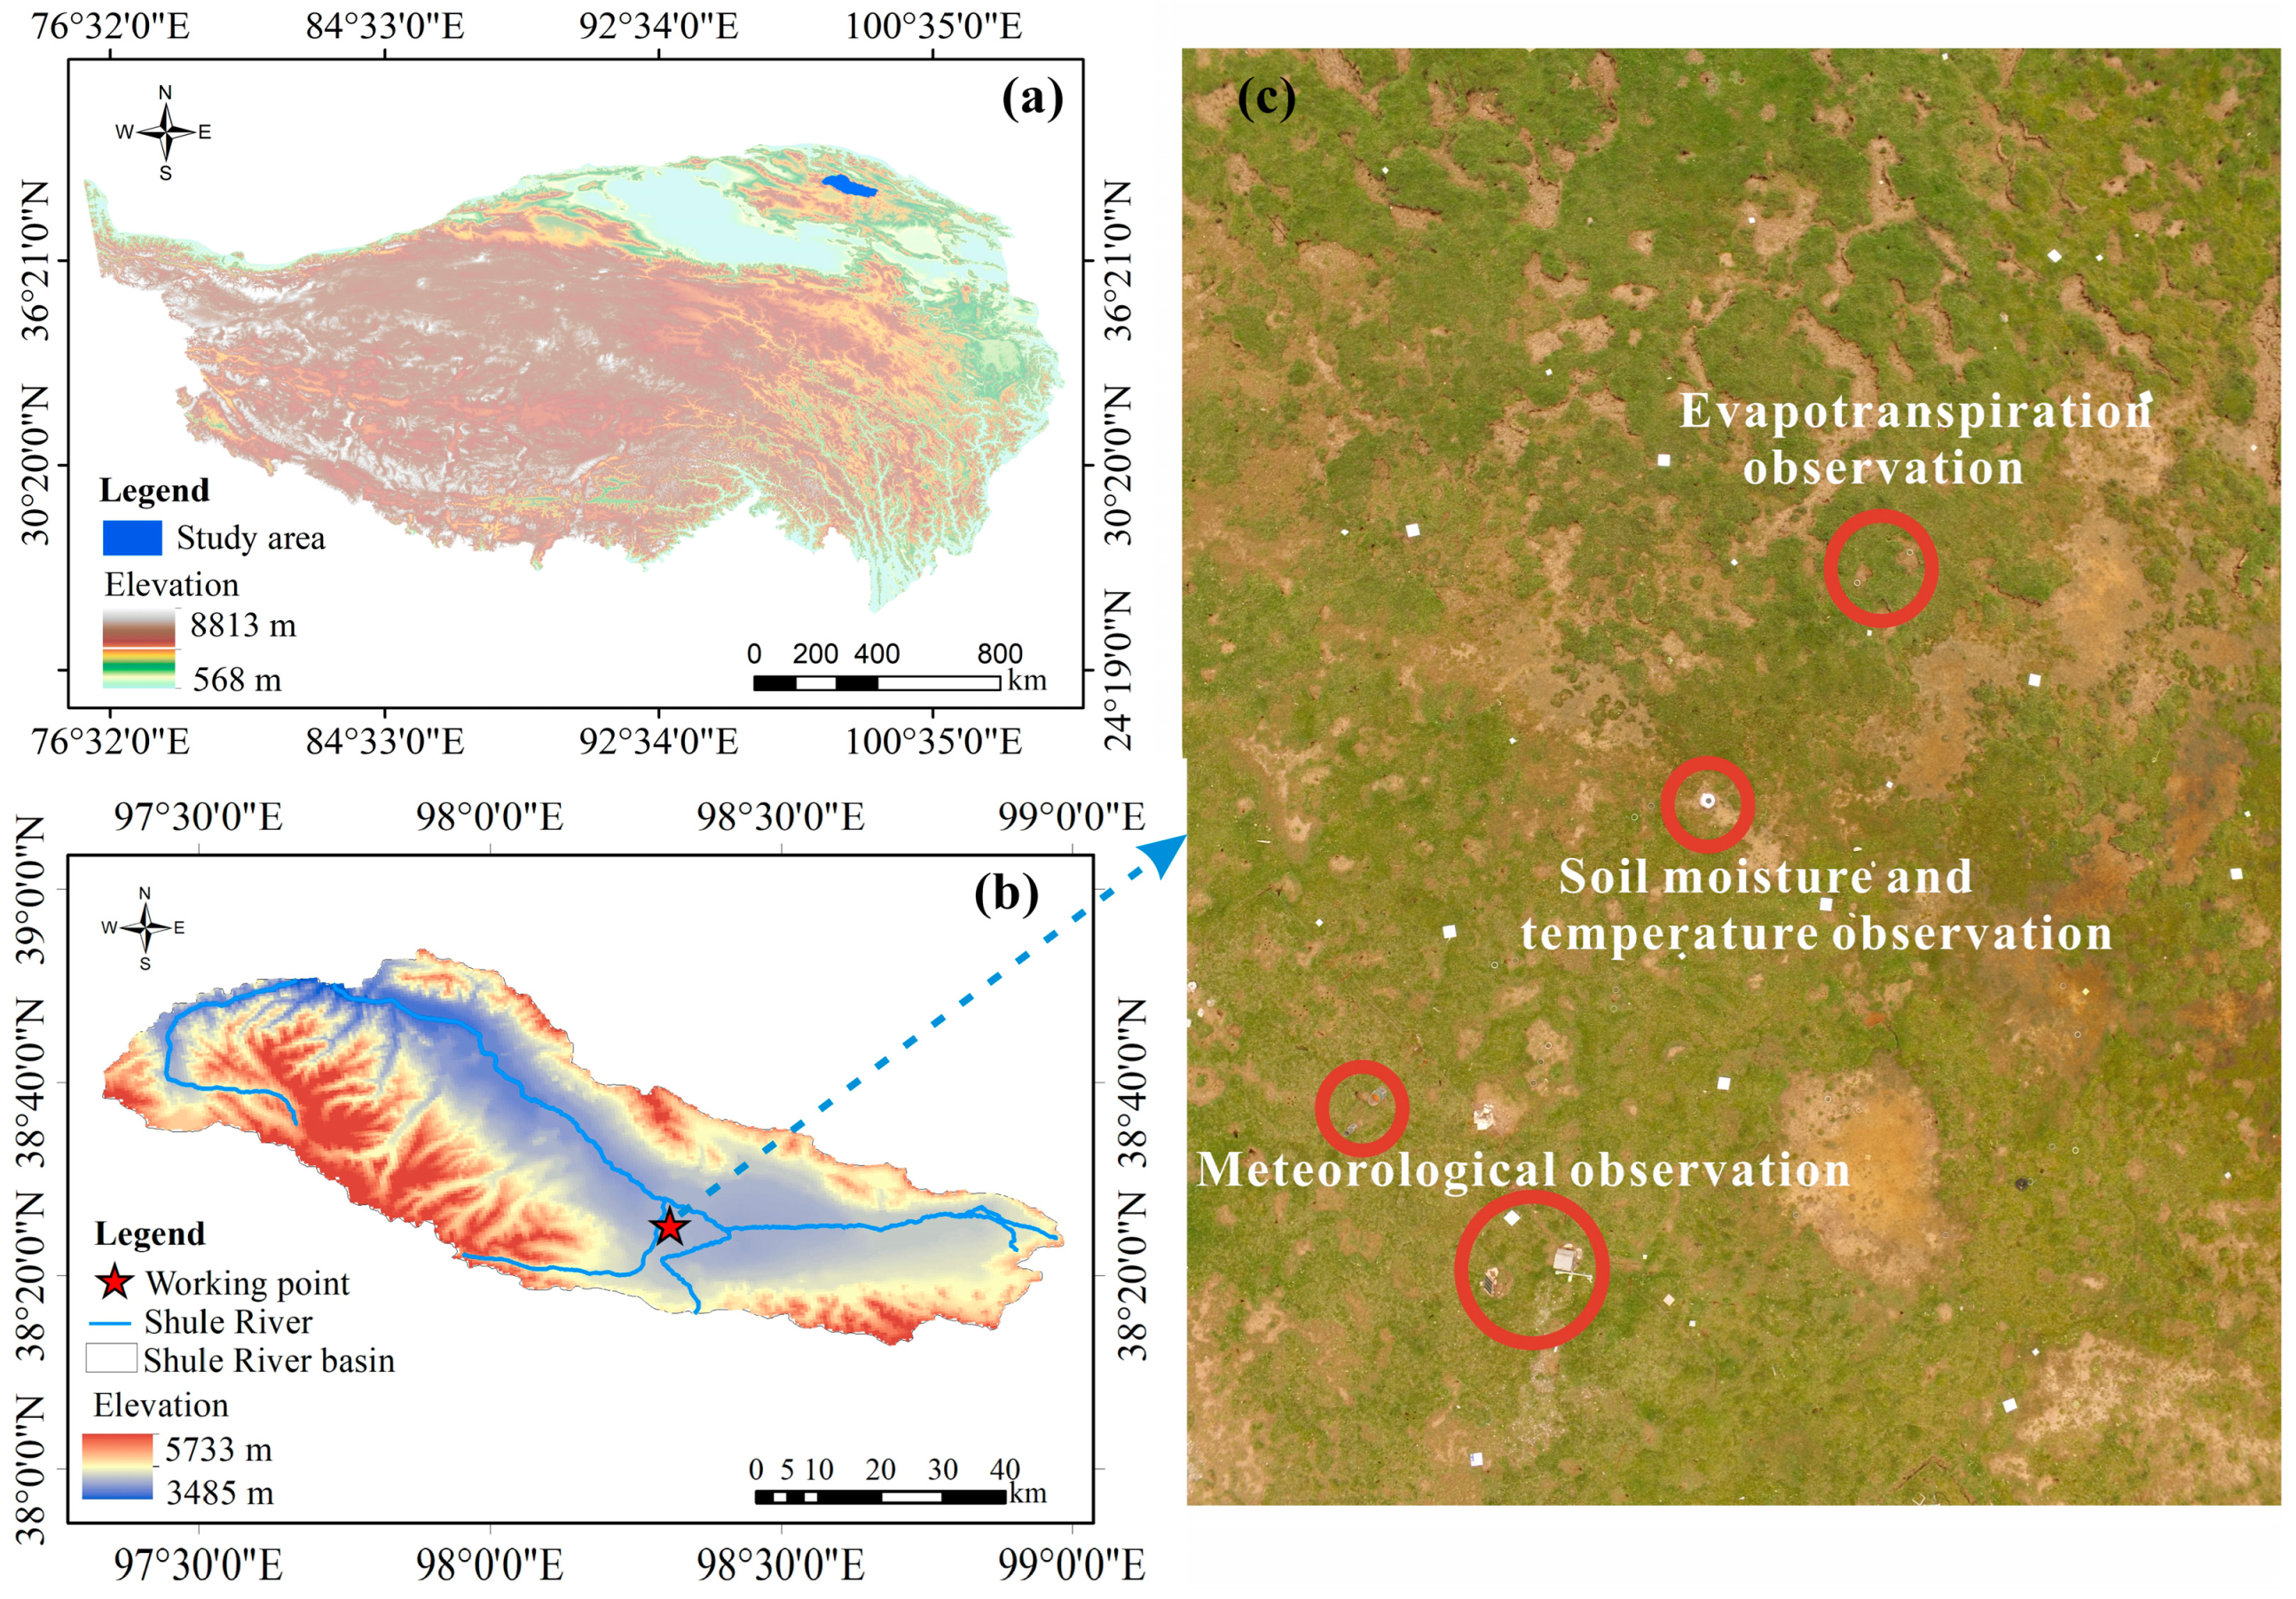
The study area is located in the source region of the Shule River Basin, the northeast edge of the QTP, China (see Figure 1), and the field observations were conducted at Suli Ecological Observation and Experiment Station (98°18′33.2″ E, 38°25′13.5″ N). The average elevation is approximately 3887 m above sea level, and the terrain is fairly flat, surrounded by gentle rolling hills. The area has a typical continental arid desert climate with the mean annual precipitation ranging from 200 to 400 mm (90% falls from May to September), and the mean annual air temperature is about −4 °C [22]. The soil particle size distribution is 30.96% silt and clay, 57.52% fine sand, and 10.68% coarse sand, and the soil bulk density of the top 0–40 cm soil layer is about 1.41 g cm−3 [17]. The land surface is typically characterized by alpine meadow, dominated by Kobresia capillifolia and Carex moorcroftii [23]. Due to permafrost degradation and external disturbance, a mosaic pattern of vegetation patches and bald patches with different sizes is common [5].

Figure 1.
(a) Source region of the Shule River Basin and its location on the QTP; (b) working point (red pentagram) in the source region of Shule River Basin; (c) typical observation equipment.
2.2. Field Work
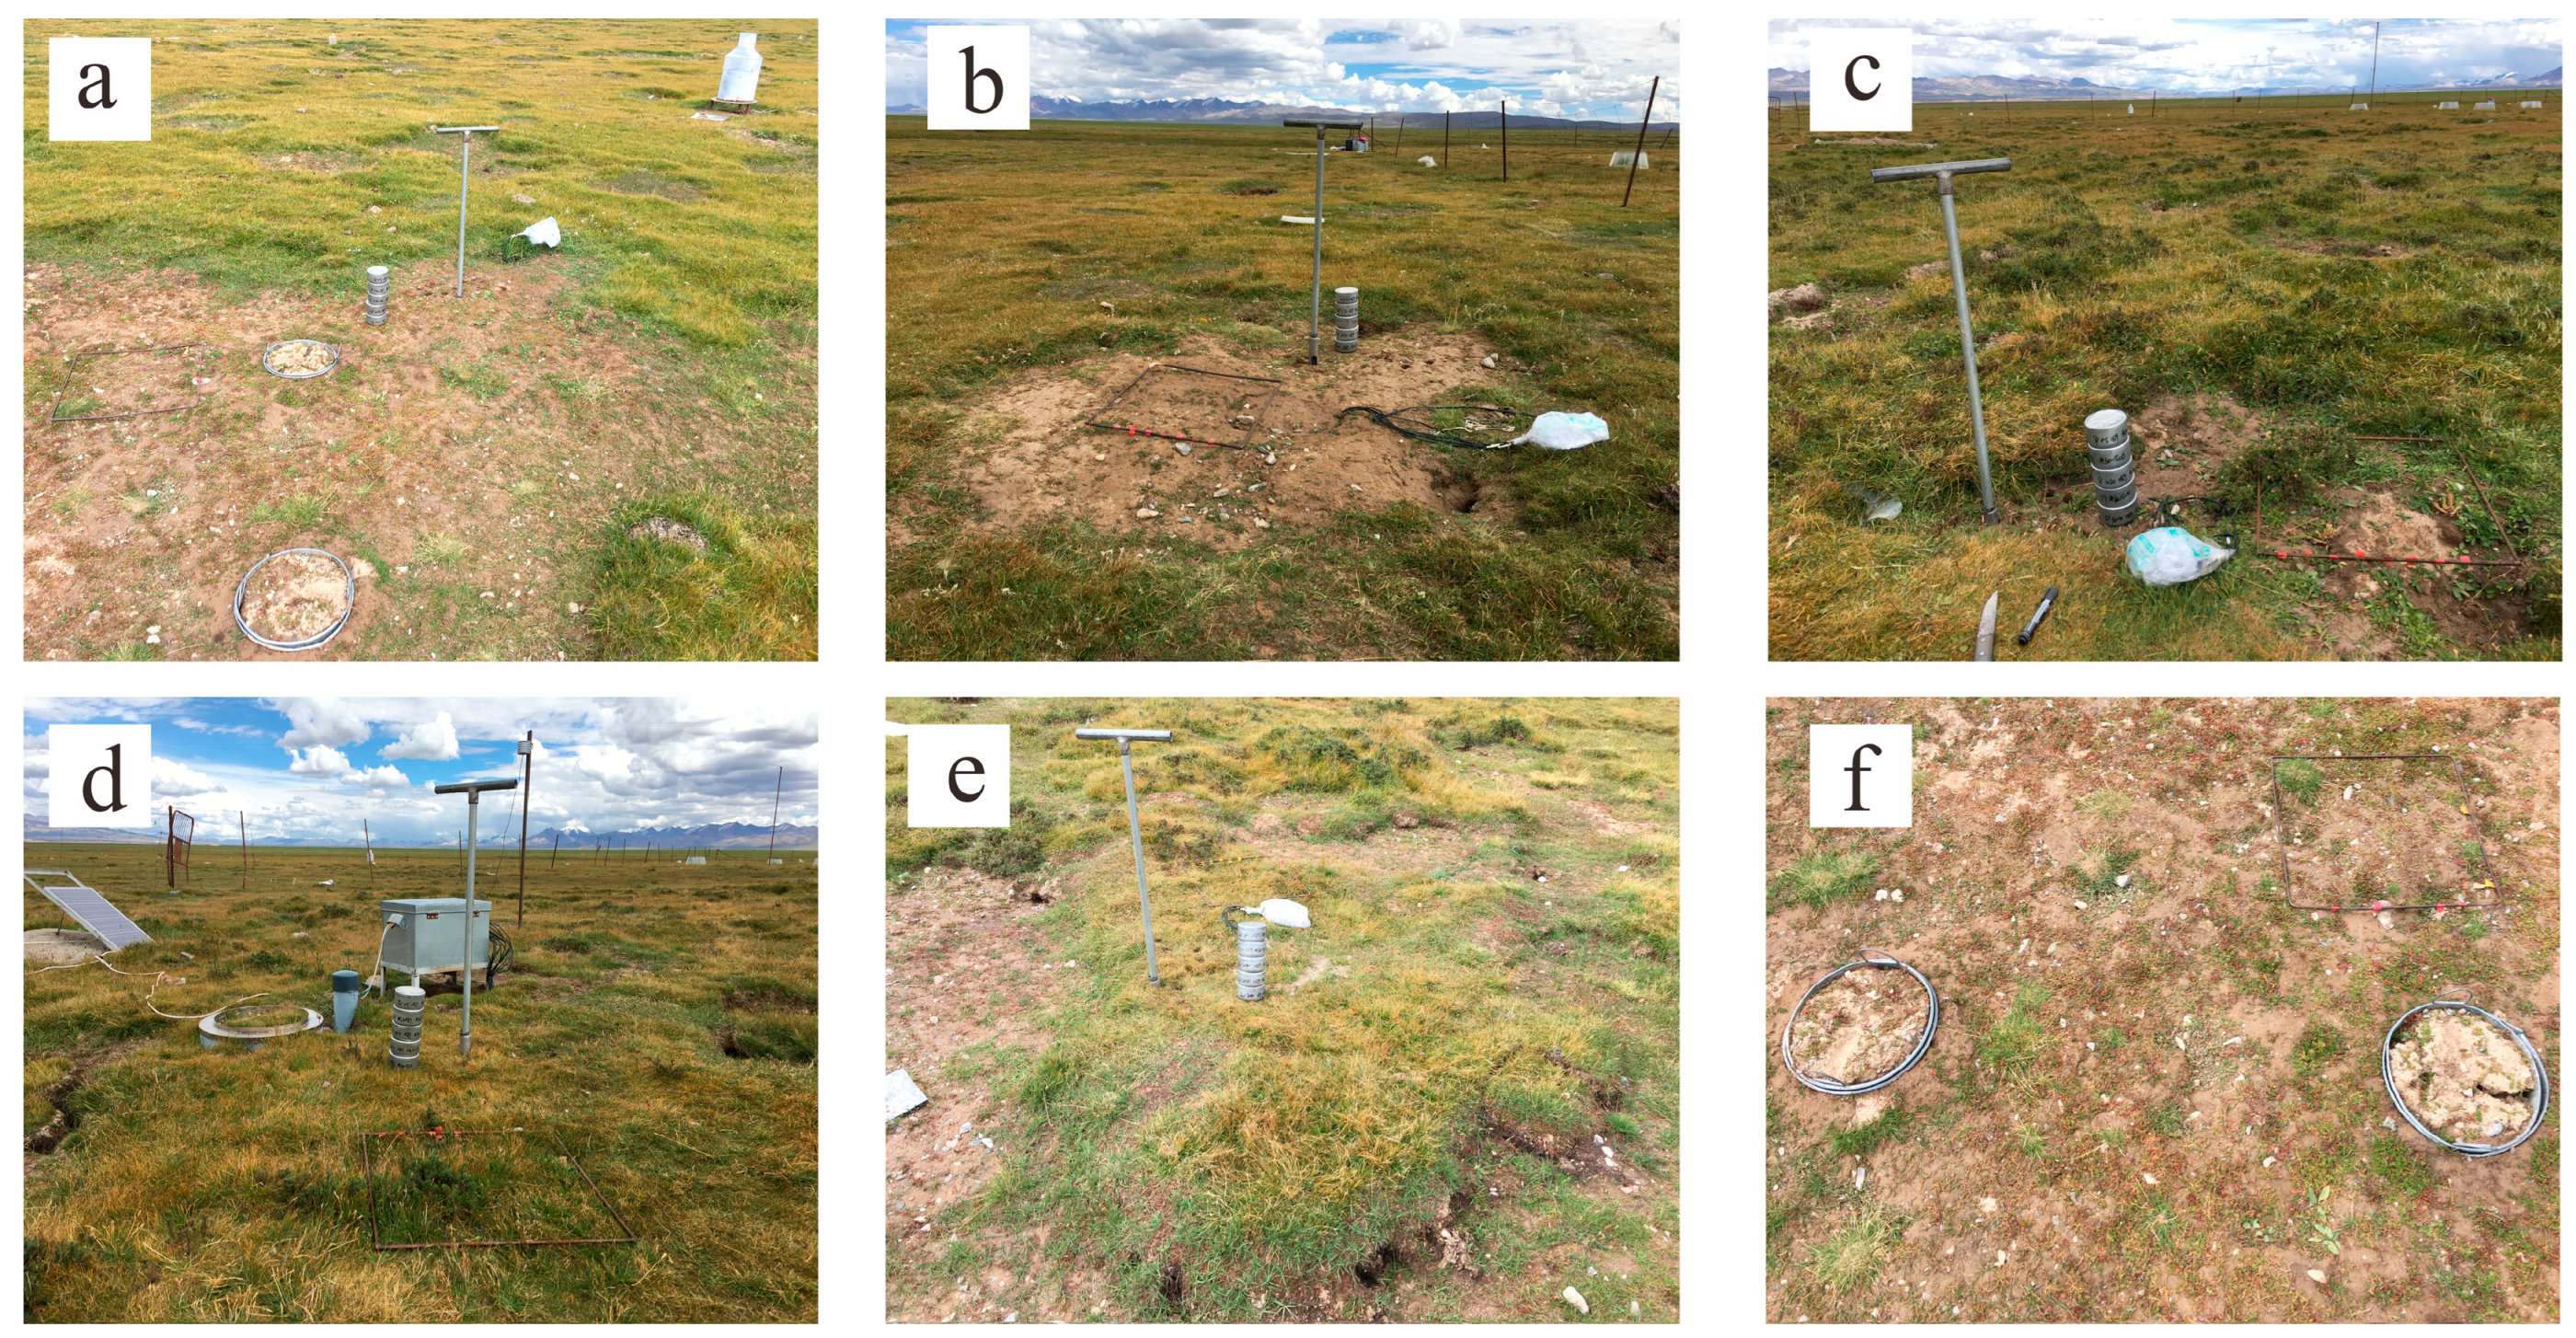
Given that water and solar inputs are critical prerequisites for the growth of alpine meadow [19], two years with significant differences in temperature and precipitation were selected to ensure the accurate evaluation of the effects of alpine meadow patchiness (Table 1). Specifically, our field observations were conducted during the vigorous growth stage of alpine meadow with the most concentrated precipitation (July to August) in 2019–2020. The effects of alpine meadow patchiness on SWS, ST, STG, and evapotranspiration were evaluated by classifying the land surface into five representative patch types (Table 2) (Figure 2a–e) [5,19].

Table 1.
Comparison of precipitation and temperature in two years.
Table 2.
Classification of the five typical patch types.
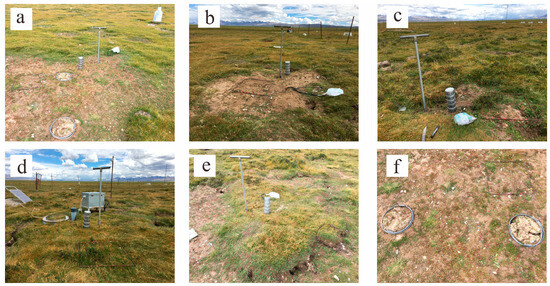
Figure 2.
Photos of field observations at five patch types: (a) LP, (b) MP, (c) SP, (d) OV, and (e) IV; (f) two micro-lysimeters embedded on LPs.
Within each patch type, the soil moisture and temperature in the 0–40 cm soil layer were measured with an auto-measurement system (Decagon Inc., Pullman, WA, USA). The system consisted of an EM50 logger and five 5TM sensors embedded in soil layers at 0–5 cm, 5–10 cm, 10–20 cm, 20–30 cm, and 30–40 cm, respectively. The datalogger automatically recorded the data every 30 min. Simultaneously, soil samples were collected from the corresponding soil layers using soil drills (diameter: 5 cm) and aluminum boxes, and then the samples were weighed in the laboratory to calculate the soil water content, which was used to calibrate the EM50 data. Moreover, 75 bulk soil samples (three replicates) were taken from five patch types using volumetric rings (diameter: 7 cm, height: 5 cm, and volume: 200 cm3) to determine the soil bulk density.
Evapotranspiration was measured using a micro-lysimeter (Figure 2f). The cylindrical shaped micro-lysimeter was made of metal, 2 mm thick. It was divided into an inner barrel and outer barrel. The inner barrel of each micro-lysimeter, containing isolated volumes of soil and grass mounted flush with or slightly above the soil surface, was 36 cm in diameter with a depth of 40 cm. The micro-lysimeters were weighed twice a day (8:00 a.m. and 8:00 p.m.) to determine water loss using electronic balances with 0.001 kg precision to meet the measurement requirements [18]. In addition, the automatic meteorological tower recorded precipitation and air temperature (at the height of 2.0 m above the ground) as the background data to reflect the soil water and soil temperature of sample plots. The meteorological data were also logged automatically every 30 min.
2.3. Soil Sample Analysis
The soil samples were tested and analyzed according to the national environmental protection standard HJ613-2011 of the People’s Republic of China and the agricultural industry standard NY/T 1121.4-2006 of the People’s Republic of China [24,25]. The fresh soil samples obtained from the soil drill were immediately placed in aluminum boxes for packaging, numbering, weighing, and recording of their wet weights as w1. The weighed fresh soil samples were brought back to the laboratory for drying (constant temperature of 105 °C), and then taken out and cooled down to room temperature, weighed, and recorded as w2. Subsequently, the aluminum boxes were washed clean and then weighed and recorded as w3. Finally, the soil water content (SWC) was calculated using Equation (1).
The determination of soil bulk density included the following steps: (1) the volumetric rings (including 2 lids) and soil samples were weighed and recorded as w1; (2) the non-porous lid at the end of the volumetric ring was removed and the perforated lid at the top of the volumetric ring (with filter paper inside) was placed in the container with the water slowly added until the top lid was just submerged, and then placed in a tray covered with fine sand for 48 h, weighed, and recorded as w2; (3) the volumetric rings and soil samples were put in the oven for drying, and then taken out and cooled down to room temperature, weighed, and recorded as w3 (including 2 lids); (4) the volumetric ring was washed clean and then weighed and recorded as w4. The soil bulk density was calculated using Equation (2).
where ρ is soil bulk density (g/cm3) and V is the volume of the volumetric ring (200 cm3).
2.4. Data Analysis
The SWS was calculated using Equation (3):
where SWS is the soil water storage (mm), ρ is the soil bulk density (g/cm3), h is the thickness of the soil layer (cm), and w is the soil water content (%).
The STG was calculated using Equation (4):
where is the soil temperature gradient (°C/m), and ΔT (°C) and Δz (m) are the soil temperature and depth differences between the two layers, respectively.
2.5. Statistical Analysis
One-way analysis of variance (ANOVA) was applied to clarify whether there are significant differences in the effects of typical patch types on soil properties. ANOVA is a statistical method used to test for significant differences in the means of three or more groups. The main steps include (1) establishing hypotheses; (2) calculating the sum of the squared differences between all observed values and the total mean; (3) calculating the sum of the squares of the differences between the mean values of each group and the total mean; (4) calculating the sum of the squares of the differences between each observed value within the group and its mean; (5) calculating the mean squares and F-value, which are used to compare variances between and within groups; and (6) determining the significance level (usually 0.05) and drawing conclusions. The SWS, STG, and evapotranspiration of the five patch types were assessed using the ANOVA method and tested for significant differences at LSD = 5%, with the significance test parameter (p-value) being used to evaluate the performance. All statistical analyses were performed in SPSS 19.0 (SPSS Inc., Chicago, IL, USA), and plotting was performed using Origin software 2017 (Origin Lab Inc., Northampton, MA, USA).
3. Results
3.1. Variations in SWS among the Five Typical Patches
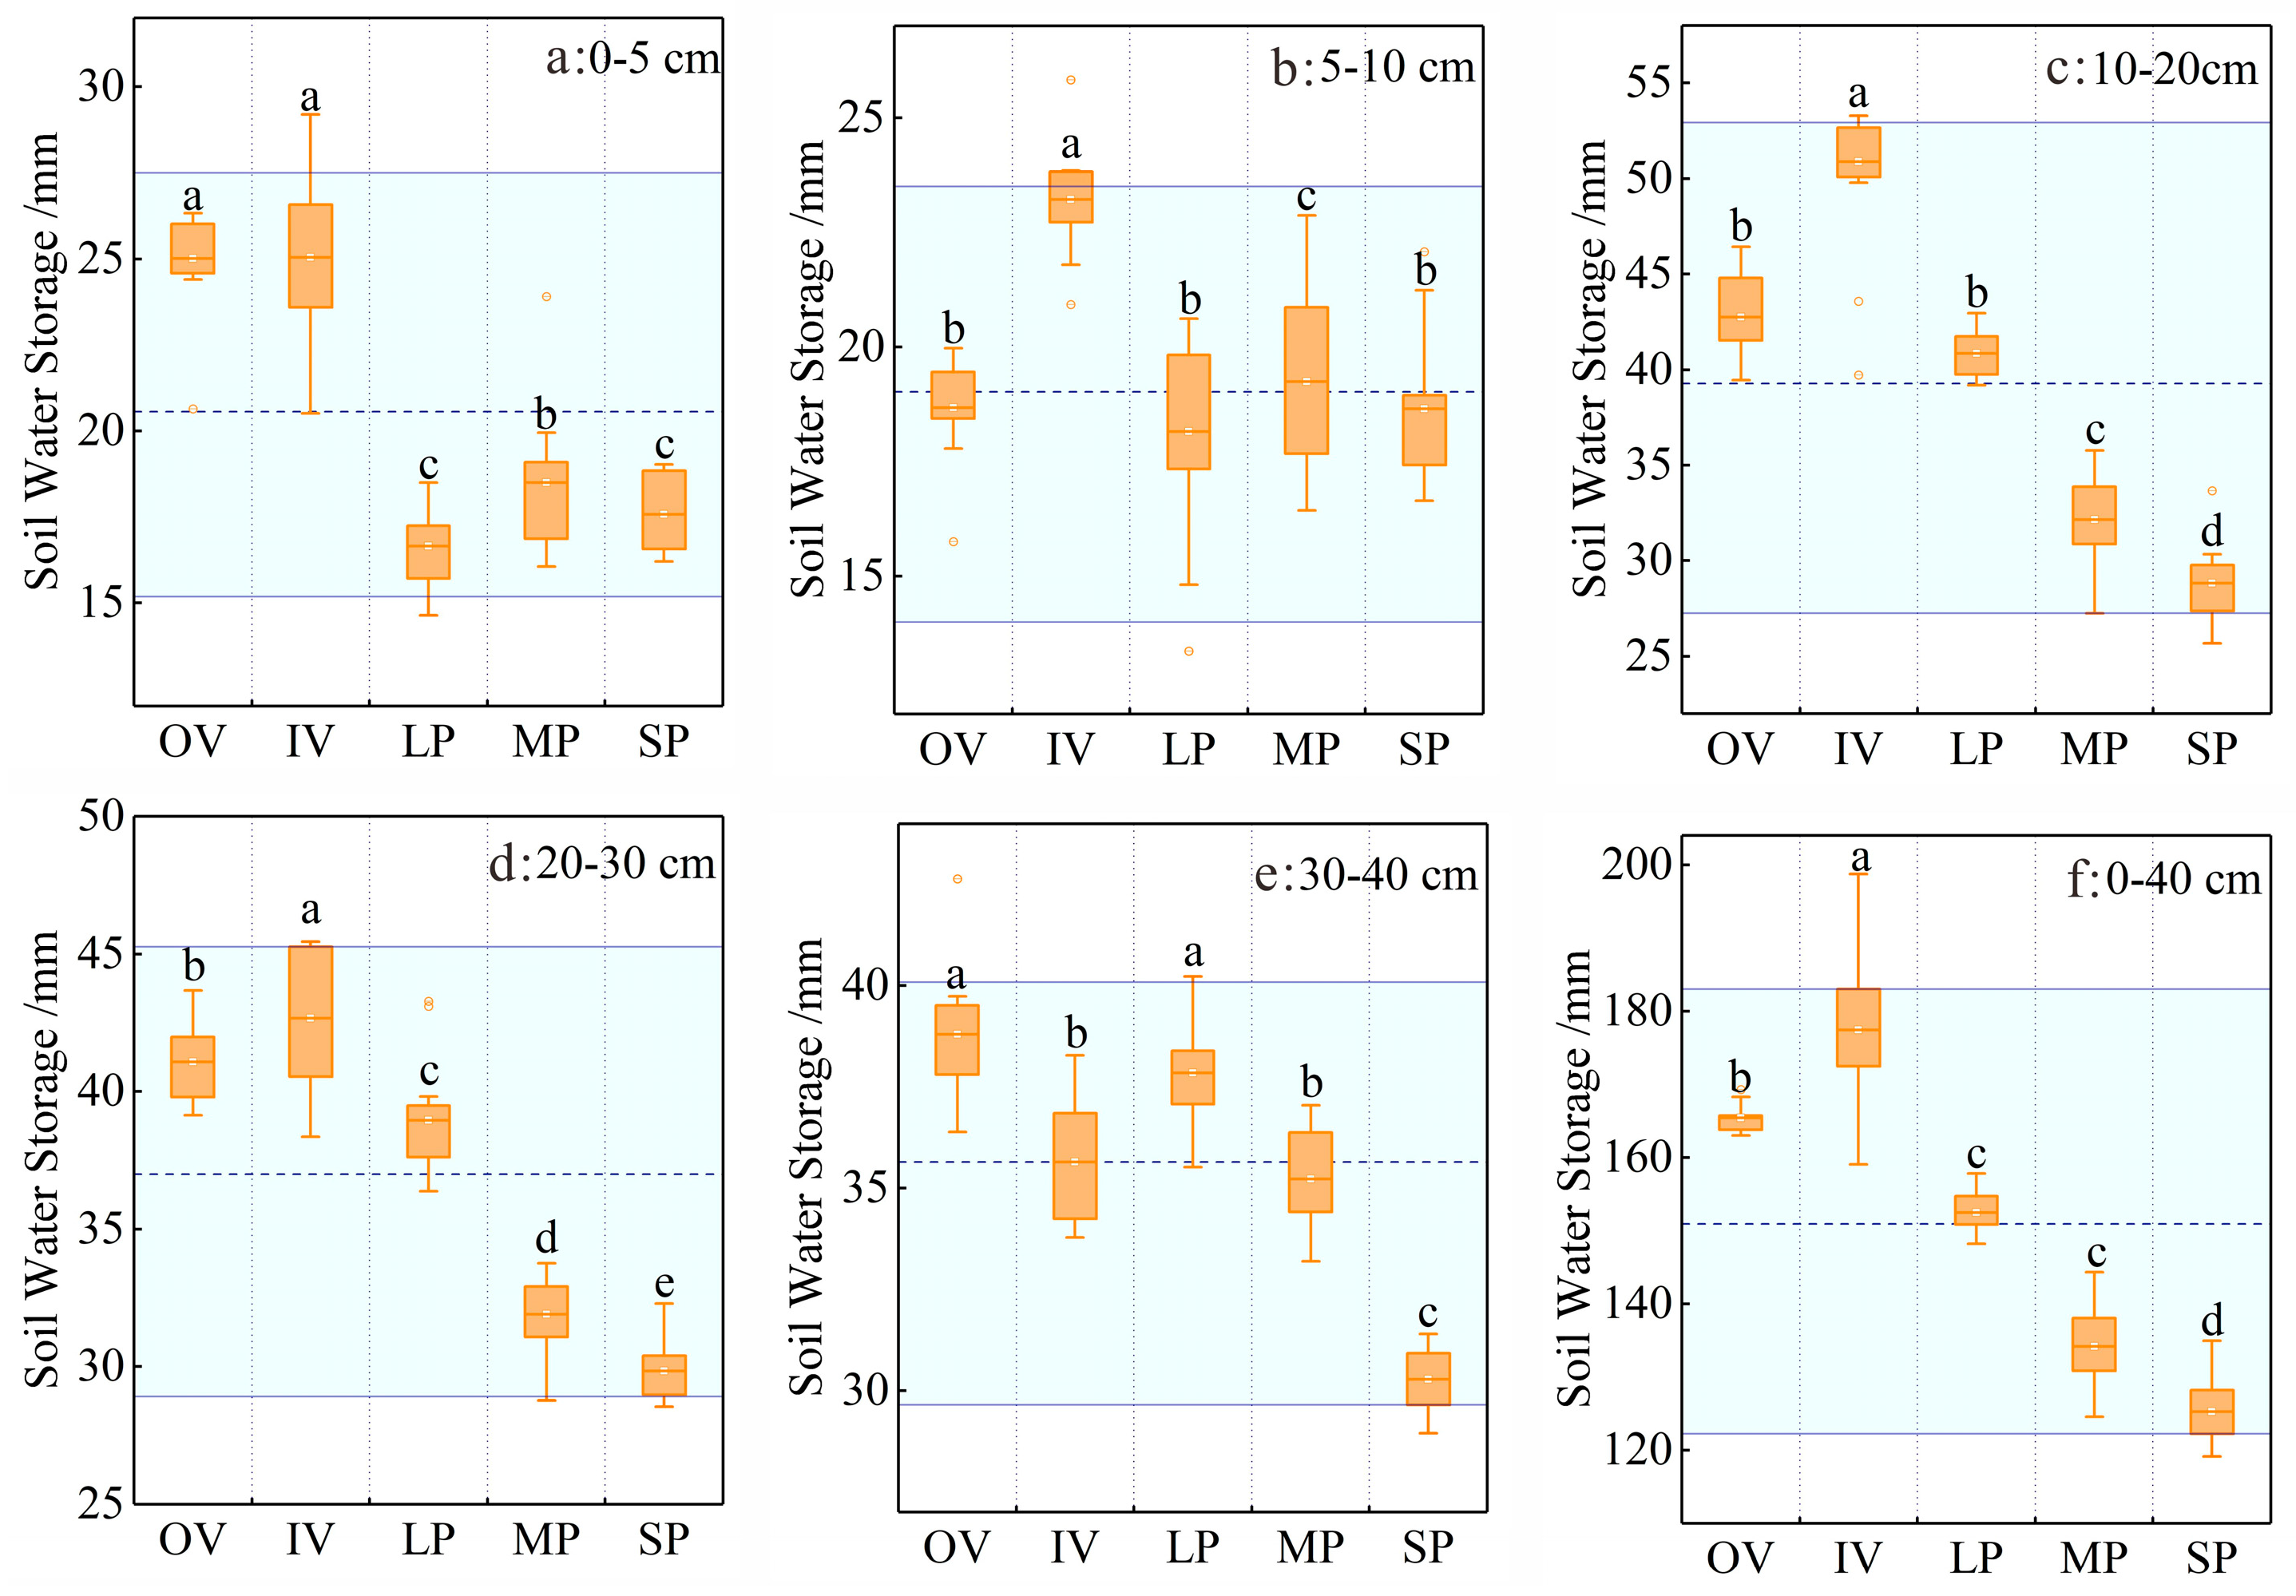
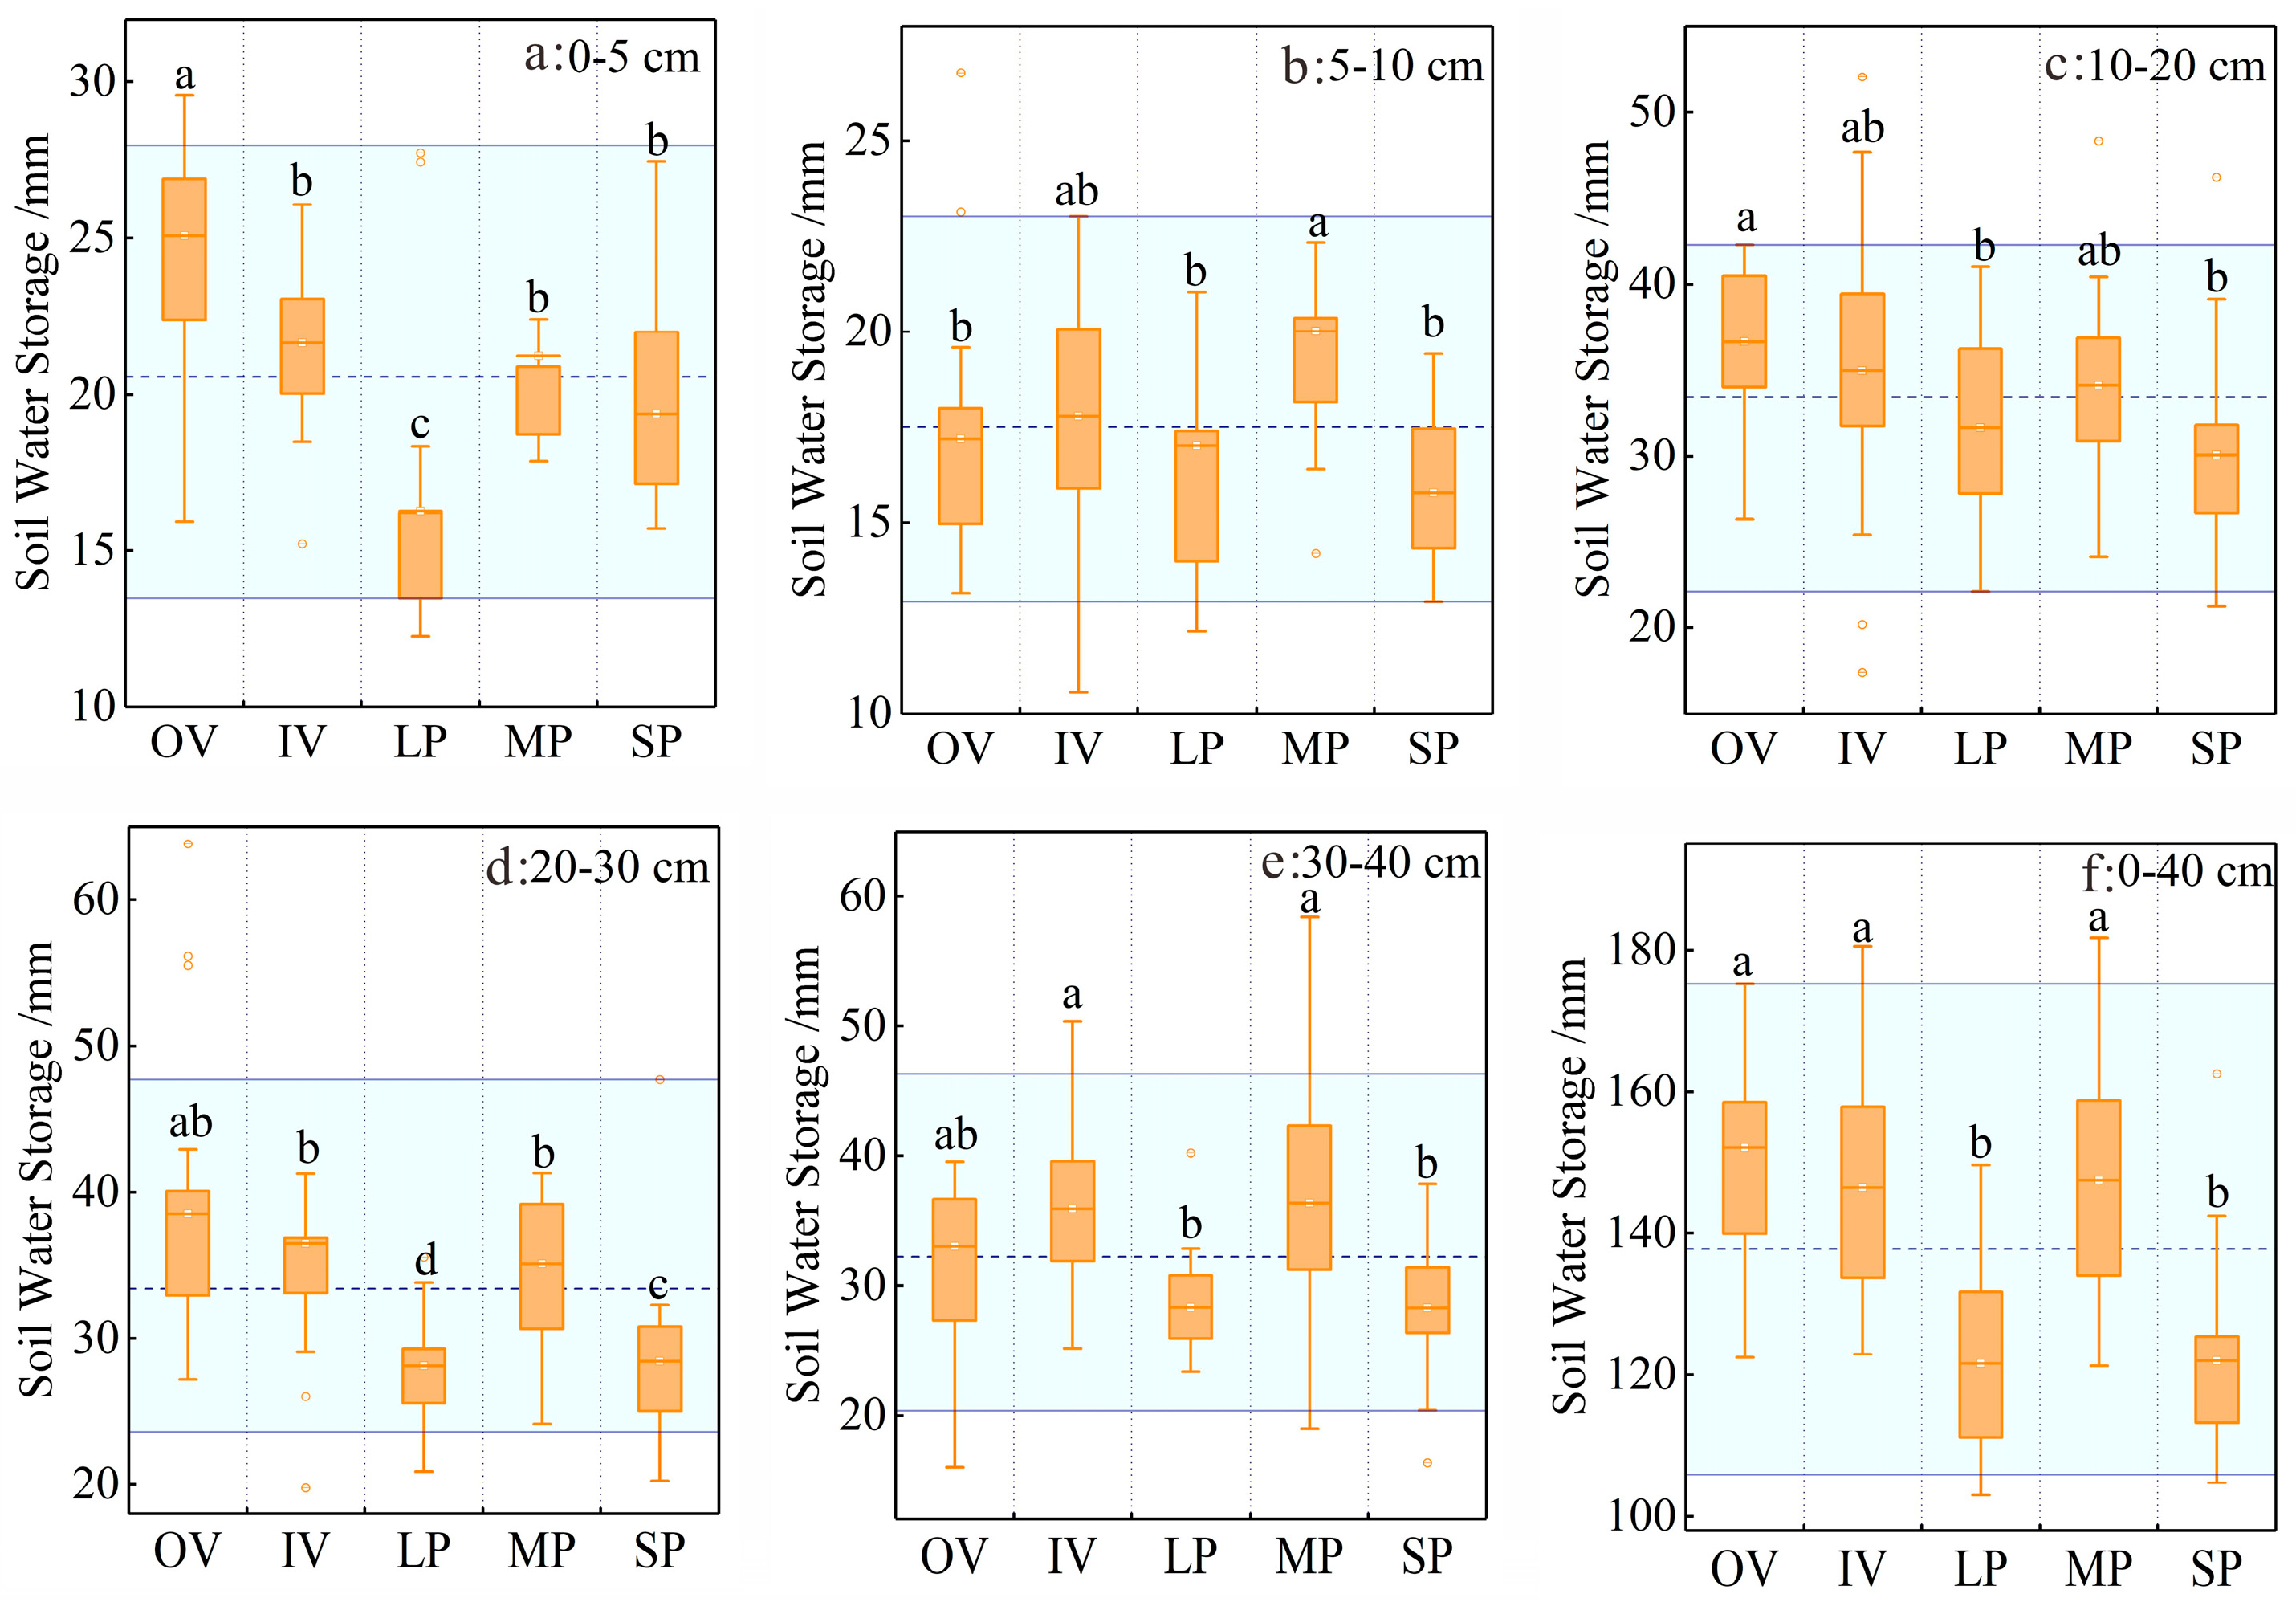
The in situ measured SWS showed obvious differences among the five typical patches in all soil layers. The vegetation patches had higher SWS values than the bare patches, with the average value for the 0–40 cm soil layer exceeding 150 mm in both observation years (Figure 3 and Figure 4). Among the vegetation patches, the IV had higher SWS than OV at 0–30 cm soil layer in years with abundant precipitation, while the OV had higher SWS in years with less precipitation (Figure 3 and Figure 4). The SWS in bare patches with different sizes also had remarkable discrepancies in 2019: the maximum mean value was found for MP, followed by SP and LP (Figure 4). However, in 2020, with abundant precipitation, except for 0–5 cm soil layer, the SWS of MP decreased significantly, with values between those of LP and SP (Figure 3). Moreover, the differences in the SWS depended on soil depth and precipitation. In the 0–40 cm soil layer, the differences in the SWS weakened with the increase in the soil depth. When the soil depth exceeded 30 cm, the SWS of the five typical patches tended to be consistent, especially in years with less precipitation (Figure 4).
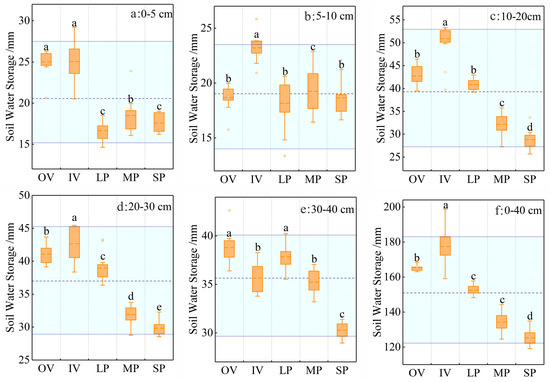
Figure 3.
Variations in SWS among the five typical patches at different soil depths in 2020. The blue-colored area is marked with the range of values between 5 and 95%, and the dashed line represents the average value. Different letters indicate significant differences among the five patch types (p < 0.05) based on the LSD test.
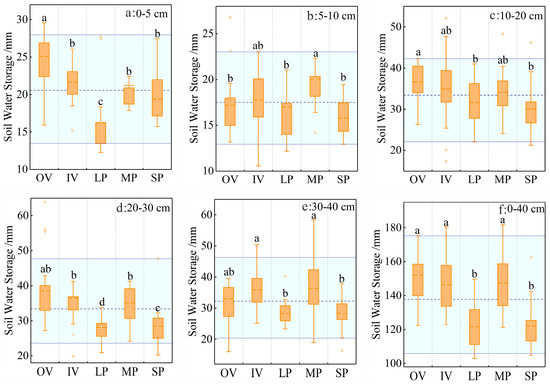
Figure 4.
Variations in SWS among the five typical patches at different soil depths in 2019. The blue-colored area is marked with the range of values between 5 and 95%, and the dashed line represents the average value. Different letters indicate significant differences among the five patch types (p < 0.05) based on the LSD test.
3.2. Differences in ST and STG among the Five Typical Patches
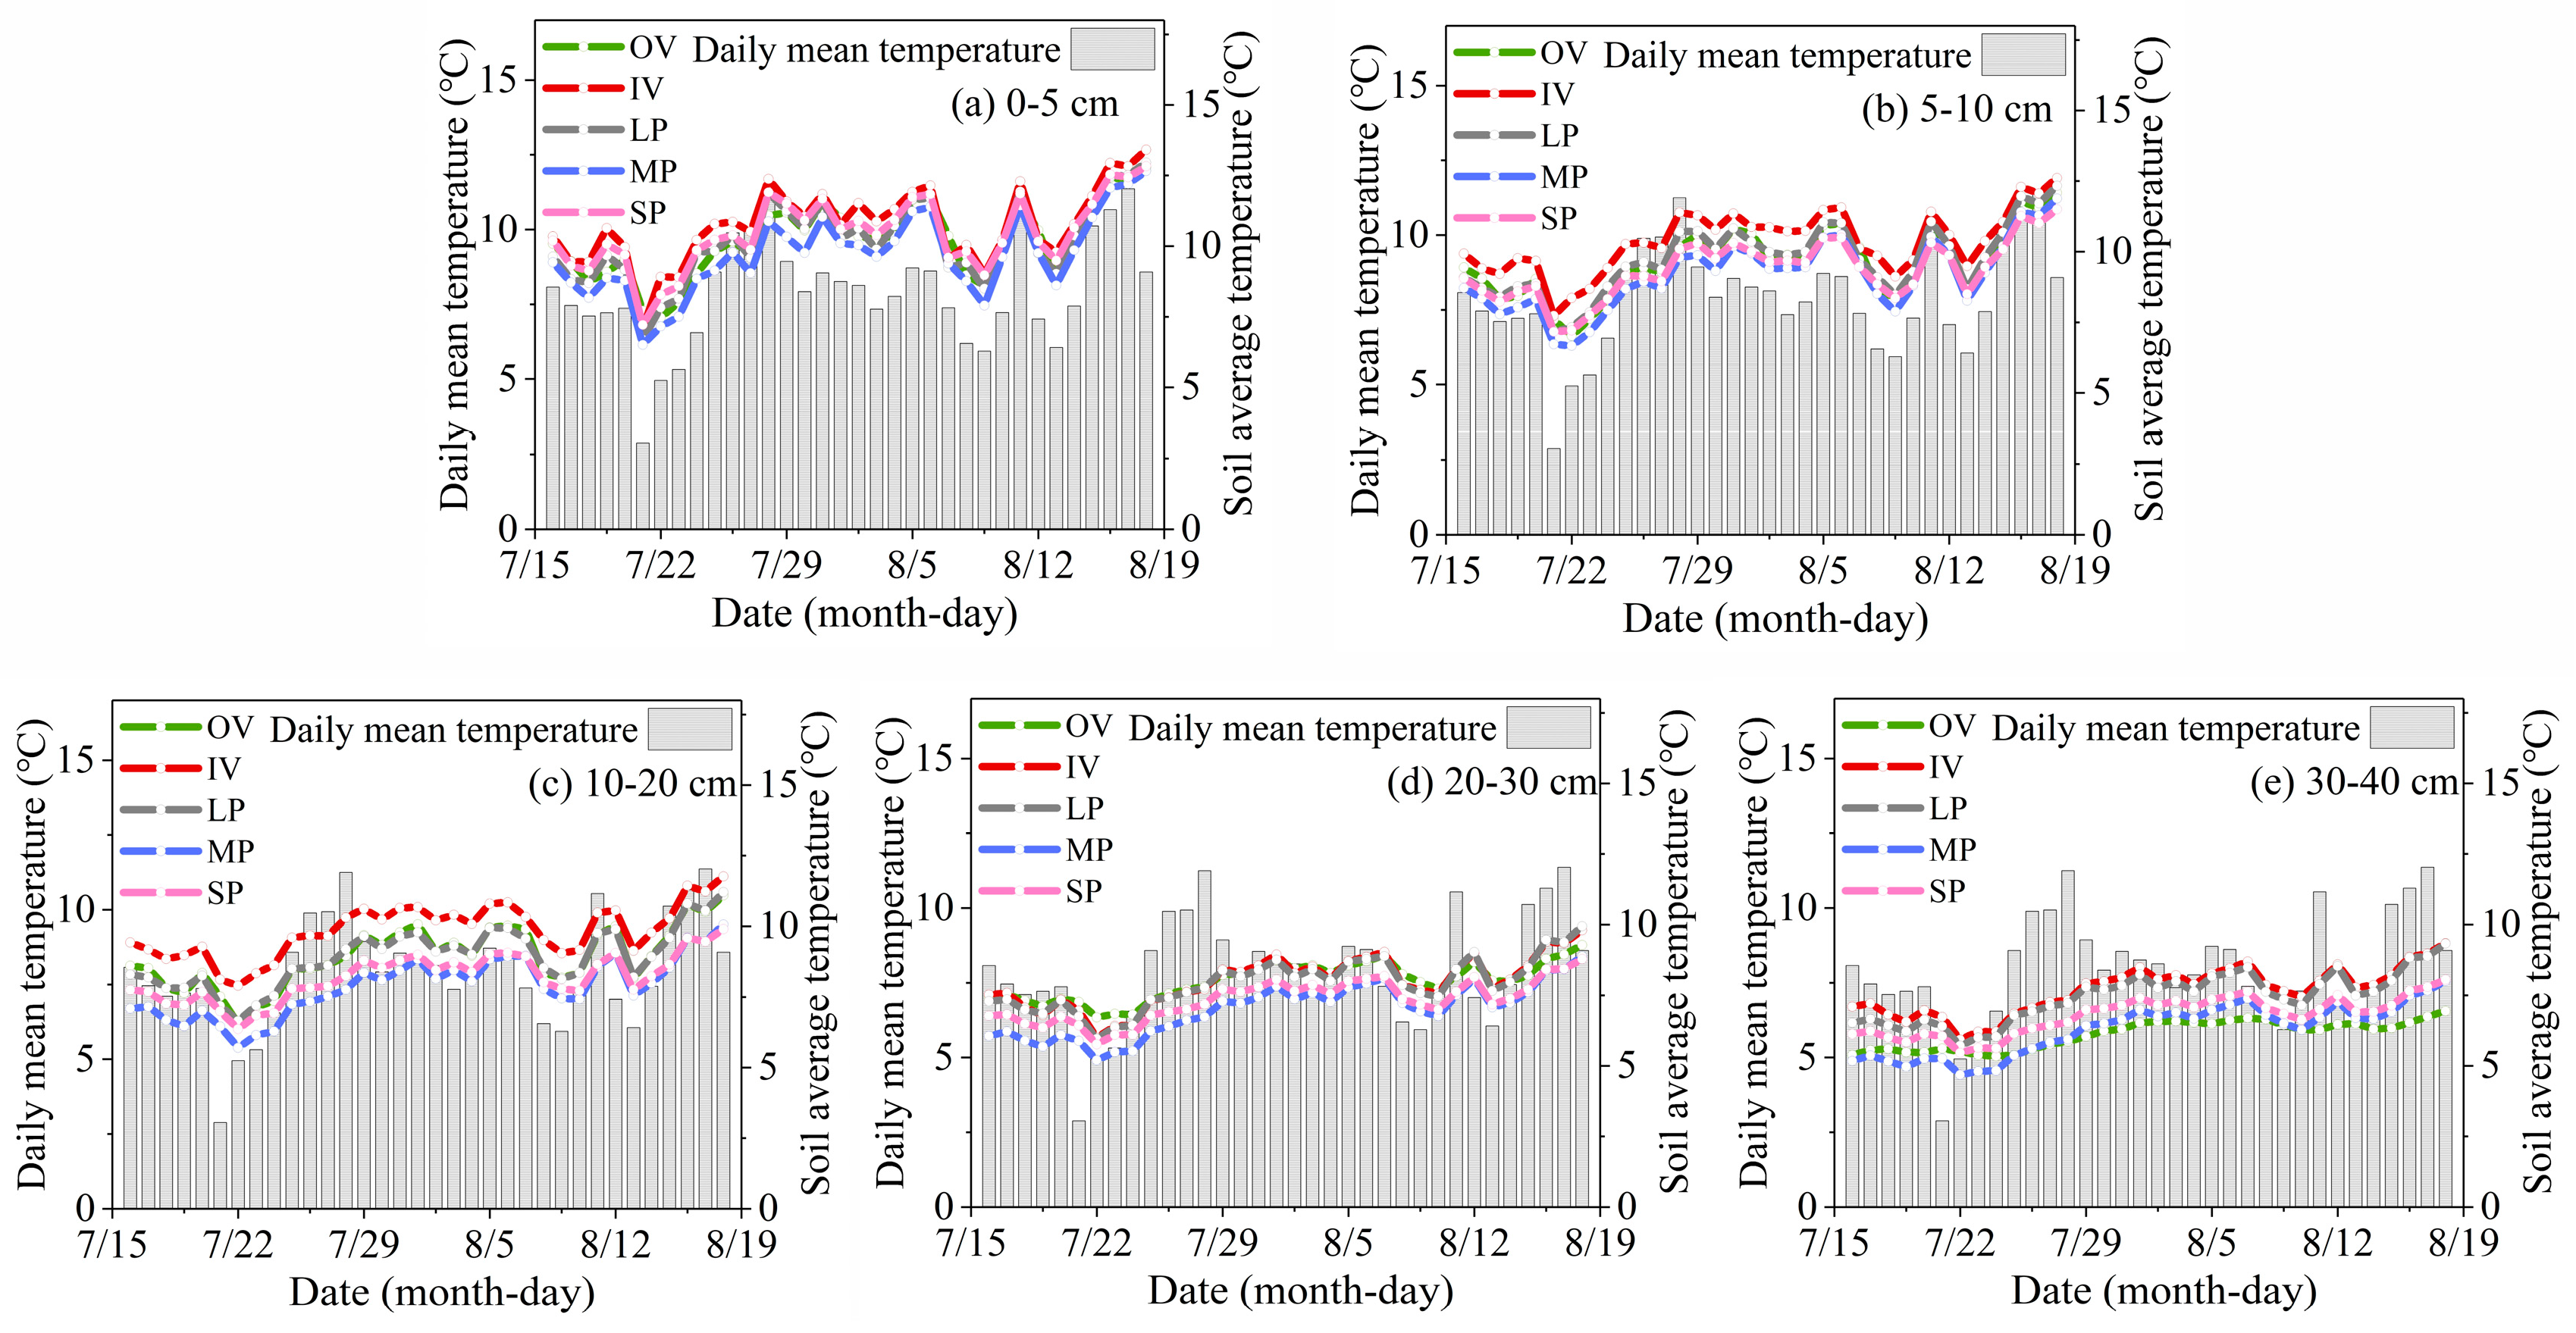
The patchiness of the alpine meadow affected the ST (Figure 5 and Figure 6). The vegetation patches had a higher ST than bare patches, and the differences were mainly observed in the upper soil layer with root distribution (0–20 cm). The lack of vegetation roots resulted in homogeneous soil properties; therefore, the temperature and variation patterns of the three bare patch types were relatively similar, and the ST showed a gradually decreasing trend with the increase in the soil depth (Figure 5 and Figure 6). Unlike bare patches, although the IV and OV were both vegetation patches, they exhibited evident temperature differences and variation patterns. Generally, the IV had a higher ST; for example, in 2020, the average ST values of the IV were 13.5 °C, 12.2 °C, 11.2 °C, 10.4 °C, and 9.9 °C for the 0–5 cm, 5–10 cm, 10–20 cm, 20–30 cm, and 30–40 cm soil layers, and the differences with the average ST of OV in the corresponding soil layers were 1.3 °C, 0.4 °C, −0.07 °C, 1.2 °C, and 2.9 °C, respectively (Figure 6).

Figure 5.
Variations in ST among the five typical patches at different soil depths in 2019.
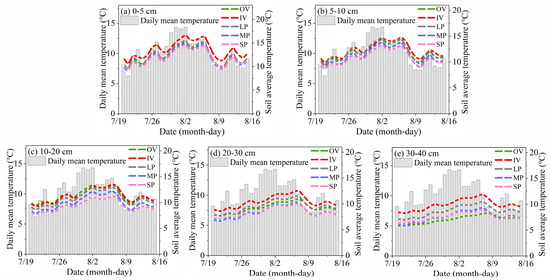
Figure 6.
Variations in ST among the five typical patches at different soil depths in 2020.
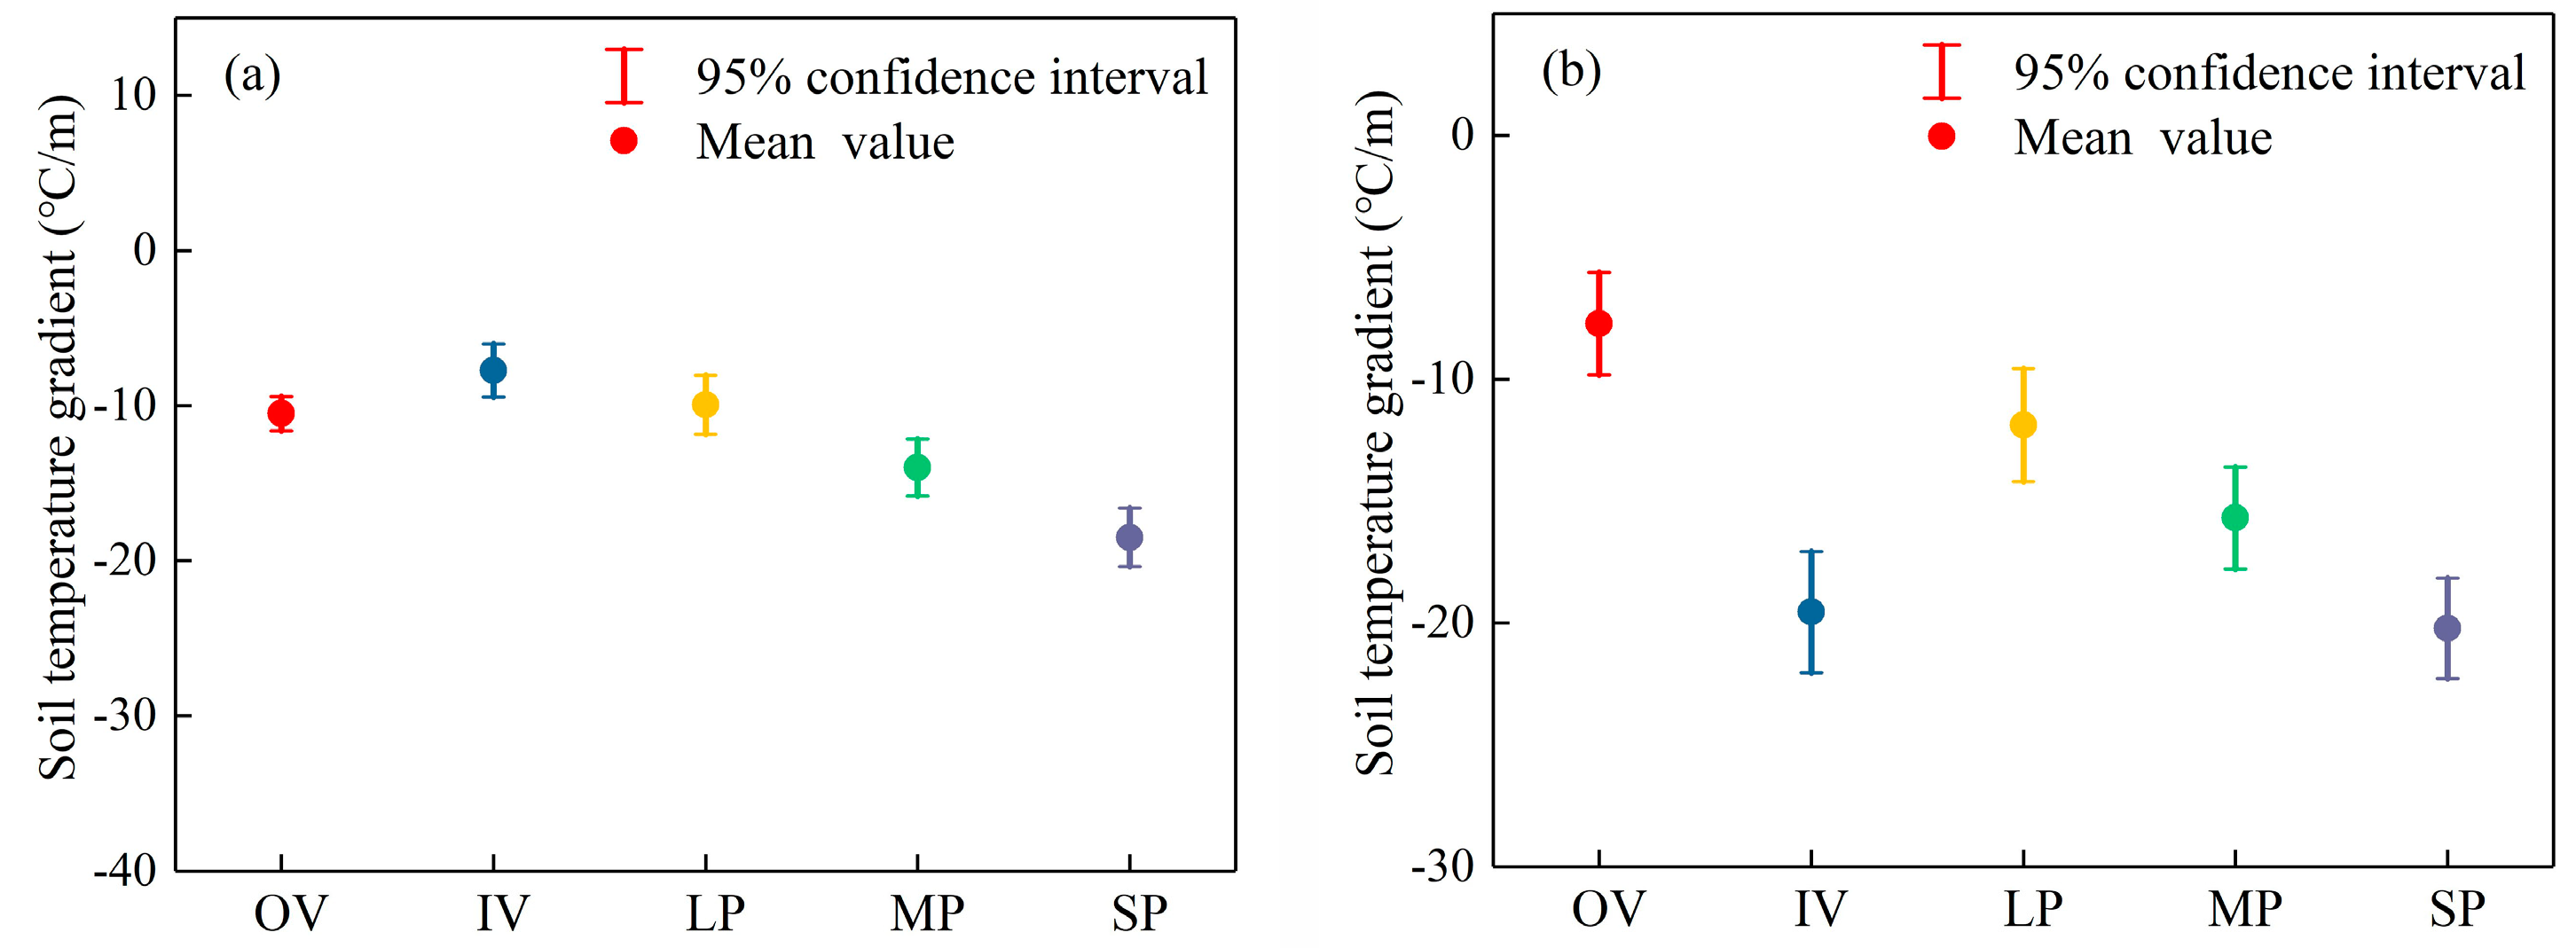
Considering the remarkable difference in ST mentioned above, the STG was used to reveal the impact of alpine meadow patchiness on ST. The results showed that the STGs of five typical patches were all less than 0, indicating that solar input was transferred from the surface to deeper soil layers (Figure 7). In 2019, three bare patch types had a greater rate of solar input than vegetation patches, and for two vegetation patches, the gradient of solar input was slightly greater for OV than for IV (Figure 7a). Notably, in 2020, with higher air temperature, the absolute value of the STG of IV increased dramatically, which was the highest among the five patch types (Figure 7b). Our study emphasized that the IV patch type was sensitive to solar input, as the STG of the IV showed obvious fluctuations with changes in the soil temperature.
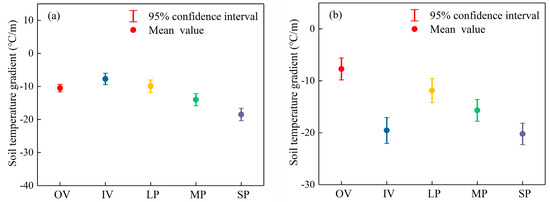
Figure 7.
Variations in STG (0–15 cm) among the five typical patches in (a) 2019 and (b) 2020.
3.3. In Situ-Measured Evapotranspiration
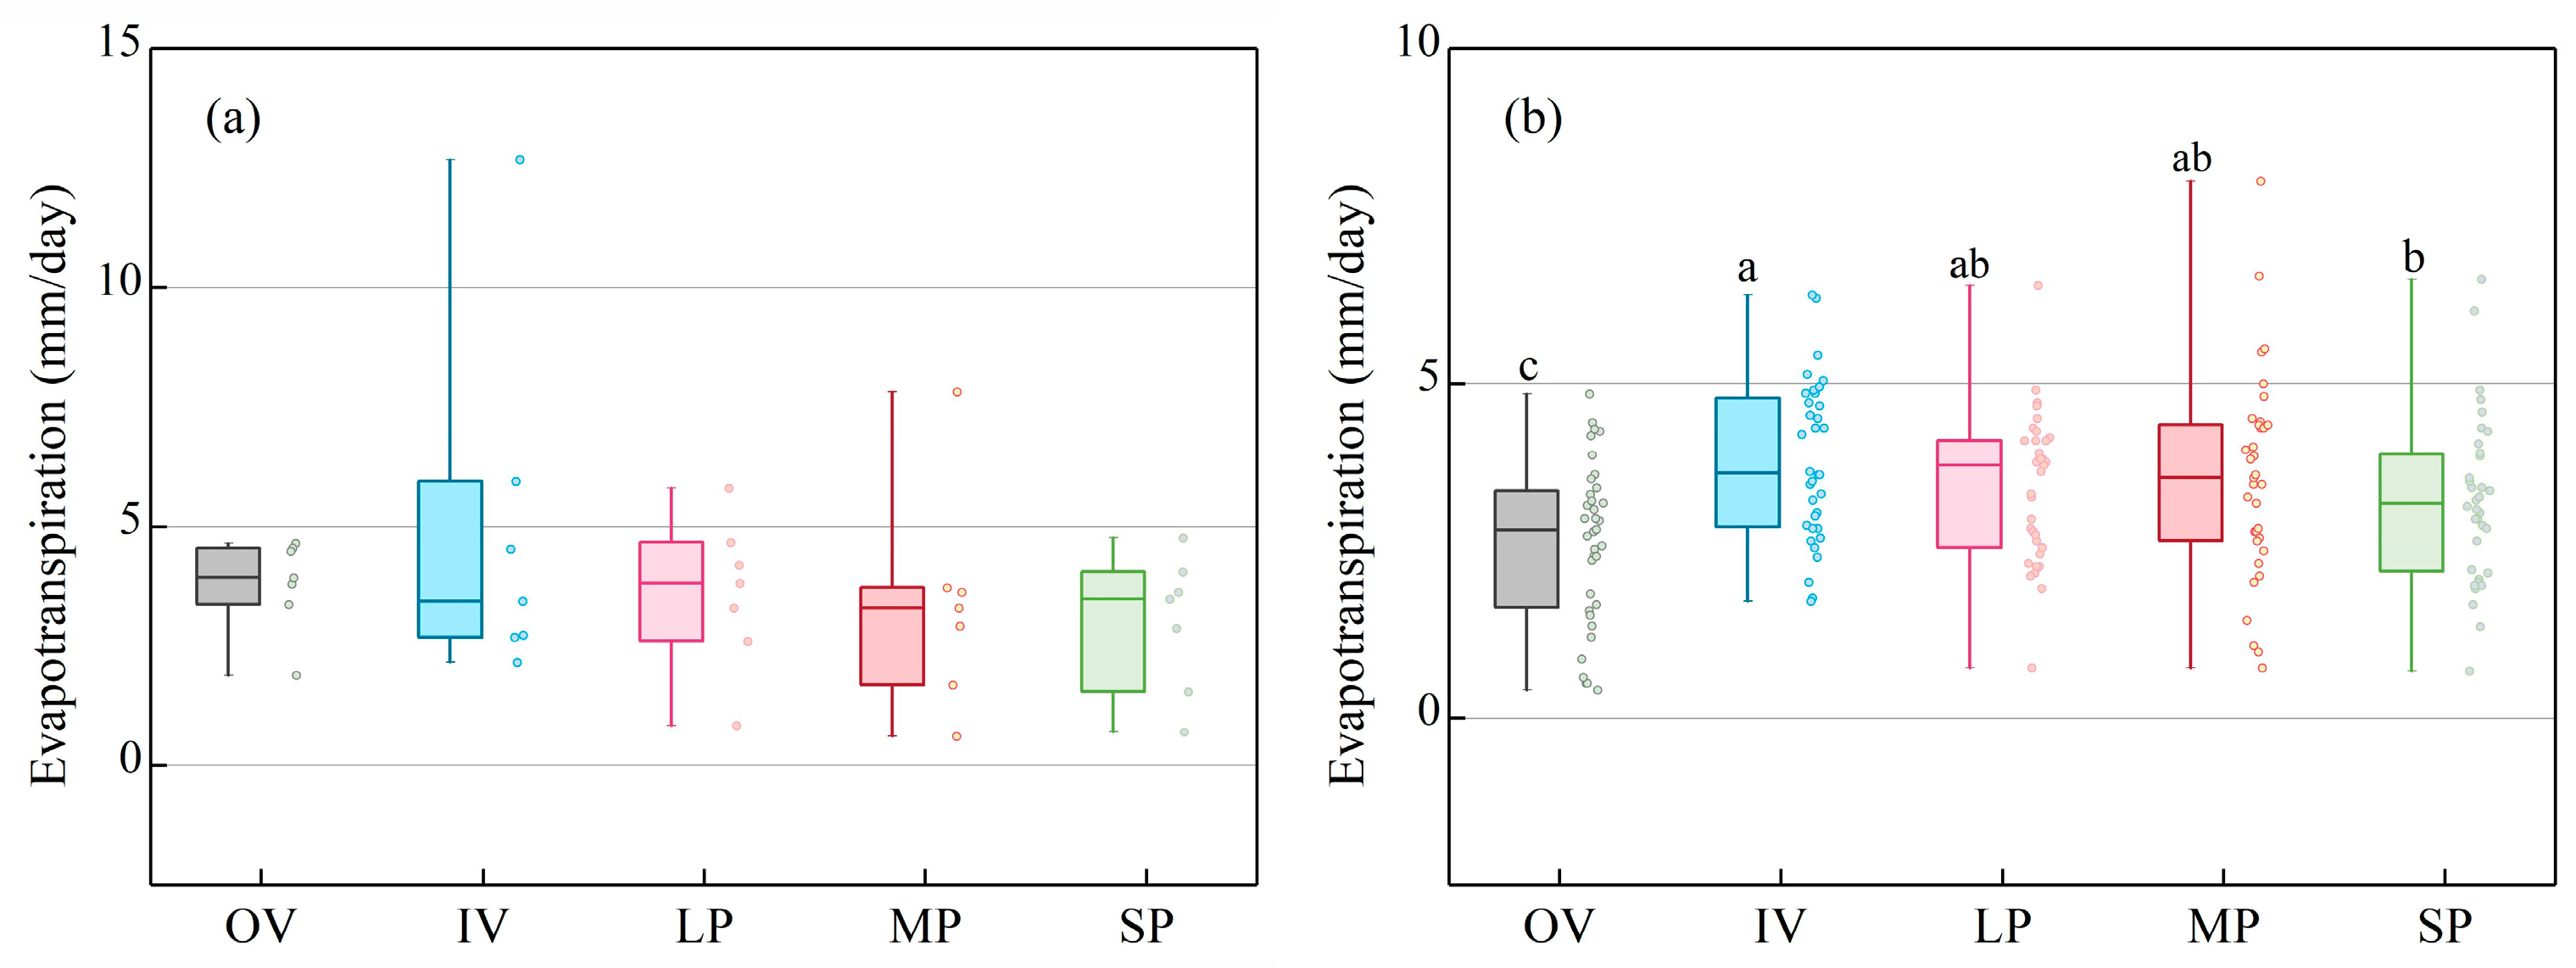
The in situ measured evapotranspiration indicated considerable variations among the five typical patches in 2020, a year with abundant precipitation and high air temperature (Figure 8b). The mean evapotranspiration ranged from 2.63 mm/day to 3.85 mm/day, and the highest value appeared in the IV, which was approximately 7.58%, 11.78%, 18.98%, and 46.66% higher than the MP, LP, SP, and OV, respectively (Figure 8b). By contrast, in 2019, a year with relatively low precipitation and low air temperatures, although the variation in evapotranspiration among the five typical patches showed the same variation trend as in 2020, the differences did not pass the significance test, which may be related to the smaller number of samples (Figure 8a).

Figure 8.
Variations in in situ measured evapotranspiration among the five typical patches in (a) 2019 and (b) 2020. Different letters indicate significant differences among the five typical patches (p < 0.05).
4. Discussion
4.1. Differences in SWS between Vegetation and Bare Patches
Alpine meadow patchiness intensifies the heterogeneity of SWS in the surface soil layer (Figure 3 and Figure 4). Firstly, the differences are mainly generated by affecting the two key parameters, namely, soil bulk density and soil moisture, which are used for SWS estimation [26,27]. On the one hand, the high proportion of decayed and fresh root channels increases soil porosity [28,29], resulting in a lower soil bulk density in vegetation patches compared to the bare patches (Table 3). On the other hand, the presence of roots can also enhance soil infiltration and water-holding capacity in vegetation patches [30], ultimately leading to higher soil moisture and SWS (Figure 3 and Figure 4). Furthermore, owing to the vulnerability to erosion (wind, etc.), the gravel content is significantly higher in bare patches than in vegetation patches [31], inducing low soil water-holding capacity and SWS [32]. In addition, the higher evapotranspiration of bare patches accelerates the loss of soil water, which is also an important reason for the lower SWS (Figure 8).
Table 3.
Variations in soil bulk density among the five typical patches.
4.2. Soil Moisture Migration between IV and Surrounding MP
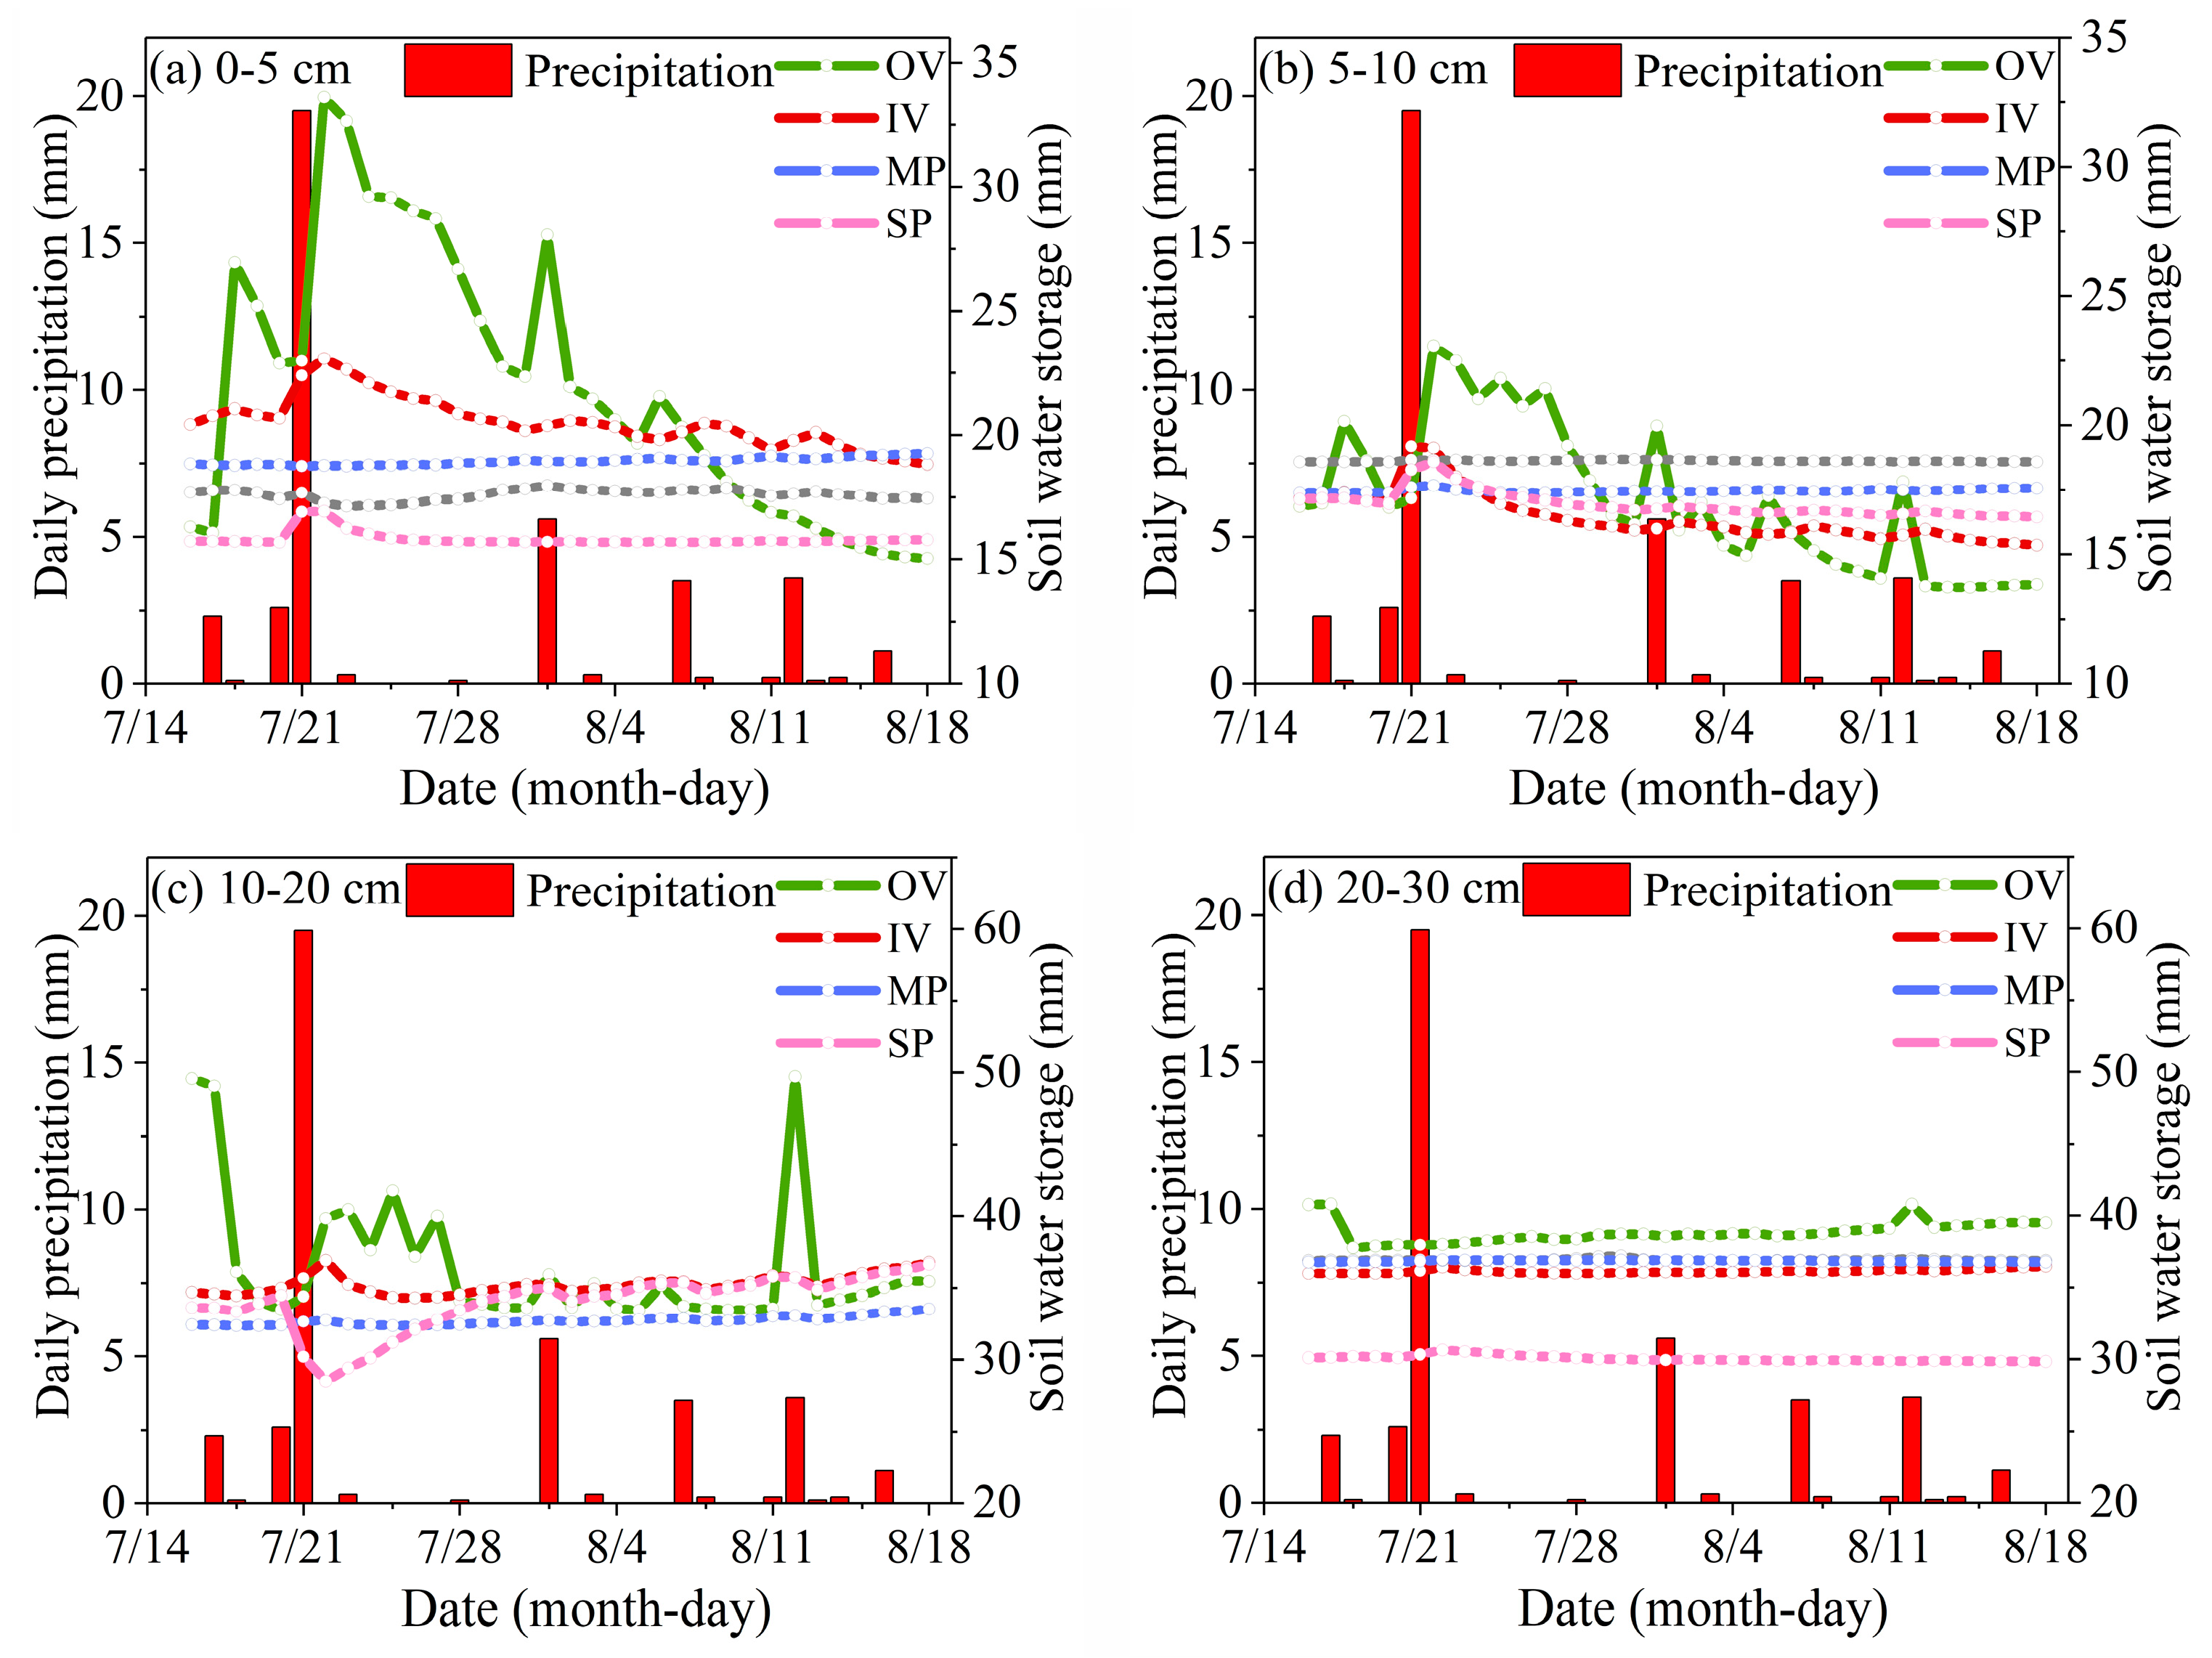
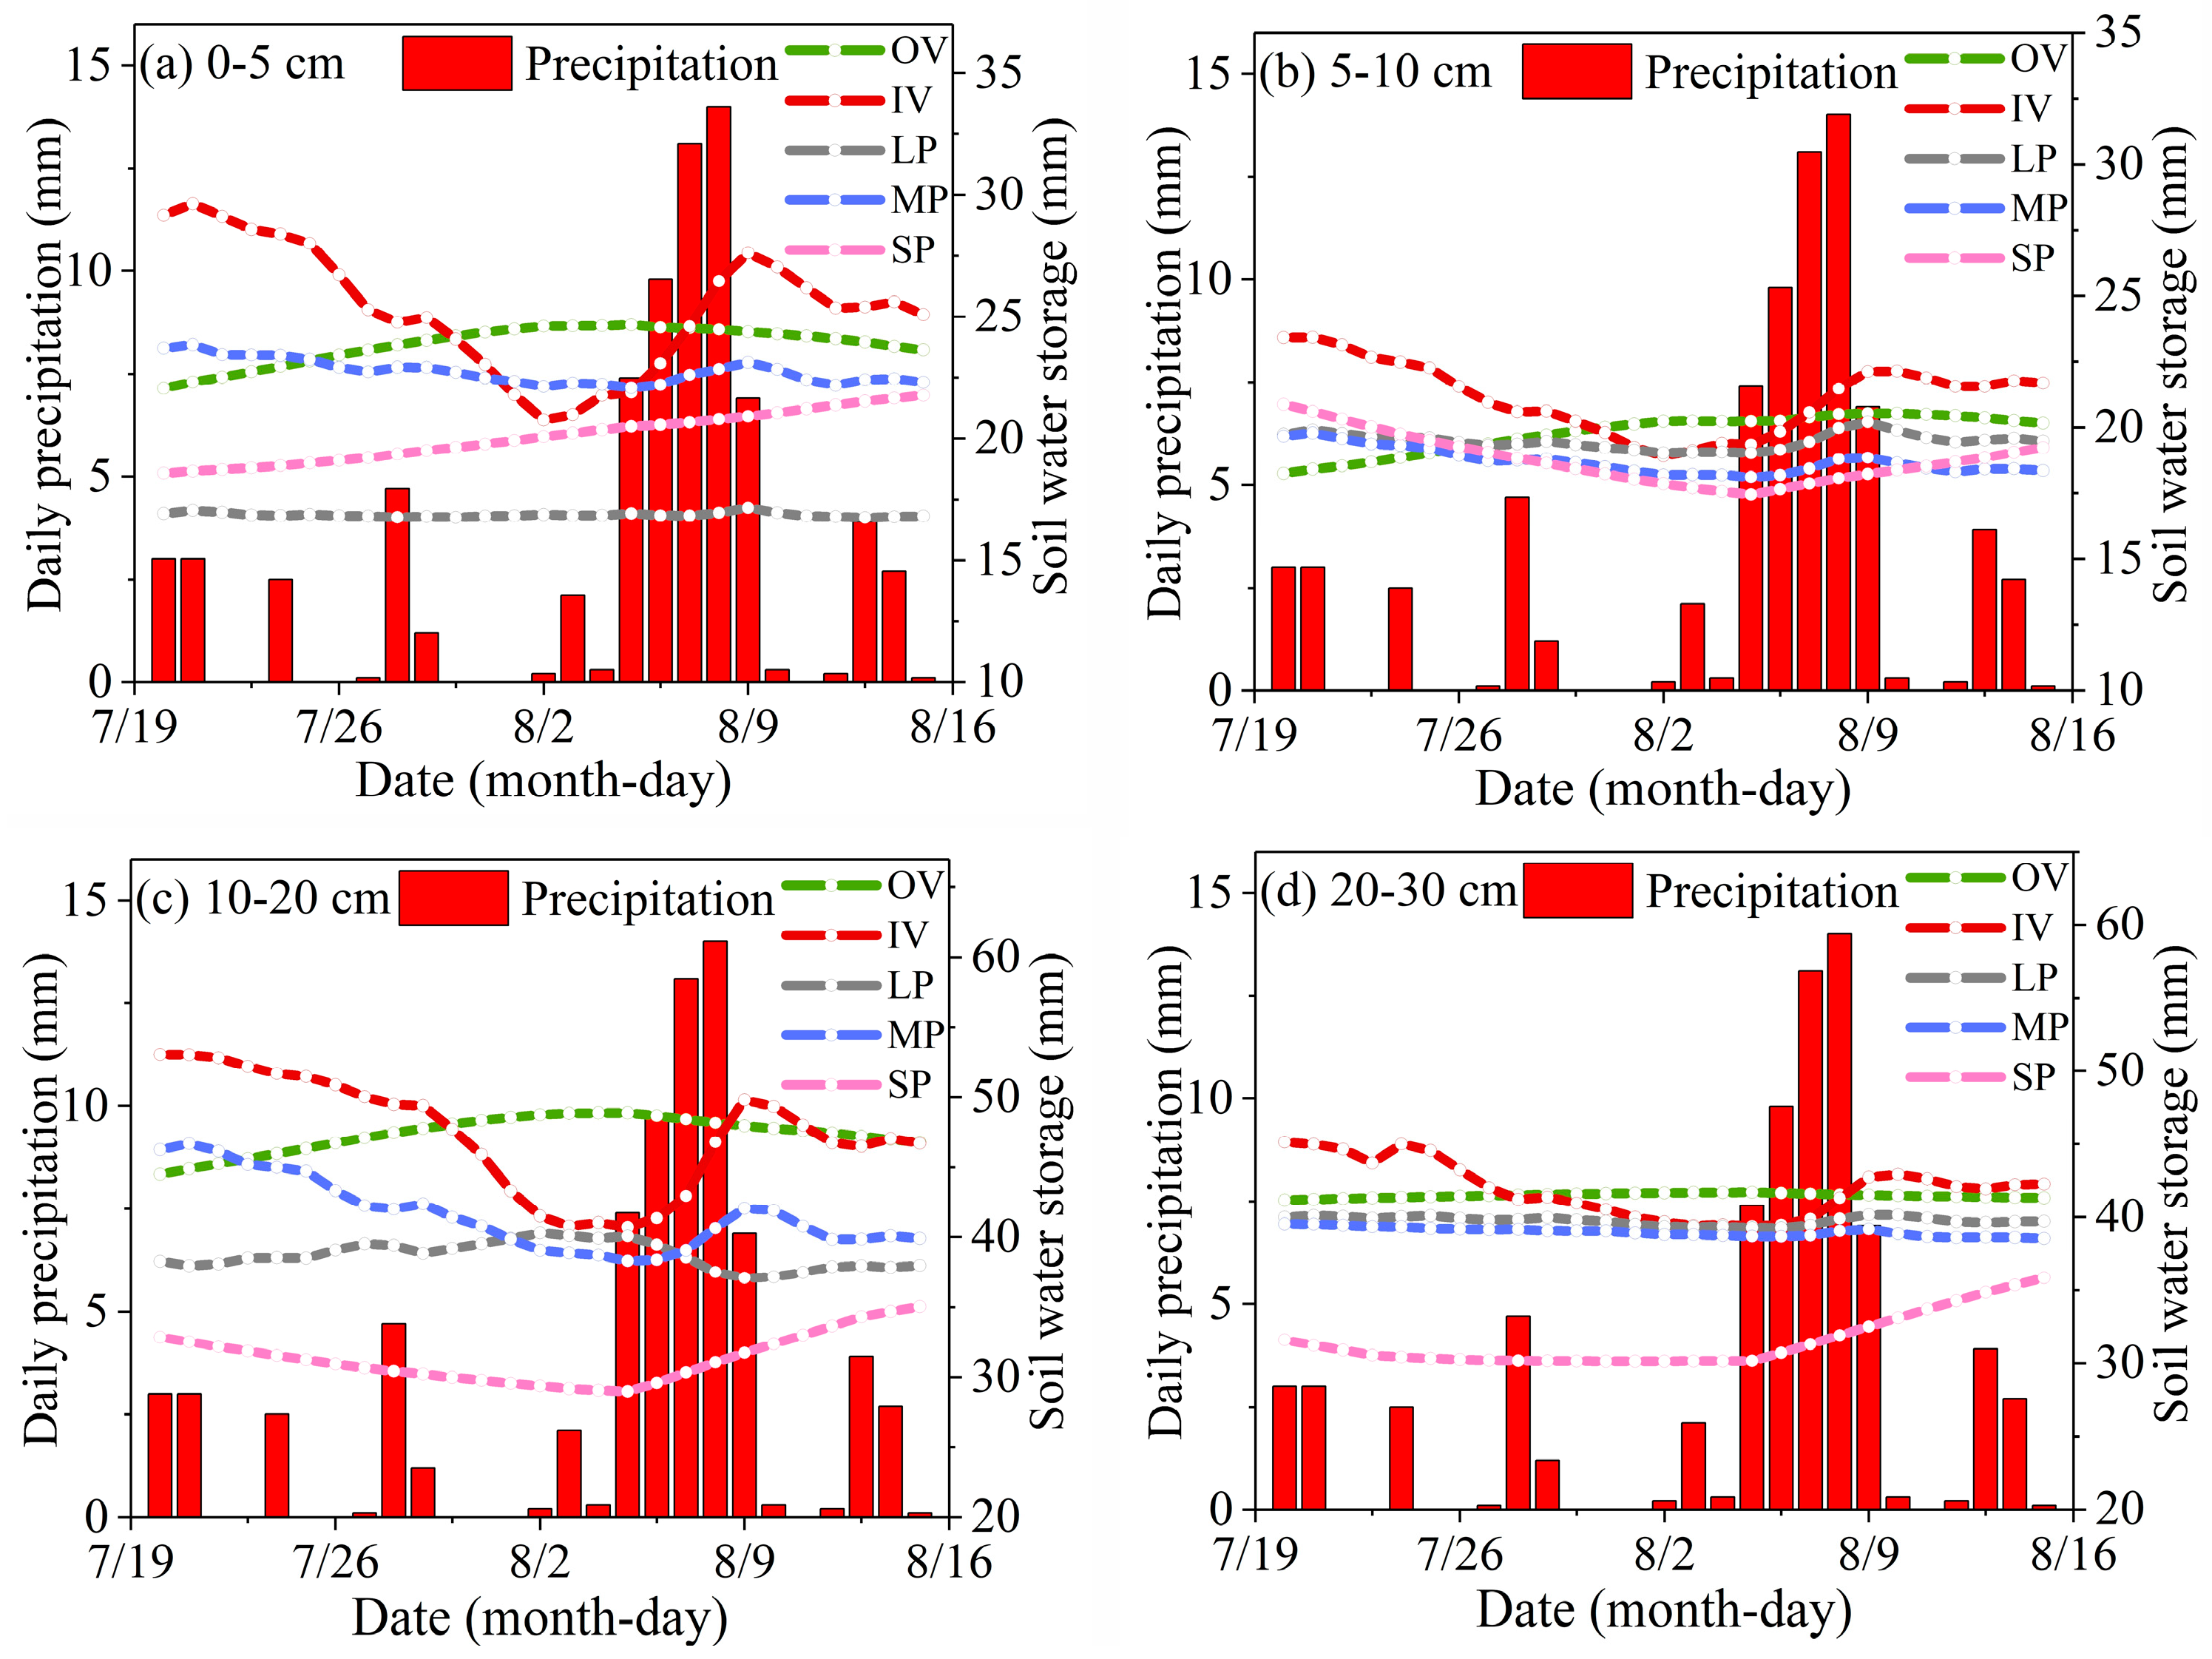
More attention should be paid to exploring the noticeable difference in the SWS between the IV and OV, which may determine the roles of these two types of soil in maintaining the stability of alpine meadow. Our research used EM50 soil moisture data to calculate the SWS and further analyzed their synchronous changes with precipitation over the observation periods (Figure 9 and Figure 10). The results illustrate that the difference in SWS between the IV and OV is closely related to precipitation. When precipitation is abundant, IV has higher SWS in the 0–30 cm soil layer than the OV, whereas it is significantly lower than OV in the case of less precipitation (Figure 9 and Figure 10). It is worth noting that there is a corresponding change in the SWS of the MP. Under the condition that the SWS of the IV is lower than the OV, the MP has the highest SWS among the bare patch types. Conversely, the SWS of the MP is decreased significantly, with values between those of the LP and SP.
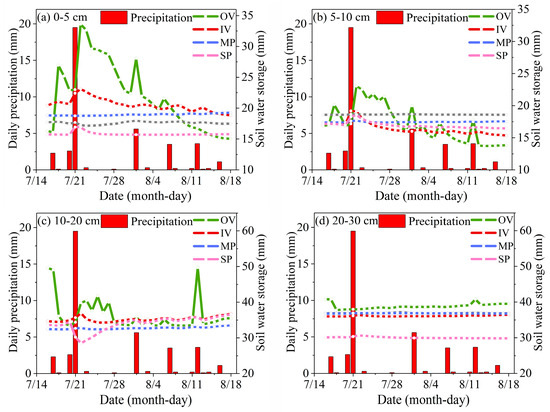
Figure 9.
Variations in SWS with precipitation among typical patches at different soil depths in 2019. Data obtained from probes mounted on LP were corrupted and, therefore, are not shown in this figure.
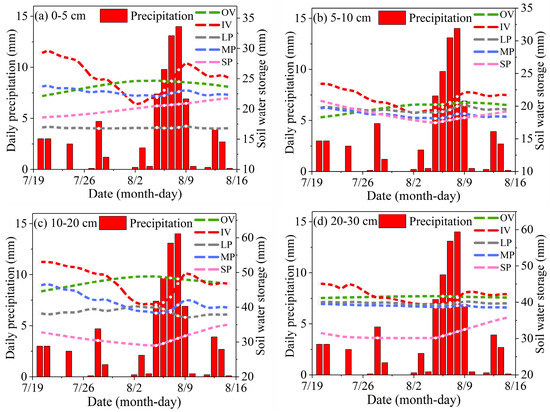
Figure 10.
Variations in SWS with precipitation among the five typical patches at different soil depths in 2020.
With abundant precipitation, bare patches are completely submerged and the soil water content is supersaturated as a result of the terrain being lower than that of the vegetation patches (Figure 11). For the vegetation patches, the mucus secreted by roots and attached microorganisms has a strong water-holding capacity [18], significantly affecting the hydraulic properties of the rhizosphere soil and reducing its hydraulic conductivity [33]. During the growing season, the range of rhizosphere soil can be extended to 10 cm around the roots, further expanding the hydraulic conductivity of IV and its surrounding MP. Nevertheless, the differences in hydraulic conductivity are likely to induce lateral flow from bare patches to vegetation patches [34,35]. Therefore, we assume that there is a lateral flow of soil water between IV and MP with abundant precipitation, which also provides a good insight into why MP has a lower SWS value in humid years and a higher value in dry years (Figure 3 and Figure 4).
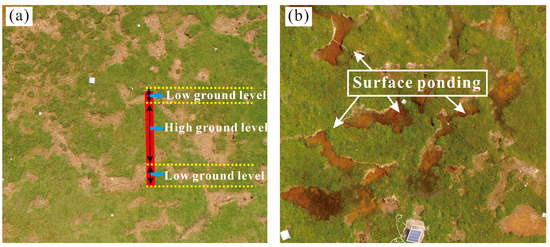
Figure 11.
UAV aerial images of sampling plots: (a) difference in ground height between vegetation and surrounding bare patches and (b) submerged bare patches.
Furthermore, the IV has relatively higher evapotranspiration compared to the OV, and had even more so than the LP and SP in 2020 (Figure 8b). In addition to higher ST (Figure 5 and Figure 6) and adequate soil moisture (Figure 3 and Figure 4), it may be attributed to surface wind, which is an essential force for the evapotranspiration process [36]. The IV is surrounded by bare soil with a lower ground level (Figure 11), lacking shelter and resulting in the acceleration of surface heat flux and evapotranspiration [18]. Similar to our research, other studies also report that differences in evapotranspiration can drive the lateral flow of subsurface soil water [5,37]. Therefore, our analysis suggests that the IV could absorb soil moisture from the surrounding bare patches through roots, and partial water is more likely to be lost via evaporation, which is excessive consumption and not conducive to maintaining alpine meadow stability.
4.3. Effects of Alpine Meadow Patchiness on Soil Temperature
It is generally believed that, under the same radiation conditions, the heat absorption capacity and heating rate of bare ground are greater than those of vegetated ground [38]. Moreover, the transpiration of vegetation leaves consumes heat, finally resulting in a lower temperature in vegetation than that in bare soil [39]. In accordance with existing studies, our results show that vegetation patches have a higher soil temperature than bare patches, which was especially the case in 2020 with sufficient precipitation (Figure 6). Through field investigation and image analysis, we believe that the feedback mechanism of the dry and wet states of soil caused by rainfall is the main reason for the higher temperatures of vegetation patches. With precipitation, the grassland emissivity changes less, while the emissivity of wet bare soil is about 0.05 higher than that of dry bare soil [40]. Thus, under continuous precipitation, the top layer of bare soil has a higher water content and is in a moist state, resulting in a lower ST.
With less precipitation in 2019, the ST of an OV is not significantly different from those of bare patches, and the changes are consistent with air temperature (Figure 5). Nevertheless, the absolute value of the STG in an OV is the smallest, which is conducive to the stability of vegetation; instead, IV still has the highest ST, with a large absolute value of STG (Figure 5 and Figure 7). Compared with the OV, the IV has lower vegetation coverage and a weaker shading effect on the underlying surface soil, which makes it difficult to block more solar radiation, leading to the accumulation of heat in the surface soil [40]. Additionally, surface wind is an essential force for surficial processes [36,41]. The QTP is windy all year round and the annual mean wind speed exceeds 2 m s−1 [42]. The IV is surrounded by low bare soil, lacking shelter and resulting in the acceleration of STG and evapotranspiration [18,35].
4.4. Implications of Alpine Meadow Patchiness on Grassland Degradation and Restoration
Grassland degradation is manifested in the decline of ecological attributes, such as grassland productivity, biodiversity, and water conservation capacity [43]. Improving or maintaining the water conservation function of grassland is a critical part of the restoration of degraded grassland [44,45]. Our research indicates that OV is the key patch type for grassland stability, while IV is the more sensitive patch type in the process of alpine meadow degradation. The lateral flow of soil moisture is generated by the difference in hydraulic conductivity and soil water potential [46]. IV absorbs soil water from surrounding bare patches and accelerates evapotranspiration through sustained higher ST, causing water loss and potentially accelerating alpine meadow degradation. Traditional restoration methods include self-recovery through natural succession, artificial grassland planting, no-tillage and reseeding, fertilization, and turf transplantation [47,48]. Therefore, we prefer to emphasize that more attention should be paid to restoring the plants in bare patches around an IV, for instance, laying mulch around the edge of an IV to reduce soil evaporation and improve soil fertility, followed by artificial planting or turf transplantation. A valuable understanding could be that increasing the connectivity between IV patches may be more beneficial for maintaining the eco-healthy development of alpine meadow than directly restoring bare soil vegetation.
5. Conclusions
Alpine meadow patchiness caused by permafrost degradation, rodent disturbance, and overgrazing is common on the QTP. Patches with various sizes and types intensify the spatial heterogeneous distribution of soil gravel content, root biomass, and hydraulic conductivity. These differences will cause the vertical exchange of energy and water fluxes among the atmosphere, ground surface, and underneath the soil, and may trigger or accelerate grassland degradation. However, there is a lack of direct observational evidence concerning the role of the size and type of patches on soil moisture and soil temperature, which are prerequisites for the growth of alpine meadow. Here, we evaluated the effects of patchiness on the critical factors of soil processes and discussed the implications of isolated vegetation patches on grassland degradation and restoration based on in situ sampling and auto-measurement data.
Based on the analysis of field observation data, our conclusions can be summarized in the following points: (1) original vegetation patches had high soil water storage and low soil temperatures and evapotranspiration, playing a critical role in maintaining the stability of the alpine meadow; (2) medium bare patches had the highest soil water storage in years with less precipitation; otherwise, the soil water storage decreased significantly, with values between those of large bare patches and small bare patches; (3) isolated vegetation patches absorbed soil moisture from surrounding bare patches for excessive evapotranspiration through constant higher soil temperatures, which might be an inducement for grassland degradation.
To conclude, although other soil parameters such as soil water potential data need to be supplemented to verify the lateral flow of soil moisture, our findings have guiding significance for grassland management. We suggest that increasing the connectivity of isolated vegetation patches through artificial seeding and preventing the transition of original vegetation to isolated vegetation patches is important for the stability and restoration of alpine meadow.
Author Contributions
Conceptualization, J.Z. and W.Z.; methodology, W.Z.; validation, S.Y.; formal analysis, W.Z. and S.Y.; investigation, W.Z. and Y.Q.; resources, Y.Q.; data curation, Y.Q.; writing—original draft preparation, W.Z.; writing—review and editing, J.Z. and S.Y.; visualization, W.Z.; supervision, J.Z.; project administration, W.Z.; funding acquisition, W.Z. and J.Z. All authors have read and agreed to the published version of the manuscript.
Funding
This research was funded by the National Natural Science Foundation of China (42301146), the University Natural Science Research Project of Anhui Province (2022AH051111 and 2023AH051617), and the Chuzhou University Research and Development Fund for the Talent Startup Project (2022qd005 and 2023qd01).
Data Availability Statement
The data presented in this study are available on request from the corresponding author due to privacy reasons.
Acknowledgments
We thank Yongjian Ding’s research team at the Northwest Institute of Eco-Environment and Resources, Chinese Academy of Sciences, for providing the meteorological dataset.
Conflicts of Interest
The authors declare no conflicts of interest.
Abbreviations
| QTP | Qinghai–Tibetan Plateau |
| OV | Original vegetation patch |
| IV | Isolated vegetation patch |
| LP | Large bare patch |
| MP | Medium bare patch |
| SP | Small bare patch |
| SWS | Soil water storage |
| ST | Soil temperature |
| STG | Soil temperature gradient |
| SWC | Soil water content |
References
- Xu, M.; Peng, F.; You, Q.; Guo, J.; Tian, X.; Liu, M.; Xue, X. Effects of warming and clipping on plant and soil properties of an alpine meadow in the Qinghai-Tibetan Plateau, China. J. Arid. Land. 2015, 7, 189–204. [Google Scholar] [CrossRef]
- Miehe, G.; Schleuss, P.; Seeber, E.; Babel, W.; Biermann, T.; Braendle, M.; Chen, F.; Coners, H.; Foken, T.; Gerken, T.; et al. The Kobresia pygmaea ecosystem of the Tibetan highlands-Origin, functioning and degradation of the world’s largest pastoral alpine ecosystem: Kobresia pastures of Tibet. Sci. Total. Environ. 2019, 648, 754–771. [Google Scholar] [CrossRef] [PubMed]
- Fu, B.; Ouyang, Z.; Shi, P.; Fan, J.; Wang, X.; Zheng, H.; Zhao, W.; Wu, F. Current condition and protection strategies of Qinghai-Tibet Plateau ecological security barrier. Bull. Chin. Acad. Sci. 2021, 36, 1298–1306. [Google Scholar]
- Xiao, Y.; Liu, M.; Miao, L.; Yang, C.; Wang, Q.; Wang, M. Plant diversity and ecosystem multifunctionality of different degraded grasslands in alpine meadows of Maqu. Ecol. Res. 2024, 39, 54–71. [Google Scholar] [CrossRef]
- Qin, Y.; Yi, S.; Ding, Y.; Zhang, W.; Qin, Y.; Chen, J.; Wang, Z. Effect of plateau pika disturbance and patchiness on ecosystem carbon emissions in alpine meadow in the northeastern part of Qinghai-Tibetan Plateau. Biogeosciences 2019, 16, 1097–1109. [Google Scholar] [CrossRef]
- Dong, S.; Shang, Z.; Gao, J.; Boone, R.B. Enhancing sustainability of grassland ecosystems through ecological restoration and grazing management in an era of climate change on Qinghai-Tibetan Plateau. Agric. Ecosyst. Environ. 2020, 287, 106684. [Google Scholar] [CrossRef]
- Li, G.; Li, X.; Chen, W.; Li, J.; Sun, H. Effects of degradation severity on the physical, chemical and mechanical properties of topsoil in alpine meadow on the Qinghai-Tibet Plateau, west China. Catena 2020, 187, 104370. [Google Scholar] [CrossRef]
- Liu, J.; Chen, J.; Qin, Q.; You, H.; Han, X.; Zhou, G. Patch pattern and ecological risk assessment of alpine grassland in the source region of the Yellow River. Remote Sens. 2020, 12, 3460. [Google Scholar] [CrossRef]
- Abalori, T.; Cao, W.; Weobong, C.; Sam, F.; Li, W.; Osei, R.; Wang, S. Effects of vegetation patchiness on ecosystem carbon and nitrogen storage in the alpine grassland of the Qilian Mountains. Front. Environ. Sci. 2022, 10, 879717. [Google Scholar] [CrossRef]
- Xi, S.; Hu, T.; Mou, X.; Kou, X.; Wang, X.; Yu, Y. Reduced plant species diversity and soil carbon and nitrogen contents driven by vegetation patchiness in alpine meadows. J. Veg. Sci. 2024, 35, e13238. [Google Scholar] [CrossRef]
- Liu, Y.; Wang, D.; Cui, Z.; Li, S.; Li, R.; Rodrigo-Comino, J.; López-Vicente, M.; Wu, G. Alpine meadow patches unevenly regulate runoff and sediment yield generation on the Qinghai-Tibetan Plateau. J. Hydrol. 2023, 623, 129848. [Google Scholar] [CrossRef]
- Jiang, Z.; Li, X.; Wu, H.; Zhang, S.; Zhao, G.; Wei, J. Linking spatial distributions of the patchy grass Achnatherum splendens with dynamics of soil water and salt using electromagnetic induction. Catena 2017, 149, 261–272. [Google Scholar] [CrossRef]
- Wen, L.; Dong, S.; Zhu, L.; Li, X.; Shi, J.; Wang, Y.; Ma, Y. The construction of grassland degradation index for alpine meadow in Qinghai-Tibetan Plateau. Procedia Environ. Sci. 2010, 2, 1966–1969. [Google Scholar] [CrossRef]
- Lin, H.; Wang, Z.; Shang, Z. Features on fractal dimension of barren patch and mouse hole among different degenerated succession stages on alpine meadow in the source region of the Yangtze and Yellow River, Qinghai-Tibetan Plateau, China. Acta. Agrestia Sin. 2010, 18, 477–484. [Google Scholar]
- Chen, Y.; Nan, Z.; Zhao, S. Bare patches created by plateau pikas contribute to warming permafrost on the Tibet Plateau. Geophys. Res. Lett. 2024, 51, e2024GL108976. [Google Scholar] [CrossRef]
- Shang, Z.; Dong, Q.; Shi, J.; Zhou, H.; Dong, S.; Shao, X.; Li, S.; Wang, Y.; Ma, Y.; Ding, L.; et al. Research progress in recent ten years of ecological restoration for ‘black soil land’ degraded grassland on Tibetan Plateau-Concurrently discuss of ecological restoration in Sanjiangyuan region. Acta. Agrestia Sin. 2018, 26, 1–21. [Google Scholar]
- Qin, Y.; Yi, S.; Chen, J.; Ren, S.; Ding, Y. Effects of gravel on soil and vegetation properties of alpine grassland on the Qinghai-Tibetan plateau. Ecol. Eng. 2015, 74, 351–355. [Google Scholar] [CrossRef]
- Zhang, W.; Yi, S.; Qin, Y.; Sun, Y.; Shangguan, D.; Meng, B.; Li, M.; Zhang, J. Effects of patchiness on surface soil moisture of alpine meadow on the northeastern Qinghai-Tibetan Plateau: Implications for grassland restoration. Remote Sens. 2020, 12, 4121. [Google Scholar] [CrossRef]
- Zhang, W.; Yi, S.; Chen, J.; Qin, Y.; Chang, L.; Sun, Y.; Shangguan, D. Characteristics and controlling factors of alpine grassland vegetation patch patterns on the central Qinghai-Tibetan Plateau. Ecol. Indic. 2021, 125, 107570. [Google Scholar] [CrossRef]
- Zhou, T.; Zhang, Y.; Gao, H.; Zhang, T.; Ma, Y. Relationship between vegetation index and ground surface temperature on the Tibetan Plateau alpine grassland. J. Glaciol. Geocryol. 2015, 37, 58–59. [Google Scholar]
- Bao, G.; Wang, Y.; Song, M.; Wang, H.; Yin, Y.; Liu, S.; Yang, Y.; Yang, M. Effects of Stellera chamaejasme patches on the surrounding grassland community and on soil physical-chemical properties in degraded grasslands susceptible to S. chamaejasme invasion. Acta. Pratacult. Sin. 2019, 28, 51–61. [Google Scholar]
- Wu, J.; Zhang, S.; Wu, H.; Liu, S.; Qin, Y.; Qin, J. Actual evapotranspiration in Suli alpine meadow in northeastern edge of Qinghai-Tibet Plateau, China. Adv. Meteorol. 2015, 2015, 593649. [Google Scholar] [CrossRef]
- Yi, S.; Zhou, Z.; Ren, S.; Xu, M.; Qin, Y.; Chen, S.; Ye, B. Effects of permafrost degradation on alpine grassland in a semi-arid basin on the Qinghai–Tibetan Plateau. Environ. Res. Lett. 2011, 6, 045403. [Google Scholar] [CrossRef]
- HJ613-2011; Soil-Determination of Dry Matter and Water Content-Gravimetric Method, National Environmental Protection Standard of the People’s Republic of China. China Environmental Science Press: Beijing, China, 2011.
- NY/T 1121.4-2006; Method for Determination of Soil Bulk Density, Agricultural Industry Standard of the People’s Republic of China. Ministry of Agriculture of the People’s Republic of China: Beijing, China, 2006.
- Hou, Y.; Cao, S.; Cao, G.; Wang, Z.; Wang, Y.; Kang, L. Relationship between hydrogen and oxygen stable isotope compositions of soil water and soil water storage in Shaliuhe River Basin of Qinghai Lake. J. Desert Res. 2022, 42, 153–164. [Google Scholar]
- Yuan, J.; Cao, G.; Cao, S.; Yuan, Y.; Zhang, Q. Differences in soil water storage capacity of typical ecosystems under microtopography in southern slope of Qilian Mountains. Res. Soil. Water Conserv. 2024, 31, 159–167. [Google Scholar]
- Li, M.; Zhang, X.; He, Y.; Niu, B.; Wu, J. Assessment of the vulnerability of alpine grasslands on the Qinghai-Tibetan Plateau. Peer J. 2020, 8, e8513. [Google Scholar] [CrossRef]
- Ma, Y.; Liu, Y.; López-Vicente, M.; Wu, G. Divergent shift of normal alpine meadow towards shrub and degraded meadows reduces soil water retention and storage capacity. J. Hydrol. 2023, 625, 130109. [Google Scholar] [CrossRef]
- Dai, L.; Fu, R.; Guo, X.; Du, Y.; Hu, Z.; Cao, G. Alpine shrub had a stronger soil water retention capacity than the alpine meadow on the northeastern Qinghai-Tibetan Plateau. Ecol. Indic. 2021, 133, 108362. [Google Scholar] [CrossRef]
- Chen, J.; Yi, S.; Qin, Y. The contribution of plateau pika disturbance and erosion on patchy alpine grassland soil on the Qinghai-Tibetan Plateau: Implications for grassland restoration. Geoderma 2017, 297, 1–9. [Google Scholar] [CrossRef]
- Rossi, M.J.; Ares, J.O. Overland flow from plant patches: Coupled effects of preferential infiltration, surface roughness and depression storage at the semiarid Patagonian Monte. J. Hydrol. 2016, 533, 603–614. [Google Scholar] [CrossRef]
- Li, K.; Gao, Y.; Chen, F.; Xu, J.; Jiang, Y.; Xiao, L.; Li, R.; Pan, Y. Simulation of impact of roots on soil moisture and surface fluxes over central Qinghai-Xizang. Plateau Meteor. 2015, 34, 642–652. [Google Scholar]
- Di Prima, S.; Marrosu, R.; Lassabatere, L.; Angulo-Jaramillo, R.; Pirastru, M. In situ characterization of preferential flow by combining plot- and point-scale infiltration experiments on a hillslope. J. Hydrol. 2018, 563, 633–642. [Google Scholar] [CrossRef]
- Jiang, X.; Zhu, X.; Yuan, Z.; Li, X.; Zakari, S. Lateral flow between bare and vegetation patches induces the degradation of alpine meadow in Qinghai-Tibetan Plateau. Sci. Total Environ. 2021, 751, 142338. [Google Scholar] [CrossRef]
- Liuzzo, L.; Viola, F.; Noto, L. Wind speed and temperature trends impacts on reference evapotranspiration in Southern Italy. Theor. Appl. Climatol. 2016, 123, 43–62. [Google Scholar] [CrossRef]
- Yi, S.; Wang, X.; Qin, Y.; Xiang, B.; Ding, Y. Responses of alpine grassland on Qinghai–Tibetan plateau to climate warming and permafrost degradation: A modeling perspective. Environ. Res. Lett. 2014, 9, 074014. [Google Scholar] [CrossRef]
- Heijmans, M.; Magnússon, R.; Lara, M.; Frost, G.; Myers-Smith, I.; Huissteden, J.; Jorgenson, M.; Fedorov, A.; Epstein, H.; Lawrence, D. Tundra vegetation change and impacts on permafrost. Nat. Rev. Earth Environ. 2022, 3, 68–84. [Google Scholar] [CrossRef]
- Zhang, H.; Fan, J.; Gao, D.; Liu, Y.; Du, H. Effect of decreasing the interception of solar illuminance by vegetation on ground temperature in degraded grasslands. Sustainability 2022, 14, 4488. [Google Scholar] [CrossRef]
- Zhang, W.; Yi, S.; Qin, Y.; Shangguan, D.; Qin, Y. Analysis of features and influencing factors of alpine meadow surface temperature based on UAV thermal thermography. Acta. Pratacult. Sin. 2021, 3, 15–27. [Google Scholar]
- Rayner, D.P. Wind run changes are the dominant factor affecting pan evaporation trends in Australia. J. Clim. 2007, 20, 3379–3394. [Google Scholar] [CrossRef]
- Yang, K.; Guo, X.; Wu, B. Recent trends in surface sensible heat flux on the Tibetan Plateau. Sci. China Earth Sci. 2011, 54, 19–28. [Google Scholar] [CrossRef]
- He, J.; Liu, Z.; Yao, T.; Sun, S.; Lv, Z.; Hu, X.; Cao, G.; Wu, X.; Li, L.; Bu, H.; et al. Analysis of the main constraints and restoration techniques of degraded grassland on the Tibetan Plateau. Sci. Technol. Rev. 2020, 38, 66–80. [Google Scholar]
- Ganjurjav, H.; Hu, G.; Zhang, Y.; Gornish, E.S.; Yu, T.; Gao, Q. Warming tends to decrease ecosystem carbon and water use efficiency in dissimilar ways in an alpine meadow and a cultivated grassland in the Tibetan Platea. Agric. For. Meteorol. 2022, 323, 109079. [Google Scholar] [CrossRef]
- Zhu, J.; Shang, Z.; Jiang, S.; Shi, Y.; Feng, Q.; Zhao, X.; Xin, X.; Yan, Y.; Su, Y.; He, J. Key Scientific Questions of Grassland Protection, Restoration and Function Improvement. Fundam. Res. 2024, 38, 658–667. [Google Scholar] [CrossRef]
- Yan, G.; Li, Z.; Galindo Torres, S.A.; Scheuermann, A.; Li, L. Transient two-phase flow in porous media: A literature review and engineering application in geotechnics. Geotechnics 2022, 2, 32–90. [Google Scholar] [CrossRef]
- He, J.; Bu, H.; Hu, X.; Feng, Y.; Li, S.; Zhu, J.; Liu, G.; Wang, Y.; Nan, Z. Close-to-nature restoration of degraded alpine grasslands: Theoretical basis and technical approach. Chin. Sci. Bull. 2020, 65, 3898–3908. [Google Scholar] [CrossRef]
- Buisson, E.; Archibare, S.; Fidelis, A.; Suding, K. Ancient grasslands guide ambitious goals in grassland restoration. Science 2022, 377, 594–598. [Google Scholar] [CrossRef]


Disclaimer/Publisher’s Note: The statements, opinions and data contained in all publications are solely those of the individual author(s) and contributor(s) and not of MDPI and/or the editor(s). MDPI and/or the editor(s) disclaim responsibility for any injury to people or property resulting from any ideas, methods, instructions or products referred to in the content. |
© 2024 by the authors. Licensee MDPI, Basel, Switzerland. This article is an open access article distributed under the terms and conditions of the Creative Commons Attribution (CC BY) license (https://creativecommons.org/licenses/by/4.0/).