Article

Effects of Long-Term Fenced Enclosure on Soil Physicochemical Properties and Infiltration Ability in Grasslands of Yunwu Mountain, China

1
College of Grassland Agriculture, Northwest A&F University, Xianyang 712100, China
2
Institute of Soil and Water Conservation, Northwest A&F University, Xianyang 712100, China
*
Authors to whom correspondence should be addressed.
Land 2024, 13(10), 1558; https://doi.org/10.3390/land13101558
Submission received: 15 August 2024 / Revised: 23 September 2024 / Accepted: 23 September 2024 / Published: 25 September 2024

Abstract

:
Fenced enclosures, a proven strategy for restoring degraded grassland, have been widely implemented. However, recent climate trends of warming and drying, accompanied by increased extreme rainfall, have heightened soil erosion risks. It is crucial to assess the long-term effectiveness of fenced enclosures on grassland restoration and their impact on soil physicochemical properties and water infiltration capacity. This study investigated the effects of enclosure duration on soil organic matter, aggregate composition and stability, and infiltration capacity in Yunwu Mountain Grassland Nature Reserve, comparing grasslands with enclosure durations of 2, 14, 30, and 39 years. Results showed that grasslands enclosed for 14, 30, and 39 years had infiltration rates increased by 20.66%, 152.03%, and 61.19%, respectively, compared to those enclosed for only 2 years. After 30 years of enclosure, soil quality reached its optimum, with the highest root biomass, soil organic matter, aggregate stability, and a notably superior infiltration rate. The findings suggest that long-term fenced enclosures facilitate grassland vegetation restoration and enhance soil infiltration capacity, with the most significant improvement observed at the 30-year enclosure milestone, followed by a gradual decline in this effect.

1. Introduction

Grasslands are an important component of natural ecosystems and are among the most widely distributed types of vegetation [1]. As an ecological and productive complex, grasslands have been significantly impacted by human activities. Extensive grazing on grasslands has led to a reduction in plant cover and aboveground biomass [2,3], causing significant changes in plant community composition and structure and a decline in the regenerative capacity of the grasslands [4], ultimately leading to grassland degradation [5]. Additionally, trampling by livestock also causes soil compaction, reducing the infiltration capacity of grassland soils [6]. With the increasingly noticeable trend of warming and drying in recent years [7], the duration of droughts has increased, and extreme rainfall events have become more frequent, significantly contributing to soil erosion [8]. Therefore, it is crucial to maximize the infiltration capacity and erosion resistance of the soil [9].
Since 2004, a series of comprehensive ecological protection and construction projects have been implemented by the nation to improve the grassland ecological environment. Among these, the fenced enclosure is a grassland management strategy that uses mesh fences to exclude livestock, preventing grazing and trampling and allowing vegetation to recover naturally [4,10,11]. The implementation of fenced enclosures has facilitated the recovery of grassland vegetation, ultimately yielding a more abundant assortment of community types. With the prolongation of enclosure duration, the extent of vegetation coverage enlarges, and the vegetation and its underground root systems incrementally exert a beneficial impact on the soil, thereby contributing to an improvement in soil quality [1,12]. Recent research efforts are centered on investigating the efficacy of long-term fenced enclosures in restoring degraded grasslands and boosting soil organic carbon stocks. Li et al. [13] conducted an investigation on grassland enclosures of 5, 6, and 8 years, along with grazing lands, and it was observed that the enclosed grasslands experienced a marked increase in vegetation cover. Moreover, a significant augmentation in soil organic carbon levels was observed. By comparing soil data from grazed grasslands, grasslands enclosed for restoration for 15 years, and grasslands enclosed for restoration for 30 years, Zhang et al. [1] arrived at similar conclusions. The study by Wu et al. [10] on the Qinghai–Tibet Plateau revealed that implementing long-term enclosure measures can rehabilitate the soil’s carbon and nitrogen storage capacity in alpine meadows. Nonetheless, studies on the impact of long-term enclosure on soil structure and infiltration capacity in grasslands remain scarce.
A well-structured soil, being both developed and stable under the combined effects of water and external mechanical stress, is also considered the most desirable soil characteristic for maintaining environmental quality [14]. The process of vegetation restoration induces changes in soil structure as a result of vegetation growth, ultimately affecting soil infiltration capacity as well [15]. The soil infiltration capacity plays a crucial role in determining the quantity of rainfall that is converted into soil water, constituting one of the significant indicators for evaluating soil water retention and erosion resistance [16,17]. Due to the reduced infiltration capacity of degraded grassland, there is an increase in surface runoff during rainfall events, subsequently elevating the risk of soil erosion [9]. Fenced enclosures, recognized as a crucial measure for restoring degraded grassland [10], have demonstrated significant improvement in plant and soil recovery through numerous related studies [18]. Nonetheless, the continuous effect of long-term fenced enclosures on grassland restoration is worthy of further study. This study compares the soil property changes, specifically soil organic matter, soil aggregate composition and stability, and soil infiltration characteristics, across four grasslands with varying fenced enclosure periods (2 years, 14 years, 30 years, and 39 years). The primary goal is to enhance our understanding of the impacts of fenced enclosure measures of different durations on grassland soil and to elucidate the primary factors influencing soil infiltration capacity changes subsequent to grassland vegetation restoration.

2. Materials and Methods
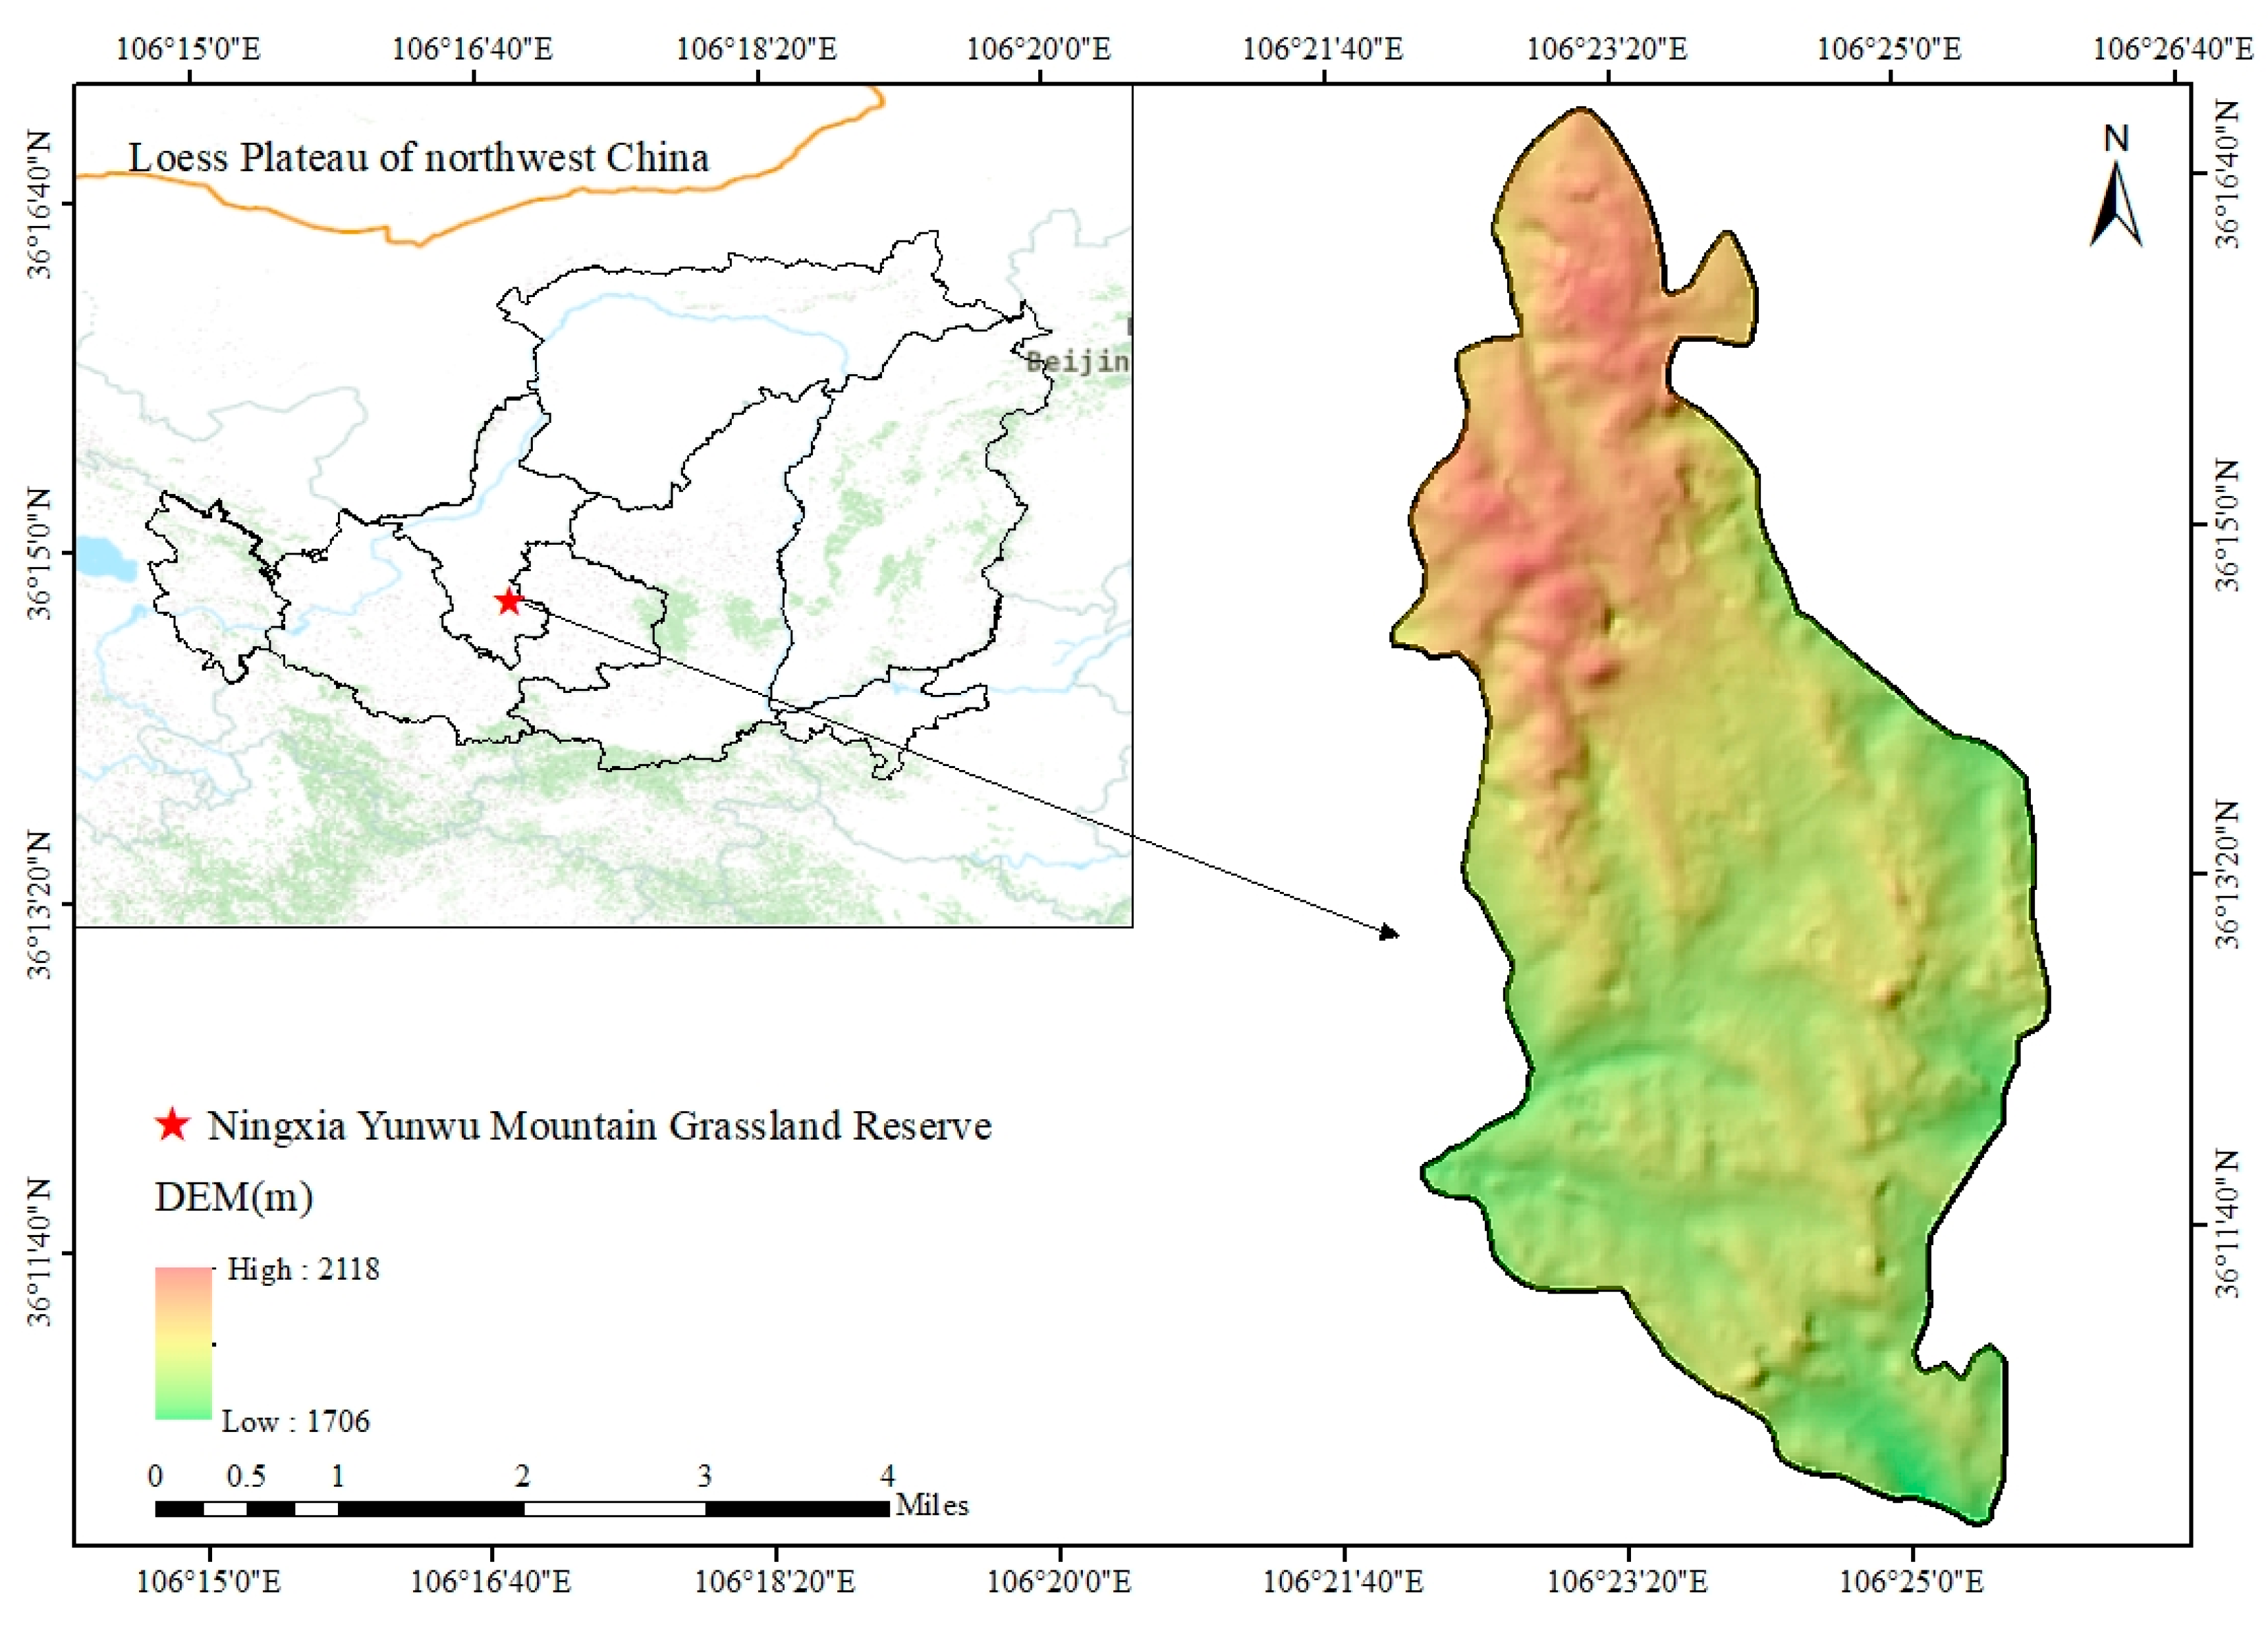
2.1. Study Sites

The experiment was conducted in September 2020 at the Yunwu Mountain Grassland Nature Reserve (106°24′–106°28′ E, 36°13′–36°19′ N), located in Guyuan City, Ningxia Hui Autonomous Region, in the northwestern part of the Loess Plateau (Figure 1). This region is characterized by a typical semi-arid climate, featuring drought, low and concentrated rainfall from June to September, large temperature variations, and long sunshine duration. The annual mean temperature is 5 °C in the region, with the hottest month being July, where temperatures range between 22 °C and 25 °C. The coldest month is January, with an average minimum temperature of approximately −14 °C. The annual average precipitation is 445 mm. The region, with an elevation ranging from 1700 to 2120 m, is a typical low mountain and hill region covered by loess. The soil types, according to the FAO classification system, include Calcaric Cambisols, Calcic Luvisols, and Chernozem [19]. These included plots enclosed for 2 years (G2a), 14 years (G14a), 30 years (G30a), and 39 years (G39a). Basic information about the sample plots is presented in Table 1.

2.2. Measurements of Soil Properties

Soil samples were collected in September 2020. In each sample plot, three sampling points were randomly selected. Given that shallow soil (0–10 cm) is typically subjected to direct influences from plant roots, microbial activities, and external environmental factors such as rainfall, it accumulates a relatively rich amount of organic matter. As soil depth increases, the intensity of these influencing factors gradually diminishes, resulting in corresponding changes in soil physicochemical properties. To further ascertain the impact of these enclosed grasslands on soil properties, soil samples were collected at three depth intervals: 0–10 cm, 10–20 cm, and 20–30 cm, to reflect the vertical variations in soil properties. Soil samples were collected in layers from the sampling points using a soil auger and a cutting ring with a volume of 100 cm3. The soil bulk density (BD) and initial water content were determined using the cutting ring method. Soil organic matter (SOM) was quantified by the K2CrO7 titration method, while soil textural composition was analyzed using a Master sizer 2000 laser particle analyzer. Root samples were collected using a large cutting ring with a diameter of 100 mm and a height of 63.7 mm. After passing through a 1 mm sieve and being washed, the root samples were placed into kraft paper bags. They were then dried in an oven at 60 °C until a constant weight was achieved, followed by the measurement of root biomass.

2.3. Measurements of Soil Aggregate Traits

Undisturbed soil samples were collected in layers at each sampling point using aluminum boxes (20 cm × 12.5 cm × 6 cm) and air-dried in a cool, shaded area. A 50 g sample of the air-dried soil was placed on the top of a 5 mm sieve, beneath which were sieves of 5–2 mm, 2–1 mm, 1–0.5 mm, and 0.25 mm, respectively. The soil sample and sieves were immersed in water and shaken vertically at a rate of 30 times per minute for 2 min. The mass of soil retained on each sieve was subsequently recorded, enabling the determination of the composition of water-stable aggregates across the particle size ranges of >5, 2–5, 1–2, 0.5–1, 0.25–0.5, and <0.25 mm. The following formula is employed to compute key indicators, including the mean weight diameter (MWD), geometric mean diameter (GMD), and fractal dimension (D), which serve to describe the stability characteristics of soil aggregates [20].
Below are the specific calculation formulas for each index presented:
m i = M i / M T × 100 %
MWD = i = 1 n ( R i ¯ m i ) / i = 1 n m i
GMD = e x p { i = 1 n m i ln R i }
M ( r < R i ¯ ) M T = ( R i ¯ R m a x ) 3 D  
lg [ M ( r < R i ¯ ) M T ] = ( 3 D ) lg ( R i ¯ R m a x )
where mi is the percentage of the mass of the ith-class aggregate; MT is the mass of the ith-class water-stable aggregate; R i ¯ is the average diameter of the ith-class aggregate; Rmax is the maximum particle size of water-stable aggregates; M(r < R i ¯ ) is the mass of aggregates with a particle size smaller than R i ¯ .

2.4. Measurements of Soil Water Infiltration Rate

Measurement of soil infiltration was executed through the utilization of a disc infiltration instrument. In the experiment, a flat sample plot was chosen, and the procedure was conducted sequentially as follows: before the commencement of each measurement, the water temperature was noted down, the pressure head was adjusted accordingly, and the water level in the storage pipe was recorded. Fine quartz sand was laid on the contacted surface. Throughout the infiltration process, data were recorded at intervals of 10 s for the initial 1.5 min, followed by recordings every 30 s from the 1.5 min mark until the 3 min mark, and subsequently, recordings were made every minute after the 3 min mark. The process was repeated five times. The experimental procedure followed Bodner et al. [21,22].
The calculation formula of stable infiltration rate (fs) is as follows:
f s = Δ hD 2 2 Δ tD 1 2 C T
C T = 0.7 + 0.03 T
where fs is the soil infiltration rate (mm/min) observed at a standard water temperature of 10 °C; D1 is the effective diameter (cm) of the base plate of the disc infiltration instrument, while D2 is the diameter (cm) of its storage tube; Δt is the time interval (min); Δh is the difference in readings (mm) of the storage tube within a specified time interval Δt; CT is the temperature correction coefficient; and T is the average water temperature (°C) during a particular time period.

2.5. Statistical Analysis

In this study, one-way ANOVA was used to compare soil bulk density, porosity, mechanical composition, organic matter, root biomass, and soil aggregate composition and characteristics among different treatments. The Duncan post-test was used to compare the initial infiltration rate, stable infiltration rate, and average infiltration rate of soil between different treatments. Pearson correlation analysis was used to evaluate the relationship between the soil water infiltration rate and soil bulk density, porosity, soil organic matter, and soil aggregate composition and characteristics. All statistical evaluations were performed in IBM SPSS Statistics 20.0 with significance assumptions of p ≤ 0.05 or p ≤ 0.01.

3. Results

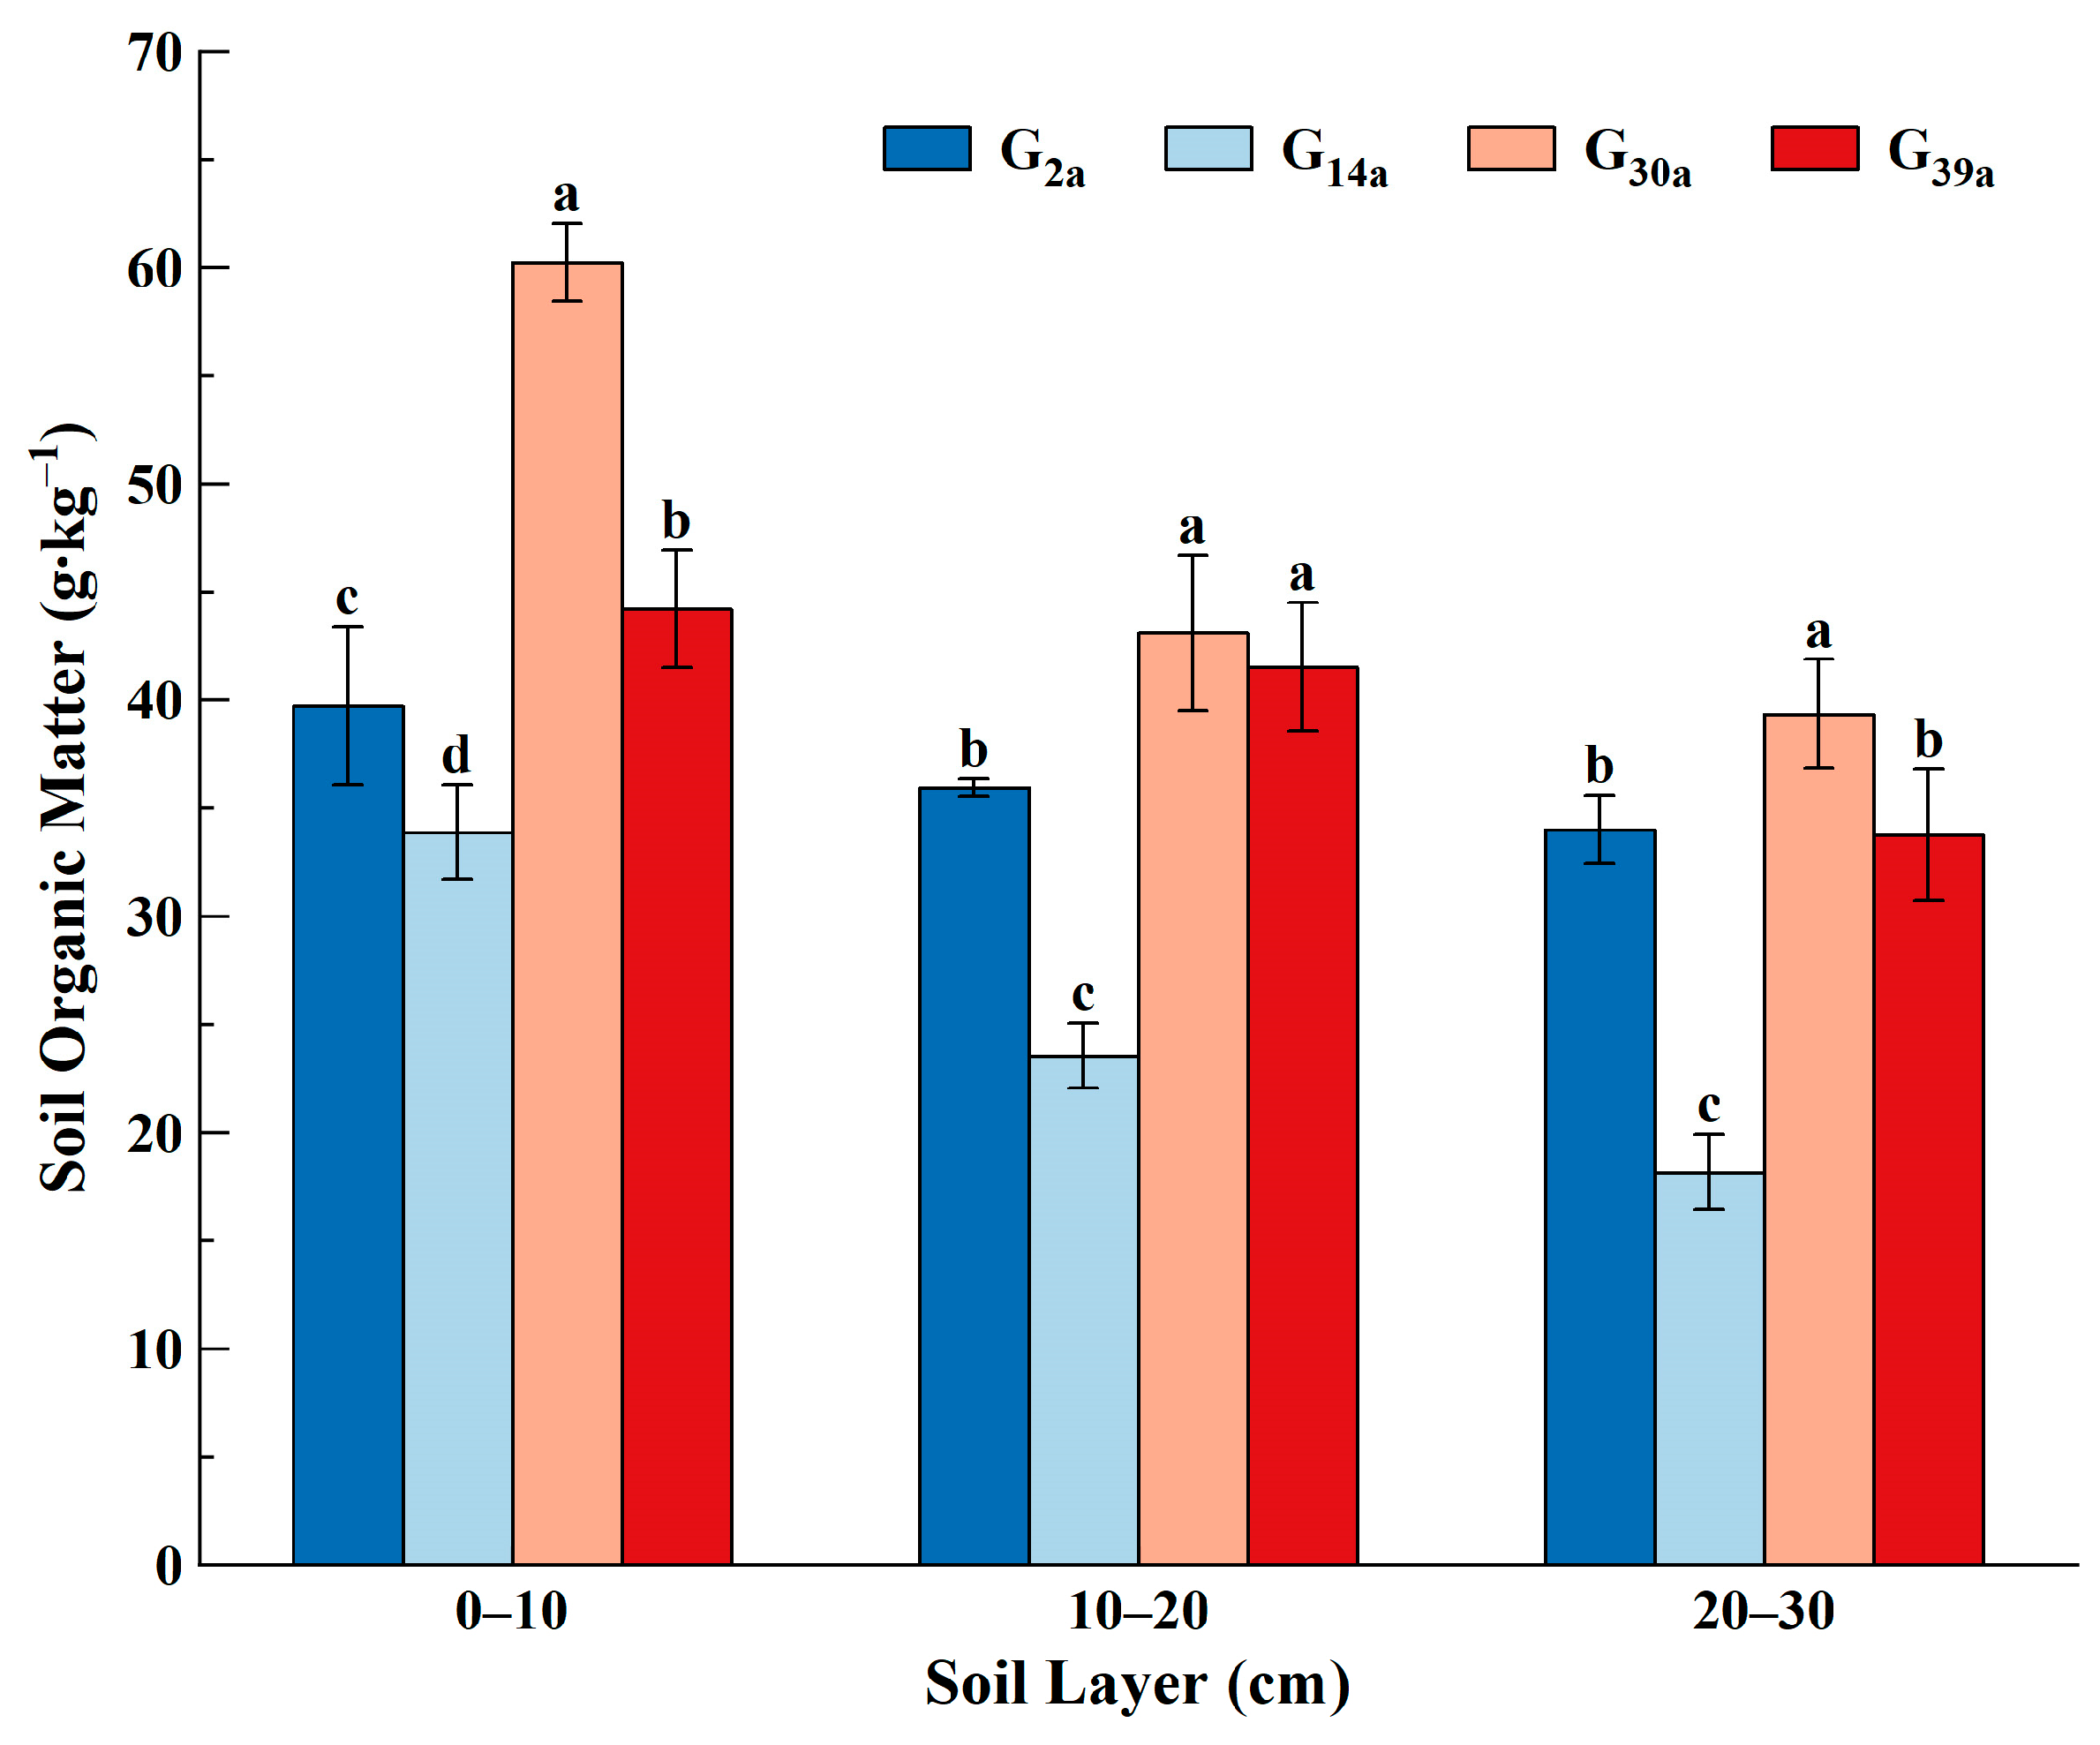
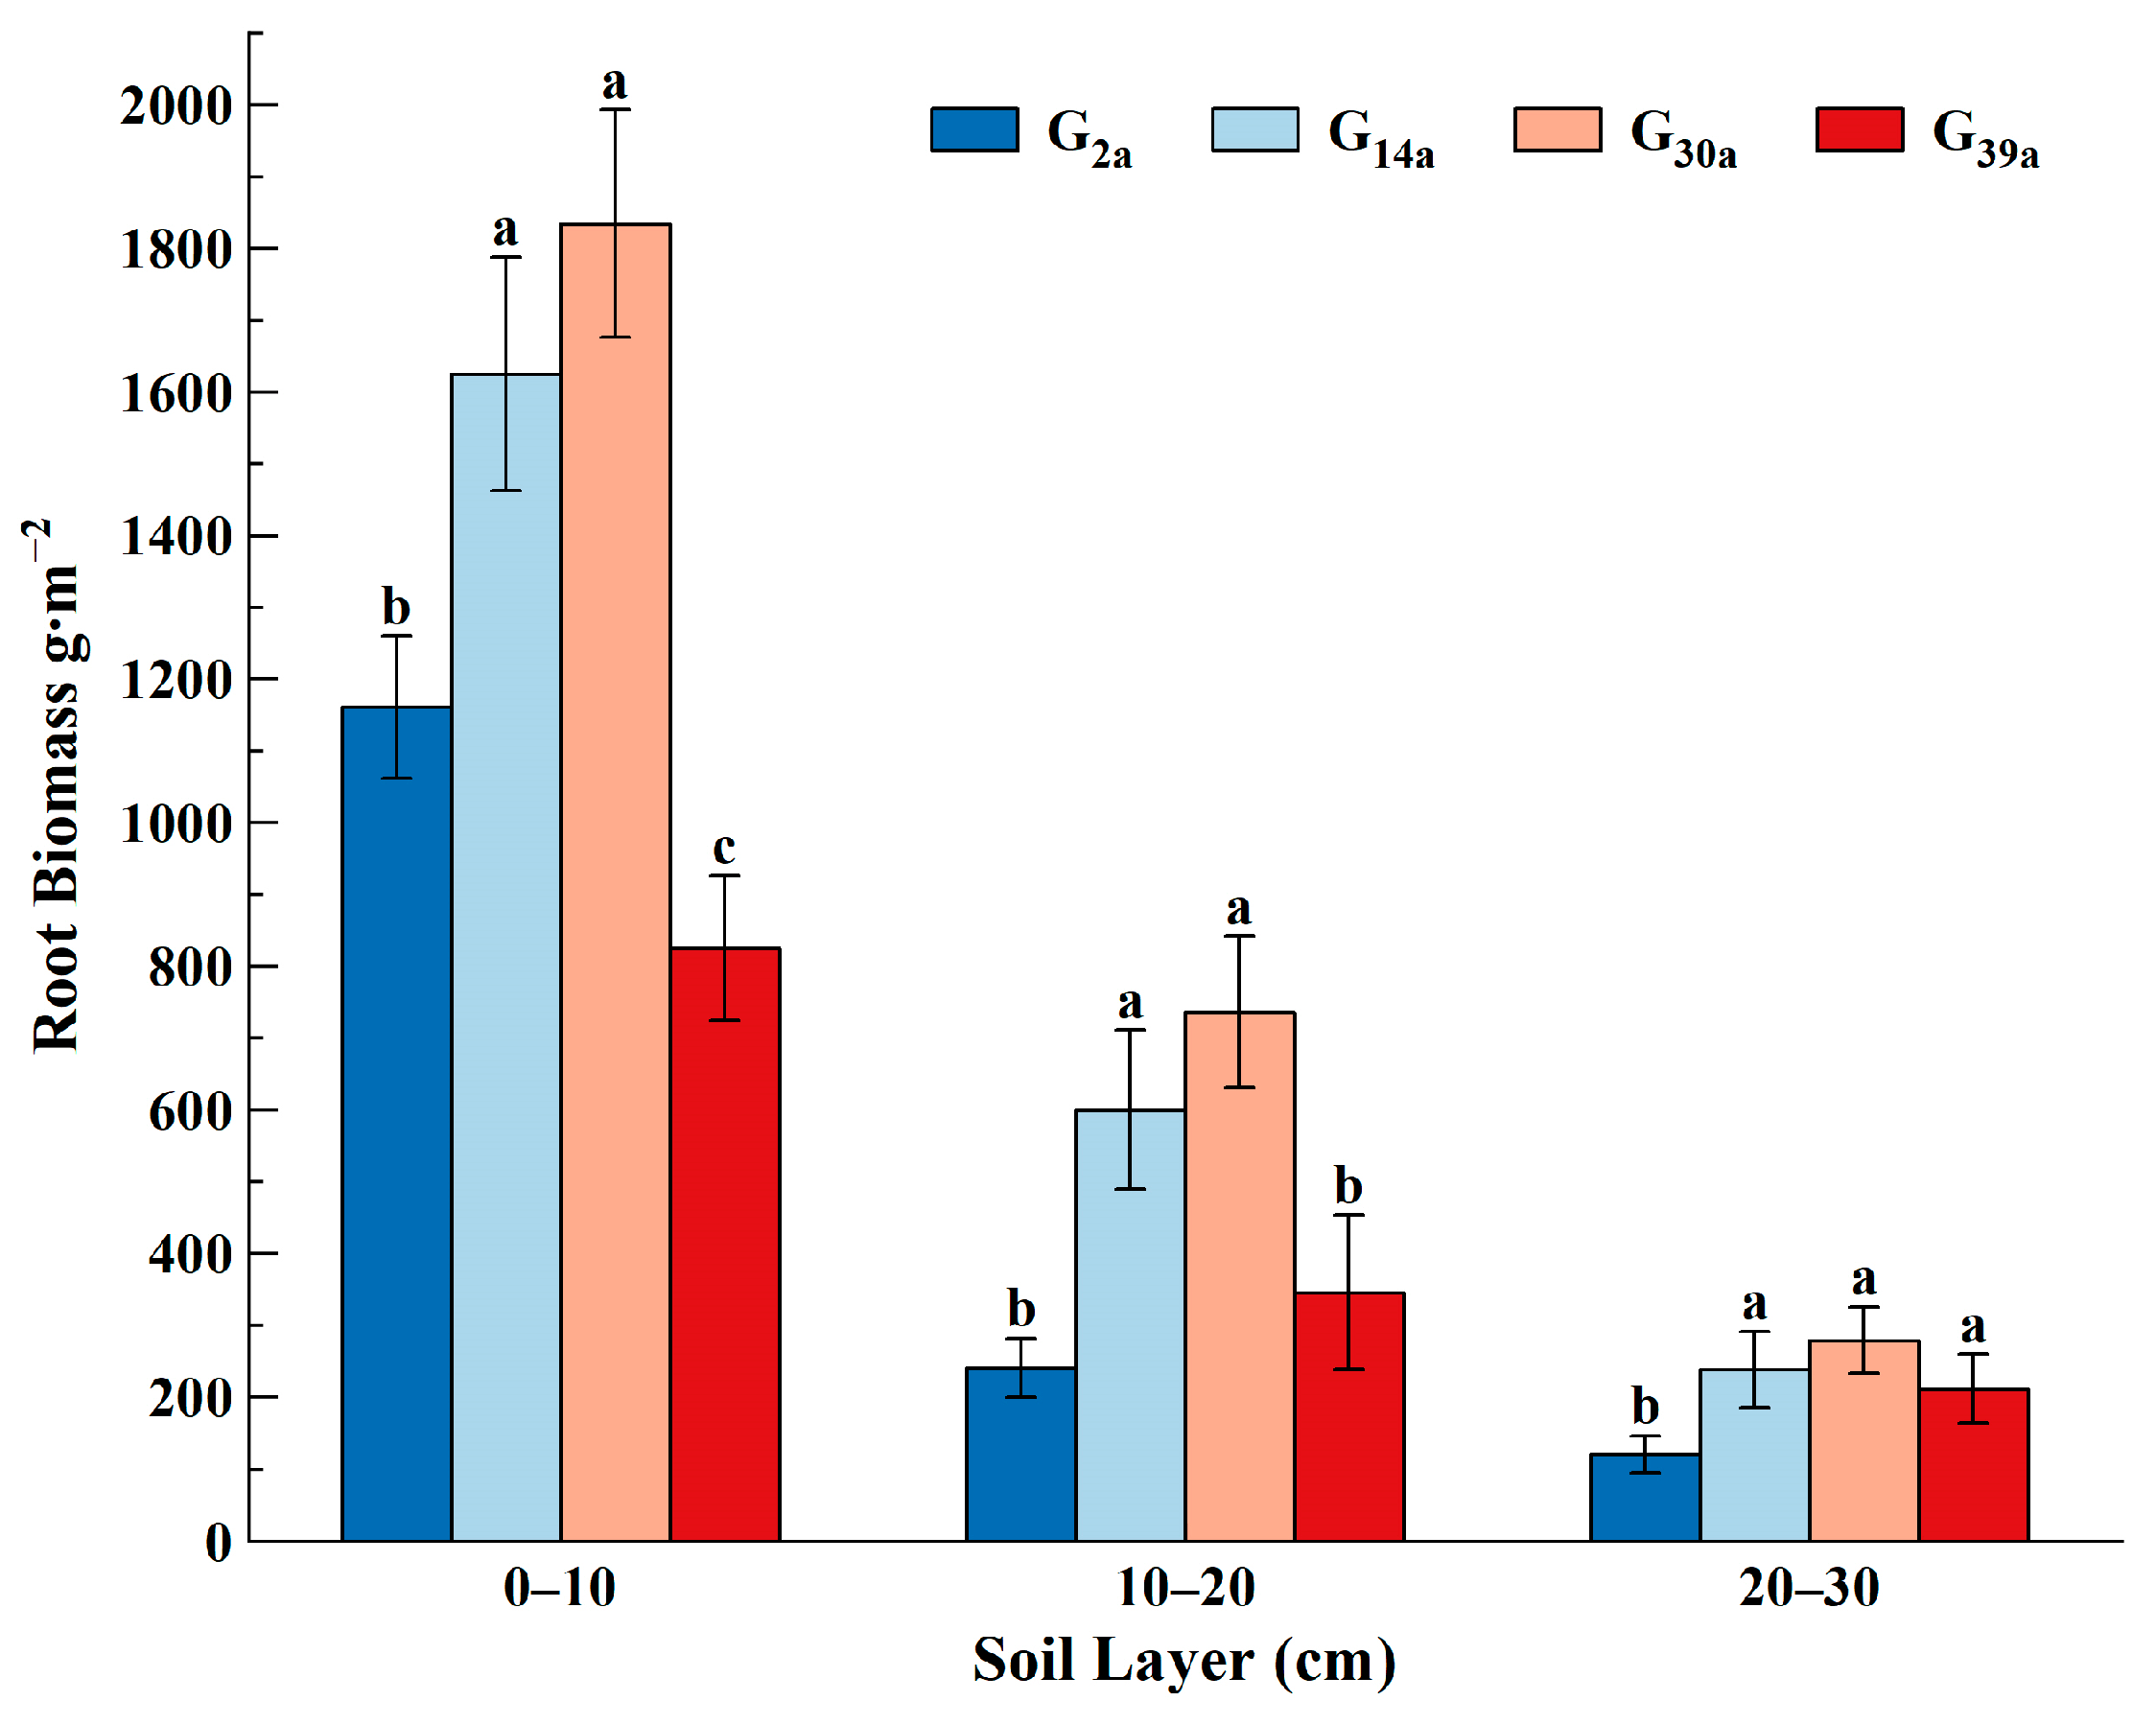
3.1. Soil Properties of Grassland with Different Enclosure Years

The soil bulk density measured in various sample plots lies within the range of 0.83 to 1.21 g·cm−3 (Table 2), with an evident trend of increment corresponding to soil depth. In the 0 to 10 cm soil layer, the order of bulk density is G2a > G14a > G30a > G39a. A notable decrease of 24.58% (p < 0.05) in soil bulk density was recorded as the closure duration increased from 14 to 30 years. Contrary to this trend, the total porosity and water content of the soil displayed a progressive decrease with increasing soil depth. In the 0–10 cm soil layer, the total porosity was measured at 66.34% and 68.82% after 30 and 39 years of grassland enclosure and restoration, respectively. These values were significantly higher than the porosity levels of 55.34% and 55.16% recorded in G2a and G14a (p < 0.05). Similarly, at this depth, soil water content exhibited an analogous trend, ascending with the prolongation of enclosure duration. However, in the soil below a depth of 10 cm, the soil water content exhibited the following trend: G30a > G39a > G2a > G14a (Table 2). A marked reduction in water content was evident in the grassland following 14 years of enclosure, particularly as soil depth increased. Specifically, at depths below 20 cm, the water content of G14a was notably lower than that recorded in the other sample plots (p < 0.05).
The textural composition of the soil in the enclosed grassland is illustrated in Table 2. The clay content (<0.002 mm) in the four grasslands with varying enclosed durations ranged between 11% and 19%. It is noteworthy that within the 20–30 cm soil layer, G30a showed significantly higher clay content compared to G39a and G2a (p < 0.05). The silt content (0.02~0.002 mm) ranged between 25% and 33%, with G2a exhibiting significantly lower silt content in comparison to the other sampling locations (p < 0.05). The sand content (>0.02 mm) was between 47% and 62%. Specifically, in the soil layer of 10–20 cm, the sand content followed the trend G2a > G14a > G39a > G30a. In the soil layers of 10–20 cm and 20–30 cm, the sand content of G2a was 62.56% and 61.88%, respectively, both of which were significantly higher than that of other grasslands with varying enclosure durations (p < 0.05).
Figure 2 shows the soil organic matter content in grasslands with different enclosure durations. The soil organic matter content in the grassland under 2 years of enclosure decreased from 39.71 g·kg−1 in the top 0–10 cm soil layer to 33.99 g·kg−1 in the deeper 20–30 cm soil layer. In contrast, the grassland with 30 years of enclosure showed values of 60.21 g·kg−1 and 39.34 g·kg−1 in the respective layers, indicating significant increases of 78% and 16% when compared to G2a (p < 0.05). At a depth of 20–30 cm, the organic matter content of G39a was lower than that of G2a. Nevertheless, in the soil layer exceeding 20 cm, the organic matter content of G39a was notably higher than that of G2a (p < 0.05). At a soil depth of 0–10 cm, the organic matter content followed the order G30a > G39a > G2a > G14a (p < 0.05). Across other soil depths, G14a consistently exhibited the lowest organic matter content (p < 0.05).
As illustrated in Figure 3, the root biomass of all sample plots exhibited an overall decreasing trend with increasing soil depth. In the soil depth ranging from 0 to 10 cm, the root biomass was determined to follow the order G30a > G14a > G2a > G39a, which was statistically significant (p < 0.05). Within the 0–10 cm soil layer, the root biomass of G30a was measured to be 1833.50 g·m−2, representing a 1.22-fold increase compared to that of G39a at the same depth (p < 0.05). However, no significant difference was observed between G30a and G14a. At a soil depth ranging from 20 to 30 cm, the root biomass of G30a experienced a reduction of 84.82%, while that of G39a decreased by 74.44%. At this particular soil depth, the root biomass of G2a was determined to be 119.96 g·m−2, indicating an 89.66% decrease in comparison to the 0–10 cm soil layer and being notably lower than the root biomass recorded for the other sample plots at this depth.

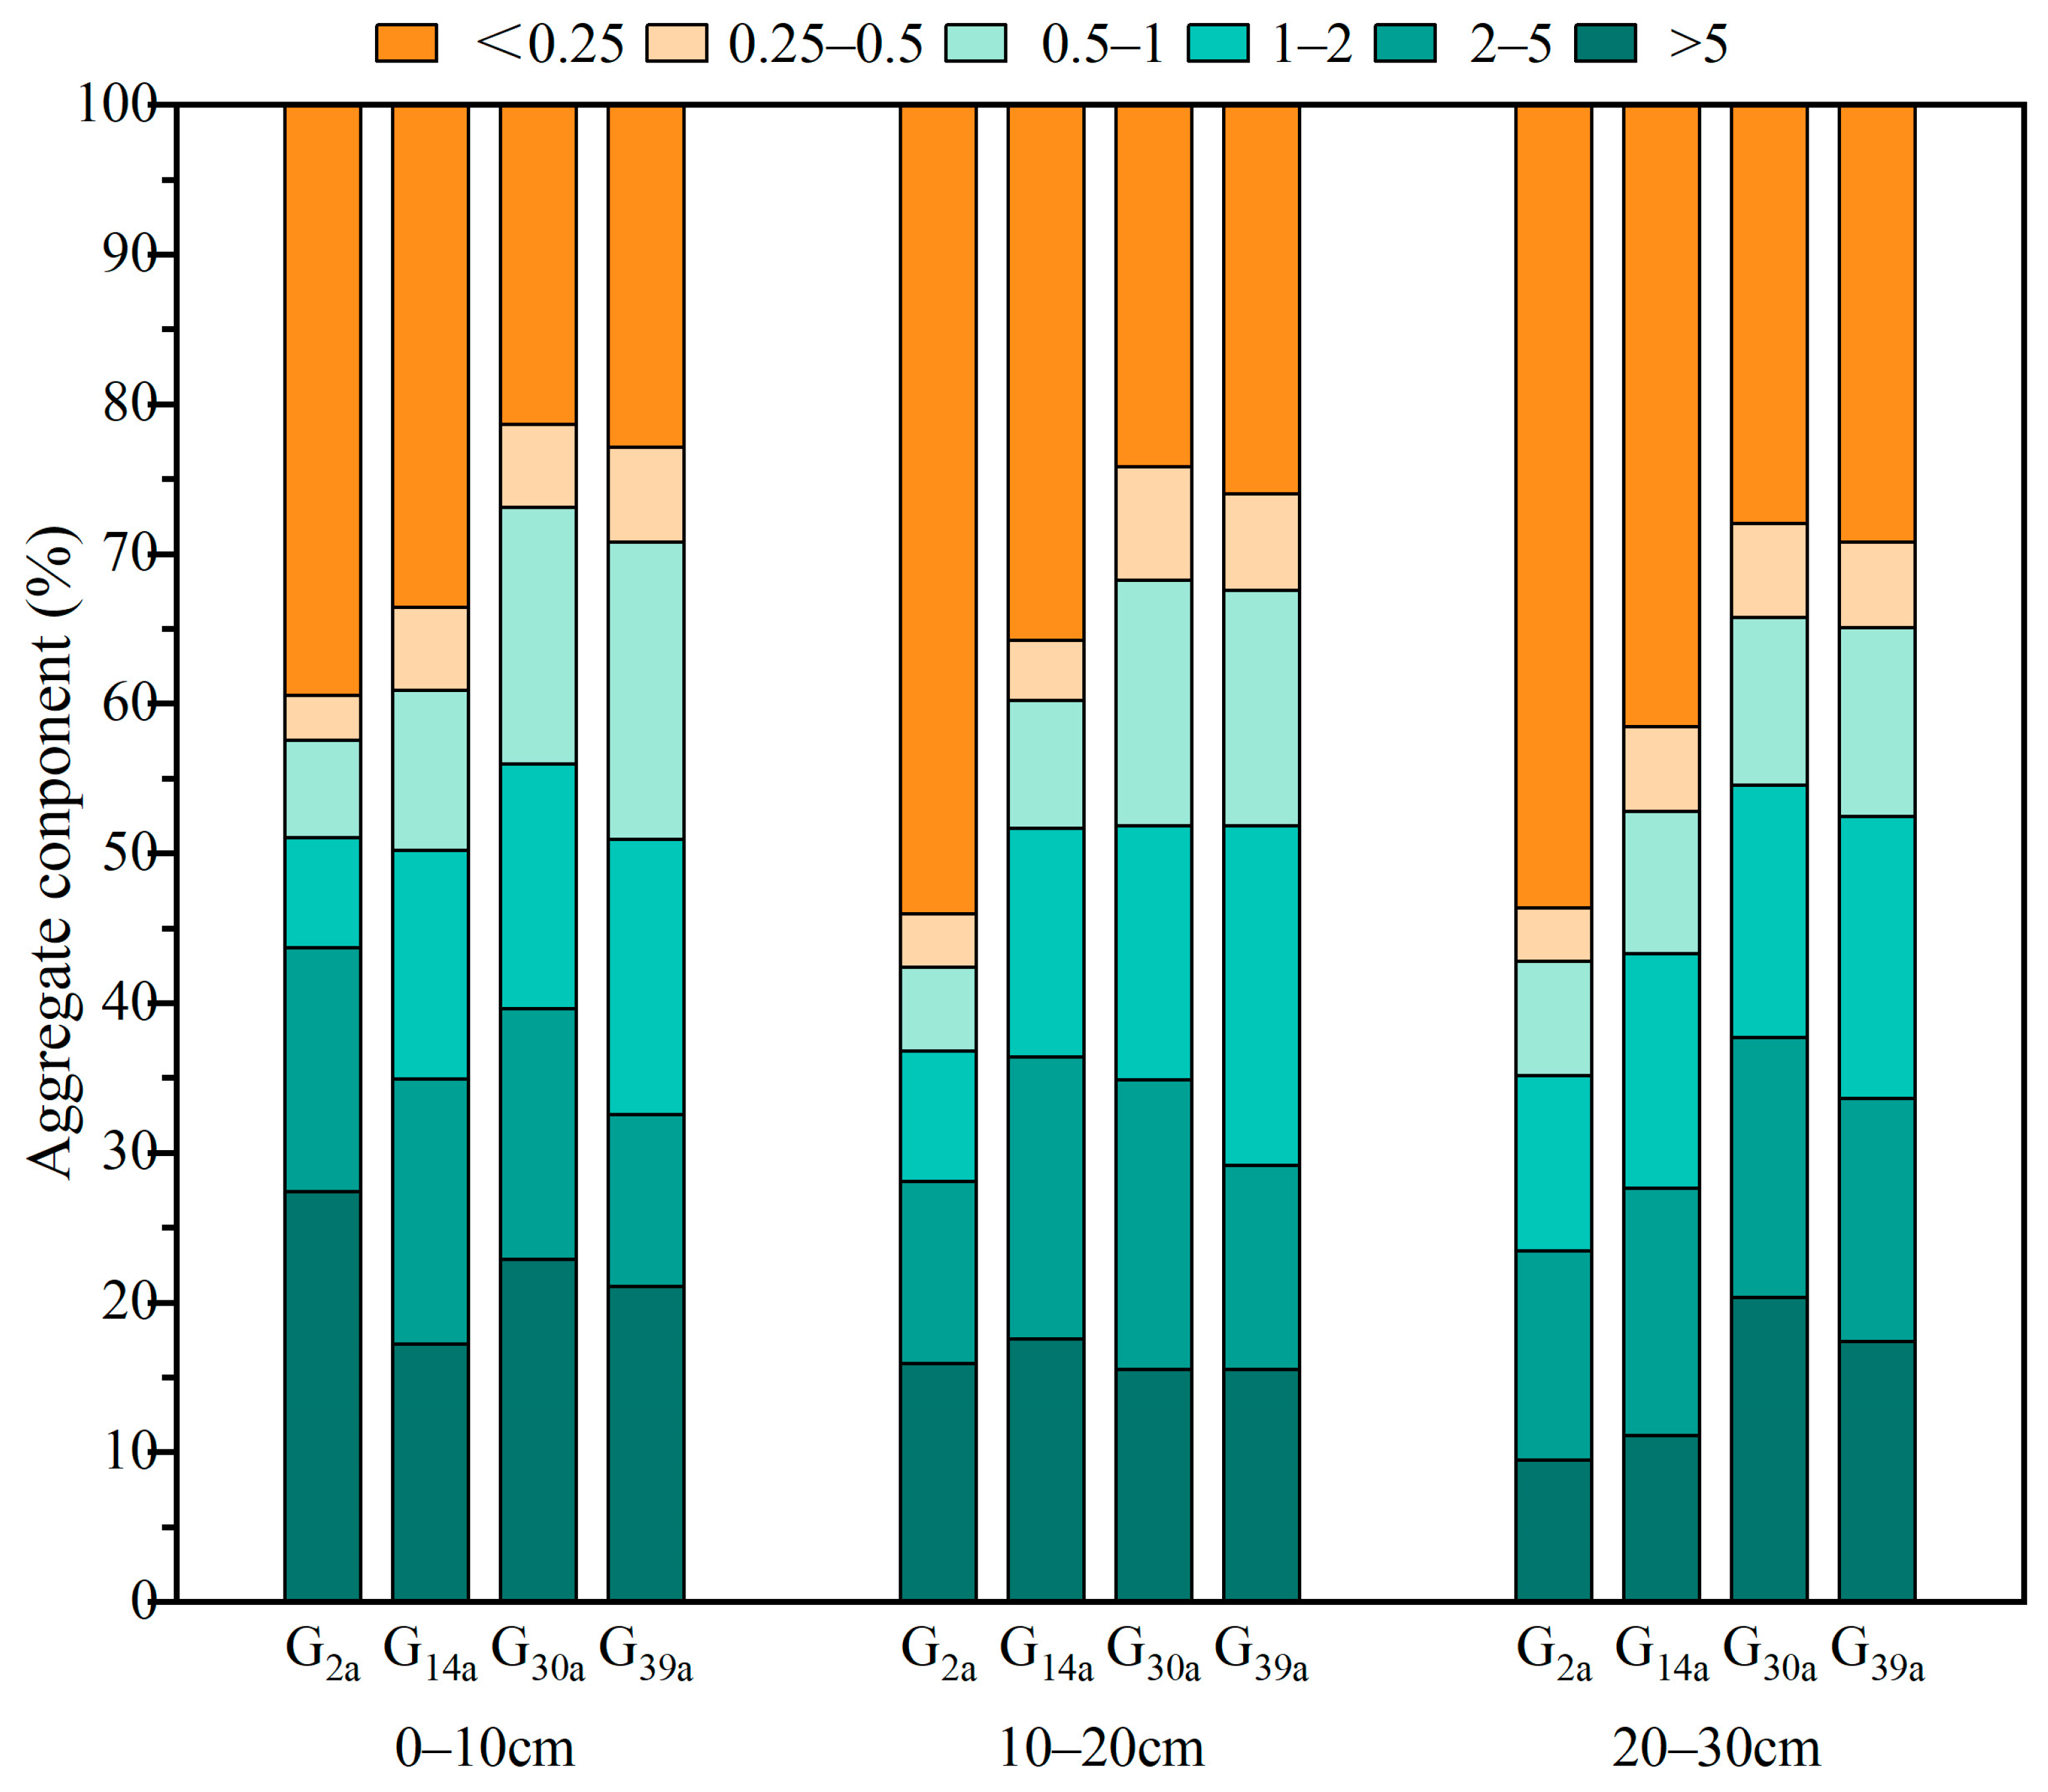
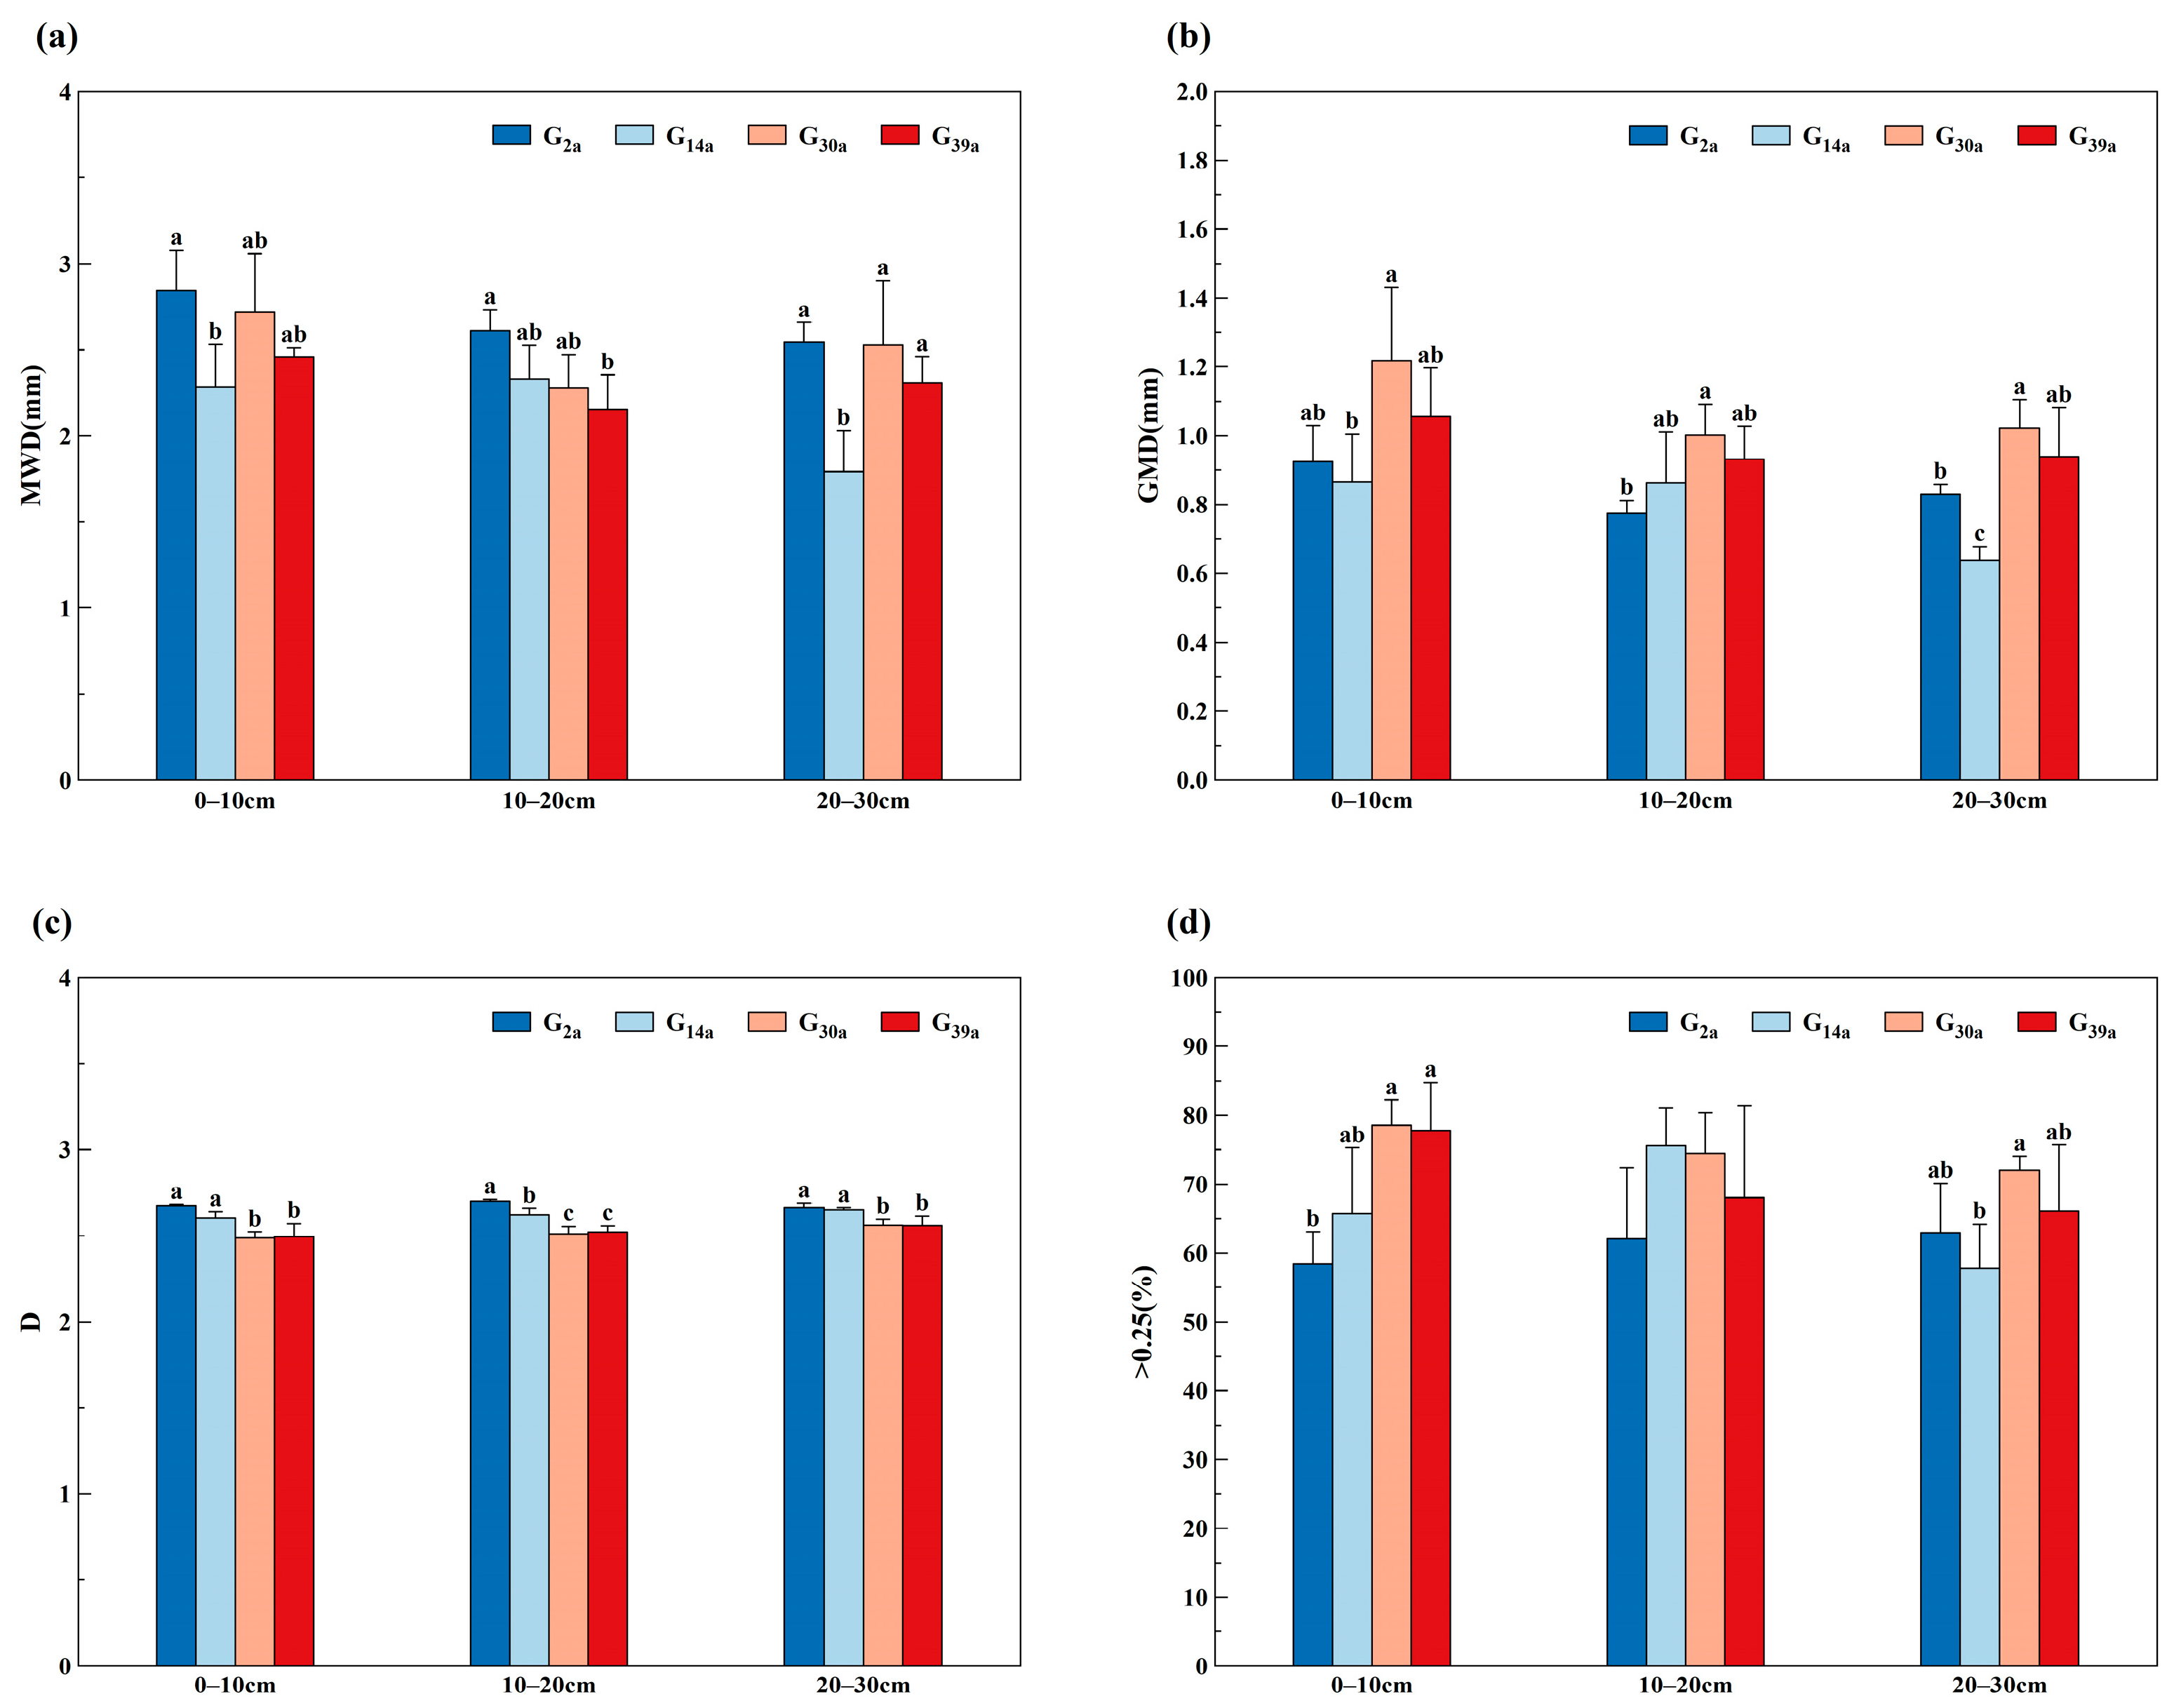
3.2. Characteristics of Soil Aggregates in Grasslands with Different Enclosure Years

Figure 4 illustrated the distribution of aggregates of different sizes in the soil of the enclosed grassland after it has been wet sieved. In the 0–30 cm soil layer, aggregates of less than 0.25 mm particle size dominated, with average proportions of 52.62% for G2a, 36.97% for G14a, 26.03% for G39a, and 24.97% for G30a. In the soil of G2a, the majority of macro-aggregates were found in the particle size fraction exceeding 5 mm, displaying a decreasing pattern with increasing soil depth. In the soil of G14a, macro-aggregates were primarily concentrated within the 1–2 mm and 2–5 mm particle size fractions, with aggregate contents spanning from 15.25% to 15.68% and 16.55% to 18.83%, respectively. Both G39a and G30a manifested high overall macro-aggregate contents. The aggregate contents exceeding 0.25 mm in the soil of G30a and G39a exhibited a significantly higher level compared to G14a and G2a across all soil layers (Figure 5a). Notably, in the 0–10 cm soil layer, the trend was as follows: G30a > G39a > G14a > G2a, with G30a and G39a being 1.55 and 1.54 times the content of G2a, respectively (p < 0.05). The mean weight diameter (MWD), geometric mean weight (GMW), and fractal dimension (D) are key metrics utilized to describe the stability of soil aggregates. According to Figure 5b, the MWD of soil aggregates in the 0–10 cm and 20–30 cm soil layers displayed a consistent trend of G30a > G39a > G14a > G2a, with G30a showing significantly higher values compared to G2a and G14a (p < 0.05). In contrast, within the 10–20 cm soil layer, the MWD of soil aggregates in G14a was significantly larger than that in G2a (p < 0.05). Figure 5c indicates the GMD of soil aggregates in grasslands subject to different enclosure durations. It is noteworthy that G2a consistently exhibits lower GMD values across all soil layers, while G14a shows significantly higher GMD values when compared to G2a (p < 0.05). Additionally, the D of soil aggregates in G2a and G14a is significantly higher than that in G30a and G39a (p < 0.05), with this pattern remaining consistent across different soil layers (Figure 5d).

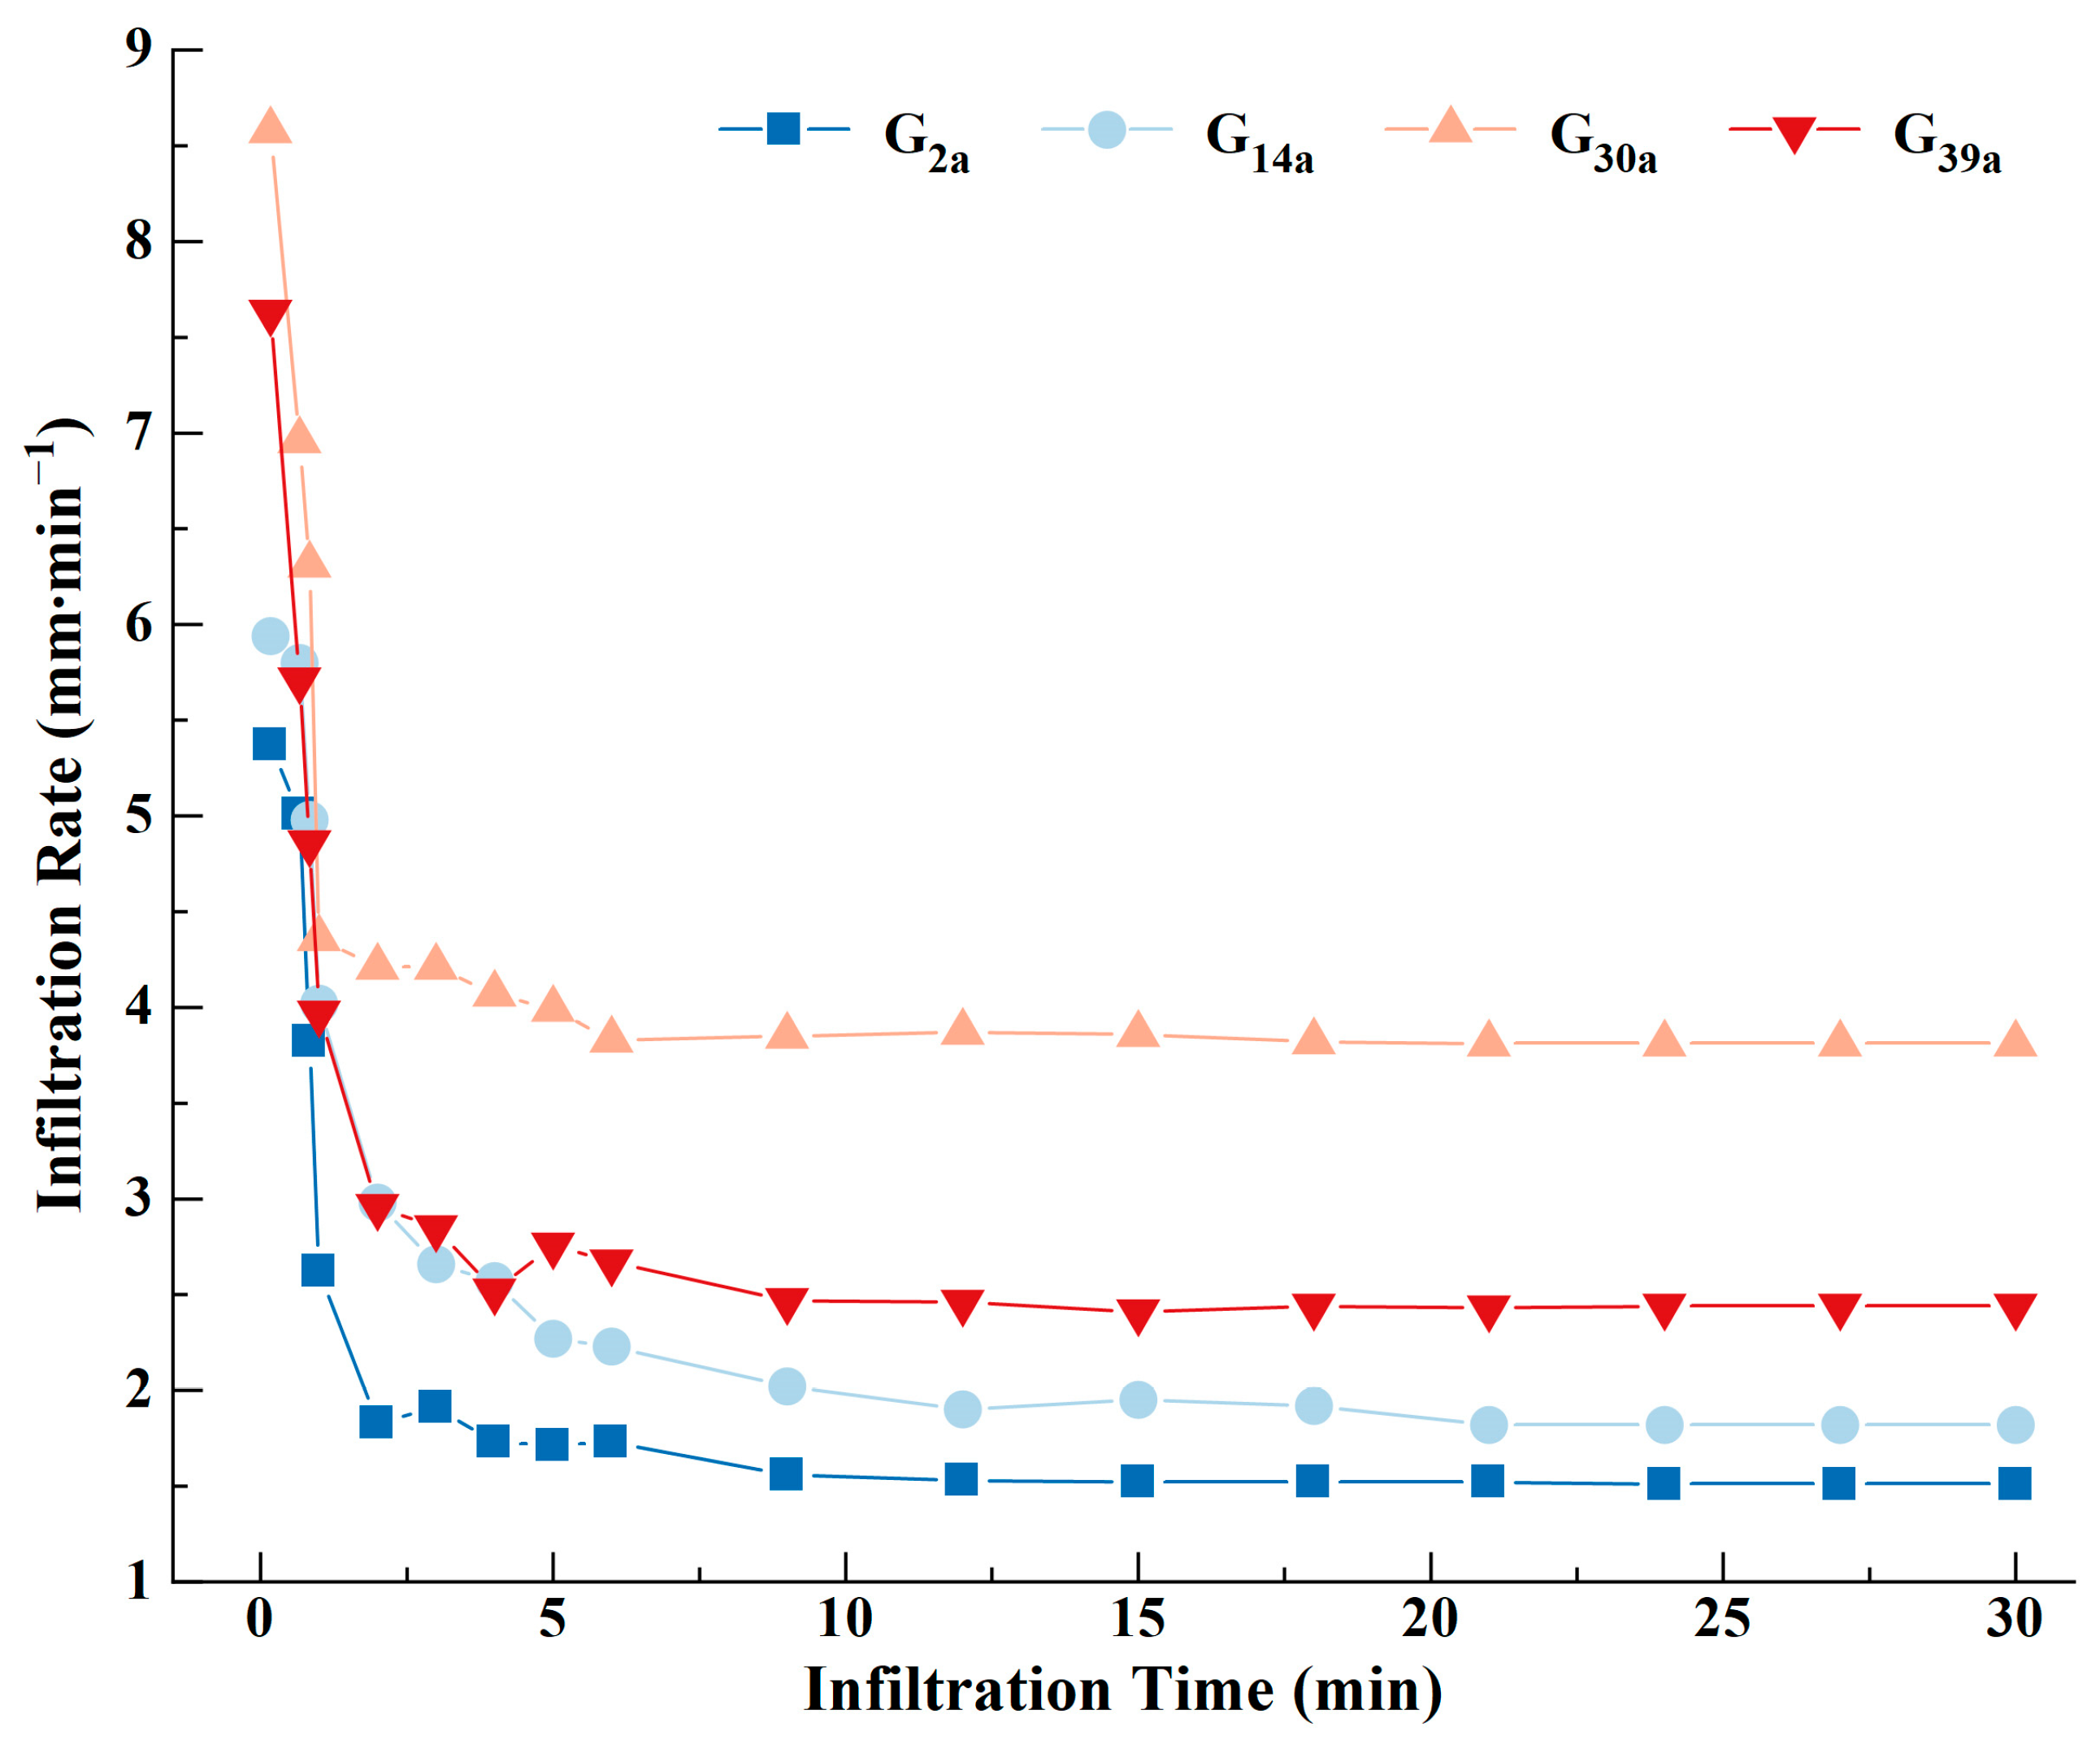
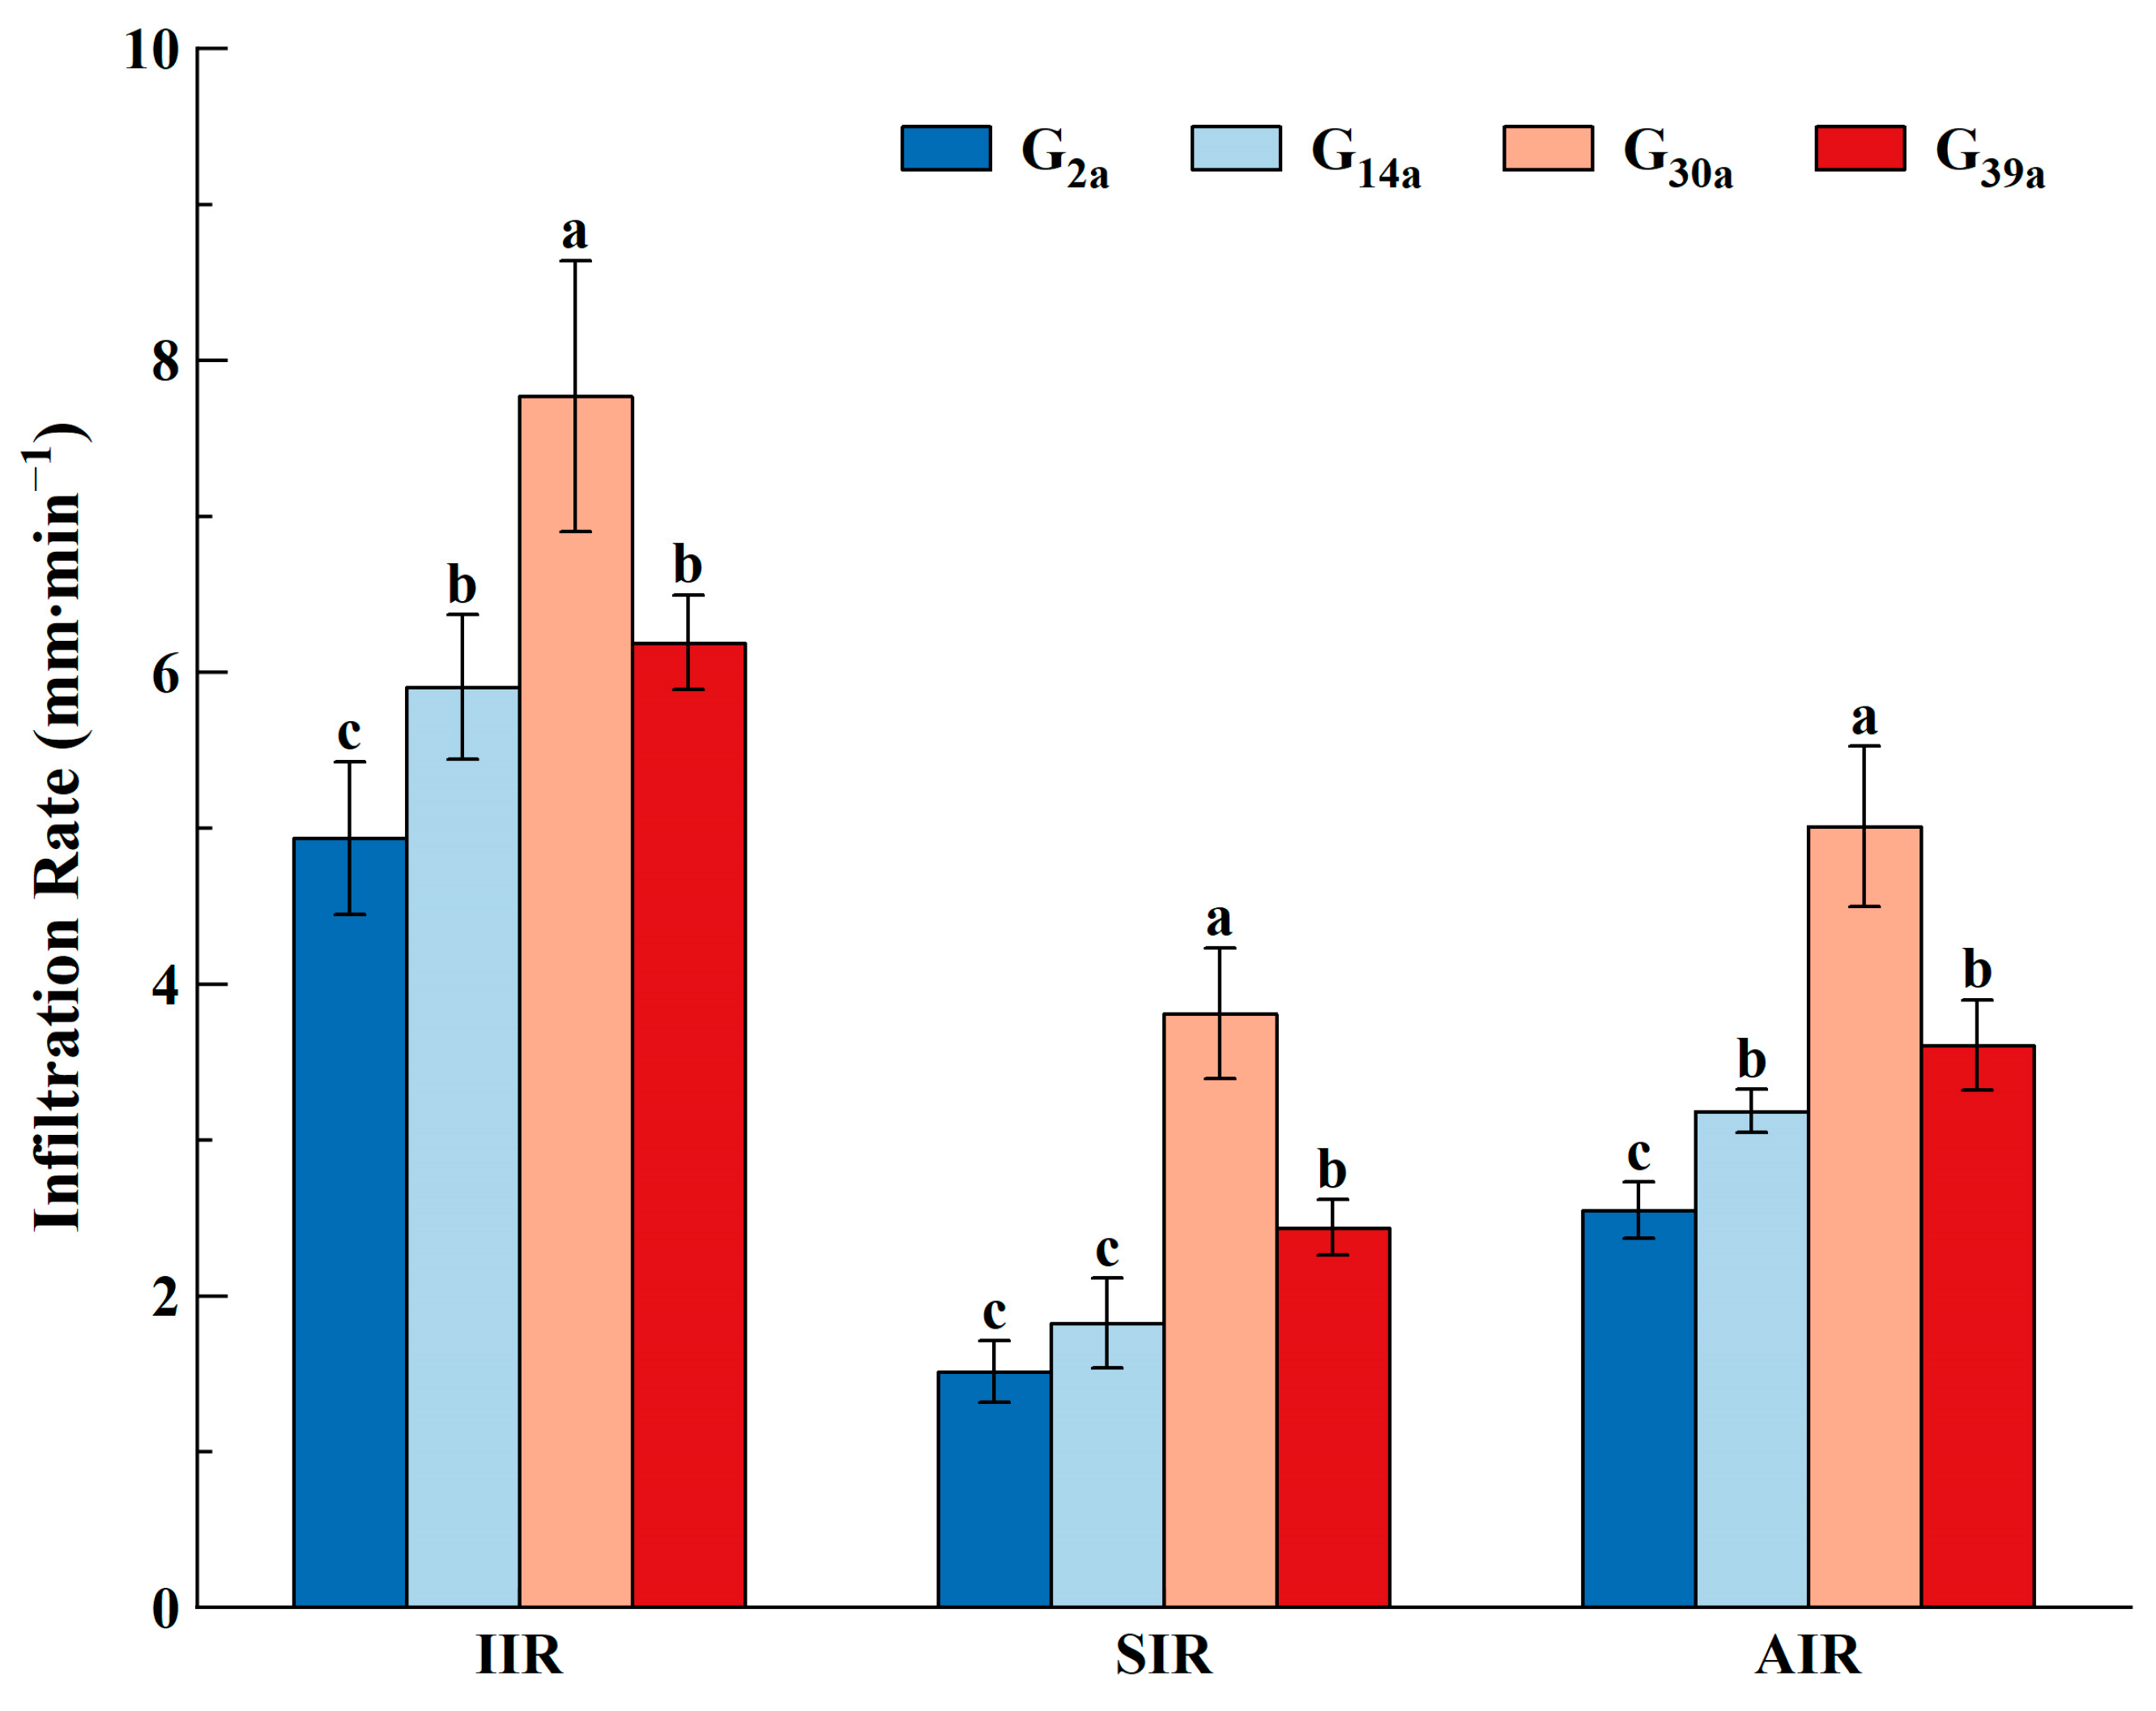
3.3. Soil Water Infiltration Characteristics of Grassland with Different Enclosure Years

Figure 6 indicates the curves of soil infiltration rate varying with time in grasslands with different enclosure years. In the initial stages of infiltration, there was a sharp decrease. One minute after the infiltration started, the rate decreased by 32–51%. It gradually leveled off after five minutes and reached a stable infiltration state after 20 min. Significant differences exist in the infiltration characteristics across grasslands subjected to varying enclosed durations (Figure 7). The initial infiltration rates for the sample plots are as follows: G30a > G39a > G14a > G2a (p < 0.05), with corresponding rates of 7.77 mm/min, 6.19 mm/min, 5.90 mm/min, and 4.93 mm/min, respectively. The stable infiltration rate follows a similar trend to the initial infiltration rate, where G30a exhibits a significantly higher stable infiltration rate of 3.81 mm/min compared to other grasslands with varying enclosed durations (p < 0.05). G39a’s stable rate stands as the second highest, with a value of 2.44 mm/min. It is noteworthy that G2a possesses the lowest stable infiltration rate among all sample plots. In comparison to G2a, grasslands enclosed for 14 years, 30 years, and 39 years exhibit respectively elevated infiltration rates of 20.66%, 152.03%, and 61.19%. In general, the average infiltration rate of G30a is significantly greater than that of other sample plots, indicating that the infiltration ability of the grassland exhibits an upward trend with increasing enclosure duration. Specifically, when the enclosed duration reaches 30 years, the infiltration capability reaches a relatively high level, after which it begins to decrease.

3.4. Analysis of Influencing Factors of Soil Water Infiltration Capacity

A highly significant positive correlation is found between soil infiltration rate and physicochemical properties, including total porosity and soil organic matter content (p < 0.01) (Table 3). Conversely, bulk density exhibits a highly significant negative influence on soil infiltration rate (p < 0.01). Furthermore, the content of soil aggregates across different particle sizes is intimately linked to the soil infiltration rate. The initial infiltration rate is significantly positively correlated with the content of soil aggregates with a particle size of 2–5 mm (p < 0.05), and the content of aggregates with a particle size of 0.25–2 mm is significantly positively correlated with the stable soil infiltration rate (p < 0.01). In general, the indicators of soil aggregate stability, notably the large aggregates exceeding 0.25 mm and the GMD, exhibit a significant positive correlation with the stable soil infiltration rate, whereas they indicate a negative correlation with the D (p < 0.01).
Principal component analysis (PCA) was conducted on soil water infiltration capacity, and the results are presented in Table 4. Three principal components were extracted from 11 factors that significantly influenced the infiltration rate, with a cumulative contribution rate of 88.46%, encompassing most of the information. The first principal component, with a contribution rate of 63.47%, was determined by water-stable aggregates and soil bulk density. Among them, the 1–2 mm water-stable aggregates had the highest loading (0.91), while the loadings of 0.5–1 mm, 0.25–0.5 mm, and <0.25 mm water-stable aggregates were all around 0.85. Other significant indicators included soil bulk density, total soil porosity, and fractal dimension D. The second principal component, with a contribution rate of 14.19%, was primarily influenced by >5 mm water-stable aggregates and organic matter. The third principal component, with a contribution rate of 10.80%, was mainly determined by 2–5 mm water-stable aggregates.

4. Discussion

As one of the most fundamental properties of soil, bulk density has a direct influence on soil structure and subsequently affects soil permeability, water retention capacity, and erosion resistance [23,24,25]. Chao et al. [26] found a gradual reduction in soil bulk density during the vegetation restoration process, suggesting a notable enhancement in soil structure. This study reveals that as the enclosed duration of grassland increases, the bulk density of topsoil in the region experiences a notable decrease. Specifically, the soil bulk density of grassland enclosed for 30 and 39 years was significantly lower than that of grassland enclosed for 2 and 14 years (p < 0.05), which is consistent with the findings of Du et al. [12]. However, no remarkable differences were detected in bulk density and total porosity between the soils of grasslands enclosed for 30 and 39 years.
Multiple factors contribute to the variation of soil bulk density, with soil organic matter content being the foremost physicochemical factor [27]. Our research findings also indicated that grasslands enclosed for 30 and 39 years exhibited significantly higher organic matter content (p < 0.05) compared to those enclosed for 2 and 14 years, underscoring the vital importance of soil organic matter [28]. In both G14a and G30a, the organic matter content of the topsoil is markedly elevated compared to that of the deep soil, a trend that can be ascribed to the accumulation and decomposition of plant litter [29]. Numerous research findings have indicated a positive correlation between organic matter content and the duration of vegetation restoration. During the process of vegetation restoration and growth, significant accumulation of humus occurs on the soil surface [30]. This accumulated humus, through the action of microorganisms and soil animals, facilitates the introduction of organic matter into the soil [6,29,31]. However, an intriguing exception to this trend is noted, where the soil organic matter content in grasslands enclosed for 2 years is notably higher than that in grasslands enclosed for 14 years, a discrepancy attributed to grazing and human interference preceding enclosure.
According to research, grazing exerts an influence on the makeup of surface vegetation, as well as on the velocity of litter accumulation, utilization, and breakdown processes [10,18]. The study conducted by Schuman et al. [32] demonstrated that a 12-year grazing period augmented the organic matter content in the soil at depths ranging from 0 to 30 cm. Nevertheless, soil compaction resulting from livestock trampling during this grazing period persisted until the early stages of enclosure [6], creating conditions that were unfavorable for microbial activity and subsequent organic matter decomposition. As the enclosure period prolongs, vegetation experiences gradual regrowth, resulting in the consumption of previously accumulated organic matter. Throughout this process, the continuous production of fresh litter by plants and the decomposition of root systems within the soil contribute to the ongoing accumulation of organic matter [33]. Some studies have shown that after reaching a certain period of recovery, vegetation cover tends to stabilize or begin to decline [34]. In this study, as vegetation recovered and succeeded, grassland root biomass increased with the prolongation of enclosure duration. When the enclosure duration attained 30 years, the root biomass attains a significantly greater magnitude than that of other enclosed grasslands, only to subsequently embark on a decline, which may be related to changes in community structure [33]. It is recognized that the soil’s capacity to sustain vegetation is finite, with soil moisture exerting a particularly restrictive influence on vegetation growth [7,35]. The growth of numerous vegetation consumes soil nutrients and moisture, ultimately resulting in a decrease in vegetation quantity and a subsequent decrease in root biomass.
The size distribution and stability characteristics of soil aggregates can indicate soil quality and also determine soil moisture conditions [36,37]. Stable aggregates are the main component of good soil structure, which can reduce soil erosion by surface runoff [12,38,39], while the sizes of the MWD and GMD can show the stability of soil aggregates [40]. Based on the diameter of aggregates, researchers categorize them into macro-aggregates (>0.25 mm) and micro-aggregates (<0.25 mm) [41]. This study indicated that as the enclosure years increased, the content of large aggregates, the MWD, and the GMD exhibited a corresponding increase, concurring with the outcomes of prior studies [33,42]. However, once the enclosure period surpassed 30 years, a decline in the stability indicators of aggregates and the content of large aggregates emerged, exhibiting no substantial difference between G30a and G39a. This tendency is intricately linked to the widespread underground root system development and the organic matter content within the process of vegetation recovery. Multiple research studies have highlighted a positive relationship between the content of macro-aggregates, aggregate stability, and organic matter [41,43,44]. Furthermore, it has been shown that fine roots and hyphae contribute to the binding of macro-aggregates [45]. The results of this study also indicate that root biomass is significantly positively correlated with the MWD and GMD (p < 0.05). Additionally, G39a shows higher MWD and GMD, signifying better aggregate stability. As a result, even if the root biomass of G39a is relatively low, it has still accumulated a significant amount of macro-aggregates through the long-term enclosure process. The micro-aggregate content of G2a was notably higher than that of the other sample plots in this study, potentially attributed to the relatively short enclosure duration, which renders the soil more susceptible to erosion. Research findings have indicated a significant positive correlation between soil fractal dimension and soil erodibility, with the fractal dimension demonstrating the degree of soil disturbance [20,46]. In this study, an increase in the MWD and GMD led to a decrease in fractal dimension, aligning with the findings of Saiedi et al. [20]. Moreover, the fractal dimensions of G30a and G39a, which had longer enclosure periods, were notably lower than those of the other sample plots, and G14a was also markedly lower than G2a. These findings indicate that enclosure and afforestation have a significant effect on soil improvement in the Ningxia Yunwushan Nature Reserve, but this effect diminishes after more than 30 years.
Vegetation restoration has the potential to enhance soil infiltration capacity [9,15,47]. Numerous studies have utilized indicators, including initial infiltration rate, average infiltration rate, and stable infiltration rate, to assess soil infiltration capacity [17,48]. This study measured indicators including initial infiltration rate, average infiltration rate, and stable infiltration rate for four different grassland enclosures, each with varying years of enclosure. The results reveal that soil infiltration capacity exhibits an increasing trend with the prolongation of enclosure duration, yet a turning point is observed where soil infiltration capacity starts to decline when the enclosure duration surpasses 30 years (Figure 7). Wu G et al. [49] conducted an investigation on restored grasslands with varying years of abandonment and observed analogous phenomena. Notably, the soil infiltration rate attained its maximum on grasslands restored for 15 years, whereas no further augmentation in soil water conductivity was discernible on grasslands restored for 30 years. In this study, it was found that a closure period of up to 30 years was necessary for the infiltration rate to reach its maximum value. This is attributed to the maximum vegetation cover that can be supported under the climatic and precipitation conditions of different study areas.
Alterations in soil infiltration capacity are predominantly influenced by vegetation growth, mortality, and the subsequent modifications in soil structure [15,50]. Relevant research suggests that macro-aggregates exhibit stronger resistance to erosion compared to micro-aggregates. Additionally, the presence of larger pore structures between macro-aggregates enhances permeability [12,51]. Micro-aggregates, formed through the cementation of humus [43], have poor water stability and are easily dispersed. Soils with a greater content of micro-aggregates are more susceptible to erosion caused by rainfall [12]. This type of soil, possessing unfavorable pore connectivity and poor structure, generally exhibits a lower infiltration capacity [51]. Before enclosure, trampling and grazing activities of herbivores during pasturing resulted in decreased ground vegetation cover, soil hardening, and a reduction in soil porosity [52]. As the duration of enclosure increased, soil bulk density gradually decreased, whereas porosity showed a consistent increase (Table 2). Many studies have drawn similar conclusions, suggesting that with a decrease in bulk density and an increase in porosity, the soil becomes more porous and demonstrates improved permeability [12].
Moreover, the grassland that had been enclosed for 30 years exhibited the highest levels of organic matter content, root biomass, aggregate stability, and macro-aggregate count. Soil organic matter serves as a binder between soil particles, fostering the formation of macro-aggregates and enhancing aggregate stability, ultimately leading to improved soil porosity [47,53]. This is also the main reason for the strongest infiltration capacity of G30a (Table 3). Although G39a has a high porosity, the reduction in the number of its roots causes the soil pore structure to lose the support of the root system, resulting in poor stability [54]. Thus, the initial infiltration rate of G39a is comparatively high, yet it undergoes a 62.65% decrease during the infiltration process before stabilizing. In contrast, G2a, with a higher content of micro-aggregates, experiences these particles entering the soil concomitantly with water flow during infiltration. The subsequent dispersion of micro-aggregates results in pore blockage, causing a 51.21% decline in G2a’s infiltration rate during the initial stage. Notably, the average infiltration rate of G2a is lower than that of other grasslands, as evidenced in Figure 6.

5. Conclusions

This study investigated the soil properties and infiltration characteristics of four grasslands with different enclosure durations in Yunwu Mountain (2 years, 14 years, 30 years, and 39 years). Compared to the stable infiltration rate of G2a at 1.51 mm/min, the infiltration rates of the enclosed grassland for 14 years, 30 years, and 39 years increased by 20.66%, 152.03%, and 61.19%, respectively. The enforcement of fenced enclosures has facilitated grassland vegetation recovery and augmented soil infiltration capacity, which is directly associated with the elevated total soil porosity, soil macro-aggregate content, and aggregate stability. The enhancement in root biomass and soil organic matter exerts influence on the composition and stability of soil aggregates and total soil porosity, ultimately enhancing soil infiltration capacity. The research findings indicate that after 30 years of enclosure in the Yunwushan Nature Reserve, certain parameters (root biomass, soil organic matter, soil aggregate characteristics, and infiltration properties) have declined. Perhaps future studies will provide clearer answers. After reaching the optimal period of 30 years, no significant changes were observed in the soil’s physicochemical properties and infiltration capacity. This study, which studies long-term fenced enclosure grasslands, contributes to a deeper understanding of the beneficial effects of enclosure on grassland soil. However, to comprehensively assess the ecological implications of enclosed measures, continued research is vital, integrating ecological surveys of aboveground vegetation to explore the impacts of enclosed measures on grassland rehabilitation and management.

Author Contributions

Conceptualization, X.X.; methodology, X.X.; software, Q.W.; validation, X.X.; formal analysis, Y.Q.; investigation, Y.Q., Q.W., J.W., X.C. and X.R.; resources, Y.Q., Q.W., J.W., X.C., X.R. and F.D.; writing—original draft, Y.Q.; writing—review and editing, Q.W. and O.H.D.; visualization, Y.Q.; supervision, X.X.; project administration, X.X.; funding acquisition, X.X. All authors have read and agreed to the published version of the manuscript.

Funding

This research was supported by the National Natural Science Foundation of China (Grant No. 41977426, 41771322).

Data Availability Statement

We do not provide public access to the dataset due to the protection of the privacy of participants. Regarding the details of the data, please contact the corresponding author.

Conflicts of Interest

The authors declare no conflicts of interest.

References

  1. Zhang, Y.; Xie, Y.; Ma, H.; Jing, L.; Matthew, C.; Li, J. Rebuilding Soil Organic C Stocks in Degraded Grassland by Grazing Exclusion: A Linked Decline in Soil Inorganic C. PeerJ 2020, 8, e8986. [Google Scholar] [CrossRef]
  2. Dlamini, P.; Chivenge, P.; Chaplot, V. Overgrazing decreases soil organic carbon stocks the most under dry climates and low soil pH: A meta-analysis shows. Agric. Ecosyst. Environ. 2016, 221, 258–269. [Google Scholar] [CrossRef]
  3. Lai, L.; Kumar, S. A global meta-analysis of livestock grazing impacts on soil properties. PLoS ONE 2020, 15, e0236638. [Google Scholar] [CrossRef]
  4. Yan, Y.; Lu, X. Is grazing exclusion effective in restoring vegetation in degraded alpine grasslands in Tibet, China? PeerJ 2015, 3, e1020. [Google Scholar] [CrossRef]
  5. Le, K.; Han, X.; Zhang, Z.; Sun, O.J. Grassland ecosystems in China: Review of current knowledge and research advancement. Philos. Trans. R. Soc. B Biol. Sci. 2007, 362, 997–1008. [Google Scholar]
  6. Qiao, Y.; Zhu, H.; Zhong, H.; Li, Y. Stratified Data Reconstruction and Spatial Pattern Analyses of Soil Bulk Density in the Northern Grasslands of China. ISPRS Int. J. Geo-Inf. 2020, 9, 682. [Google Scholar] [CrossRef]
  7. Fu, B.; Wang, S.; Liu, Y.; Liu, J.; Liang, W.; Miao, C. Hydrogeomorphic Ecosystem Responses to Natural and Anthropogenic Changes in the Loess Plateau of China. Annu. Rev. Earth Planet. Sci. 2016, 45, 223–243. [Google Scholar] [CrossRef]
  8. Tietjen, B.; Jeltsch, F. Semi-arid grazing systems and climate change: A survey of present modelling potential and future needs. J. Appl. Ecol. 2007, 44, 425–434. [Google Scholar] [CrossRef]
  9. Bargués-Tobella, A.; Winowiecki, L.A.; Sheil, D.; Vågen, T.G. Determinants of Soil Field-Saturated Hydraulic Conductivity Across Sub-Saharan Africa: Texture and Beyond. Water Resour. Res. 2024, 60. [Google Scholar] [CrossRef]
  10. Wu, G.-L.; Liu, Z.-H.; Zhang, L.; Chen, J.-M.; Hu, T.-M. Long-term fencing improved soil properties and soil organic carbon storage in an alpine swamp meadow of western China. Plant Soil 2010, 332, 331–337. [Google Scholar] [CrossRef]
  11. Mofidi, M.; Jafari, M.; Tavili, A.; Rashtbari, M.; Alijanpour, A. Grazing exclusion effect on soil and vegetation properties in Imam Kandi Range-lands, Iran. Arid Land Res. Manag. 2013, 27, 32–40. [Google Scholar] [CrossRef]
  12. Lyu, D.; Yang, Y.; Zhao, W.; Xu, X.; He, L.; Guo, J.; Lei, S.; Liu, B.; Zhang, X. Effects of different vegetation restoration types on soil hydro-physical properties in the hilly region of the Loess Plateau, China. Soil Res. 2023, 61, 94–105. [Google Scholar] [CrossRef]
  13. Li, Q.; Zhou, D.; Jin, Y.; Wang, M.; Song, Y.; Li, G. Effects of fencing on vegetation and soil restoration in a degraded alkaline grassland in northeast China. J. Arid. Land 2014, 6, 478–487. [Google Scholar] [CrossRef]
  14. Amézketa, E. Soil Aggregate Stability: A Review. J. Sustain. Agric. 1999, 14, 83–151. [Google Scholar] [CrossRef]
  15. Tang, B.; Jiao, J.; Yan, F.; Li, H. Variations in soil infiltration capacity after vegetation restoration in the hilly and gully regions of the Loess Plateau, China. J. Soils Sediments 2019, 19, 1456–1466. [Google Scholar] [CrossRef]
  16. Vinatier, F.; Rudi, G.; Coulouma, G.; Dagès, C.; Bailly, J.-S. Dynamics of quasi-steady ponded infiltration under contrasting plant cover and management strategies. Soil Tillage Res. 2024, 237, 105985. [Google Scholar] [CrossRef]
  17. Zhao, Y.; Wu, P.; Zhao, S.; Feng, H. Variation of soil infiltrability across a 79-year chronosequence of naturally restored grassland on the Loess Plateau, China. J. Hydrol. 2013, 504, 94–103. [Google Scholar] [CrossRef]
  18. Wei, D.; Ri, X.; Wang, Y.; Liu, Y.; Yao, T. Responses of CO2, CH4 and N2O fluxes to livestock exclosure in an alpine steppe on the Tibetan Plateau, China. Plant Soil 2012, 359, 45–55. [Google Scholar] [CrossRef]
  19. IUSS Working Group WRB. World Reference Base for Soil Resources. International Soil Classification System for Naming Soils and Creating Legends for Soil Maps, 4th ed.; International Union of Soil Sciences (IUSS): Vienna, Austria, 2022. [Google Scholar]
  20. Saiedi, N.; Besalatpour, A.A.; Shirani, H.; Abbaszadeh Dehaji, P.; Esfandiarpour, I.; Faramarzi, M. Aggregation and fractal dimension of aggregates formed in sand dunes stabilized by Pistachio PAM and Pistachio PVA c mulches. Eur. J. Soil Sci. 2017, 68, 783–791. [Google Scholar] [CrossRef]
  21. Bodner, G.; Leitner, D.; Kaul, H.-P. Coarse and fine root plants affect pore size distributions differently. Plant Soil 2014, 380, 133–151. [Google Scholar] [CrossRef]
  22. Nachabe, M.H. Estimating Hydraulic Conductivity for Models of Soils with Macropores. J. Irrig. Drain. Eng. 1995, 121, 95–102. [Google Scholar] [CrossRef]
  23. Alexander, E.B. Bulk densities of California soils in relation to other soil properties. Soil Sci. Soc. Am. J. 1980, 44, 689–692. [Google Scholar] [CrossRef]
  24. Huang, C.; Shao, M.; Tan, W. Soil shrinkage and hydrostructural characteristics of three swelling soils in Shaanxi, China. J. Soils Sediments 2011, 11, 474–481. [Google Scholar] [CrossRef]
  25. Abdel-Magid, A.H.; Schuman, G.E.; Hart, R.H. Soil bulk density and water infiltration as affected by grazing systems. Rangel. Ecol. Manag./J. Range Manag. Arch. 1987, 40, 307–309. [Google Scholar] [CrossRef]
  26. Zhang, C.; Xue, S.; Liu, G.-B.; Song, Z.-L. A comparison of soil qualities of different revegetation types in the Loess Plateau, China. Plant Soil 2011, 347, 163–178. [Google Scholar] [CrossRef]
  27. Wiesmeier, M.; Urbanski, L.; Hobley, E.; Lang, B.; von Lützow, M.; Marin-Spiotta, E.; van Wesemael, B.; Rabot, E.; Ließ, M.; Garcia-Franco, N.; et al. Soil organic carbon storage as a key function of soils—A review of drivers and indicators at various scales. Geoderma 2019, 333, 149–162. [Google Scholar] [CrossRef]
  28. Bagnall, D.K.; Rieke, E.L.; Morgan, C.L.S.; Liptzin, D.L.; Cappellazzi, S.B.; Honeycutt, C.W. A minimum suite of soil health indicators for North American agriculture. Soil Secur. 2023, 10, 100084. [Google Scholar] [CrossRef]
  29. Angst, Š.; Mueller, C.W.; Cajthaml, T.; Angst, G.; Lhotáková, Z.; Bartuška, M.; Špaldoňová, A.; Frouz, J. Stabilization of soil organic matter by earthworms is connected with physical protection rather than with chemical changes of organic matter. Geoderma 2017, 289, 29–35. [Google Scholar] [CrossRef]
  30. Li, R.; Kan, S.; Zhu, M.; Chen, J.; Ai, X.; Chen, Z.; Zhang, J.; Ai, Y. Effect of different vegetation restoration types on fundamental parameters, structural characteristics and the soil quality index of artificial soil. Soil Tillage Res. 2018, 184, 11–23. [Google Scholar] [CrossRef]
  31. Tian, J.; McCormack, L.; Wang, J.; Guo, D.; Wang, Q.; Zhang, X.; Yu, G.; Blagodatskaya, E.; Kuzyakov, Y. Linkages between the soil organic matter fractions and the microbial metabolic functional diversity within a broad-leaved Korean pine forest. Eur. J. Soil Biol. 2015, 66, 57–64. [Google Scholar] [CrossRef]
  32. Schuman, G.E.; Reeder, J.D.; Manley, J.T.; Hart, R.H.; Manley, W.A. Impact of grazing management on the carbon and nitrogen balance of a mixed-grass rangeland. Ecol. Appl. 1999, 9, 65–71. [Google Scholar] [CrossRef]
  33. Qiao, L.; Li, Y.; Song, Y.; Zhai, J.; Wu, Y.; Chen, W.; Liu, G.; Xue, S. Effects of vegetation restoration on the distribution of nutrients, glomalin-related soil protein, and enzyme activity in soil aggregates on the Loess Plateau, China. Forests 2019, 10, 796. [Google Scholar] [CrossRef]
  34. Jin, L.; Li, X.; Sun, H.; Wang, J.; Zhang, J.; Zhang, Y. Effects of restoration years on vegetation and soil characteristics under different artificial measures in alpine mining areas, West China. Sustainability 2022, 14, 10889. [Google Scholar] [CrossRef]
  35. Mei, X.-M.; Ma, L.; Zhu, Q.-K.; Wang, S.; Zhang, D.; Wang, Y. Responses of soil moisture to vegetation restoration type and slope length on the loess hillslope. J. Mt. Sci. 2018, 15, 548–562. [Google Scholar] [CrossRef]
  36. Sarah, P. Soil aggregation response to long- and short-term differences in rainfall amount under arid and Mediterranean climate conditions. J. Geomorphol. 2005, 70, 1–11. [Google Scholar] [CrossRef]
  37. Di Prima, S.; Stewart, R.D.; Najm, M.R.A.; Roder, L.R.; Giadrossich, F.; Campus, S.; Angulo-Jaramillo, R.; Yilmaz, D.; Roggero, P.P.; Pirastru, M.; et al. BEST-WR: An adapted algorithm for the hydraulic characterization of hydrophilic and water-repellent soils. J. Hydrol. 2021, 603, 126936. [Google Scholar] [CrossRef]
  38. Heras, M.D.L. Development of soil physical structure and biological functionality in mining spoils affected by soil erosion in a Mediterranean-Continental environment. Geoderma 2009, 149, 249–256. [Google Scholar] [CrossRef]
  39. Kalhoro, S.A.; Xu, X.; Chen, W.; Hua, R.; Raza, S.; Ding, K. Effects of different land-use systems on soil aggregates: A case study of the Loess Plateau (Northern China). Sustainability 2017, 9, 1349. [Google Scholar] [CrossRef]
  40. Wang, B.; Zhao, X.; Liu, Y.; Fang, Y.; Ma, R.; Yu, Q.; An, S. Using soil aggregate stability and erodibility to evaluate the sustainability of large-scale afforestation of Robinia pseudoacacia and Caragana korshinskii in the Loess Plateau. For. Ecol. Manag. 2019, 450, 117491. [Google Scholar] [CrossRef]
  41. Tisdall, J.M.; Oades, J.M. Organic matter and water-stable aggregates in soils. Eur. J. Soil Sci. 1982, 33, 141–163. [Google Scholar] [CrossRef]
  42. Wang, Y.; Ran, L.; Fang, N.; Shi, Z. Aggregate stability and associated organic carbon and nitrogen as affected by soil erosion and vegetation rehabilitation on the Loess Plateau. Catena 2018, 167, 257–265. [Google Scholar] [CrossRef]
  43. Huang, L.; Wang, C.Y.; Tan, W.F.; Hu, H.Q.; Cai, C.F.; Wang, M.K. Distribution of organic matter in aggregates of eroded Ultisols, Central China. Soil Tillage Res. 2010, 108, 59–67. [Google Scholar] [CrossRef]
  44. de Gryze, S.; Bossuyt, H.; Six, J.; Van Meirvenne, M.; Govers, G.; Merckx, R. Factors controlling aggregation in a minimum and a conventionally tilled undulating field. Eur. J. Soil Sci. 2007, 58, 1017–1026. [Google Scholar] [CrossRef]
  45. Tisdall, J.M. Possible role of soil microorganisms in aggregation in soils. Plant Soil 1994, 159, 115–121. [Google Scholar] [CrossRef]
  46. Ahmadi, A.; Neyshabouri, M.-R.; Rouhipour, H.; Asadi, H. Fractal dimension of soil aggregates as an index of soil erodibility. Hydrology 2011, 400, 305–311. [Google Scholar] [CrossRef]
  47. Rawls, W.J.; Nemes, A.; Pachepsky, Y. Effect of soil organic carbon on soil hydraulic properties. Dev. Soil Sci. 2004, 30, 95–114. [Google Scholar]
  48. Fischer, C.; Roscher, C.; Jensen, B.; Eisenhauer, N.; Baade, J.; Attinger, S.; Scheu, S.; Weisser, W.W.; Schumacher, J.; Hildebrandt, A. How do earthworms, soil texture and plant composition affect infiltration along an experimental plant diversity gradient in grassland? PLoS ONE 2014, 9, e98987. [Google Scholar] [CrossRef]
  49. Wu, G.; Liu, Y.; Fang, N.; Deng, L.; Shi, Z. Soil physical properties response to grassland conversion from cropland on the semi-arid area. Ecohydrology 2016, 9, 1471–1479. [Google Scholar] [CrossRef]
  50. Tian, J.; Zhang, B.; He, C.; Yang, L. Variability in soil hydraulic conductivity and soil hydrological response under different land covers in the mountainous area of the Heihe River Watershed, Northwest China. Land Degrad. Dev. 2017, 28, 1437–1449. [Google Scholar] [CrossRef]
  51. Mawodza, T.; Menon, M.; Brooks, H.; Magdysyuk, O.V.; Burca, G.; Casson, S. Preferential wheat (Triticum aestivum L. cv. Fielder) root growth in different sized aggregates. Soil Tillage Res. 2021, 212, 105054–105064. [Google Scholar]
  52. Lulandala, L.; Bargués-Tobella, A.; Masao, C.A.; Nyberg, G.; Ilstedt, U. Excessive livestock grazing overrides the positive effects of trees on infiltration capacity and modifies preferential flow in dry miombo woodlands. Land Degrad. Dev. 2022, 33, 581–595. [Google Scholar] [CrossRef]
  53. Adams, W.A. The effect of organic matter on the bulk and true densities of some uncultivated podzolic soils. Eur. J. Soil Sci. 1973, 24, 10–17. [Google Scholar] [CrossRef]
  54. Zhang, D.; Dai, Y.; Wang, L.; Chen, L. Influence of living and dead roots of Gansu poplar on water infiltration and distribution in soil. Appl. Sci. 2020, 10, 3593. [Google Scholar] [CrossRef]
Figure 1. Location of the study area.
Land 13 01558 g001
Figure 2. Soil organic matter content of grassland in different depths and different enclosure years. G2a, enclosure of grassland for 2 years; G14a, enclosure of grassland for 14 years; G30a, enclosure of grassland for 30 years; G39a, enclosure of grassland for 39 years. Note: Different lowercase letters indicate the significant differences between different depths of each plot (p < 0.05).
Land 13 01558 g002
Figure 3. Soil root biomass of grassland at different depths and different enclosure years. G2a, enclosure of grassland for 2 years; G14a, enclosure of grassland for 14 years; G30a, enclosure of grassland for 30 years; G39a, enclosure of grassland for 39 years. Note: Different lowercase letters indicate the significant differences between different depths of each plot (p < 0.05).
Land 13 01558 g003
Figure 4. Composition of soil aggregates in grasslands with different enclosure years. G2a, enclosure of grassland for 2 years; G14a, enclosure of grassland for 14 years; G30a, enclosure of grassland for 30 years; G39a, enclosure of grassland for 39 years.
Land 13 01558 g004
Figure 5. Characteristics of soil aggregates in grasslands with different depths and different enclosure years. G2a, enclosure of grassland for 2 years; G14a, enclosure of grassland for 14 years; G30a, enclosure of grassland for 30 years; G39a, enclosure of grassland for 39 years. Note: (a) presents the Mean Weight Diameter (MWD) of soil aggregates. (b) displays the Geometric Mean Diameter (GMD) of soil aggregates. (a,c) illustrates the Fractal Dimension (D) of soil aggregates. (d) shows the content of water-stable soil aggregates with a particle size greater than 0.25 mm. Different lowercase letters indicate the significant differences between different depths of each plot (p < 0.05).
Land 13 01558 g005
Figure 6. Soil infiltration process of grassland with different enclosure years. G2a, enclosure of grassland for 2 years; G14a, enclosure of grassland for 14 years; G30a, enclosure of grassland for 30 years; G39a, enclosure of grassland for 39 years.
Land 13 01558 g006
Figure 7. Soil infiltration characteristics of grassland with different enclosure years. G2a, enclosure of grassland for 2 years; G14a, enclosure of grassland for 14 years; G30a, enclosure of grassland for 30 years; G39a, enclosure of grassland for 39 years. IIR: initial infiltration rate; SIR: steady infiltration rate (10–30 min); AIR: average infiltration rate (0–30 min). Note: Different lowercase letters indicate the significant differences between different depths of each plot (p < 0.05).
Land 13 01558 g007
Table 1. Basic information of the sample site.
Sample PlotDominant SpeciesCoverageLongitude and Latitude
G2aStipa przewalskyi
Stipa grandis
Artemisia stechmanniana
0.7036°21′ N 106°20′ E
G14aStipa przewalskyi
Stipa grandis
Artemisia stechmanniana
Thymus mongolicus
0.7536°22′ N 106°18′ E
G30aStipa grandis
Stipa przewalskyi
Artemisia stechmanniana
Chrysanthemum lavandulifolium
0.9036°21′ N 106°20′ E
G39aStipa grandis
Artemisia stechmanniana
Stipa przewalskyi
0.8036°15′ N 106°23′ E
Table 2. Soil physical properties (mean ± standard deviation) of grassland with different depths and different enclosure years.
Soil Depth
(cm)
PlotsBD
(g/cm3)
Porosity
(%)
Soil Separates
SandSiltClay
(>0.02 mm)(0.02~0.002 mm)(<0.002 mm)
0–10G2a1.19 ± 0.03 a55.14 ± 1.22 b59.57 ± 1.44 a26.68 ± 1.23 c13.74 ± 0.67 b
G14a1.18 ± 0.06 a55.36 ± 2.21 b59.33 ± 2.54 a26.92 ± 1.61 bc13.75 ± 0.95 b
G30a0.89 ± 0.03 b66.34 ± 4.65 a49.19 ± 3.02 b32.17 ± 3.78 a18.64 ± 2.55 a
G39a0.83 ± 0.04 b68.82 ± 1.51 a52.22 ± 0.70 b30.98 ± 0.68 ab16.80 ± 0.53 a
10–20G2a1.19 ± 0.02 a55.08 ± 0.64 b62.56 ± 1.84 a25.51 ± 3.02 b11.93 ± 2.18 b
G14a1.21 ± 0.03 a54.42 ± 0.99 b51.78 ± 3.35 b31.51 ± 1.94 a16.72 ± 2.05 a
G30a0.94 ± 0.05 b64.35 ± 2.01 a48.70 ± 1.60 b33.79 ± 0.98 a17.50 ± 0.62 a
G39a0.90 ± 0.07 b66.21 ± 2.67 a51.45 ± 2.45 b31.77 ± 0.68 a16.78 ± 2.00 a
20–30G2a1.21 ± 0.05 a54.41 ± 2.05 b61.88 ± 2.83 a27.03 ± 2.04 b11.09 ± 0.80 c
G14a1.21 ± 0.02 a54.34 ± 0.60 b49.69 ± 1.01 b31.99 ± 0.67 a18.32 ± 0.36 ab
G30a1.06 ± 0.03 b59.82 ± 0.95 a47.38 ± 2.80 b33.38 ± 2.03 a19.25 ± 0.76 a
G39a1.01 ± 0.07 b63.29 ± 3.42 a51.28 ± 0.68 b31.71 ± 0.61 a17.01 ± 0.98 b
Note: Different lowercase letters indicate the significant differences between different depths of each plot (p < 0.05).
Table 3. Correlation analysis of soil infiltration performance and influencing factors.
IIRSIRAIR
Bulk Density−0.597 **−0.671 **−0.668 **
Porosity0.597 **0.671 **0.668 **
SOM0.455 **0.584 **0.528 **
>5 mm0.436 **0.441 **0.442 **
2–5 mm0.377 *0.290.341 *
1–2 mm0.505 **0.446 **0.486 **
0.5–1 mm0.639 **0.638 **0.645 **
0.25–0.5 mm0.638 **0.600 **0.627 **
<0.25 mm−0.797 **−0.748 **−0.783 **
GMD0.659 **0.626 **0.650 **
D0.796 **0.758 **0.786 **
Note: Spearman correlations for soil physical properties and infiltration rates. BD: bulk density; SOM: organic matter; D: fractal dimension; GMD: geometric mean diameter; IIR: initial infiltration rate; SIR: steady infiltration rate (10–30 min); AIR: average infiltration rate (0–30 min). The significance levels: * p < 0.05, ** p < 0.01.
Table 4. Principal component analysis of soil water infiltration capacity.
Principal Component123
BD−0.74−0.530.33
Porosity0.740.53−0.33
SOM0.230.75−0.36
Water-stable>5 mm0.060.890.14
Aggregate2–5 mm0.08−0.010.9
1–2 mm0.91−0.080.03
0.5–1 mm0.840.4−0.2
0.25–0.5 mm0.880.020.07
<0.25 mm−0.86−0.44−0.23
GMD0.690.620.32
D−0.9−0.39−0.14
Characteristic Value6.981.561.19
Contribution Rate63.47%14.19%10.80%
Cumulative Contribution Rate63.47%77.66%88.46%
Disclaimer/Publisher’s Note: The statements, opinions and data contained in all publications are solely those of the individual author(s) and contributor(s) and not of MDPI and/or the editor(s). MDPI and/or the editor(s) disclaim responsibility for any injury to people or property resulting from any ideas, methods, instructions or products referred to in the content.

