Abstract
Ethnopedology offers a unique opportunity to recognize and highlight invaluable local soil knowledge (LSK). We aimed to classify three soil profiles in a Brazilian irrigated district with salt-affected soils based on smallholder farmers’ LSK and scientific knowledge. The study occurred in the Baixo-Açu irrigation district in Brazil’s semi-arid region. Three soil profiles were characterized by researchers (etic approach) and farmers (emic approach) in the following areas: P1 profile (area under banana cultivation), P2 profile (fallow area), and P3 profile (native forest area). Smallholder farmers identified the studied areas with salt problems based on the salt precipitation on the surface, changes in leaf color, and incidence of indicator plants of salinized areas. Researchers classified P1 profile as Pantohypereutric Calcaric Leptic Cambisol (Loamic, Humic), P2 as Pantohypereutric Calcaric Leptic Cambisol (Loamic, Humic), and P3 as Leptic Calcic Chernozem (Loamic). Smallholder farmers classified the P1 profile as “Terra de Salitre” (Salt Soil), the P2 profile as “Terra de Piçarro” (Saprolite Soil), and the P3 profile as “Terra Boa” (Good Soil). The results indicate that valuing local soil knowledge is effective and crucial for improved scientific research and land use, highlighting the importance of recognizing and utilizing their expertise and experience.
1. Introduction
Ethnopedological studies seek to approximate the local soil knowledge (LSK) of farmers and the scientific knowledge of researchers about soils in perceptual-interpretative aspects [1,2]. After years of practice, farmers have improved their critical, contemplative, and interventionist views of natural systems [3]. These groundbreaking studies linking LSK and scientific knowledge offer game-changing insights into soil science and provide a roadmap for optimizing soil management to ensure long-term conservation success. With their answers to previously unresolved questions, these studies are essential for anyone serious about achieving the best possible soil health and sustainability outcomes. This approach covers various aspects related to farming practices. It includes soil fertility, communication and preservation of farmers’ LSK, soil degradation assessment, cultivation systems, cultural practices, and traditional agroforestry systems and soil management practices [4,5,6,7,8].
Salt stress is a significant abiotic stress that challenges sustainable agriculture by reducing crop yields, especially in arid and semi-arid regions [9]. High salt concentrations in the soil can impede plants’ absorption of water and essential nutrients. This is known as the osmotic or water-deficit effect of salinity. Managing salt levels to support healthy crop growth and prevent damage is essential [10]. When plants experience a lack of water, their leaves lose turgor, which leads to the closure of stomata. This closure reduces the stomatal conductance, resulting in limitations to the rates of photosynthesis [11]. Furthermore, the excessive presence of Na+ and Cl− ions leads to an ionic imbalance, which, in turn, results in decreased uptake of essential ions such as K+, Ca2+, and Mn2+. This has significant implications for plant health, growth, and crop yield [12].
Identifying and characterizing problems in saline areas requires instrumental equipment and specialized area management and monitoring technicians. These field studies are subject to failure because the salt soil distribution is not uniform in space and time [13,14]. Studies on salinity problems are usually conducted in isolation and ignore local soil knowledge [3]. Some researchers employ this knowledge to conduct land use and occupation surveys and classify soil types for better agricultural management [15,16,17]. However, there is a lack of research on integrating traditional and scientific knowledge, especially for salt-affected soils in semi-arid regions. Furthermore, the originality of our research is sustained by the fact that it is an area with very few studies on the subject of ethnopedology and salt-affected soils, given that it is an irrigated perimeter with significant potential in the semi-arid region of Brazil with a very pronounced salt soil problem. One aspect worth emphasizing is the unique perspective of experienced farmers who have dedicated years to cultivating their soils. Their invaluable expertise can be instrumental in pinpointing areas affected by salinity.
The challenge is establishing a welcoming environment for approaching local soil knowledge and facilitating an understanding of soil perception of traditional communities in the broader sense through ethnopedology. This knowledge covers a system of information on different natural resources improved from experience, experimentation, and innovation to management of cultivated areas [15,17]. Research conducted with a participatory approach in the Rio Grande do Norte state, Brazil, originated in the works of Oliveira and Resende [18] in the Baixo-Açu area. At the time, these authors had already identified that farmers showed sensitivity to understanding the balance of nutrients in soil solution, and farmers had identified halo biomes as saline areas. However, no study has applied local soil knowledge to classify soil with salt-affected soils in the Baixo-Açu Irrigated District.
We hypothesized that smallholder farmers have the ability to classify soils as either having salt issues or not by utilizing their own strategies and visually assessing soil and vegetation characteristics. Therefore, the objective of this research was to classify three soil profiles in the Baixo-Açu Irrigation District in Brazil’s semi-arid region based on smallholder farmers’ local soil knowledge and scientific knowledge.
2. Materials and Methods
2.1. Location
The study was carried out in the Baixo-Açu Irrigation District (DIBA), which uses fresh water (without problems of excess salts) from the Piranhas-Açu River, which is distributed in the irrigation district through irrigation canals. The district is located in the Vale do Açu micro-region, in the municipalities of Alto do Rodrigues and Afonso Bezerra, in the state of Rio Grande do Norte, Brazil (Figure 1). The total irrigable area of the district is 5435.96 hectares and is divided into three stages: the pilot project, with an irrigable area of 1000 hectares, the first stage, consisting of 1629.10 hectares, and the second stage, with 2806.86 hectares [19]. The Irrigated District has 197 projected lots divided into three stages, of which only 138 are in operation. About 250 families live on the perimeter, distributed in three agrovillages for irrigating residents concentrated near the Pilot Project, Entrance Agrovillage, and Forest Agrovillage.
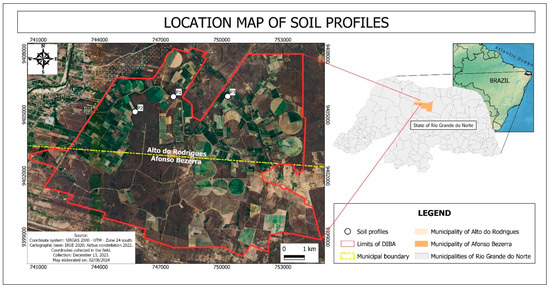
Figure 1.
Location map of the study area.
The region is drained by the Piranhas-Açu River and has a predominance of recent and ancient alluvial deposits [20]. The climate of the region where the irrigated perimeter is located, according to Köppen’s classification, is BSh, with an average temperature of 27.5 °C, a maximum of 33.6 °C, and a minimum of 21.5 °C. The rainy season begins in January, and the wettest period of the year is concentrated in March and April. The vegetation is hyperxerophilic Caatinga—vegetation of drier aspect and with an abundance of cacti, with carnauba palm as the predominant species [21].
The areas were selected through a preliminary exploratory survey of information regarding land use and occupation, consultation with the MSI/Sentinel 2 satellite image bank to identify lots with a higher incidence of bare areas, and field visits in loco to the lots. Salinity characterization and identification using visual and laboratory methods were performed in the profiles described in Table 1.

Table 1.
Geographic coordinates, use, location, and history of the areas under study in the Baixo-Açu Irrigation District, Alto do Rodrigues, RN, Brazil.
Although the irrigation water is not saline, the salinization of the soil in the irrigated perimeter comes from the poor drainage of salts in the soil, causing them to accumulate. Farmers do not carry out desalination strategies, they simply abandon the area.
Three soil profiles were opened in the selected environments for characterization and description of color morphological attributes, consistency, and soil structure, followed by classification. Soil samples from horizons were collected in each profile according to Santos et al. [22] and IUSS Working Group WRB [23].
2.2. Physical and Chemical Soil Analysis
The pipette method obtained the granulometry using the chemical dispersant sodium hexametaphosphate. The sand fraction (2 to 0.05 mm) was obtained by sieving, the clay (<0.002 mm) by sedimentation and the silt (0.05 to 0.002 mm) by the difference between the two fractions [24]. Chemical analyses were determined using a methodology proposed by Teixeira et al. [25]. Soil pH was determined using a soil/water ratio of 1:2.5 (v/v). The P, Na+, and K+ were extracted with the Mehlich-1 solution, K+ and Na+ levels were determined using flame photometry, and P levels were determined using photocolorimetry. Exchangeable Ca2+, Mg2+, and Al3+ were extracted with KCl solution (1 mol L−1) and determined by titration. Potential acidity (H + Al) was determined by 0.5 mol L−1 calcium acetate extraction followed by titration with NaOH. The total organic carbon (TOC) was quantified using the potassium dichromate (0.167 mol L−1) method. The electrical conductivity was determined using a soil/water ratio of 1:1, v/v. Then, sum of bases (SB = Ca2+ + Mg2+ + Na+ + K+), effective cation exchange capability (t = SB + Al3+), cation exchange capacity (CEC = SB + H+ + Al3+), base saturation (V = (SB/CEC) × 100), and exchangeable sodium percentage (ESP = (100 × Na+)/CEC) were calculated.
The saturation extract’s electrical conductivity and hydrogen potential were determined using a methodology proposed by Richards [26]. A total of 200 g of soil was weighed, placed in a 400 mL beaker, moistened with deionized water, and pressed using a stainless-steel spatula to obtain the saturation paste. After 12 h, it was transferred to a Büchner funnel with filter paper, adapted to a 500 mL Kitasato flask coupled to a suction pump. After suction, the solution was transferred to individual collectors, labeled, and evaluated for electrical conductivity and hydrogen potential. Sodicity was evaluated using clay dispersion and a Petri dish to observe the required time for total soil dispersion in soil samples with different salt concentrations. The presence of carbonates was determined by the effervescence shown by the soil sample when in contact with 10% diluted HCl [22]. After performing the chemical and physical analyses, the average data from four repetitions were calculated and subjected to statistical analysis.
2.3. Soil Morphological Description
Etic description and soil profile classification were carried out by a team of researchers from the Universidade Federal Rural do Semi-Árido—UFERSA and the Agricultural Research Company of Rio Grande do Norte State—EMPARN, based on the Brazilian Soil Classification System [22] and World Reference Base—WRB/FAO [23]. The Munsell color soil book was used to identify the colors of the horizons in the profiles.
The emic approach field privileges the combination of different tools for surveying information about the areas under study. During the study, 16 smallholder farmers (12 men and four women) were interviewed using a semi-structured questionnaire (Appendix A). Soil profiles were identified and classified through on-site visits to the farms.
2.4. Methodological Tool for Identification of Salinized Soils
The diagnostic characteristics that indicate salt soil problems were systematized from the local soil knowledge through a form designed for this study (Appendix A). The proposal gathered indicators of salinized soils, such as irrigation water quality, leaf symptoms, spontaneous vegetation, soil color, and drainage. Morphological characteristics perceived by the farmers were evaluated based on color, texture, consistency, and drainage of the cited areas.
2.5. Multivariate Analysis
Multivariate analysis refers to all statistical techniques that simultaneously analyze various attributes, individuals, or objects that are under investigation. Thus, multivariate analysis can be considered any simultaneous analysis of more than two variables [27]. It is up to the researcher to assess whether the methods chosen can answer the correlations between the evaluated variables, similarities, or differences.
The nature of the studies indicated that the most appropriate technique for data analysis and interpretation would be investigating the interrelationship between the attributes researched. When the objective is to investigate how the variables relate, principal component analysis and hierarchical cluster analysis are the most recommended methods to be used. Each method used has a distinct purpose. Ribas and Vieira [28] point out that the objective of the principal component analysis is achieved when a smaller number of components explain most of the variability of the data. Dendrogram analysis consists of grouping the attributes into groups based on the similarity between them within the group and the heterogeneity of attributes between groups [29]. Thus, it was decided, in the present study, to analyze soil attributes using multivariate statistical methods, especially because it is a model capable of establishing relationships between the performance and influence of the different attributes and correlating them in the differentiation of environments.
2.6. Statistical Analysis
Pearson’s correlation analysis (p ≤ 0.05) was initially performed to identify the minimum justifiable correlations for use in the data matrix. The data were standardized by the correlation matrix and subjected to the principal component analysis (PCA), factor analysis (FA), and hierarchical cluster analysis (HCA) using Statistica 7.0 software [30].
3. Results
3.1. Soil Morphological Attributes and Texture
The surfaces of the areas where we opened the soil profiles, and the profiles are shown in Figure 2. The P1 and P3 profiles have a lower effective depth compared with the P2 profile (Table 2). In all profiles, the dark brown color predominates on the soil surface horizons, ranging from 7.5YR 4/6 (when dry) to 7.5YR 2.5/2 (when moist). However, in the soil subsurface horizons, the yellowish color predominates, except for the P3 profile (Table 2). The sand fraction is predominant in the P1 and P2 profiles, characterizing them as sandy clay loam. P3 profile is sandy loam in the surface horizon (A) and clay loam in the subsurface horizons (A2, C, and C2k) (Table 2). The P3 profile showed the highest silt contents (Table 2).
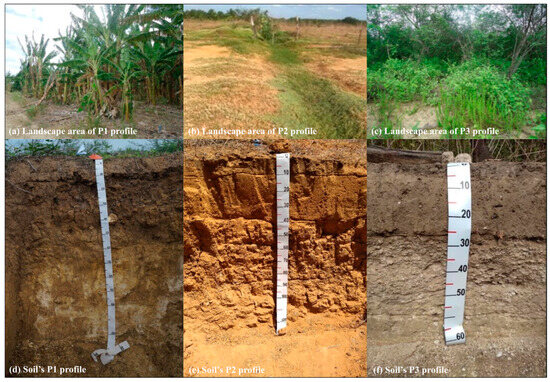
Figure 2.
Landscape and soil profiles. (a) Landscape area of the P1 profile, (b) Landscape area of the P2 profile, (c) Landscape area of the P3 profile, (d) Soil’s P1 profile, (e) Soil’s P2 profile, and (f) Soil’s P3 profile.
Table 2.
Morphological attributes and particle-size distribution in soil profiles in the Baixo-Açu Irrigation District, Alto do Rodrigues, RN, Brazil.
The P1 and P2 profiles showed friable consistency when moist and soft when dry. In the surface horizon (A), the P3 profile had friable and soft consistency under moist and dry soil conditions, respectively. In the subsurface horizons (A2, C, and A2k), the P3 profile under moist soil conditions had firm consistency. The three soil profiles had a predominance of subangular and angular blocky structures with moderate to weak grades (Table 2). Large angular and subangular blocks occur only in the subsurface horizon of the P1 profile (Bi) (Table 2).
The soil profiles were classified according to the researchers as follows: the P1 profile is a CAMBISSOLO HÁPLICO Carbonático Solódico [22] and Pantohypereutric Calcaric Leptic Cambisol (Loamic, Humic) [23], P2 profile is a CAMBISSOLO HÁPLICO Ta Eutrófico Típico [22] and Pantohypereutric Calcaric Leptic Cambisol (Loamic, Humic) [23], and P3 profile is a CHERNOSSOLO RÊNDZICO Órtico saprolítico [22] and Leptic Calcic Chernozem (Loamic) [23].
3.2. Chemical Attributes of Soil Profiles
The three profiles showed alkaline reaction and EC lower than 4 dS m−1, except for the horizon C2 in the P2 profile, which had EC equal to 4.56 dS m−1 (Table 3). Ca2+ and Mg2+ contents ranged from 9.0 to 21.0 cmolc kg−1 and 1.3 to 12.5 cmolc kg−1, respectively. K+ contents in the P2 profile outperformed P1 and P3 (Table 3). The presence of Al3+ and H+ + Al3+ was observed only in the subsurface of the P2 profile (Table 3). CEC and base saturation (V) reflect these values, giving eutrophic character to all profiles (Table 3). TOC and CaCO3 contents in the P3 profiles outperformed P1 and P2. In all profiles, the TOC content decreased in the subsurface. CaCO3 content doubled in the P3 profiles in the subsurface and was indifferent in the P1 and P2 (Table 3).
Table 3.
Chemical attributes of soil profiles in the Baixo-Açu Irrigation District, Alto do Rodrigues, RN, Brazil.
3.3. Classification of Soil Profiles Regarding Salinity
The classification of the soil profiles and their respective horizons according to Richards [26] are shown in Table 4. The P1 profile was classified as the surface saline horizon and subsurface saline-sodic horizon. The surface horizon of the P2 profile has no restrictions regarding the salt presence, but in the subsurface, the horizons were classified as saline-sodic in the BC, BC2, and C horizons. In the P3 profile, only the C2 horizon was classified as saline-sodic.
Table 4.
Classification of soil profiles regarding salinity based on hydrogen potential—pH(se), electrical conductivity—EC(se), and exchangeable sodium percentage—ESP, in the Baixo-Açu Irrigation District, Alto do Rodrigues, Brazil.
3.4. Emic Characterization of the Soil
The farmers pointed out the color and texture of the soil as the most relevant attributes in the horizon’s characterization (Table 5 and Table 6). In the P1 profile, the farmers observed brown color in surface layers and light brown color in subsurface layers. The white color refers to “Piçarro” (Saprolite Soil). Farmers designated the soil texture as a “soil mixture”. They also consider that the P3 profile has a very heavy mixture in the subsurface, with a clay predominance. Farmers note that the soil is in the salinization process through the change in the appearance of its surface-salt crust presence. Salt crusts are inconspicuous in some places, but farmers recognize them as “Salitada” (Salt Soil). Farmers classified the P1 profile as “Terra de Salitre” (Salt Soil), the P2 profile as “Terra de Piçarro” (Saprolite Soil), and the P3 profile as “Terra Boa” (Good Soil) (Table 5).
Table 5.
Classification of soil profiles (Emic Classification) regarding salinity based on the perception of farmers in the Baixo-Açu Irrigation District, Alto do Rodrigues, Brazil.
Table 6.
Farmers’ perception of attributes that indicate soils with salt problems in the Baixo-Açu Irrigation District, Alto do Rodrigues, RN, Brazil. Emic Characterization.
In response to this set of diagnostic attributes of soils with salt problems, such as color, texture, structure, and drainage, the farmers elected the presence of indicator plants as the main characteristic of salinized environments (Table 6). The yellowing and burning of banana leaves indicated that plants already show the characteristic symptoms of salt-affected plants (Table 6).
The indicator plants pointed out by the farmers were Stemodia maritima Linn., popularly known as “Melosa” (Figure 3A), and Blutaparon portulacoides A. St.-Hil., known as “Pirrixiu” (Figure 3B).
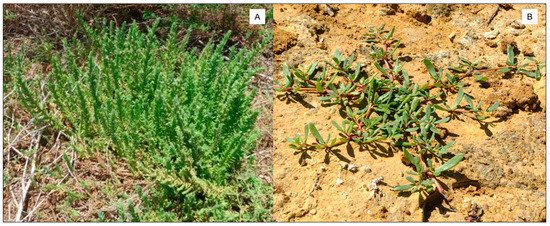
Figure 3.
Indicator plants Stemodia maritima Linn (A), popularly known as “Melosa”, and Blutaparon portulacoides A. St.-Hil (B), known as “Pirrixiu”.
3.5. Multivariate Analysis of Soil Physicochemical Attributes
We present the multivariate analysis results as correlation matrix (CM), factor analysis (FA), principal component analysis (PCA), and hierarchical cluster analysis (HCA), represented by the dendrogram for the studied soils.
In the factor analysis, the factors were extracted by principal components, and the axes were rotated using the Varimax method, considering those with eigenvalues greater than 1. A value of 0.70 was established for significant factor loadings. The factor and principal component analyses aim to reduce the data and present the most discriminating variables in distinguishing environments. Cluster analysis was performed using a hierarchical clustering process with Ward’s method, with the aim of presenting similarities within the groups.
Significant correlations were identified, especially for the inorganic soil fractions (sand, silt, and clay), pH, EC, Na+, K+, Mg2+, Al3+, and ESP (Table 7). The sand fraction was negatively correlated with the silt and clay fractions, showing inverse correlations of these particles. The pH showed an inverse correlation with Al3+ and H+ + Al3+. The EC showed significant correlations with the exchangeable bases. EC and Na+ contributed to increasing ESP values in all profiles studied.
Table 7.
Correlation matrix between soil attribute variables in the study areas of the Baixo-Açu Irrigation District, Alto do Rodrigues, RN, Brazil.
Factor analysis originated two factors, and factor loadings greater than 0.70 were considered significant. The factorial solution extracted the factors in order of importance, with more representation in the studied environments. Factor 1 (F1) has greater contribution power, explains 39.69% of the data variability, and is related to the soil’s salinity, texture, and fertility, especially to the attributes EC, K+, Na+, CEC, ESP, sand, clay, and TOC (Table 8).
Table 8.
Rotated factor axes of the soil chemical and physical attributes and the respective factorial loadings, eigenvalues, total variance, cumulative variance, and communalities.
Factor 2 (F2) explained 27.90% of the variance, represented by pH, Al3+, and H+ + Al3+, and is related to soil reaction (Table 8). The cumulative variance (%) explains 67.59% of the data variability.
Principal components analysis (Figure 4) shows the two factors contributing to the differentiation in most areas. In the PCA, based on the correlation circle (Figure 4A) and point cloud distribution (Figure 4B), the image overlay identifies which attributes were represented in the soil differentiation, soil attributes, and cultivated areas. Soil attributes close to the correlation circle have the most explanatory power. The variables with the highest weights were CEC, pH, silt, and TOC in the F1 and ESP, clay, Al3+, and H+ + Al3+ in the F2.
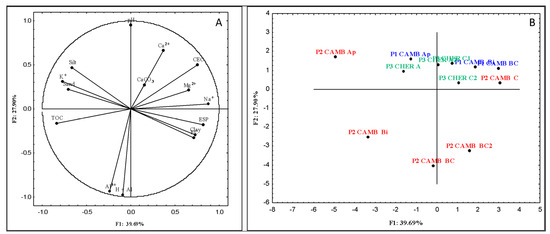
Figure 4.
(A) Soil’s parameters vector projection diagram. (B) Component (factors) diagram representing the distribution and relationships between factors 1 and 2.
The hierarchical cluster analysis (Figure 5) with four groups formation (I, II, III, and IV), considering a level of 40% dissimilarity. Groups are read from right to left. The first group was formed by profiles P1—Pantohypereutric Calcaric Leptic Cambisol (Loamic, Humic)—and P2—Pantohypereutric Calcaric Leptic Cambisol (Loamic, Humic). The second group was formed by the P2 profile—Pantohypereutric Calcaric Leptic Cambisol (Loamic, Humic)—and the P3 profile—Leptic Calcic Chernozem (Loamic). The third group was formed only by the P2 profile—Pantohypereutric Calcaric Leptic Cambisol (Loamic, Humic). The fourth group consisted only of the P3 profile—Leptic Calcic Chernozem (Loamic).
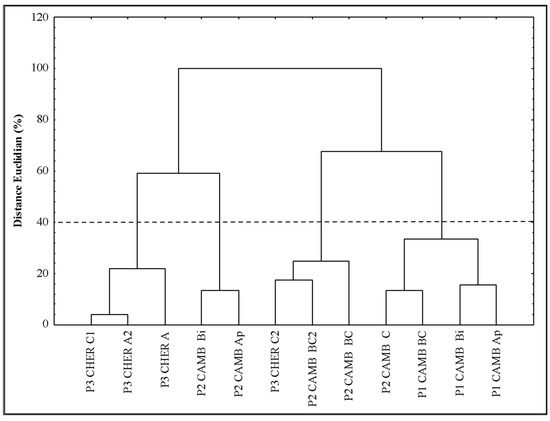
Figure 5.
Dendrogram resulting from hierarchical analysis of clusters.
4. Discussion
Smallholder farmers’ knowledge of soil characteristics is imperative for the long-term viability of their agricultural operations. Soil salinity, caused by excessive salt content, can be a significant obstacle in agricultural production. Therefore, it is essential to conduct research that merges local soil knowledge with the scientific knowledge of researchers to achieve sustainable agricultural development. We identified and classified three soil profiles based on the local soil knowledge of smallholder farmers and compared them to scientific knowledge. The smallholder farmers and researchers chose three areas for the profiles: P1, an area under banana cultivation; P2, a fallow area; and P3, a native forest area. The researchers classified the P1 profile as Pantohypereutric Calcaric Leptic Cambisol (Loamic, Humic), the P2 profile as Pantohypereutric Calcaric Leptic Cambisol (Loamic, Humic), and the P3 profile as Leptic Calcic Chernozem (Loamic). Smallholder farmers, using their soil knowledge, also identified the areas with salt problems. They observed salt precipitation on the surface, changes in leaf color, and incidence of indicator plants of salinized areas. The farmers classified the P1 profile as “Terra de Salitre” (Salt Soil), the P2 profile as “Terra de Piçarro” (Saprolite Soil), and the P3 profile as “Terra Boa” (Good Soil).
In all profiles, the soil surface horizons were dark brown. The dark color occurs due to the organic carbon contents and the sandier soil matrix, with higher sand in P1 and P2. The Pantohypereutric Calcaric Leptic Cambisol (Loamic, Humic) are yellowish in-depth, but the Leptic Calcic Chernozem (Loamic) expresses the lighter colors by the influence of the limestone rock in the horizons C and C2k. The P1 and P2 profiles are sandy clay loam. The surface horizon of the P3 profile is sandy loam, and the subsurface horizons are clay loam. Soils with a greater fine fraction predominance cause problems in irrigated areas by reducing hydraulic conductivity and maximizing capillary rise [31].
The Pantohypereutric Calcaric Leptic Cambisol of the P2 profile showed greater depth and low silt contents, indicating more pedogenetic evolution than the other profiles studied. The highest silt contents indicate that the P3 profile is young soil. Soil firmness in subsurface horizons and the highest silt contents found in the P3 profile occur in poorly weathered soils with parent material composed of fossiliferous limestone [32]. In the P1 profile, there are large angular and subangular blocks. Ribeiro et al. [33] observed Cambisol that had horizons with two types of structure. Soils with subangular and fine blocky structures have better conditions for infiltration, aeration, and water retention [33]. This fact justifies the farmers’ preference for areas with profile P1 soil type compared with the soil type of the P2 and P3 profiles, which have a predominance of subangular and angular block structures.
The high Ca2+ and Mg2+ contents of the profiles occur due to the soil’s parent material—Jandaíra Limestone [34]. K+ contents in the P2 profile outperformed P1 and P3. Mota et al. [35] found higher K+ contents in secondary forest areas than in cultivated areas. However, the P2 profile was previously cultivated with bananas, so fertilization with K2O may justify these high contents of K+ compared with P1 and P3. Soil acidity increases the leaching of basic cations, leading to the loss of significant amounts of Ca2+ and Mg2+ from soils [36]. The higher the levels of soil potential acidity (H+ + Al3+), the greater the release of Al3+ into the soil solution, reducing root growth and the absorption of water and nutrients [37].
In the multivariate analysis, the correlation matrix shows significant correlations for the inorganic soil fractions (sand, silt, and clay), pH, EC, Na+, K+, Mg2+, Al3+, and ESP. Inorganic soil fractions directly influence the soil water movement. One of the harmful effects caused by salts is clay dispersion and expansion. The harmful effects ultimately cause the rupture of aggregates, altering the arrangement of particles, reducing porous space, and eventually compromising hydraulic conductivity [38]. Knowledge of texture is a primary factor for correct soil management. Texture influences several processes/parameters, such as infiltration, CEC, fertilization formulations, and irrigation intervals. Soil texture changes little in a short time, being an inherent soil attribute [39].
The excess of Al3+ in the p1 profile explains the inverse correlation of the pH with Al3+ and H+ + Al3+. The history of area use indicates the export of Ca2+ and Mg2+ by intense banana cultivation, cation leaching losses, and, consequently, a decrease in CEC. Gomide et al. [40] verified the exchangeable base loss and elevation of potential acidity (H+ + Al3+) and Al3+ in profiles of Leptic Cambisol. The exchangeable base loss causes a decrease in soil fertility and production capacity.
The EC and Na+ showed significant correlations with the ESP. The salinization of the studied areas corroborates the parent material—Jandaíra Limestone, inadequate irrigation management, and the inefficiency of drainage channels. Studies carried out for surveying and mapping the Açu Aquifer reveal that in the strip adjacent to the limestones of the Jandaíra Formation, there is an increase in salinity due to the influence of carbonate rocks [41]. Other factors contribute to increasing EC and Na+ values in the studied areas, such as the lot located in the landscape. These are in lower areas, and the water flow converges to a large expanse of land, which could be classified as a legal reserve area. Castro and Santos [42] highlight that the lack of drainage, or inefficient drainage associated with high contents of Na+, is a worrying factor and should be previously identified during the design of engineering projects. High electrical conductivity interferes with plant growth and development, significantly reducing the yield of crops [43,44].
Factor 1 shows that the attributes EC, K+, Na+, CEC, ESP, sand, clay, and TOC are related to soil’s salinity, texture, and fertility. These contents directly influenced the ESP, even identifying areas with salt problems and restricting their use. Costa et al. [37] identified increased EC levels in the subsurface layers of a Leptic Cambisol cultivated with banana trees because of irrigation management. Waters with low EC can cause problems of salt accumulation in the subsurface. Justo et al. [14] showed the spatial variability of salinity in the Baixo-Açu Irrigation District and indicated the need to adopt soil recovery and water management techniques in irrigation.
F2 showed that the soil salt accumulation increments in ESP and electrical conductivity. Andrade et al. [1] verified gradual accumulation through irrigation because the climatic pattern of the region fails to wash salts. These results support the classification regarding salinity. The influence of Na+ on Richards’ and pedological classification of Pantohypereutric Calcaric Leptic Cambisol (Loamic, Humic), an area cultivated with bananas, stood out.
The pH in the subsurface acted to release Al3+, and although the values were considered low, this is a warning sign because pH below 6.0 solubilizes Al3+ [45]. F2 explains the influence of Al3+ and H+ + Al3+ on pH reduction in the P2 profile fallow area. According to the area’s history, fallow was necessary as it became unfeasible to invest resources for soil tillage and fertilizer purchase for banana cultivation. In the Baixo-Açu Irrigation District, Justo et al. [14] showed electrical conductivity ranging from 0.69 dS m−1 to 152 dS m−1.
Hierarchical cluster analysis showed four groups. The profiles P1 and P2 formed the first group. The similarity of these profiles is due to the increase in EC and ESP in the subsurface. These areas have a history of intense land use, with plowing, harrowing, and fertigation practices. Continuous use of these areas without proper drainage management combined with edaphic factors intensified salinization. Excess salts in the soil cause osmotic imbalance. Decreased soil osmotic potential affects plants even in moist soils, and they do not absorb water due to osmotic imbalance. Plants can lose water from cells and tissues to the soil at high-salinity levels, a phenomenon called plasmolysis [44].
The P2 profile and P3 profile formed the second group. Their similarity is associated with Na+ contents in the subsurface, ESP, and clay fraction in the subsurface. The P2 profile forms the third group due to the aluminum presence in the subsurface. The history of the area’s use reflects the degradation conditions in the areas under intensive cultivation of bananas in the irrigation district. The Na+, K+, Ca2+, and Mg2+ contents increased in the subsurface, and EC increased in the subsurface. The contents of Al3+ and potential acidity (H+ + Al3+) were considered medium and occurred through the low leaching of Ca2+ and Mg2+ along the profile.
The P3 profile forms the fourth group because it is a preserved forest environment and belongs to a soil class different from the others. It stands out for having higher levels of the silt fraction in all horizons, indicative of young soil. It showed higher contents of Ca2+ and lower EC. The contents of the other attributes revealed little change between horizons and no restrictions regarding salinity. In the saprolitic horizons, the contents of Na+ were high due to the position in the landscape (colluvium), where the underlying lots drain the waters through natural channels. Chernossolos are soils of not very advanced development, originating from rocks rich in Ca2+ and Mg2+, with high-activity clay, and may eventually accumulate calcium carbonate [22].
The saline-sodic classification prevails because it is a shallow profile, and the root system of the planted crop has the highest accumulation in the 0–30 and 0–60 cm layers. The salinity effect in the root zone decreases water absorption by the roots due to the soil water potential reduction [12,13]. Plant water absorption decreases and compromises plant physiological development [45].
Arid and semi-arid regions have susceptibility to soil salinization. The climatic pattern associated with inadequate use of irrigation further intensifies soil degradation in the irrigated perimeters of the Northeast region of Brazil [46]. Very clayey soils with low permeability hinder the leaching of salts and enhance capillary rise [47]. This problem has made irrigated fruit growing unfeasible in the Açu Valley. A similar situation occurs in the Irrigated Perimeter of Pentecostes in Ceará State, Brazil, which has many abandoned lots due to salinization after 40 years of its implementation. In the Irrigated Perimeter of Custódia and Serra Talhada in Brazil, Freire et al. [48] observed that salinity and sodicity caused area abandonment because of the high concentrations of Na+ and ESP.
In the data collection process, smallholder farmers are much more accessible and collaborative. They actively participate in the production process at all stages—from planting to harvesting—and actively collaborate with research. Knowledge about soil classes and particle-size characteristics is necessary for irrigation management, soil correction, and soil conservation [32]. In this context, preventive activities to combat soil degradation in the Baixo-Açu Irrigation District require an integrated action of irrigation planning, agricultural suitability study, and soil control and prevention. These factors need to be discussed with farmers from an educational, collaborative, and interventionist perspective of government action.
The farmers named “piçarro macio” (Soft Saprolite Soil) during the winter and “piçarro duro” (Hard Saprolite Soil) during the summer, which corroborates Souza et al. [49] also recognized the “piçarro” (Saprolite Soil) term in the settlement areas of the Western Rio Grande do Norte, Brazil. The term “piçarro” (Saprolite Soil) is understood as rock concretions, which farmers reported as “not suitable for planting”. When moistened, slate does not aggregate, which makes it difficult for roots to penetrate the soil at a depth with few voids. Farmers identify and designate this term in subsurface horizons in a soil profile. Depending on the dry or rainy season, this material varies slightly in terms of consistency.
Horizons with darker colors indicate favorable characteristics for agriculture. The color is an indicator that provides an easy perception of the role played by organic matter in different decomposition stages in soil fertility [27]. They used “soil mixture” to characterize the inorganic sand, silt, and clay fractions. They consider that the P3 profile had a clay predominance. Farmers recognize soil quality through the presence of clay and the supply of organic matter [27]. The perception of the different environments based on texture allows the farmers to have better land use [50].
The term “salitada” was employed by the farmers to refer to soils that had become salinized. They add that the soil looks like fine dust and has no vegetation. Families with greater purchasing power receive constant technical assistance visits and start to incorporate technical terms used by input suppliers. In irrigation districts, the presence of development agencies is constant. Farmers interact much more with external development agents, adding concepts routinely used in academia, such as “salitre” (saltpeter), to their vocabulary. Couto [51] indicates that linguistic identity construction is constantly evolving, and the concept of appropriations forms the basis for linguistic identity construction, historically constructed through how we communicate.
There is a consensus among farmers that soil texture alters water drainage in the soil. Although all lots have surface drains, they are not enough to drain the water in the rainy season. They adopt irrigation management independent of soil texture but note that thinner clay accumulates in the subsurface. Farmers acknowledge that the drainage system for irrigation water is unsatisfactory. Profiles located in higher parts facilitate drainage, so few farmers use the drain. The farmers evaluated lands in higher parts of the landscape with deeper soil profiles. However, the areas where we opened the profiles had small channels that were insufficient for drainage.
The lighter-colored soil P2 profile area is considered low fertility (weak land) and shows pioneer plants such as Mimosa hostilis Benth. Thus, the farmers classified the P1 profile as “Terra de Salitre” (Salt Soil), the P2 profile as “Terra de Piçarro” (Saprolite Soil), and the P3 profile as “Terra Boa” (Good Soil). Alves et al. [52] also found the term “piçarro” in ethnopedological studies with potters in the Paraíba state, Brazil. The term “piçarro” used by the farmers refers to the saprolite.
When in contact with dry and wet soil, farmers rated its consistency as very easy to press and mold. When applying the test for the observation of clay dispersion, the farmers recognize that when the water forms puddles in an environment, its color remains “toldada”, a term used to define clay dispersion in an aqueous medium in these environments. They do not relate this characteristic to the presence of Na+ ions in water, and the carbonate presence is related to “piçarro” in shallower soils. The farmers were unaware of the effervescence of carbonate in contact with 10% hydrochloric acid. Despite that, they associated a strong degree of effervescence with the P1 profile. The smallholder farmers elected indicator plants as the main characteristic of salinized environments. They know the plants that indicate degraded environments and underline them as “Melosa”, Stemodia maritima Linn., and “Pirrixiu”, Blutaparon portulacoides A. St.-Hil.
5. Conclusions
The research revealed that ethnopedological knowledge is highly valuable and practical. The results suggest that the importance of local soil knowledge should be recognized and appreciated in order to obtain better results in scientific research and land use. It is fundamental to integrate local soil knowledge meaningfully into scientific research to ensure its recognition. Smallholder farmers noticed variations in the inorganic fractions in profiles that present clay accumulation in the subsoil, resulting in hardness in the dry season and restricting water infiltration in the rainy season, calling such soils “salão” (Fragipan Horizon—The term used by farmers to designate a large amount of clay, a type of fragipan). The carbonate horizon was called “Lajão” (Coarser material—the term used by farmers to designate coarser material, which may be of carbonate origin). According to local soil knowledge, the farmers classified the P1 profile as “Terra de Salitre” (Salt Soil—The term used by farmers to identify soil with the presence of salts, not suitable for cultivation), the P2 as “Terra de Piçarro” (Saprolite Soil—The term Piçarro is understood as rock concretions, which farmers reported as “not suitable for planting), and the P3 profile as “Terra Boa” (Good Soil—The soil is considered by farmers to have good agricultural suitability for crops), the last one without salinity problems. Researchers classified the P1 profile as a Pantohypereutric Calcaric Leptic Cambisol (Loamic, Humic), the P2 profile as a Pantohypereutric Calcaric Leptic Cambisol (Loamic, Humic), and the P3 profile as a Leptic Calcic Chernozem (Loamic), which were classified regarding salinity as Saline-sodic (P1 and P3) and Saline (P2).
Author Contributions
Conceptualization, methodology, validation, formal analysis, J.F.d.S., M.F.N., J.C.P., D.F.d.F., N.d.S.D. and F.V.d.S.S.; investigation, resources, and data curation, J.F.d.S., M.F.N., J.C.P., J.F.d.M., S.B.d.M. and J.E.F.G.; writing—original draft preparation, writing—review and editing, visualization, supervision, project administration, and funding acquisition, J.F.d.S., M.F.N., N.d.S.D., T.D.C.P. and F.V.d.S.S. All authors have read and agreed to the published version of the manuscript.
Funding
This study was financed in part by the Coordination for the Improvement of Higher Education Personnel—Brazil (CAPES), Finance Code 001.
Data Availability Statement
The original contributions presented in the study are included in the article, further inquiries can be directed to the corresponding author.
Acknowledgments
We would like to thank the professors and students at the Universidade Federal Rural do Semi-Árido (UFERSA) for their support, from the selection of the study site to the classification of the soil profiles. We would like to extend a special thanks to Francisco Ernesto Sobrinho (In memoriam) for the invaluable time, attention, and knowledge he shared with us all. We would also like to thank all the smallholder farmers, women, and men who contributed to this research for the welcome and attention they gave to the research team when carrying out the questionnaires and for their valuable experience with LSK.
Conflicts of Interest
The authors declare no conflicts of interest.
Appendix A


References
- Andrade, E.M.; Meireles, A.C.M.; Alexandre, D.M.B.; Palácio, H.A.Q.; Lima, C.A. Investigation of the changes in the status of soil salinity using multivariable analysis. Rev. Bras. Eng. Agrícola Ambient. 2011, 15, 410–415. [Google Scholar] [CrossRef]
- Jiménez, L.; Jiménez, W.; Felicito, D.; Fierro, N.; Quichimbo, P.; Sánchez, D.; Capa-Mora, D. Rediscovering the edaphic knowledge of smallholder farmers in southern Ecuador. Geoderma 2022, 406, 115468. [Google Scholar] [CrossRef]
- Matos, L.D.V.; Ker, J.C.; Cardoso, M.I.; Lani, J.L.; Schaefer, C.E.G.R. Local knowledge and ethnopedology the study of agroecosystems maroon community of Brejo dos Crioulos (Minas Gerais, Brazil). Soc. Nat. 2014, 26, 497–510. [Google Scholar] [CrossRef]
- Nezomba, H.; Mtambanengwe, F.; Tittonell, P.; Mapfumo, P. Practical assessment of soil degradation on smallholder farmers’ fields in Zimbabwe: Integrating local knowledge and scientific diagnostic indicators. Catena 2017, 156, 216–227. [Google Scholar] [CrossRef]
- Occelli, M.; Mantino, A.; Ragaglini, G.; Dell’Acqua, M.; Fadda, C.; Pè, M.E.; Nuvolari, A. Traditional knowledge affects soil management ability of smallholder farmers in marginal areas. Agron. Sustain. Dev. 2021, 41, 9. [Google Scholar] [CrossRef]
- Huynh, H.T.N.; Bruyn, L.A.L.; Knox, O.G.G.; Hoang, H.T.T. Means and ways of engaging, communicating and preserving local soil knowledge of smallholder farmers in Central Vietnam. Agric. Hum. Values 2022, 39, 1039–1062. [Google Scholar] [CrossRef]
- Mashamaite, C.V.; Albien, A.J.; Mothapo, P.N.; Pieterse, P.J.; Phiri, E.E. Local knowledge, perceptions, and uses of the potentially conflict-generating plant species, Moringa oleifera lam.: A case study in Limpopo province, South Africa. Hum. Ecol. 2023, 51, 979–994. [Google Scholar] [CrossRef]
- Kumah, F.J.; Kouabenam, A.; Gebrekirstos, A.; Koné, D.; Adjei-Nsiah, S. Do farmers’ perceptions and socio-economic factors drive cocoa agroforestry and sustainable soil carbon management practices in West Africa? Agrofor. Syst. 2024, 98, 797–815. [Google Scholar] [CrossRef]
- Jameel, J.; Anwar, T.; Majeed, S.; Qureshi, H.; Siddiqi, E.H.; Sana, S.; Zaman, W.; Ali, H.M. Effect of salinity on growth and biochemical responses of brinjal varieties: Implications for salt tolerance and antioxidant mechanisms. BMC Plant Biol. 2024, 24, 128. [Google Scholar] [CrossRef] [PubMed]
- Machado, R.M.A.; Serralheiro, R.P. Soil Salinity: Effect on vegetable crop growth. Management practices to prevent and mitigate soil salinization. Horticulturae 2017, 3, 30. [Google Scholar] [CrossRef]
- Amiripour, H.; Hashemloian, B.D.; Azimi, A.A. Morpho–physiological responses of Rocket (Eruca sativa L.) varieties to sodium sulfate (Na2SO4) stress: An experimental approach. Acta Physiol. Plant. 2016, 38, 246. [Google Scholar] [CrossRef]
- Parida, A.K.; Das, A.B. Salt tolerance and salinity effects on plants: A review. Ecotoxicol. Environ. Saf. 2005, 60, 324–349. [Google Scholar] [CrossRef] [PubMed]
- Sá, F.V.d.S.; Mesquita, E.F.; Bertino, A.M.P.; Costa, J.D.; Araújo, J.L. Influence of plaster and biofertilizer on chemical attributes of a saline sodic soil and on initial growth of sunflower. IRRIGA 2015, 20, 46–59. [Google Scholar] [CrossRef]
- Justo, J.F.A.; Barreto, A.C.; Silva, J.F.; Ferreira Neto, M.; Sá, F.V.d.S.; Oliveira, R.P. Identification and diagnosis of salt-affected soils in the Baixo-Açu irrigated perimeter, RN, Brazil. Rev. Bras. Eng. Agrícola Ambient. 2021, 25, 480–484. [Google Scholar] [CrossRef]
- Nath, A.J.; Lal, R.; Das, A.K. Ethnopedology and soil Properties in bamboo (Bambusa sp.) based agroforestry system in North East India. Catena 2015, 135, 92–99. [Google Scholar] [CrossRef]
- Ramalho Filho, A. Planejamento de uso das terras para fins agrícolas (Portuguese). In Manejo e Conservação do Solo e da Água; Bertol, I., Maria, I.C., Souza, L.S., Eds.; Editora UFV: Viçosa, Brazil, 2019; pp. 621–632. [Google Scholar]
- Toledo, V.; Barrera-Bassols, N. Memória Biocultural: A Importância Ecológica das Sabedorias Tradicionais; Expressão Popular: São Paulo, Brazil, 2015. (In Portuguese) [Google Scholar]
- Oliveira, M.; Resende, M. Os solos aluviais eutróficos (Fluventes) no Baixo Açu-RN e a adoção da agricultura de altos insumos: Problemas e perspectivas. Rev. Caatinga 1990, 7, 220–255. (In Portuguese) [Google Scholar]
- Albano, G.P.; Sá, A.J. Public Policies and Agricultural Globalization in Vale of Açu-RN. Rev. Geogr. 2008, 25, 58–80. [Google Scholar]
- Angelim, L.A.A.; Medeiros, V.C.; Nesi, J.R. Programa Geologia do Brasil–PGB. Projeto Geologia e Recursos Minerais do Estado do Rio Grande do Norte. Mapa geológico do Estado do Rio Grande do Norte; Escala. 1:500.000; CPRM/FAPERN: Recife, Brazil, 2006. (In Portuguese) [Google Scholar]
- Alvares, C.A.; Stape, J.L.; Sentelhas, P.C.; Gonçalves, J.L.M.; Sparovek, G. Köppen’s climate classification map for Brazil. Meteorol. Z. 2013, 22, 711–728. [Google Scholar] [CrossRef]
- Santos, H.G.; Jacomine, P.K.T.; Anjos, L.H.C.; Oliveira, V.A.; Lumbreras, J.F.; Coelho, M.R.; Almeida, J.A.; Araújo Filho, J.C.; Oliveira, J.B.; Cunha, T.J.F. Sistema Brasileiro de Classificação de Solos, 5th ed.; Embrapa Solos: Brasília, Brazil, 2018. (In Portuguese) [Google Scholar]
- World Reference Base for Soil Resources—WRB. International Soil Classification System for Naming Soils and Creating Legends for Soil Maps, 4th ed.; International Union of Soil Sciences (IUSS): Vienna, Austria, 2022. [Google Scholar]
- Gee, G.W.; Or, D. Particle-size analysis. In Methods of Soil Analysis, Part 4, Physical Methods; Dane, J.H., Topp, G.C., Eds.; Soil Science Society of America: Madison, WI, USA, 2002; pp. 255–293. [Google Scholar]
- Teixeira, P.C.; Donagemma, G.K.; Fontana, A.; Teixeira, W.G. Manual de Métodos de Análise de Solo, 3rd ed.; EMBRAPA: Brasília, Brazil, 2017. (In Portuguese) [Google Scholar]
- Richards, L.A. Diagnosis and Improvement of Saline and Alkali Soils; United States Department of Agriculture: Washington, DC, USA, 1954. [Google Scholar]
- Hair, J.; Black, W.; Babin, B.Y.A.; Anderson, R.; Tatham, R. Multivariate Data Analysis, 7th ed.; Pearson Prentice Hall: Hoboken, NJ, USA, 2010. [Google Scholar]
- Ribas, J.V.; Vieira, P.R.C. Análise Multivariada com o uso do SPSS, 1st ed.; Editora Moderna: Rio de Janeiro, Brazil, 2011. [Google Scholar]
- Vicini, L.; Souza, A.M.; Morales, F.E.C.; Souza, F.M. Técnicas Multivariadas Exploratórias: Teorias e Aplicações no Software Statistica, 1st ed.; Editora UFSM: Santa Maria, Brazil, 2018. [Google Scholar]
- Statsoft. Statistica, Version 7.0; Statsoft: Tulsa, OK, USA, 2004.
- Pessoa, L.G.M.; Freire, M.B.S.; Araújo Filho, J.C.; Santos, P.R.; Miranda, M.F.A.; Freire, J.F. Characterization and classification of halomorphic soils in the semiarid region of Northeastern Brazil. J. Agric. Sci. 2019, 11, 405–418. [Google Scholar] [CrossRef]
- Costa, J.D.; Portela, J.C.; Farias, P.K.P.; Ernesto Sobrinho, F.; Souza, C.M.M.; Lopes, T.C.S.; Silva, F.W.A. Characterization, and classification of soil of the Terra de Esperança settlment in Chapada do Apodi, Brazil. J. Agric. Sci. 2019, 11, 235–252. [Google Scholar] [CrossRef]
- Ribeiro, M.R.; Ribeiro Filho, M.R.; Jacomine, P.K.T. Origem e classificação dos solos afetados por sais. In Manejo da Salinidade na Agricultura: Estudos Básicos e Aplicados, 2nd ed.; Gheyi, H.R., Dias, N.S., Lacerda, C.F., Gomes Filho, E., Eds.; INCTsal: Fortaleza, Brazil, 2016; pp. 9–16. (In Portuguese) [Google Scholar]
- RADAMBRASIL. Folhas SB. 24/25 Jaguaribe/Natal: Geologia, Geomorfologia, Pedologia, Vegetação, uso Potencial da Terra/Projeto RADAMBRASIL; Ministério das Minas e Energia: Rio de Janeiro, Brazil, 1981; Volume 23. (In Portuguese) [Google Scholar]
- Mota, J.C.A.; Assis Júnior, R.N.; Amaro Filho, J.; Libardi, P.L. Some physics and hydraulics properties of three soils in the Apodi Tableland, RN, cultivated with musk melon. Rev. Bras Ciência Solo 2008, 32, 49–58. [Google Scholar] [CrossRef]
- Yadav, D.S.; Jaiswal, B.; Gautam, M.; Agrawal, M. Soil Acidification and its Impact on Plants. In Plant Responses to Soil Pollution; Singh, P., Singh, S.K., Prasad, S.M., Eds.; Springer: Singapore, 2020; pp. 1–26. [Google Scholar] [CrossRef]
- Costa, M.C.G.; Mioti, A.A.; Ferreira, T.O.; Romero, R.E. Nutrient contents and viability of banana cropping in Cambisols with different depths. Bragantia 2016, 75, 335–343. [Google Scholar] [CrossRef][Green Version]
- Mantovanelli, B.C.; Campos, M.C.C.; Alho, L.C.; Franciscon, U.; Nascimento, M.F.; Santos, L.A.C. Spatial distribution of soil acidity components in natural field area in the region Humaitá, Amazonas. Rev. Ciências Agroambientais 2016, 14, 1–9. [Google Scholar]
- Ferreira, P.A.; Silva, J.B.L.; Ruiz, H.A. Aspectos físicos e químicos em regiões árias e semiáridas. In Manejo da Salinidade na Agricultura: Estudos Básicos e Aplicados, 2nd ed.; Gheyi, H.R., Dias, N.S., Lacerda, C.F., Gomes Filho, E., Eds.; INCTsal: Fortaleza, Brazil, 2016; pp. 17–34. (In Portuguese) [Google Scholar]
- Centeno, L.N.; Guevara, M.D.F.; Cecconello, S.T.; Sousa, R.O.D.; Timm, L.C. Textura do solo: Conceito e aplicações em solos arenosos. Rev. Bras. Eng. Sustentabilidade 2017, 4, 31–37. [Google Scholar] [CrossRef]
- Gomide, O.; Silva, P.H.N.; Soares, C.R.F.S. Physical, chemical and biological soil properties of gully environments in Lavras—MG. Rev. Bras. Ciência Solo 2011, 35, 567–577. [Google Scholar] [CrossRef]
- Morais, F.; Melo, J.G.; Medeiros, J.I.; Srivastava, N.K.; Diniz Filho, J.B.; Lopes, V.L.; Oliveira, J.A.; Vasconcelos, M.B. Comportamento das Bacias Sedimentares da Região Semi-Árida do Nordeste Brasileiro, 1st ed.; CPRM/FINEP: Recife, Brazil, 2005. (In Portuguese) [Google Scholar]
- Castro, F.C.; Santos, A.M. Salinity of the soil and the risk of desertification in the semiarid region. Mercator 2020, 19, e19002. [Google Scholar] [CrossRef]
- Dias, N.D.; Blanco, F.F.; Souza, E.R.; Ferreira, J.F.S.; Sousa Neto, O.N.; Queiroz, I.S.R. Efeitos dos sais na planta e tolerância das culturas à salinidade. In Manejo da Salinidade na Agricultura: Estudos Básicos e Aplicados, 2nd ed.; Gheyi, H.R., Dias, N.S., Lacerda, C.F., Gomes Filho, E., Eds.; INCTsal: Fortaleza, Brazil, 2016; pp. 151–161. (In Portuguese) [Google Scholar]
- Echart, C.L.; Molina, S.C. Aluminum phytotoxicity: Effects, tolerance mechanisms and its genetic control. Ciência Rural 2001, 31, 531–541. [Google Scholar] [CrossRef]
- Pedrotti, A.; Chagas, R.M.; Ramos, V.C.; Prata, A.P.N.; Lucas, A.A.T.; Santos, P.B. Causes and consequences of the process of soil salinization. REGET 2015, 19, 1308–1324. [Google Scholar]
- Holanda, J.S.; Amorim, J.R.A.; Ferreira Neto, M.; Holanda, A.C.; Sá, F.V.d.S. Qualidade da água para irrigação. In Manejo da Salinidade na Agricultura: Estudos Básicos e Aplicados, 2nd ed.; Gheyi, H.R., Dias, N.S., Lacerda, C.F., Gomes Filho, E., Eds.; INCTsal: Fortaleza, Brazil, 2016; pp. 35–50. (In Portuguese) [Google Scholar]
- Freire, M.B.G.S.; Miranda, M.F.A.; Oliveira, E.M.; Silva, L.E.; Pessoa, L.G.M.; Almeida, B.G. Grouping of soils in relation to salinity in Irrigated Perimeter of Custódia in function of time. Rev. Bras. Eng. Agrícola Ambient. 2014, 18, 86–91. [Google Scholar] [CrossRef]
- Souza, R.O.; Portela, J.C.; Martins, C.C.M.; Dias, N.S.; Cavalcante, J.S.J.; Silva, J.F.; Sousa Junior, F.S.; Sá, F.V.S. Soil attributes in agricultural uses and in the Semiarid RN-Brazil in eutrophic Cambisol. Afr. J. Agric. Res. 2015, 10, 3636–3643. [Google Scholar] [CrossRef]
- Finato, T.; Nascimento, P.C.; Beck, F.L.; Tornquist, C.G.; Caetano, L.A.M.; Fedrizzi, T.Z. Local perceptions of soils and their use in the municipality of Gravatai, RS, Brazil. Rev. Bras. Ciência Solo 2015, 39, 915–923. [Google Scholar] [CrossRef]
- Couto, H.H. A metodologia na linguística ecossistêmica. Rev. Bras. Ecol. Ling. 2018, 4, 18–33. [Google Scholar]
- Alves, A.G.C.; Marques, J.G.W. Etnopedologia: Uma nova disciplina? In Tópicos em Ciência do Solo. Sociedade Brasileira de Ciência do Solo; Vidal-Torrado, P., Alleoni, L.R.F., Cooper, M., Silva, A.P., Cardoso, E.J., Prochnow, L.I., Eds.; SBCS: Viçosa, Brazil, 2005; pp. 321–344. (In Portuguese) [Google Scholar]


Disclaimer/Publisher’s Note: The statements, opinions and data contained in all publications are solely those of the individual author(s) and contributor(s) and not of MDPI and/or the editor(s). MDPI and/or the editor(s) disclaim responsibility for any injury to people or property resulting from any ideas, methods, instructions or products referred to in the content. |
© 2024 by the authors. Licensee MDPI, Basel, Switzerland. This article is an open access article distributed under the terms and conditions of the Creative Commons Attribution (CC BY) license (https://creativecommons.org/licenses/by/4.0/).