Abstract
Urban park green spaces not only significantly enhance urban environmental quality, but also increase social interactions, making them a crucial factor in urban vitality, particularly in densely populated and ecologically stressed metropolitan areas. This study utilizes panel data from 35 major cities in China from 2012 to 2022 to analyze the impact of per capita urban park green space areas on urban vitality. The results confirm the significant effect of per capita park green space areas on urban vitality. However, this impact diminishes under the single-threshold conditions of GDP and total park green space areas, as well as the double-threshold condition of total population. Based on these findings, the study proposes policy recommendations emphasizing the importance of park green space construction to promote sustainable urban development and improve residents’ quality of life.
1. Introduction
Urban vitality symbolizes the liveliness and dynamism of a city, largely determining its attractiveness and competitiveness. It is a fundamental element in achieving urban quality of life, as a vibrant city can better address the challenges it continuously faces [1]. Since Jacobs first introduced the concept of “urban vitality”, scholars have analyzed its influencing factors from various perspectives. As an essential component of urban infrastructure, green spaces not only improve urban environmental quality, mitigate urban heat island effects, and provide ecosystem services, but they also enhance residents’ physical and mental health, quality of life, and well-being [2]. Policymakers have increasingly recognized the importance of green spaces, leading to the development of various types of policies. The United Nations 2030 Agenda for Sustainable Development outlines 17 Sustainable Development Goals (SDGs), with SDG 11 aiming to “make cities and human settlements inclusive, safe, resilient, and sustainable”. Green spaces are recognized as a critical element and the agenda explicitly calls for the expansion of urban green spaces. This aligns with the broader goal of increasing urban vitality. Subsequently, the International Guidelines on Urban and Regional Planning issued by UN-Habitat emphasize that sustainable management can be achieved by identifying, revitalizing, protecting, and creating green spaces through urban and territorial planning. The Third United Nations Conference on Housing and Sustainable Urban Development (Habitat III) in 2016 also highlighted the need to promote safe, inclusive, and accessible green public spaces. It noted that good urban planning is crucial for achieving this goal. This conference is held once every 20 years. Meanwhile, the World Health Organization’s Healthy Cities Initiative also points out that urban green spaces should be integrated into the planning of healthy cities to reduce air pollution and enhance the physical and mental health of residents. The official Global Standard for Nature-based Solutions (NbS), introduced by the International Union for Conservation of Nature (IUCN) in 2020, further provides a framework for the implementation of urban green space development.
Many regions, countries, and cities are actively promoting urban green space planning to meet the requirements of sustainable development. The European Green Deal, proposed by the European Commission in 2019, encourages countries to promote green infrastructure, primarily focused on urban parks and green spaces, to improve residents’ quality of life and enhance cities’ ability to cope with climate challenges. The Barcelona Green Infrastructure and Biodiversity Plan 2020, Singapore’s Garden City initiative, the London Environment Strategy and Zero Carbon London Plan, along with New York’s PlaNYC: Getting Sustainability Done, all underscore the critical role of green spaces in promoting sustainable development and social benefits.
Over the past few decades, the Chinese government has consistently prioritized the development of parks and green spaces. Between 2012 and 2021, the green coverage rate in urban built-up areas increased from 39.22% to 42.06%, while per capita park green space grew from 11.8 square meters to 14.78 square meters. In 2021, the General Office of the Central Committee of the Communist Party of China and the General Office of the State Council issued the “Opinions on Promoting Green Development in Urban and Rural Construction”. Following this, the “14th Five-Year Plan for National Urban Infrastructure Construction” released in 2022 further emphasized the need to strengthen the construction of urban parks and green spaces from various perspectives. In 2022, the State Council approved Chengdu as a demonstration zone for building a park city. The construction of park city demonstration zones and green spaces serves as an effective approach to addressing urban challenges such as the ongoing reduction of ecological space in megacities, pressure on public service facilities, and insufficient governance capacity. These initiatives explore new pathways for the high-quality development of megacities [3]. Cities like Shanghai, Shenzhen, Guangzhou, Qingdao, Nanning, and Changsha have accordingly introduced various guidelines, long-term strategies, short-term construction plans, and action plans related to park city construction. These policies not only highlight the importance of green space development but also aim to enhance urban competitiveness and improve residents’ quality of life [4]. At the same time, they present unprecedented opportunities and challenges for boosting urban vitality [5].
However, in practice, park green space construction still faces many challenges. As the largest developing country, China exhibits significant regional disparities. Due to differences in geographical location, economic development levels, and urban planning, there are notable differences in the current state and effectiveness of park green spaces across different cities. Some cities may face issues such as insufficient green spaces or inadequate management. These challenges provide a unique context for exploring the impact of green space construction on urban vitality. Therefore, this study aims to analyze urban vitality in the context of urban development using 35 large and medium-sized cities as examples. By examining the influence of park green space areas on urban vitality, this study seeks to explore how expanding the scale and quality of park green spaces can improve urban environments and enhance urban vitality.
2. Literature Review
Early studies on urban vitality primarily focused on qualitative analysis. Jacobs believed that the increase in functions, scale, cultural characteristics, and population could promote the vitality of urban spaces [6]. In later stages, scholars from various countries gradually adopted quantitative analysis methods, exploring different indicators from aspects such as natural conditions, environmental quality, public services, industrial economy, spatial morphology, and policy orientation. Tu et al. (2020) examined changes in 15 megacities in China, concluding that urban vitality indices were relatively higher in prosperous areas [7]. Guo et al. (2021) found that the concentration of specific land uses also affects urban vitality, with land use concentration being positively correlated with the intensity of street vitality [8]. Zumelzu et al. (2019) argued that urban morphology could influence urban vitality, which can be specifically subdivided into land use mix, block size, plot size, and the adaptability of building uses [9]. Xia et al. (2020) revealed the complexity of the relationship between urban land use and vitality, using five megacities in China as examples, emphasizing the importance of considering land use functions and temporal cycles in urban planning and development strategies [10]. Lan et al. (2020) studied the impact of social infrastructure and population inflow on urban vitality, finding that increased fiscal investment in social infrastructure can effectively enhance urban vitality, while population inflow influences urban vitality through its interaction with social infrastructure [5]. Chen et al. (2023) discovered that vibrant cities characterized by numerous social venues (e.g., cafes) tend to exhibit higher levels of innovation, suggesting that urban vitality can stimulate innovative capacity [4]. Li et al. (2022) identified population density, community age, open space, sidewalk proportion, street lighting, shopping and leisure density, integration, and proximity to transportation as positive factors triggering urban vitality [11]. Some scholars have also used nighttime light data to analyze urban nighttime vitality [12,13].
Green spaces integrate diverse urban functions and are important places for residents to engage in leisure, exercise, and social activities such as gatherings. Analyzing their use can help enhance the vitality of urban socio-economic development. Register (2006), in his theory of eco-cities, emphasized that the construction of green spaces is not merely for beautifying cities but serves as a vital component of urban ecological networks. These spaces provide residents with fresh air, livable environments, and sustainable lifestyles. Such favorable environmental conditions enhance a city’s attractiveness, drawing more residents and enterprises to participate in urban activities, thereby boosting both the economic and social vitality of the city [14]. Whyte (1980) and Oldenburg (2001) argued that green spaces, serving as open public areas, can enhance social interactions among residents and foster the development of social networks and community cohesion. These factors collectively contribute to the overall vitality of urban environments [15,16]. Gesler (2011) pointed out that green spaces can promote both physical and mental health. Healthier residents tend to be more productive and creative, enabling them to participate more actively in various economic and social activities within the city, thereby directly contributing to the enhancement of urban vitality [17]. Kaplan (1995) also emphasized that green spaces play a crucial role in psychological restoration. They help reduce mental fatigue, enhance concentration, and provide a sense of tranquility. Moreover, green spaces alleviate stress and improve residents’ overall well-being [18]. Residents living in densely built environments need to visit open spaces or other recreational destinations more frequently for green spaces and other leisure opportunities during their free time [19,20]. Green infrastructure, such as open green spaces, parks, forests, and gardens, become venues for citizens to stimulate social interactions, sustainable tourism, and green growth [21].
As research has deepened, scholars have developed a more comprehensive understanding of the impact of green spaces on urban vitality. Lopes and Camanho (2013) argued that public green spaces play a significant role in urban vitality, finding that the mere availability of urban green spaces is insufficient to significantly improve urban vitality without considering factors such as space maintenance and recreational opportunities [22]. Baris et al. (2010) explored how greenways, besides improving physical and mental health, provide social interaction opportunities, which can stimulate the economy of communities and cities and positively impact urban vitality [23]. Pirmoradian and Ashtari (2020) used descriptive analysis methods to investigate the socio-economic and ecological functions of urban green spaces, finding that the indirect social, cultural, and economic functions of green spaces play a crucial role in improving the quality of life for citizens, bringing vitality to urban centers and surrounding areas [24]. Using four European cities as case studies, Van et al. (2016) concluded through survey research that longer time spent in green spaces is associated with better physical and mental health [25].
Some new studies also focus on the performance of urban parks [26,27,28]. Lee and Jung (2022) found that parks are considered to have a significant impact on urban vitality, but their influence varies depending on their type. Relatively large and well-known urban nature parks and theme parks positively impact urban vitality [29]. Other scholars have noted the convenience of access to parks and plazas [30,31]. For large cities with higher economic levels, such as Beijing and Shanghai, urbanization rates have reached their peak, with improvements in transportation networks, functional mix, and public service facilities. Most public spaces, such as parks and plazas, have shifted towards the process of stock improvement, gradually meeting the higher-level needs of residents. Parks and plazas in medium-sized cities are still in the incremental development stage [2]. The continuously increasing density in metropolitan cities, after reaching the “climax stage” can cause environmental pressures. Without sufficient public transportation and infrastructure, higher density may lead to a sharp decline in the quality of urban life [32].
However, the inequality in per capita urban green spaces has not been well addressed among China’s diverse cities [33]. There are significant disparities in the accessibility of urban green spaces in China [34]. Lan et al. (2020) also showed that in Chinese cities, increasing urban density does not promote urban vitality without the support of social infrastructure [5]. Liu et al. (2022) discovered that the correlation between urban economic vitality and urban forest landscape pattern indices exhibits significant spatial heterogeneity [35]. Xia et al. (2022) conducted a comparative analysis of China’s megacities, revealing that connectivity, compactness, building layout, landmark buildings, transportation facilities, and open and green spaces significantly influence urban vitality, indicating that urban spaces with these conditions may not always remain attractive [36].
Even so, few scholars have comprehensively analyzed the impact of park green space areas on urban vitality during the urbanization process and its diversity across different stages of urban development. Analyzing these aspects can help us understand the mechanisms through which park green spaces affect urban vitality and the synergistic development effects with related elements. This is practically significant for enhancing park green space construction and achieving sustainable development in large and medium-sized cities.
This study investigates how urban park green space development influences urban vitality in major cities of developing countries like China, where there is high population density and significant pressure from economic development and ecological conservation. The findings confirm a significant positive impact of per capita urban park green space areas on urban vitality. This study also explores the nonlinear mechanism of the impact of per capita urban park green space areas on urban vitality by considering the threshold effect. This research provides empirical evidence and theoretical insights for building livable, green, and vibrant urban environments.
The remainder of this paper is structured as follows: Section 3 presents the rationale for selecting the sample cities, the reasons for choosing specific indicators, the models and methods employed, and the data sources. Section 4 reports the research findings from the baseline model and threshold analysis. Section 5 discusses the results. Finally, Section 6 provides the research conclusions, offers policy implications, and addresses the study’s limitations.
3. Materials and Methods
3.1. Study Area
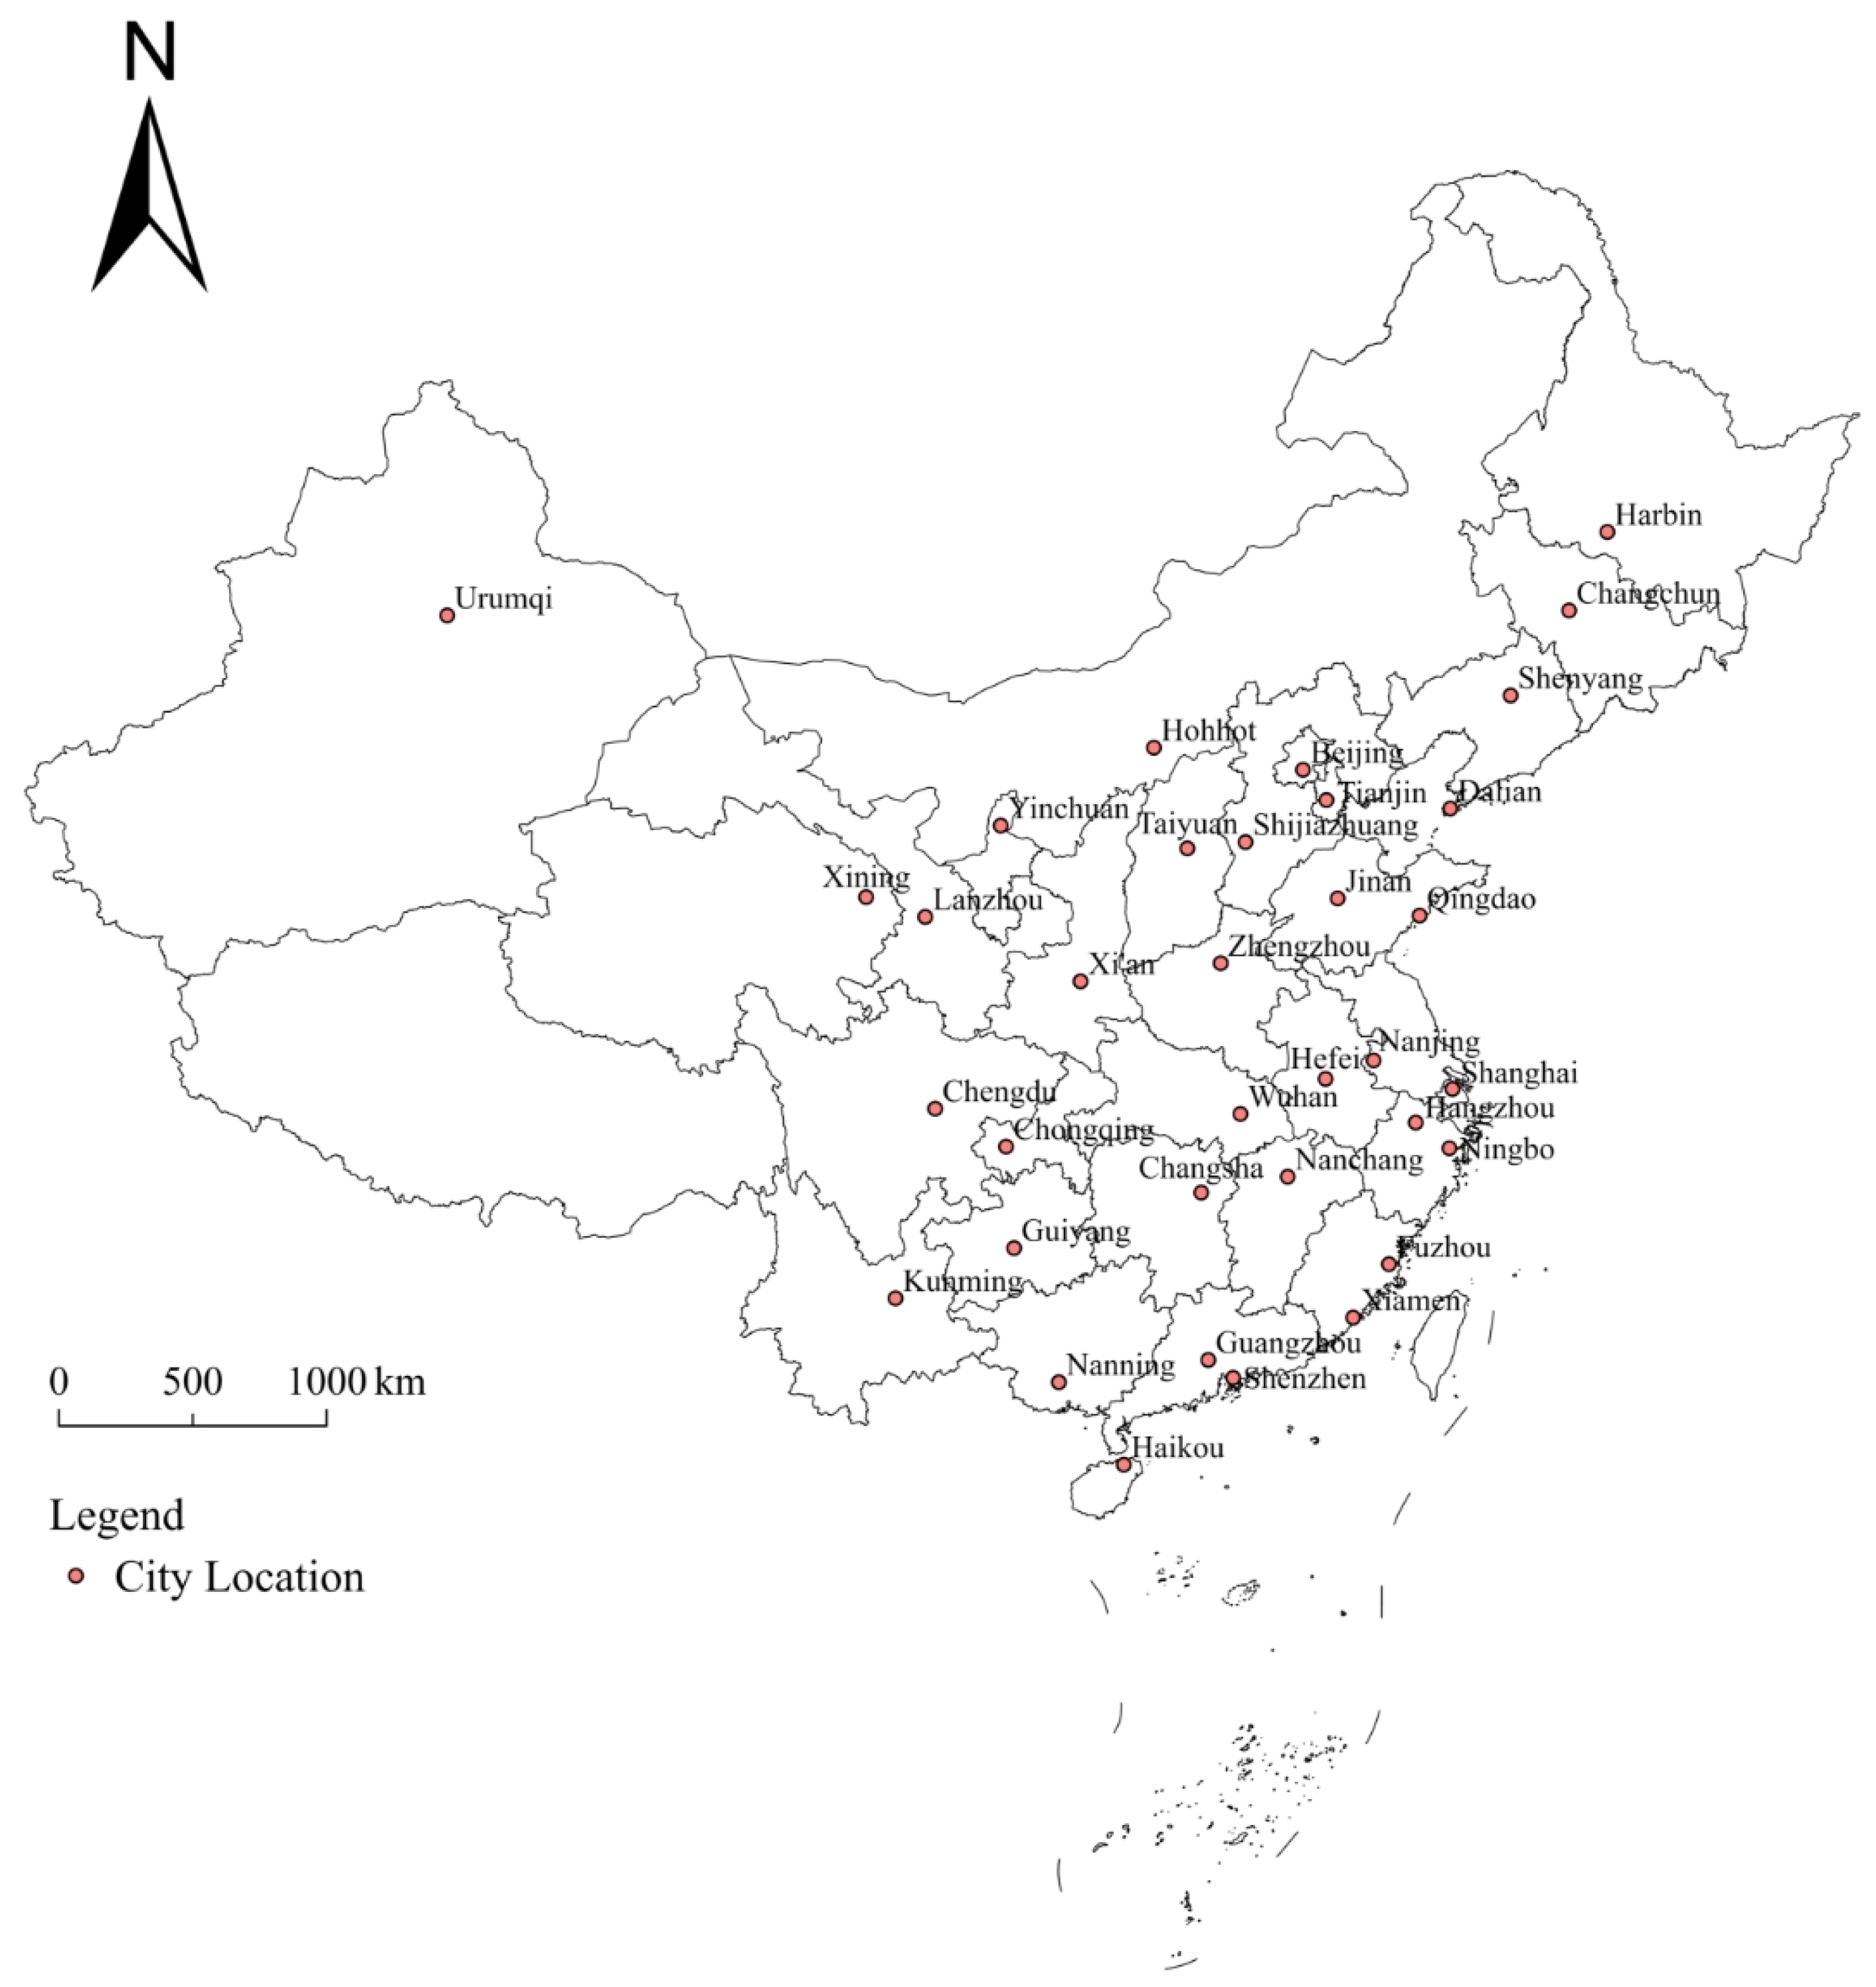
The 35 large and medium-sized cities in this study include Beijing, Shanghai, Tianjin, and Chongqing, which are the 4 municipalities directly under the Central People’s Government, with the same administrative status as provinces, autonomous regions, and special administrative regions. The study also includes 26 inland provincial capitals and autonomous region capitals (Lhasa was excluded from the selected cities due to its location on the Qinghai-Tibet Plateau, as well as its relatively small economic scale and population size), and five cities with independent planning status that have economic management authority equivalent to the provincial level. Figure 1 shows the geographical locations of these cities within China. The base map is sourced from the 1:10,000,000 scale standard map of China, hosted by the National Geoinformation Public Service Platform, under the Ministry of Natural Resources of China. This platform provides a variety of fundamental, public, and authoritative online geoinformation services to society.

Figure 1.
Location of the 35 large and medium-sized cities.
The 35 selected cities, characterized by high economic development levels and population densities, face challenges such as shrinking ecological spaces and pressures on public service facilities. Some of these cities contend with issues such as suboptimal air quality, urban heat island effects, and traffic congestion. Expanding and optimizing urban park green spaces can strengthen the ecological foundation of these cities, effectively addressing key urban challenges. However, the relative scarcity of green space resources in these areas amplifies the difficulty of increasing per capita park green space. The relatively advanced infrastructure in these cities allows for enhancements in the quality of green space services. Consequently, measures to enhance urban vitality through green space development are more complex and warrant further exploration. The high utilization rates of green spaces by residents underscore their multifunctionality, thus exerting a significant influence on the overall vitality and attractiveness of these cities. Moreover, due to their robust economic capacity and ample policy resources, these 35 large and medium-sized cities often play a demonstrative role in green space planning and development.
Therefore, this study focuses on these 35 cities as the research subjects. Their representative development of park green spaces strengthens the applicability of the findings. It also offers both theoretical and practical foundations for designing more scientific and rational park green space planning and policies. These insights can be applied to similar regions worldwide.
3.2. Variable Selection
Urban vitality (UV) is the ability of an urban system to sustain its internal survival, growth, and development. It is a complex economic and cultural phenomenon as well as a social process [37]. Referencing some existing literature and Jacobs’ early descriptions of urban vitality, this study selects population density, total retail sales of consumer goods, per capita road area, and land use diversity index to comprehensively reflect a city’s vitality from a macro perspective [5,38,39,40,41,42]. Population density reflects the degree of population concentration and can facilitate social interaction and economic activity, often considered a core element of urban vitality [43]. Retail sales of consumer goods provide a comprehensive view of residents’ daily behavior, consumption capacity, and quality of life, serving as a key connecting element in socio-economic interactions [44]. Per capita road area indicates urban traffic accessibility and commuting convenience, directly influencing residents’ quality of life and business production efficiency, and is a fundamental supporting element of urban vitality [45]. Land use diversity, through rational land allocation and use, enhances interactions among various socio-economic activities and plays a crucial role in creating job opportunities and enriching urban spatial functions [46].
Considering the issue of inconsistent data dimensions, the min–max normalization method is used to standardize each indicator, and the weighted average method is employed to synthesize the urban vitality index. The land use diversity index is calculated using the Shannon entropy (SHDI) method [47], with the main land use functions including residential land, public administration and public service land, commercial and business facilities land, industrial and manufacturing land, logistics and warehouse land, road and transportation land, municipal utility land, and green spaces and plazas.
The main explanatory variable is per capita park green space area (PG). Park green area is the most important indicator of urban green space, providing actual recreational and leisure space for urban residents, improving air quality, driving the development and transformation of related cultural, sports, and tourism industries, promoting residents’ mental and physical health, and enhancing the city’s image. Per capita data reflects the distribution and equity of park green spaces among residents in a specific city.
To comprehensively consider the influence of other factors on urban vitality, this study references existing literature to select variables such as the output value of the tertiary industry (TIG), per capita disposable income of urban residents (PUDI), housing prices (HP), and public fiscal expenditure (PFE) as control variables [39,47,48]. Compared to other industries, the output of the tertiary industry more comprehensively reflects the diversity of urban economic activities and is a primary source of high-tech information technology and the creative economy [49]. The low energy consumption of the tertiary industry also supports sustainable green development, making it closely tied to urban vitality. Disposable income determines residents’ consumption capacity and their participation in economic activities, thereby boosting urban vitality [50]. Higher levels of disposable income can attract external talent, enhance a city’s appeal to other regions, and strengthen its overall competitiveness. Housing prices represent the economic value of land and space in a city, serving as a vital indicator of economic growth and vitality. However, excessively high housing prices may limit residents’ quality of life and consumption capacity, which could impede economic vitality [51]. Public fiscal expenditure is a key indicator of government investment in infrastructure, public services, and social welfare, with the efficiency and execution of these expenditures often directly impacting a city’s vitality and long-term sustainable development [52].
Additionally, to control for the influence of different city sizes (CSs), this study categorizes the 35 cities according to the classification of Chinese city sizes. Cities with an urban area permanent resident population of over 10 million are classified as super-large cities and assigned a value of 3; cities with an urban area permanent resident population between 5 million and 10 million are classified as extra-large cities and assigned a value of 2; other large cities with populations between 1 million and 5 million, as well as a few medium-sized cities with populations below 1 million, are uniformly assigned a value of 1 for this study.
Furthermore, this study includes a park green space policy variable (PGSU). Using the Peking University Law Network (PKULAW) and keywords such as “park” or “green space”, this study searched for unique policies on park and green space construction in sample cities, aside from national, provincial, and government regulations. These policies are categorized based on the number of policy documents as follows: 0 (no additional focus on park green space construction), 1 (moderate focus on park green space construction), and 2 (considerable focus on park green space construction). The names, units, and abbreviations of the variables are presented in Table 1.

Table 1.
Name, units, and abbreviation of each variable.
3.3. Empirical Model
3.3.1. Baseline Model
The Fixed Effects Model accounts for both “individual effects” and “time effects”, addressing the issue of endogeneity between random disturbance terms and explanatory variables to a certain extent [53]. Due to the differing circumstances in each city, to mitigate the impact of individual time trends on the dependent variable and to avoid omitting time-invariant characteristics, the study employs a Two-Way Fixed Effects Model for basic analysis. Most variables are transformed into logarithmic form, aiming to reduce heteroscedasticity and multicollinearity in the equation, excluding the dummy variables city scale (CS) and Park green space policy (PGSU).
In Equation (1), the subscript i denotes the city, and t denotes the year. represents the urban vitality of city i at time t, while is the intercept term. is an explanatory variable, represents the coefficients of the explanatory variable. The variable Control is a set of control variables, including , ln(, ln(, ln(, and , and represents the coefficients of the control variables. represents the individual fixed effects and time fixed effects, respectively. is the error term.
3.3.2. GMM Model
To ensure the robustness of analysis results, the Generalized Method of Moments (GMM) is widely applied in empirical research [53,54]. One of the advantages of GMM is its effective mitigation of endogeneity issues in panel data, making it particularly suitable for short panel datasets. In conducting robustness checks, this study incorporates the lagged dependent variable in the regression.
In Equation (2), is the lagged one-period value of and is its regression coefficient. The settings for the other variables remain consistent with Equation (1).
3.3.3. Threshold Regression
To verify whether there is a nonlinear influence mechanism between per capita park green space and urban vitality, the study adopts the threshold regression model extended by Hansen (1999) to identify possible critical points or thresholds [55]. Assuming a single threshold effect, the regression model is as follows:
Considering the possibility of multiple threshold effects, the single-threshold panel regression model can be extended to a multiple-threshold panel regression model as follows:
In Equations (3) and (4), denotes the threshold variable, δ represents the value of the threshold variable, and represents the indicator function, which takes the value 1 when the corresponding condition is met and 0 otherwise. The bootstrap method is used to conduct a likelihood ratio test for threshold significance [56].
3.4. Data Sources
The population density, urban population, per capita road area, land use types, and other data used in this study are sourced from the China Urban Construction Statistical Yearbook. Data on the output value of the tertiary industry, the average selling price of new commercial housing, total retail sales of consumer goods, urban disposable income, and public fiscal expenditure come from national data, local statistical yearbooks, and statistical bulletins. The count of policy documents is sourced from PKULAW (https://pkulaw.com, accessed on 20 March 2024). The study period begins in 2002 and extends to the most recent data available in 2022. This period also captures the varying levels of emphasis and differences in green space development across cities, ensuring that the data more accurately reflect the impact of park green spaces on urban vitality throughout the development process.
4. Empirical Analysis
4.1. Descriptive Statistics
The results of the descriptive statistics for the relevant data are shown in Table 2. Urban vitality (UV) ranged from a maximum of 0.671 in Zhengzhou in 2022 to a minimum of 0.095 in Xining in 2012. Per capita park green space area (PG) ranged from a maximum of 24.51 in Guangzhou in 2021 to a minimum of 4.651 in Nanning in 2022, indicating significant variation across cities. The output value of the tertiary industry (TIG), per capita disposable income of urban residents (PUDI), the average sales price of newly constructed homes (HP), and public fiscal expenditure (PFE) also exhibited notable differences. These findings demonstrate substantial disparities among the selected variables, validating the rationale and effectiveness of data selection.
Table 2.
Descriptive statistics.
Figure 2 illustrates the status of urban vitality and per capita park green space in 35 large and medium-sized cities in 2012 and 2022. The green bars represent the size of per capita park green space, while the orange-colored areas indicate the range of urban vitality across different cities. It can be observed that in economically developed super-large cities, such as Shanghai, per capita park green space is relatively low due to the large population and limited land resources. Guangzhou, despite having a higher per capita park green space, is not the city with the highest urban vitality. The trends in per capita park green space and urban vitality do not align consistently across super-large cities and other large and medium-sized cities. These findings suggest that the relationship between overall urban vitality and park green space is not straightforward but is influenced by a combination of other factors. A more targeted econometric model would help further uncover the underlying dynamics of this phenomenon.
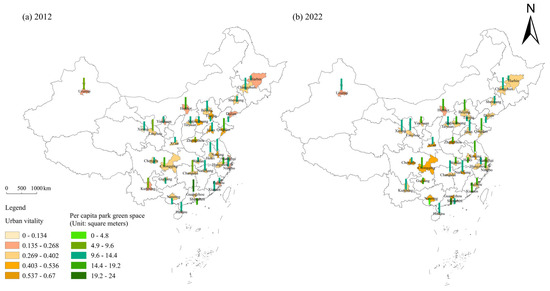
Figure 2.
Per capita park green space and urban vitality in 35 large and medium-sized cities in 2012 and 2022.
4.2. Regression Analysis Results
Baseline regression results for the overall 35 large and medium-sized cities are shown in Model 1, while results for super-large cities, extra-large cities, and other large and medium-sized cities are presented in Models 2, 3, and 4, respectively, (Table 3). It can be observed that in Model 1, the coefficient of per capita park green space area on urban vitality is 0.051, significant at the 1% level. Apart from housing prices, all other control variables significantly impact urban population vitality at the 10% level. As expected, TIG, PUDI, and PGSU exhibit positive effects on urban vitality. The coefficient of CS also shows a positive effect at the 5% significance level, indicating that the larger the city size, the higher the urban vitality. However, HP shows a less significant negative impact across the sample cities. PFE has a significant negative impact on urban vitality at the 1% significance level. This phenomenon may be related to the fact that the sample cities are all large and medium-sized cities, where the burden of public fiscal expenditure is substantial, and the efficiency of enhancing urban vitality is relatively low.
Table 3.
Regression analysis results.
In the sample of other cities, the impact of per capita park green space area on urban vitality is significant at the 10% level. For super-large and extra-large cities, the influence of per capita park green space area on urban vitality is not significant. This analysis suggests that in other cities, the impact of increasing per capita green space on urban vitality is more pronounced. In extra-large cities, the development of the tertiary industry output and disposable income of urban residents have a more significant impact on urban vitality. However, the impact of urban residents’ disposable income on urban vitality is negative. In super-large cities, disposable income shows a more significant and positive effect on urban vitality, while housing prices significantly negatively impact it. In other cities, both the tertiary industry and the disposable income of urban residents have positive impacts on urban vitality. However, the positive effect of the tertiary industry is not as strong as in extra-large cities, and the positive influence of disposable income is less compared to that of super-large cities. The negative impact of public fiscal expenditure on urban vitality is significant across all three city types. However, super-large cities exhibit the largest negative effect, followed by extra-large cities and other cities. This suggests that larger cities tend to have higher fiscal expenditures, but they also face greater challenges in enhancing overall urban vitality, which is primarily driven by factors such as population density, retail sales of consumer goods, per capita road area, and land use diversity. The effectiveness of these expenditures in boosting vitality remains insufficient.
4.3. Robustness Test
We employed reducing the sample size (models 5 and 6) and the system GMM estimation method (model 7) for robustness checks of the previous regression results (Table 4). Model 5 presents the regression results after randomly reducing the sample by 5%. Model 6 shows the regression results after conducting a trimmed mean test at 5%. The results are generally consistent with the previous findings, confirming the robustness of the earlier regression results. Model 7 displays the results of the GMM regression with a lagged one-period urban vitality index included. The coefficient for per capita park green area is largely consistent with the baseline regression. The p-values of both the Sargan and Hansen tests are greater than 0.05 but less than 1, indicating the validity of the system GMM model. This further confirms the robustness of the results.
Table 4.
Robustness tests.
4.4. Threshold Regression Results
Total GDP and population size (Pop) are important indicators of urban development and are commonly used as threshold variables in the existing literature. Research suggests that at different stages of urban economic development and population sizes, residents’ demand for park green spaces varies [57]. There may be threshold effects in the impact of per capita park green space on urban vitality. Additionally, studies predict that the total area of park green spaces (PGA) might exhibit a threshold effect in the mechanism by which per capita park green space affects urban vitality [30].
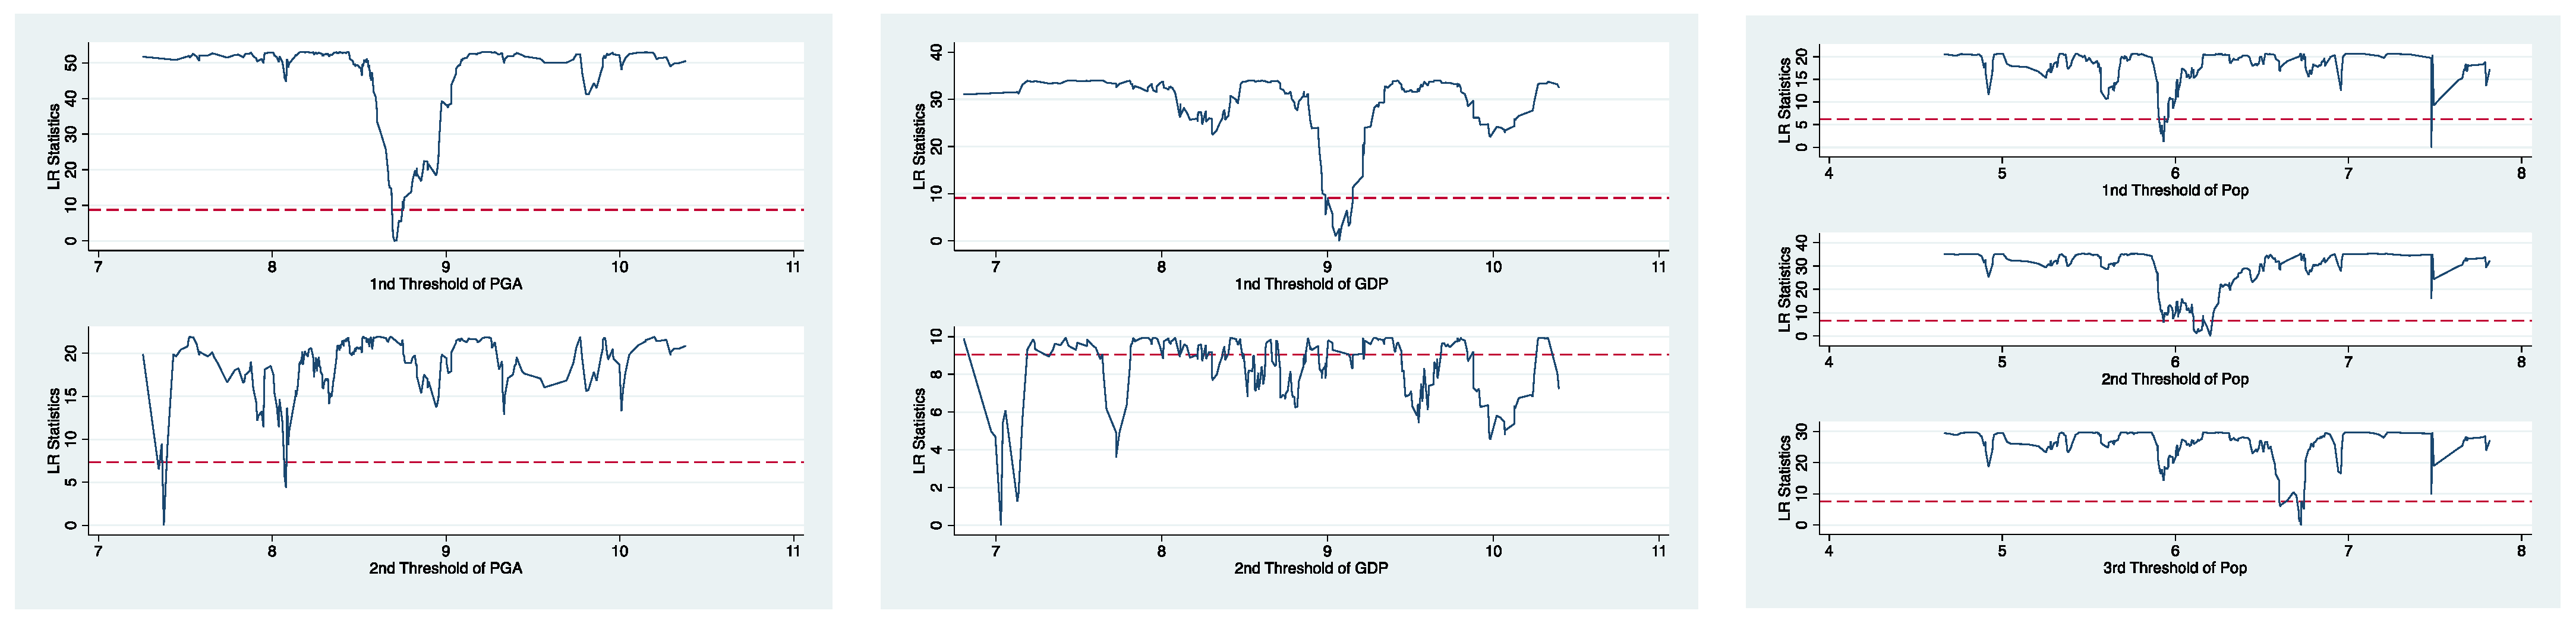
Therefore, the study applied the “Bootstrap resampling method” to obtain threshold test results for total park green space area, GDP, and population size. Table 5 shows that total park green space area and GDP have single thresholds, which are significant at the 1% and 5% levels, respectively. Population size exhibited a significant double threshold at the 10% level. The estimation of the threshold value and the LR test results are shown in Figure 3. We can see that the single threshold effects of GDP and total park green space area on urban vitality are both evident. Additionally, the double threshold effect of population size on urban vitality is even more pronounced.
Table 5.
Test results of the significance of threshold effects.
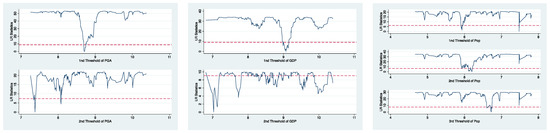
Figure 3.
LR diagram with the threshold variables PGA, GDP, and Pop.
Model 8, model 9, and model 10 of Table 6 present the regression results using GDP, total park green area, and population size as threshold variables. Model 8 shows that the threshold for the park green area (PGA) is 8.7028, which, after conversion, is 6019.55 square kilometers. When the PGA is less than 6019.55 square kilometers, the coefficient for the impact of per capita park green space on urban vitality is 0.079; however, when the PGA exceeds 6019.55 square kilometers, the coefficient for the impact of per capita park green space on urban vitality decreases to 0.053. Model 9 shows that the threshold for GDP is 9.0702, which, after conversion, is RMB 869.21 billion. When GDP exceeds RMB 869.21 billion, the effect of per capita park green space on promoting urban vitality also diminishes. Population also exhibits a threshold effect. The first and second thresholds in Model 10 are 6.2019 and 6.7248, respectively. After conversion, they are 4.9368 million people and 8.3279 million people. The coefficient for the impact of per capita park green space on urban vitality decreases from 0.058 to 0.037 and then to 0.016.
Table 6.
Results of threshold effects.
5. Discussion
Research findings indicate that per capita park green space has a significant positive impact on urban vitality. Possible reasons cited in the existing literature include the provision of venues for leisure, recreation, and exercise; the promotion of social interaction and cohesion; the enhancement of green growth; and the improvement of individual health and quality of life [5,21,58,59,60]. However, the study also found that while the overall impact of park green space on urban vitality is positive, there is inconsistency across different city sizes. In ordinary medium and large-sized cities, the influence of per capita park green space on urban population vitality is more pronounced. The growth of the tertiary industry and residents’ disposable income both contribute to enhancing urban vitality. In super-large and extra-large cities, the potential for increasing per capita urban green space is limited, making its effect on enhancing urban vitality less noticeable. Super-large cities, with their already well-developed infrastructure and significant socio-economic agglomeration effects, find that improvements in urban vitality are more closely linked to residents’ disposable income and high housing prices. In extra-large cities, the relationship between urban vitality and housing prices is weaker, with urban vitality more closely related to the development environment of the tertiary industry. However, due to less advanced infrastructure and fewer employment opportunities compared to super-large cities, the potential of increased residents’ income to enhance urban vitality has not yet been fully achieved. Overall, it is likely that the fiscal burden in these large and medium-sized cities is too complex, and the current level of fiscal expenditure has not yet contributed to an effective increase in urban vitality [61]. Due to the fact that the construction of parks and green spaces is typically integrated into urban planning in super-large cities, changes in specific policies supporting parks and green spaces generally have little impact. This indirectly verifies that the attractiveness of super-large and extra-large cities lies in personal income, public facilities, housing prices, and industrial development effects.
Threshold regression also revealed a nonlinear single-threshold effect between Gross Domestic Product (GDP) and total park green space area (PGA). This demonstrates that once economic development and park green space areas reach a certain level, the marginal effect of per capita park green space on enhancing urban vitality may reach a climax stage [32]. The double-threshold results for population size (Pop) provide a more complex mechanism of influence. As the primary users of space, the population also affects the utilization of parks and plazas [57]. Although park green spaces that facilitate social interaction can enhance urban vitality under conditions of population agglomeration, if park green space development is neglected as the population grows, cities with these conditions may not maintain the same level of vitality over time [47]. The baseline regression analysis of per capita park green space in super-large and extra-large cities also verifies this point. The above findings corroborate the literature [36], indicating that the benefits of compact urban development in attracting and maintaining diversity may be offset by “urban stress”, prompting residents to leave desirable super-large cities more frequently. It is particularly important to note that super-large cities must also pay attention to the positive effects of park green spaces on urban vitality. In these cities, the per capita park green space is difficult to increase or is limited, reducing the potential for enhancing this positive effect. Therefore, these cities need to focus more on improving the quality of park green spaces. This indirectly confirms the necessity for major cities in China to emphasize the construction of park cities.
6. Conclusions
Empirical results show that per capita park green space has a significant positive impact on the urban vitality of 35 major large and medium-sized cities in China, with this effect exhibiting heterogeneity across different city sizes. Additionally, GDP, total park green space area, and population size all demonstrate threshold effects, to some extent, in the relationship between per capita park green space and urban vitality. These findings emphasize the indispensable role of green park spaces in promoting social cohesion [62,63,64] while highlighting that reasonable and moderate spatial and functional enhancements can aid in the development of park green spaces.
Different cities should formulate targeted policies and plans to meet the growing needs of urban populations by expanding park green spaces. Super-large and extra-large cities should explore effective paths to overcome the challenges of green space development, providing a model for the sustainable development of similar cities. Other large and medium-sized cities can learn from the successes and lessons of these cities to collectively improve urban governance level.
In resource-constrained super-large cities, efforts should focus on enhancing the infrastructure surrounding urban green spaces, integrating parks with diverse high-quality public service facilities, and prioritizing improvements in the quality of green spaces. Incorporate different forms of green spaces through systematic planning and enhance facilities to meet the diverse needs of residents across all age groups. Effectively utilize urban space through micro-renewal approaches to increase the coverage of community parks within a 15 min living circle, as well as enhance the availability of pocket parks and other easily accessible open spaces. Promote the development of green spaces to meet the multifunctional needs of residents, including rest and recreation, fitness, and mental well-being. It is also essential to coordinate park and transportation planning to minimize the cost of accessing parks and green spaces, thereby improving accessibility. Strengthen the organic connection of parks throughout the city, using green spaces as the foundation to establish an open space network that enhances urban vitality and development quality. While focusing on economic development and job creation, also increase the quantity and quality of green spaces to promote sustainable urban development and avoid reaching the threshold of urban green space. Create a healthy and vibrant urban environment through safe, interactive, and accessible park green spaces [65].
In addition to emphasizing green space service quality similar to super-large cities, extra-large cities can also focus on deeper integration of industry and green spaces. Implement effective pilot projects for green space sharing, incorporating commercial and recreational facilities to optimize the multifunctional use of green spaces and improve residents’ living environments. Develop various types of community parks and pocket parks tailored to local conditions to make daily leisure and exercise more convenient for residents, and to foster neighborhood interactions and strengthen community cohesion. Improve the green space system and strengthen the greenway network. Enhance the management of parks and green spaces and upgrade basic service infrastructure to elevate residents’ quality of life and boost urban vitality.
Other ordinary large and medium-sized cities can leverage their resource advantages to increase park green space areas, develop more suburban and countryside parks, and enhance residents’ recreational and leisure experiences. Additionally, these cities can develop cultural and eco-tourism to attract visitors and investment, driving urban development. Utilize supportive policies to strategically promote the rational layout of green spaces, strengthen the ecological foundation, and enhance livability and urban vitality.
Finally, although this study provides a comprehensive analysis of the impact of per capita urban park green space on urban vitality using panel data, there are still areas worth further exploration. For instance, employing a broader urban sample could yield more reliable and generalizable conclusions, and data from small and medium-sized cities might offer different perspectives. The paper’s threshold analysis mainly focuses on the performance of individual indicators, whereas real-world scenarios may involve more complex interaction mechanisms. Future research could also explore in more detail how improvements to urban green spaces can enhance urban vitality by promoting social equity, environmental sustainability, and social well-being. Additionally, examining the impact of different types of park green spaces on urban vitality and designing research approaches to better reflect the quality of park green spaces and ecosystem services also warrant further investigation.
Author Contributions
Conceptualization, X.N. and G.W.; methodology, G.W. and D.Y.; software, G.W., D.Y. and Z.M.; validation, X.N. and G.W.; formal analysis, X.N. and G.W.; investigation, G.W. and D.Y.; data curation, D.Y. and Z.M.; writing—original draft preparation, G.W. and D.Y.; writing—review and editing, X.N. and G.W.; supervision, X.N. and G.W.; project administration, X.N. and G.W.; funding acquisition, X.N. and G.W. All authors have read and agreed to the published version of the manuscript.
Funding
This research was funded by the Humanities and Social Science Fund of the Ministry of Education of China (grant numbers 22YJA630096 and 20YJC630108) and the National Social Science Fund of China (grant number 21AZD036).
Data Availability Statement
The statistical data can be obtained from the China Economic and Social Big Data Research Platform at https://data.cnki.net/home (accessed on 20 March 2024). The policy data are sourced from the Beida Fabao Database at https://pkulaw.com (accessed on 20 March 2024).
Conflicts of Interest
The authors declare no conflicts of interest.
References
- Jin, X.; Long, Y.; Sun, W.; Lu, Y.; Yang, X.; Tang, J. Evaluating Cities’ Vitality and Identifying Ghost Cities in China with Emerging Geographical Data. Cities 2017, 63, 98–109. [Google Scholar] [CrossRef]
- Wang, T.; Li, Y.; Li, H.; Chen, S.; Li, H.; Zhang, Y. Research on the Vitality Evaluation of Parks and Squares in Medium-Sized Chinese Cities from the Perspective of Urban Functional Areas. Int. J. Environ. Res. Public Health 2022, 19, 15238. [Google Scholar] [CrossRef] [PubMed]
- Huang, X.; Jiang, P.; Li, M.; Zhao, X. Applicable Framework for Evaluating Urban Vitality with Multiple-Source Data: Empirical Research of the Pearl River Delta Urban Agglomeration Using BPNN. Land 2022, 11, 1901. [Google Scholar] [CrossRef]
- Chen, Y.; Yu, B.; Shu, B.; Yang, L.; Wang, R. Exploring the Spatiotemporal Patterns and Correlates of Urban Vitality: Temporal and Spatial Heterogeneity. Sustain. Cities Soc. 2023, 91, 104440. [Google Scholar] [CrossRef]
- Lan, F.; Gong, X.; Da, H.; Wen, H. How Do Population Inflow and Social Infrastructure Affect Urban Vitality? Evidence from 35 Large- and Medium-Sized Cities in China. Cities 2020, 100, 102454. [Google Scholar] [CrossRef]
- Jacobs, J. The Death and Life of Great American Cities; Modern Library: New York, NY, USA, 1993; ISBN 978-0-679-60047-3. [Google Scholar]
- Tu, W.; Zhu, T.; Xia, J.; Zhou, Y.; Lai, Y.; Jiang, J.; Li, Q. Portraying the Spatial Dynamics of Urban Vibrancy Using Multisource Urban Big Data. Comput. Environ. Urban Syst. 2020, 80, 101428. [Google Scholar] [CrossRef]
- Guo, X.; Chen, H.; Yang, X. An Evaluation of Street Dynamic Vitality and Its Influential Factors Based on Multi-Source Big Data. ISPRS Int. J. Geo-Inf. 2021, 10, 143. [Google Scholar] [CrossRef]
- Zumelzu, A.; Barrientos-Trinanes, M. Analysis of the Effects of Urban Form on Neighborhood Vitality: Five Cases in Valdivia, Southern Chile. J. Hous. Built Environ. 2019, 34, 897–925. [Google Scholar] [CrossRef]
- Xia, C.; Yeh, A.G.-O.; Zhang, A. Analyzing Spatial Relationships between Urban Land Use Intensity and Urban Vitality at Street Block Level: A Case Study of Five Chinese Megacities. Landsc. Urban Plan. 2020, 193, 103669. [Google Scholar] [CrossRef]
- Li, X.; Li, Y.; Jia, T.; Zhou, L.; Hijazi, I.H. The Six Dimensions of Built Environment on Urban Vitality: Fusion Evidence from Multi-Source Data. Cities 2022, 121, 103482. [Google Scholar] [CrossRef]
- Chang, J.; Hui Chiang, C. Segmenting American and Japanese Tourists on Novelty-Seeking at Night Markets in Taiwan. Asia Pac. J. Tour. Res. 2006, 11, 391–406. [Google Scholar] [CrossRef]
- Kim, Y.-L. Data-Driven Approach to Characterize Urban Vitality: How Spatiotemporal Context Dynamically Defines Seoul’s Nighttime. Int. J. Geogr. Inf. Sci. 2020, 34, 1235–1256. [Google Scholar] [CrossRef]
- Register, R. Ecocities: Rebuilding Cities in Balance with Nature; New Society Publishers: Gabriola, BC, USA, 2006; ISBN 978-0-86571-552-3. [Google Scholar]
- Whyte, W.H. The Social Life of Small Urban Spaces, 7th ed.; Project for Public Spaces: New York, NY, USA, 2010; ISBN 978-0-9706324-1-8. [Google Scholar]
- Oldenburg, R. (Ed.) Celebrating the Third Place: Inspiring Stories about the “Great Good Places” at the Heart of Our Communities; Da Capo Press: Cambridge, MA, USA, 2002; ISBN 978-1-56924-612-2. [Google Scholar]
- Glaeser, E.L. Triumph of the City: How Our Greatest Invention Makes Us Richer, Smarter, Greener, Healthier, and Happier; Penguin Books: New York, NY, USA, 2012; ISBN 978-0-14-312054-4. [Google Scholar]
- Kaplan, S. The Restorative Benefits of Nature: Toward an Integrative Framework. J. Environ. Psychol. 1995, 15, 169–182. [Google Scholar] [CrossRef]
- Holden, E.; Norland, I.T. Three Challenges for the Compact City as a Sustainable Urban Form: Household Consumption of Energy and Transport in Eight Residential Areas in the Greater Oslo Region. Urban Stud. 2005, 42, 2145–2166. [Google Scholar] [CrossRef]
- Ottelin, J.; Heinonen, J.; Junnila, S. Greenhouse Gas Emissions from Flying Can Offset the Gain from Reduced Driving in Dense Urban Areas. J. Transp. Geogr. 2014, 41, 1–9. [Google Scholar] [CrossRef]
- Kumar, V.; Vuilliomenet, A. Urban Nature: Does Green Infrastructure Relate to the Cultural and Creative Vitality of European Cities? Sustainability 2021, 13, 8052. [Google Scholar] [CrossRef]
- Lopes, M.N.; Camanho, A.S. Public Green Space Use and Consequences on Urban Vitality: An Assessment of European Cities. Soc. Indic. Res. 2013, 113, 751–767. [Google Scholar] [CrossRef]
- Baris, M.E.; Erdogan, E.; Dilaver, Z.; Arslan, M. Greenways and the Urban Form: City of Ankara, Turkey. Biotechnol. Biotechnol. Equip. 2010, 24, 1657–1664. [Google Scholar] [CrossRef]
- Pirmoradian, F.; Ashtari, I. Investigation of Socio-Economic and Environmental Functions of Urban Green Space. Int. J. Ecosyst. Ecol. Sci. 2020, 10, 179–188. [Google Scholar] [CrossRef]
- Van Den Berg, M.; Van Poppel, M.; Van Kamp, I.; Andrusaityte, S.; Balseviciene, B.; Cirach, M.; Danileviciute, A.; Ellis, N.; Hurst, G.; Masterson, D.; et al. Visiting Green Space Is Associated with Mental Health and Vitality: A Cross-Sectional Study in Four European Cities. Health Place 2016, 38, 8–15. [Google Scholar] [CrossRef]
- Zhu, J.; Lu, H.; Zheng, T.; Rong, Y.; Wang, C.; Zhang, W.; Yan, Y.; Tang, L. Vitality of Urban Parks and Its Influencing Factors from the Perspective of Recreational Service Supply, Demand, and Spatial Links. Int. J. Environ. Res. Public Health 2020, 17, 1615. [Google Scholar] [CrossRef]
- Mu, B.; Liu, C.; Mu, T.; Xu, X.; Tian, G.; Zhang, Y.; Kim, G. Spatiotemporal Fluctuations in Urban Park Spatial Vitality Determined by On-Site Observation and Behavior Mapping: A Case Study of Three Parks in Zhengzhou City, China. Urban For. Urban Green. 2021, 64, 127246. [Google Scholar] [CrossRef]
- Mushkani, R.A.; Ono, H. The Role of Land Use and Vitality in Fostering Gender Equality in Urban Public Parks: The Case of Kabul City, Afghanistan. Habitat Int. 2021, 118, 102462. [Google Scholar] [CrossRef]
- Lee, S.; Kang, J.E. Impact of Particulate Matter and Urban Spatial Characteristics on Urban Vitality Using Spatiotemporal Big Data. Cities 2022, 131, 104030. [Google Scholar] [CrossRef]
- Neuvonen, M.; Sievänen, T.; Tönnes, S.; Koskela, T. Access to Green Areas and the Frequency of Visits—A Case Study in Helsinki. Urban For. Urban Green. 2007, 6, 235–247. [Google Scholar] [CrossRef]
- Erkip, F. The Distribution of Urban Public Services: The Case of Parks and Recreational Services in Ankara. Cities 1997, 14, 353–361. [Google Scholar] [CrossRef]
- Paköz, M.Z.; Işık, M. Rethinking Urban Density, Vitality and Healthy Environment in the Post-Pandemic City: The Case of Istanbul. Cities 2022, 124, 103598. [Google Scholar] [CrossRef]
- Chen, Y.; Ge, Y.; Yang, G.; Wu, Z.; Du, Y.; Mao, F.; Liu, S.; Xu, R.; Qu, Z.; Xu, B.; et al. Inequalities of Urban Green Space Area and Ecosystem Services along Urban Center-Edge Gradients. Landsc. Urban Plan. 2022, 217, 104266. [Google Scholar] [CrossRef]
- Rao, Y.; Zhong, Y.; He, Q.; Dai, J. Assessing the Equity of Accessibility to Urban Green Space: A Study of 254 Cities in China. Int. J. Environ. Res. Public Health 2022, 19, 4855. [Google Scholar] [CrossRef]
- Liu, X.; Pan, Y.; Zhou, H. Indexing Coordination of Ecosystem and Urban Economic Vitality in Coastal Cities: An Observation in Yangtze River Delta. Front. Environ. Sci. 2022, 10, 1004648. [Google Scholar] [CrossRef]
- Xia, C.; Zhang, A.; Yeh, A.G.O. The Varying Relationships between Multidimensional Urban Form and Urban Vitality in Chinese Megacities: Insights from a Comparative Analysis. Ann. Am. Assoc. Geogr. 2022, 112, 141–166. [Google Scholar] [CrossRef]
- Lynch, K. Good City Form; MIT Press: Cambridge, MA, USA, 2001; ISBN 978-0-262-62046-8. [Google Scholar]
- Chen, W.; Wu, A.N.; Biljecki, F. Classification of Urban Morphology with Deep Learning: Application on Urban Vitality. Comput. Environ. Urban Syst. 2021, 90, 101706. [Google Scholar] [CrossRef]
- Dong, L.; Zhang, L. Spatial Coupling Coordination Evaluation of Mixed Land Use and Urban Vitality in Major Cities in China. Int. J. Environ. Res. Public Health 2022, 19, 15586. [Google Scholar] [CrossRef]
- Yue, Y.; Zhuang, Y.; Yeh, A.G.O.; Xie, J.-Y.; Ma, C.-L.; Li, Q.-Q. Measurements of POI-Based Mixed Use and Their Relationships with Neighbourhood Vibrancy. Int. J. Geogr. Inf. Sci. 2017, 31, 658–675. [Google Scholar] [CrossRef]
- Chen, T.; Hui, E.C.M.; Wu, J.; Lang, W.; Li, X. Identifying Urban Spatial Structure and Urban Vibrancy in Highly Dense Cities Using Georeferenced Social Media Data. Habitat Int. 2019, 89, 102005. [Google Scholar] [CrossRef]
- Quigley, J.M. Urban Diversity and Economic Growth. J. Econ. Perspect. 1998, 12, 127–138. [Google Scholar] [CrossRef]
- Molotch, H. The City as a Growth Machine: Toward a Political Economy of Place 1. In Classic Readings in Urban Planning; Stein, J.M., Ed.; Routledge: London, UK, 2018; ISBN 978-1-351-17952-2. [Google Scholar]
- Bertaud, A. Order without Design: How Markets Shape Cities; MIT Press: Cambridge, MA, USA, 2018; ISBN 978-0-262-03876-8. [Google Scholar]
- Hall, P.; Pain, K. The Polycentric Metropolis; Routledge: London, UK, 2012; ISBN 978-1-136-54769-0. [Google Scholar]
- Zeng, Z.; Li, Y.; Tang, H. Multidimensional Spatial Driving Factors of Urban Vitality Evolution at the Subdistrict Scale of Changsha City, China, Based on the Time Series of Human Activities. Buildings 2023, 13, 2448. [Google Scholar] [CrossRef]
- Bae, M.; Yuri, K. Development of Urban Park Supply Alternatives Considering the Equity Evaluation of Urban Park Service: Focused on Cheongju City. Korea Spat. Plan. Rev. 2013, 77, 49–66. [Google Scholar]
- Lu, S.; Shi, C.; Yang, X. Impacts of Built Environment on Urban Vitality: Regression Analyses of Beijing and Chengdu, China. Int. J. Environ. Res. Public Health 2019, 16, 4592. [Google Scholar] [CrossRef]
- Bell, D. The Coming of Post-Industrial Society. In Social Stratification, Class, Race, and Gender in Sociological Perspective, 2nd ed.; Routledge: London, UK, 2001; ISBN 978-0-429-30641-9. [Google Scholar]
- Keynes, J.M. The General Theory of Employment, Interest and Money; Macmillan: London, UK, 1936. [Google Scholar]
- Glaeser, E.; Gyourko, J. The Impact of Zoning on Housing Affordability; National Bureau of Economic Research: Cambridge, MA, USA, 2002. [Google Scholar]
- Musgrave, R.A.; Musgrave, P.B. Public Finance in Theory and Practice, 3rd ed.; McGraw-Hill Kogakusha: Tokyo, Japan, 1980; ISBN 978-0-07-066448-7. [Google Scholar]
- Wintoki, M.B.; Linck, J.S.; Netter, J.M. Endogeneity and the Dynamics of Internal Corporate Governance. J. Financ. Econ. 2012, 105, 581–606. [Google Scholar] [CrossRef]
- Fan, M.; Shao, S.; Yang, L. Combining Global Malmquist–Luenberger Index and Generalized Method of Moments to Investigate Industrial Total Factor CO2 Emission Performance: A Case of Shanghai (China). Energy Policy 2015, 79, 189–201. [Google Scholar] [CrossRef]
- Hansen, B.E. Threshold Effects in Non-Dynamic Panels: Estimation, Testing, and Inference. J. Econom. 1999, 93, 345–368. [Google Scholar] [CrossRef]
- Hansen, B.E. Sample Splitting and Threshold Estimation. Econometrica 2000, 68, 575–603. [Google Scholar] [CrossRef]
- Prieto Curiel, R.; Cabrera-Arnau, C.; Bishop, S.R. Scaling Beyond Cities. Front. Phys. 2022, 10, 858307. [Google Scholar] [CrossRef]
- Chiesura, A. The Role of Urban Parks for the Sustainable City. Landsc. Urban Plan. 2004, 68, 129–138. [Google Scholar] [CrossRef]
- Hunter, R.F.; Christian, H.; Veitch, J.; Astell-Burt, T.; Hipp, J.A.; Schipperijn, J. The Impact of Interventions to Promote Physical Activity in Urban Green Space: A Systematic Review and Recommendations for Future Research. Soc. Sci. Med. 2015, 124, 246–256. [Google Scholar] [CrossRef]
- Ward Thompson, C.; Roe, J.; Aspinall, P.; Mitchell, R.; Clow, A.; Miller, D. More Green Space Is Linked to Less Stress in Deprived Communities: Evidence from Salivary Cortisol Patterns. Landsc. Urban Plan. 2012, 105, 221–229. [Google Scholar] [CrossRef]
- Baumol, W.J. Macroeconomics of Unbalanced Growth: The Anatomy of Urban Crisis. Am. Econ. Rev. 1967, 57, 415–426. [Google Scholar]
- Kweon, B.-S.; Sullivan, W.C.; Wiley, A.R. Green Common Spaces and the Social Integration of Inner-City Older Adults. Environ. Behav. 1998, 30, 832–858. [Google Scholar] [CrossRef]
- De Vries, S.; Van Dillen, S.M.E.; Groenewegen, P.P.; Spreeuwenberg, P. Streetscape Greenery and Health: Stress, Social Cohesion and Physical Activity as Mediators. Soc. Sci. Med. 2013, 94, 26–33. [Google Scholar] [CrossRef] [PubMed]
- Dinnie, E.; Brown, K.M.; Morris, S. Reprint of “Community, Cooperation and Conflict: Negotiating the Social Well-Being Benefits of Urban Greenspace Experiences”. Landsc. Urban Plan. 2013, 118, 103–111. [Google Scholar] [CrossRef]
- Sarkar, C.; Webster, C.; Gallacher, J. Healthy Cities: Public Health through Urban Planning; Edward Elgar Publishing: Cheltenham, UK, 2014; ISBN 978-1-78195-572-7. [Google Scholar]

Disclaimer/Publisher’s Note: The statements, opinions and data contained in all publications are solely those of the individual author(s) and contributor(s) and not of MDPI and/or the editor(s). MDPI and/or the editor(s) disclaim responsibility for any injury to people or property resulting from any ideas, methods, instructions or products referred to in the content. |
© 2024 by the authors. Licensee MDPI, Basel, Switzerland. This article is an open access article distributed under the terms and conditions of the Creative Commons Attribution (CC BY) license (https://creativecommons.org/licenses/by/4.0/).