Abstract
The ‘Fragas do Eume’ Natural Park includes one of the best-preserved Atlantic forests in Europe. These forests are part of the Natura 2000 Network. This scientific study focuses on analysing land-cover changes in the ‘Fragas do Eume’ Natural Park (NW Spain) over a 25-year period, from 1997 to 2022, using machine learning techniques for the classification of satellite images. Several image processing operations were carried out to correct radiometry, followed by supervised classification techniques with previously defined training areas. Five multispectral indices were used to improve classification accuracy, and their correlation was evaluated. Land-cover changes were analysed, with special attention to the transitions between eucalyptus plantations and native deciduous forests. A significant increase in eucalyptus plantations (48.2%) (Eucalyptus globulus Labill.) was observed, while native deciduous forests experienced a decrease in their extent (17.6%). This transformation of the landscape affected not only these two habitats, but also cropland and scrubland areas, both of which increased. Our results suggest that the lack of effective conservation policies and the economic interest of fast-growing tree plantations could explain the loss of native deciduous forests. The results highlight the need to implement pro-active and sustainable management measures to protect these natural forest ecosystems in the ‘Fragas do Eume’ Natural Park.
1. Introduction
Biodiversity is essential for the proper functioning of ecosystems and the maintenance of services such as climate regulation, cultural, and provisioning [1]. Ecosystems with higher biodiversity are more resilient to changes [2], underscoring the importance of its conservation. However, in recent decades, human activities have significantly impacted biodiversity with primary causes of loss including pollution, invasive species, climate change, overexploitation, and land use changes [3]. To address biodiversity decline, 195 countries, including Spain, ratified the Convention on Biological Diversity [4]. In Europe, biodiversity protection follows guidelines like the Natura 2000 Network, under the Habitats Directive (Directive 92/43/EEC) [5] and the Birds Directive (Directive 2009/147/EC) [6]. These aim to conserve species and habitats, including the ‘Atlantic deciduous forests’ which extend along the European coast from Norway to Portugal [7]. These forests, composed of deciduous trees, such as oaks, beeches, birches, and alders [8,9], face threats from deforestation and agricultural intensification [10,11]. In Galicia, the native ‘Fragas’ forests, featuring a variety of tree species typical of Atlantic forests and a rich diversity of mosses, lichens, and ferns, are especially significant. These include priority habitats like the alluvial forests of Alnus glutinosa and Fraxinus excelsior (91E0*) [10]. ‘Fragas’ are dominated by two species of Quercus: Quercus robur L., the oak, or Quercus pyrenaica Willd., the pyrenean oak [12,13].
In recent decades, Galicia has witnessed a notable surge in eucalyptus monoculture, primarily driven by Eucalyptus globulus Labill., now covering 26% of forest areas—a doubling from 2002’s 13% [14,15]. This expansion exacerbates habitat fragmentation issues [8]. Eucalyptus plantations, dominated by Eucalyptus globulus, thrive due to their rapid growth but deplete soil nutrients [16,17] and bacterial diversity [18], hindering the recovery and future cultivation in affected areas [19]. The impact extends to the ‘Fragas do Eume’ Natural Park, where E. globulus presence has significantly risen, especially before its declaration as protected area [20,21]. This natural park, spanning 9125 hectares [22] in the Galicia’s Eume river basin, earned natural park status in 1997, protecting one of the best-preserved Atlantic forests in Europe [23]. Classified as a SAC (special area of conservation) in the Natura 2000 Network, it harbours diverse habitats and host species dating back to the Tertiary period. These habitats are: Atlantic humid oakwoods with Erica ciliaris and Erica tetralix (4020*); tree-heath forests of Laurus nobilis (5230*); pseudo-steppes with grasses and annuals of the Thero-Brachypodietea order (6220*); nardus grasslands with numerous species on siliceous substrates in mountainous areas (and sub-mountainous areas of continental Europe) (6230*); active raised bogs (7110*); slopes, screes, and ravines with Tilio-Acerion forests (9180*); and alluvial forests with Alnus glutinosa and Fraxinus excelsior (Alno-Padion, Alnion incanae, Salicion albae) (91E0*) (Directive 92/43/EEC, 1992, Annex I) [5,13]. The Fragas are home to threatened or vulnerable species, such as bryophytes like Sphagnum pylaesii, invertebrates like Elona quimperiana and Margaritifera margaritifera L., amphibians like Chioglossa lusitanica, and mammals like Galemys pyrenaicus [24]. It also harbours species of ferns that have survived since the Tertiary period. These species are subtropical in origin and survive thanks to the high humidity and mild temperatures of the environment, such as Culcita macrocarpa and Woodwardia radicans [23,25].
The objective of this study is to quantify the changes in the main land uses and land covers that have occurred in the ‘Fragas do Eume’ Natural Park since its declaration as a protected area to the present day. The decline of Atlantic forest in the ‘Fragas do Eume’ Natural Park is primarily driven by the expansion of eucalyptus plantations. However, we expect that this expansion should occur at a lower rate than before the park’s designation as a protected area due to its legal protection. If the legal protections are effective, we would also expect a halt in the expansion of Eucalyptus spp. plantations and a natural recovery of the native Atlantic forest over the last 25 years. More specifically, our study aims to document land cover changes within the park and introduce an innovative methodology that leverages machine learning techniques and multispectral indices to enhance the accuracy of satellite image classification. To deal with the uncertainty associated with the classification algorithms and the need to communicate such uncertainty to decision makers, we assess land-cover changes by using a wide range of classification methods and spectral information. This methodology has the potential for application in similar studies at both global and macroregional levels.
2. Materials and Methods
2.1. Study Area
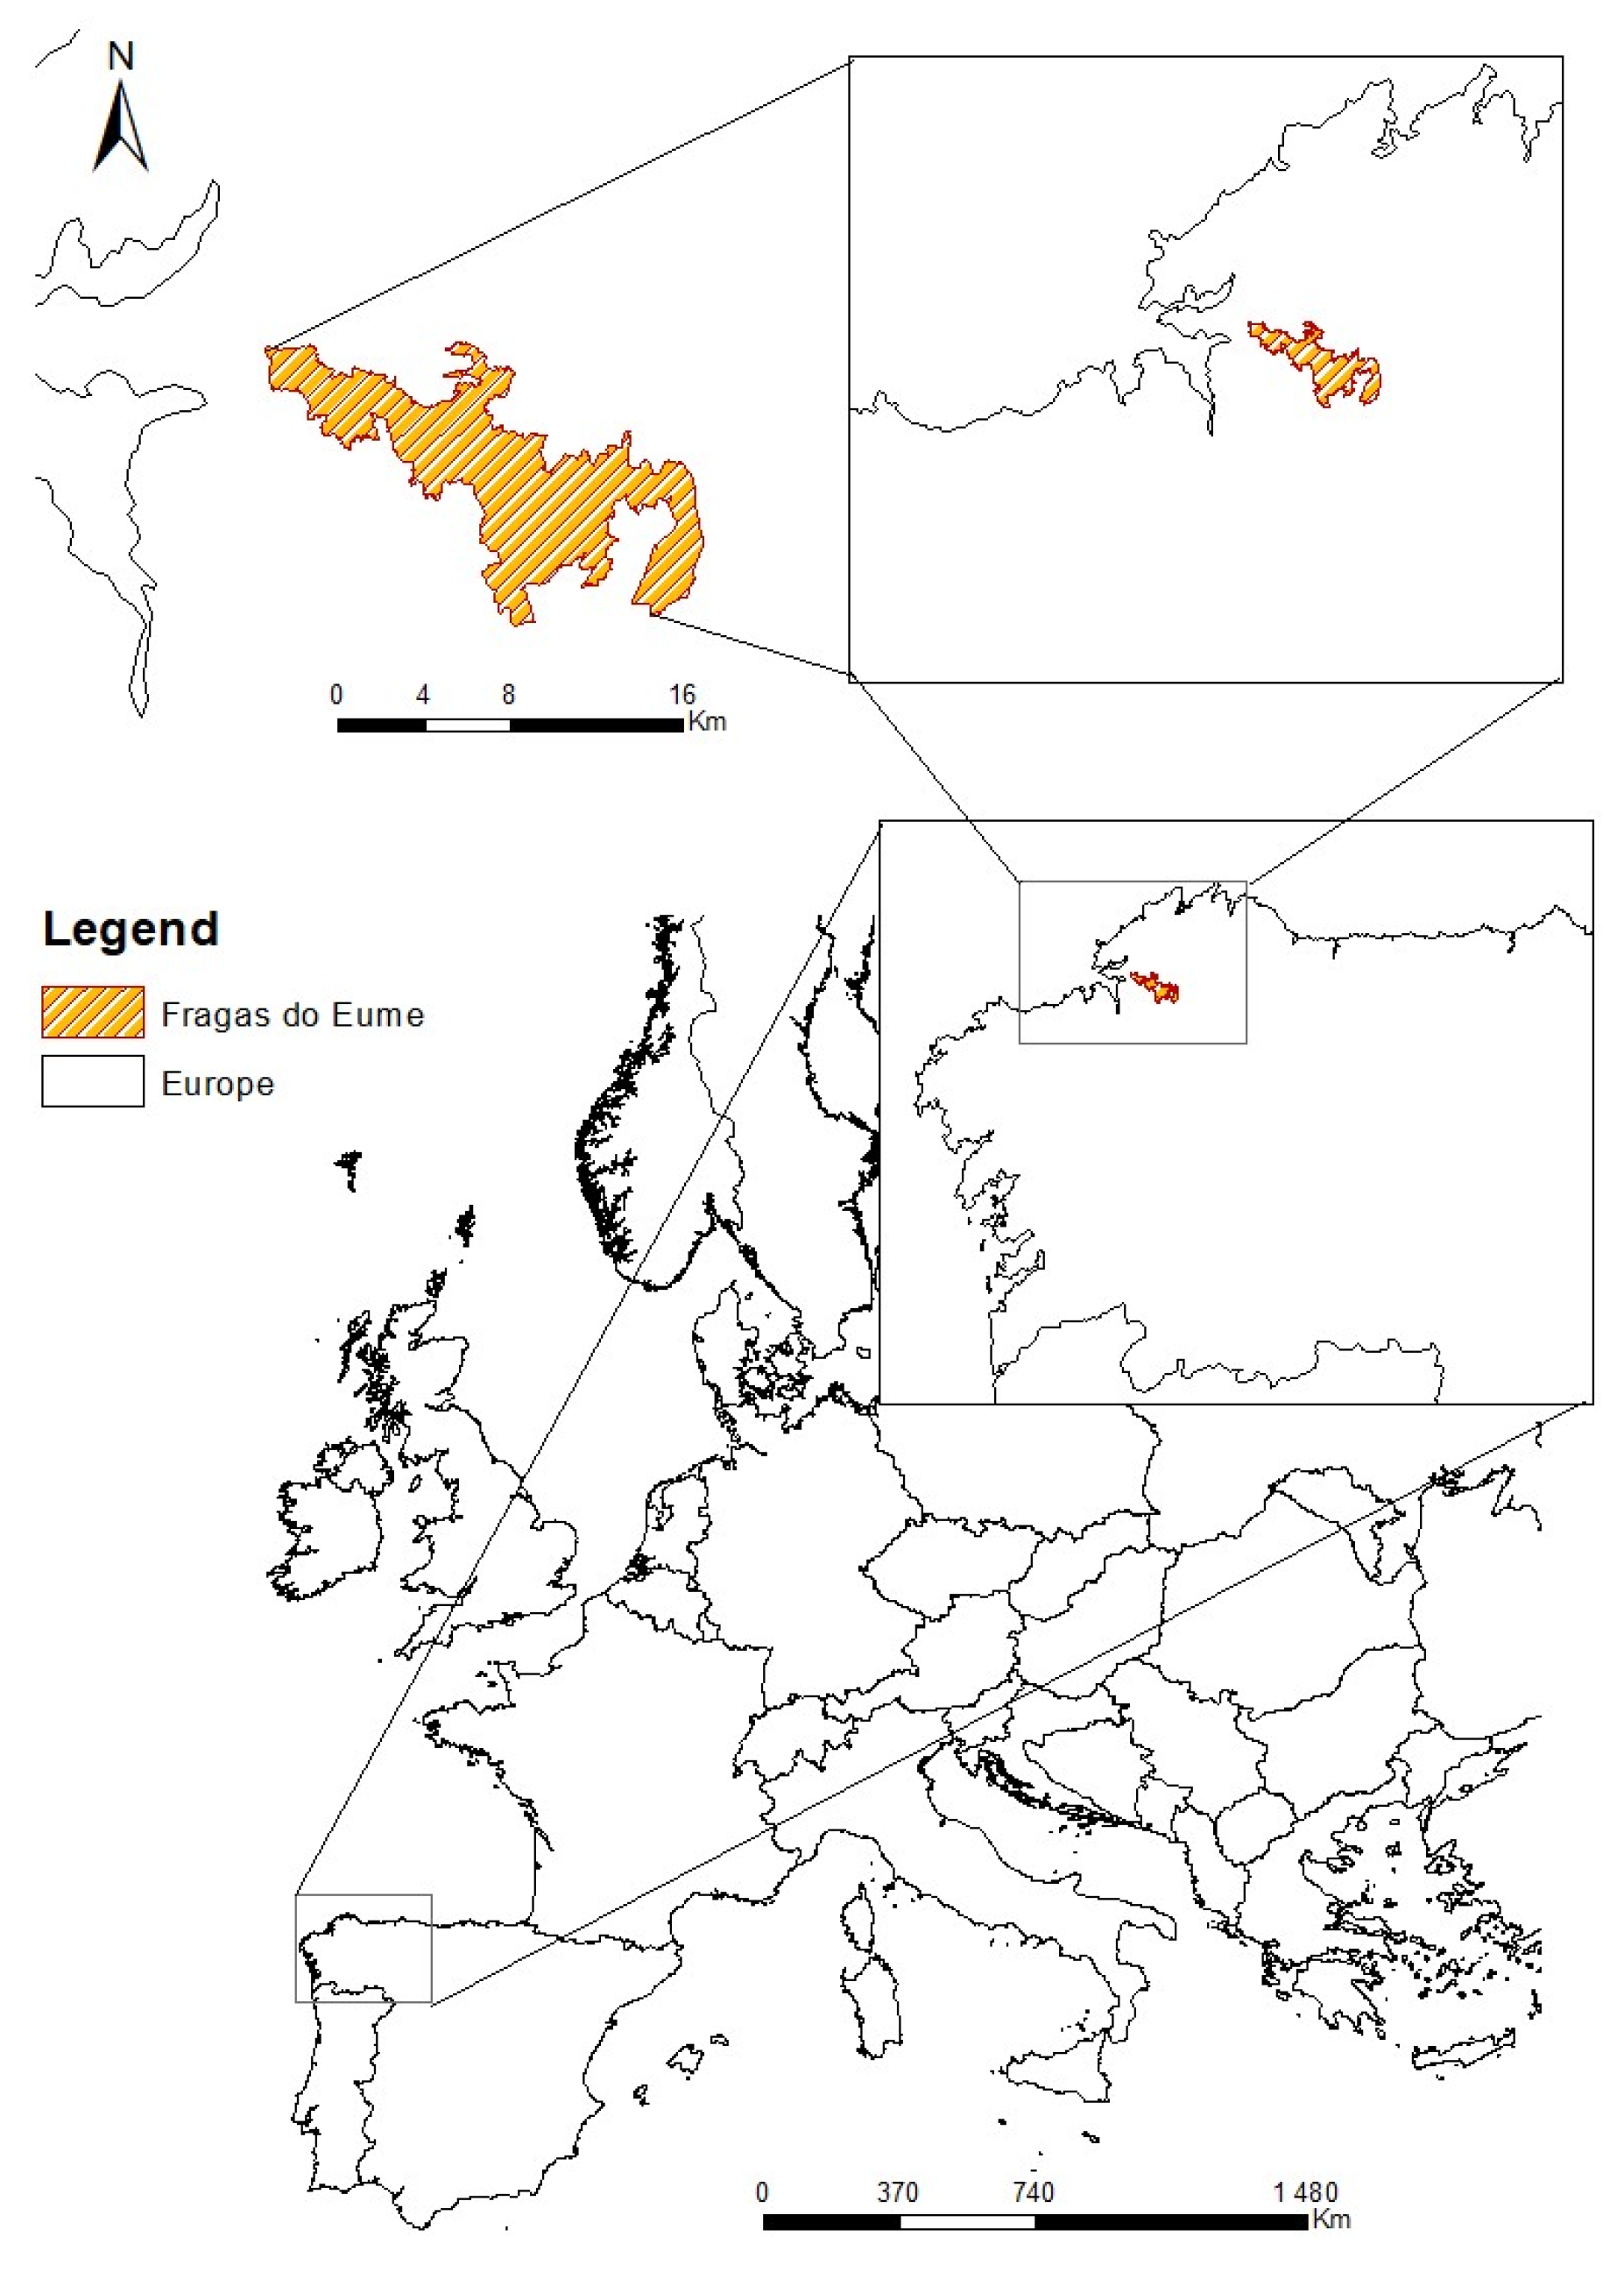
The study area is the ‘Fragas do Eume’ Natural Park, located in Galicia, in the northern part of the province of A Coruña (Figure 1). It covers 9125 hectares (Decree 218, 1997, Article 2) [22] extending throughout the Eume river basin. It spans across 5 municipalities: Cabanas, Pontedeume, A Capela, Monfero, and As Pontes. The Fragas has been a natural park since 1997 (Decree 218, 1997, Article 2) [22], being one of the best-preserved Atlantic forests in Europe [23]. It is also a SAC (special area of conservation) of the Natura 2000 Network (Directive 37, 2014, Annex I) [26], since it harbours different habitats of community importance (Directive 92/43/EEC, 1992, Annex I) [5].

Figure 1.
Map showing the location of ‘Fragas do Eume’. The orange area indicates the extent of the Natural Park.
2.2. Methodological Framework
To achieve the objective of our study, remote sensing and machine learning techniques were employed. Remote sensing allows us to obtain data from the Earth’s surface using satellites [27]. The interaction between the Earth’s surface and the atmosphere can be recorded by satellite sensors [27]. Each entity or object on the Earth’s surface has a spectral signature, i.e., different electromagnetic characteristics, which enables its identification [28]. The information is collected by airborne sensors that measure and receive radiometric information. The spectral and spatial resolution at which these sensors are capable of recording the electromagnetic energy emitted by the sun and reflected by objects will determine the level of detail that can be achieved during the classification process of these images [29,30]. Methodologically, the study explores the accuracy in the supervised classification of images of the Earth’s surface obtained by NASA’s Landsat satellites using different machine learning techniques, as well as the effect of incorporating auxiliary information to the spectral bands. Thematically, a relationship will be established between the main types of land uses and land covers that are spectrally discernible and the priority habitats identified in the natural park in order to infer the possible impacts on protected habitats since its declaration as a protected area.
2.2.1. Pre-Processing of Satellite Images
To detect changes in land use in the ‘Fragas do Eume’ Natural Park between 1997 and 2022, we used 2 cloud-free images for each year. These images were obtained from NASA’s Landsat satellite mission, by the Landsat 5 TM sensor on 27 March and 2 August 1997, and by the Landsat 8 OLI sensor on 24 March and Landsat 9 OLI sensor on 22 July 2022. These images are available on the website of the Earth Resources Observation and Science (EROS) Centre of the United States Geological Survey (USGS) (https://earthexplorer.usgs.gov/, accessed on 1 October 2022) [31]. These images are projected in the WGS 84 coordinate system, UTM projection, Zone 29 North. We chose images from winter and summer to better differentiate between deciduous and evergreen vegetation due to the different phenology of the species, which implies differential spectral behaviour between the two types of land covers.
The images were downloaded with a Level 1T processing level, meaning they underwent geometric correction considering the terrain. Next, we performed the radiometric calibration and correction to improve images affected by parameters related to the attenuation of electromagnetic radiation from the sun [32]. The apparent reflectance method (“apref”) or top-of-atmosphere reflectance was applied. This calibration was done in R Studio (https://www.r-project.org/, accessed on 1 October 2022) using the ‘RStoolbox’ package (version 1.0.0) for all layers except the July layer of Landsat 9 OLI, which was processed in the QGIS program (version 3.38.3) (https://qgis.org/es/site/, accessed on 1 October 2022) because the ‘RStoolbox’ package did not have an update to process Landsat 9 OLI layers.
2.2.2. Supervised Classification Procedure
We classified land-cover types from the radiometric information of the spectral bands. Additionally, auxiliary information was incorporated into the classification process in order to improve the accuracy of the final land cover maps. Specifically, we computed 5 multispectral indices: Normalised Difference Water Index (NDWI2), Modified Normalised Difference Water Index (MNDWI), Normalised Difference Vegetation Index (NDVI), Enhanced Vegetation Index (EVI), and Modified Soil Adjusted Vegetation Index (MSAVI). NDWI2 and MNDWI are indices related to measuring the amount of water in vegetation or soil moisture saturation levels (Table 1). NDVI, EVI, and SAVI measure the intensity of radiation from different bands of the electromagnetic spectrum emitted by vegetation (Table 1).

Table 1.
List of indices with their corresponding formulas and justifications for selection: Normalised Difference Water Index (NDWI2), Modified Normalised Difference Water Index (MNDWI), Normalised Difference Vegetation Index (NDVI), Enhanced Vegetation Index (EVI), and Modified Soil Adjusted Vegetation Index (MSAVI).
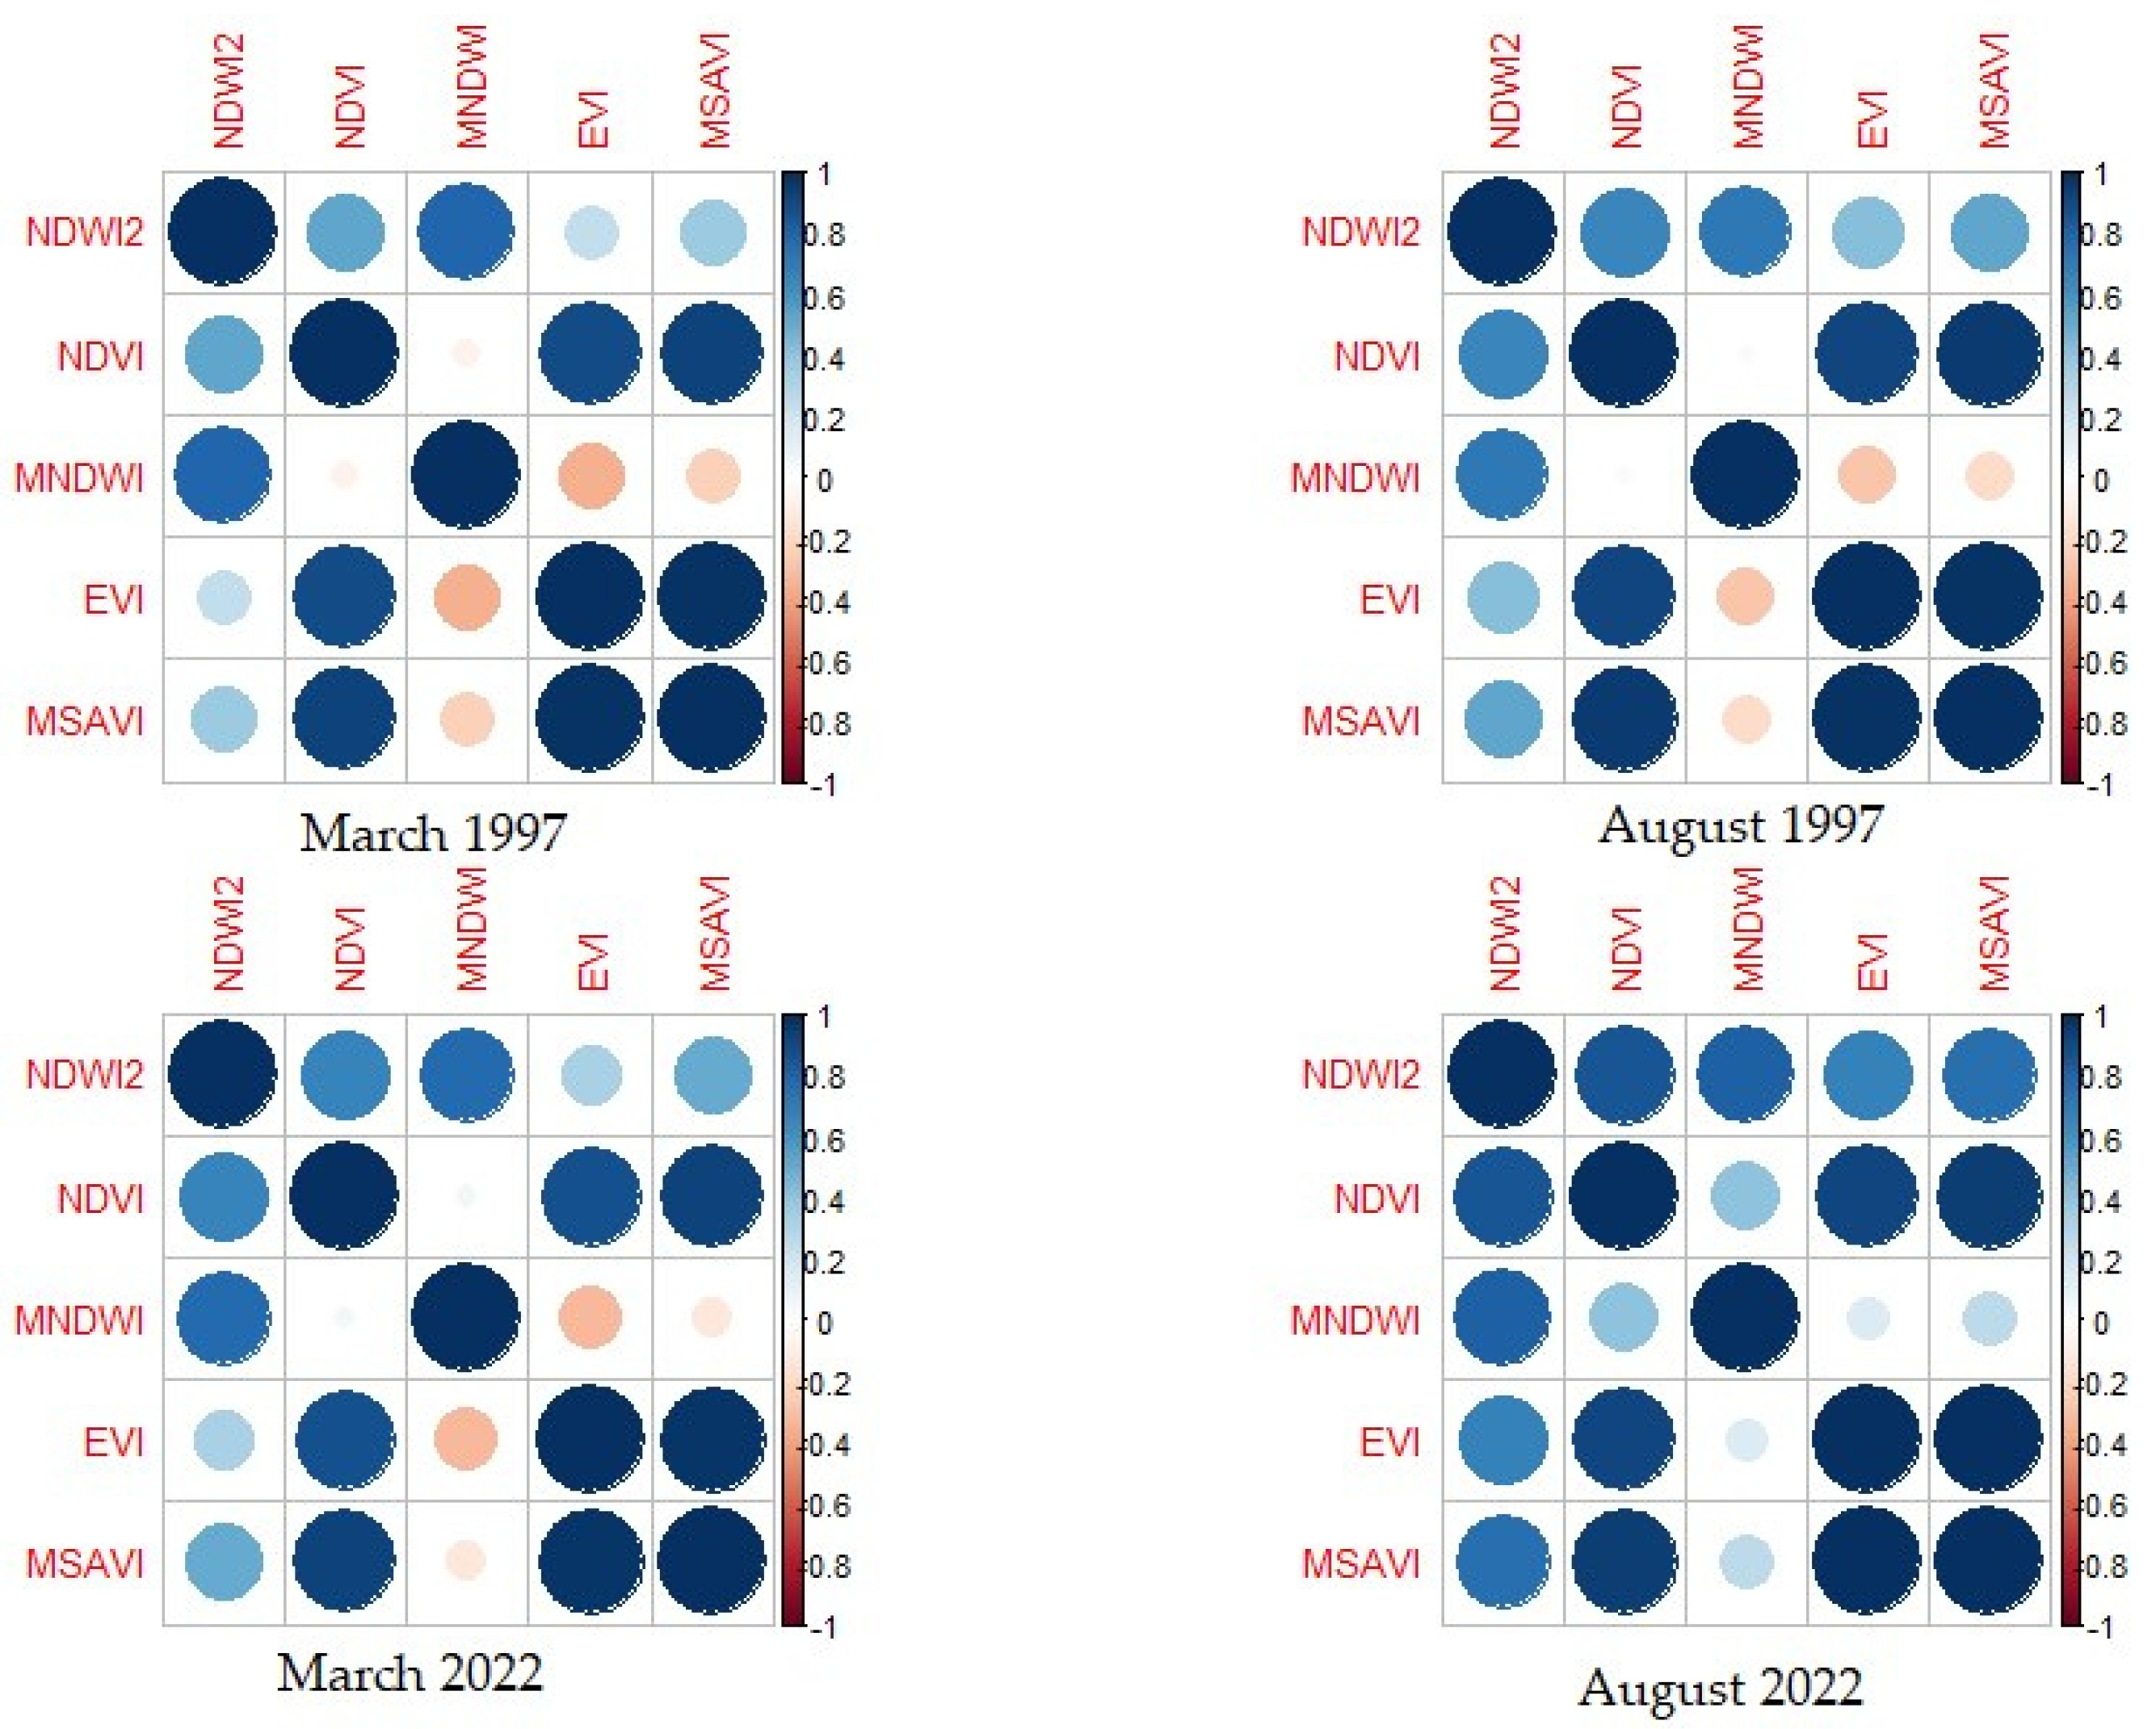
To avoid using redundant information in the classification procedure, we calculated the Pearson correlation among the spectral indices by using the ‘cor’ function from the ‘stats’ package in RStudio. For better visualisation of the data, we created a heatmap indicating the degree of correlation between each pair of indices.
Supervised classification is a process in remote sensing where an algorithm categorises pixels in an image into predefined classes based on training samples provided by the user. The user selects representative samples of each class from the satellite image, which are used to train the classification algorithm. The algorithm then analyses the spectral characteristics of the pixels in the image and assigns them to the most similar class based on the training samples [33]. Training areas were defined using QGIS software (https://qgis.org/es/site/, accessed on 1 October 2022) by selecting a set of pixels coinciding with well-known areas from Landsat images for each year. The areas were chosen from the natural park and its adjacent areas. We selected and identified a minimum of 10 areas/polygons per class. Those areas were homogeneous while still capturing environmental heterogeneity to account for spectral variability within each class. The chosen classes include up to 18 habitats from Annex I of Directive 92/43/EEC [5] (see Table 2). Evergreen forests are defined as dense, forested areas where the majority of trees retain their leaves throughout the year. In our study area, this typology is mainly composed of Eucalyptus globulus. Deciduous forests are characterised by trees that shed their leaves annually, typically in the autumn. These forests experience seasonal changes, with trees growing new leaves in the spring, which are then shed in the fall to conserve water and energy during the winter. In the study area, these forests are dominated by oaks. We created different training areas for land cover type and year (see Table 3).
Table 2.
List of habitats of the Annex I of Directive 92/43/EEC included in the land-cover classes identified in the Fragas do Eume Natural Park. * indicates priority habitat listed in the Annexes of the Habitat Directive.
Table 3.
Number of training areas per habitat in the years 1997 and 2022 and the total hectares of each one.
The supervised classification based on these pre-defined landcover classes was performed by using 9 machine learning algorithms available from the ‘Caret’ package in R: avNNet (model averaged neural network), gbm (stochastic gradient boosting), knn (k-Nearest Neighbors), mda (mixture discriminant analysis), pls (partial least squares), rf (random forest), svmPoly (support vector machines with polynomial kernel), and svmRadial (support vector machines with radial basis function kernel).
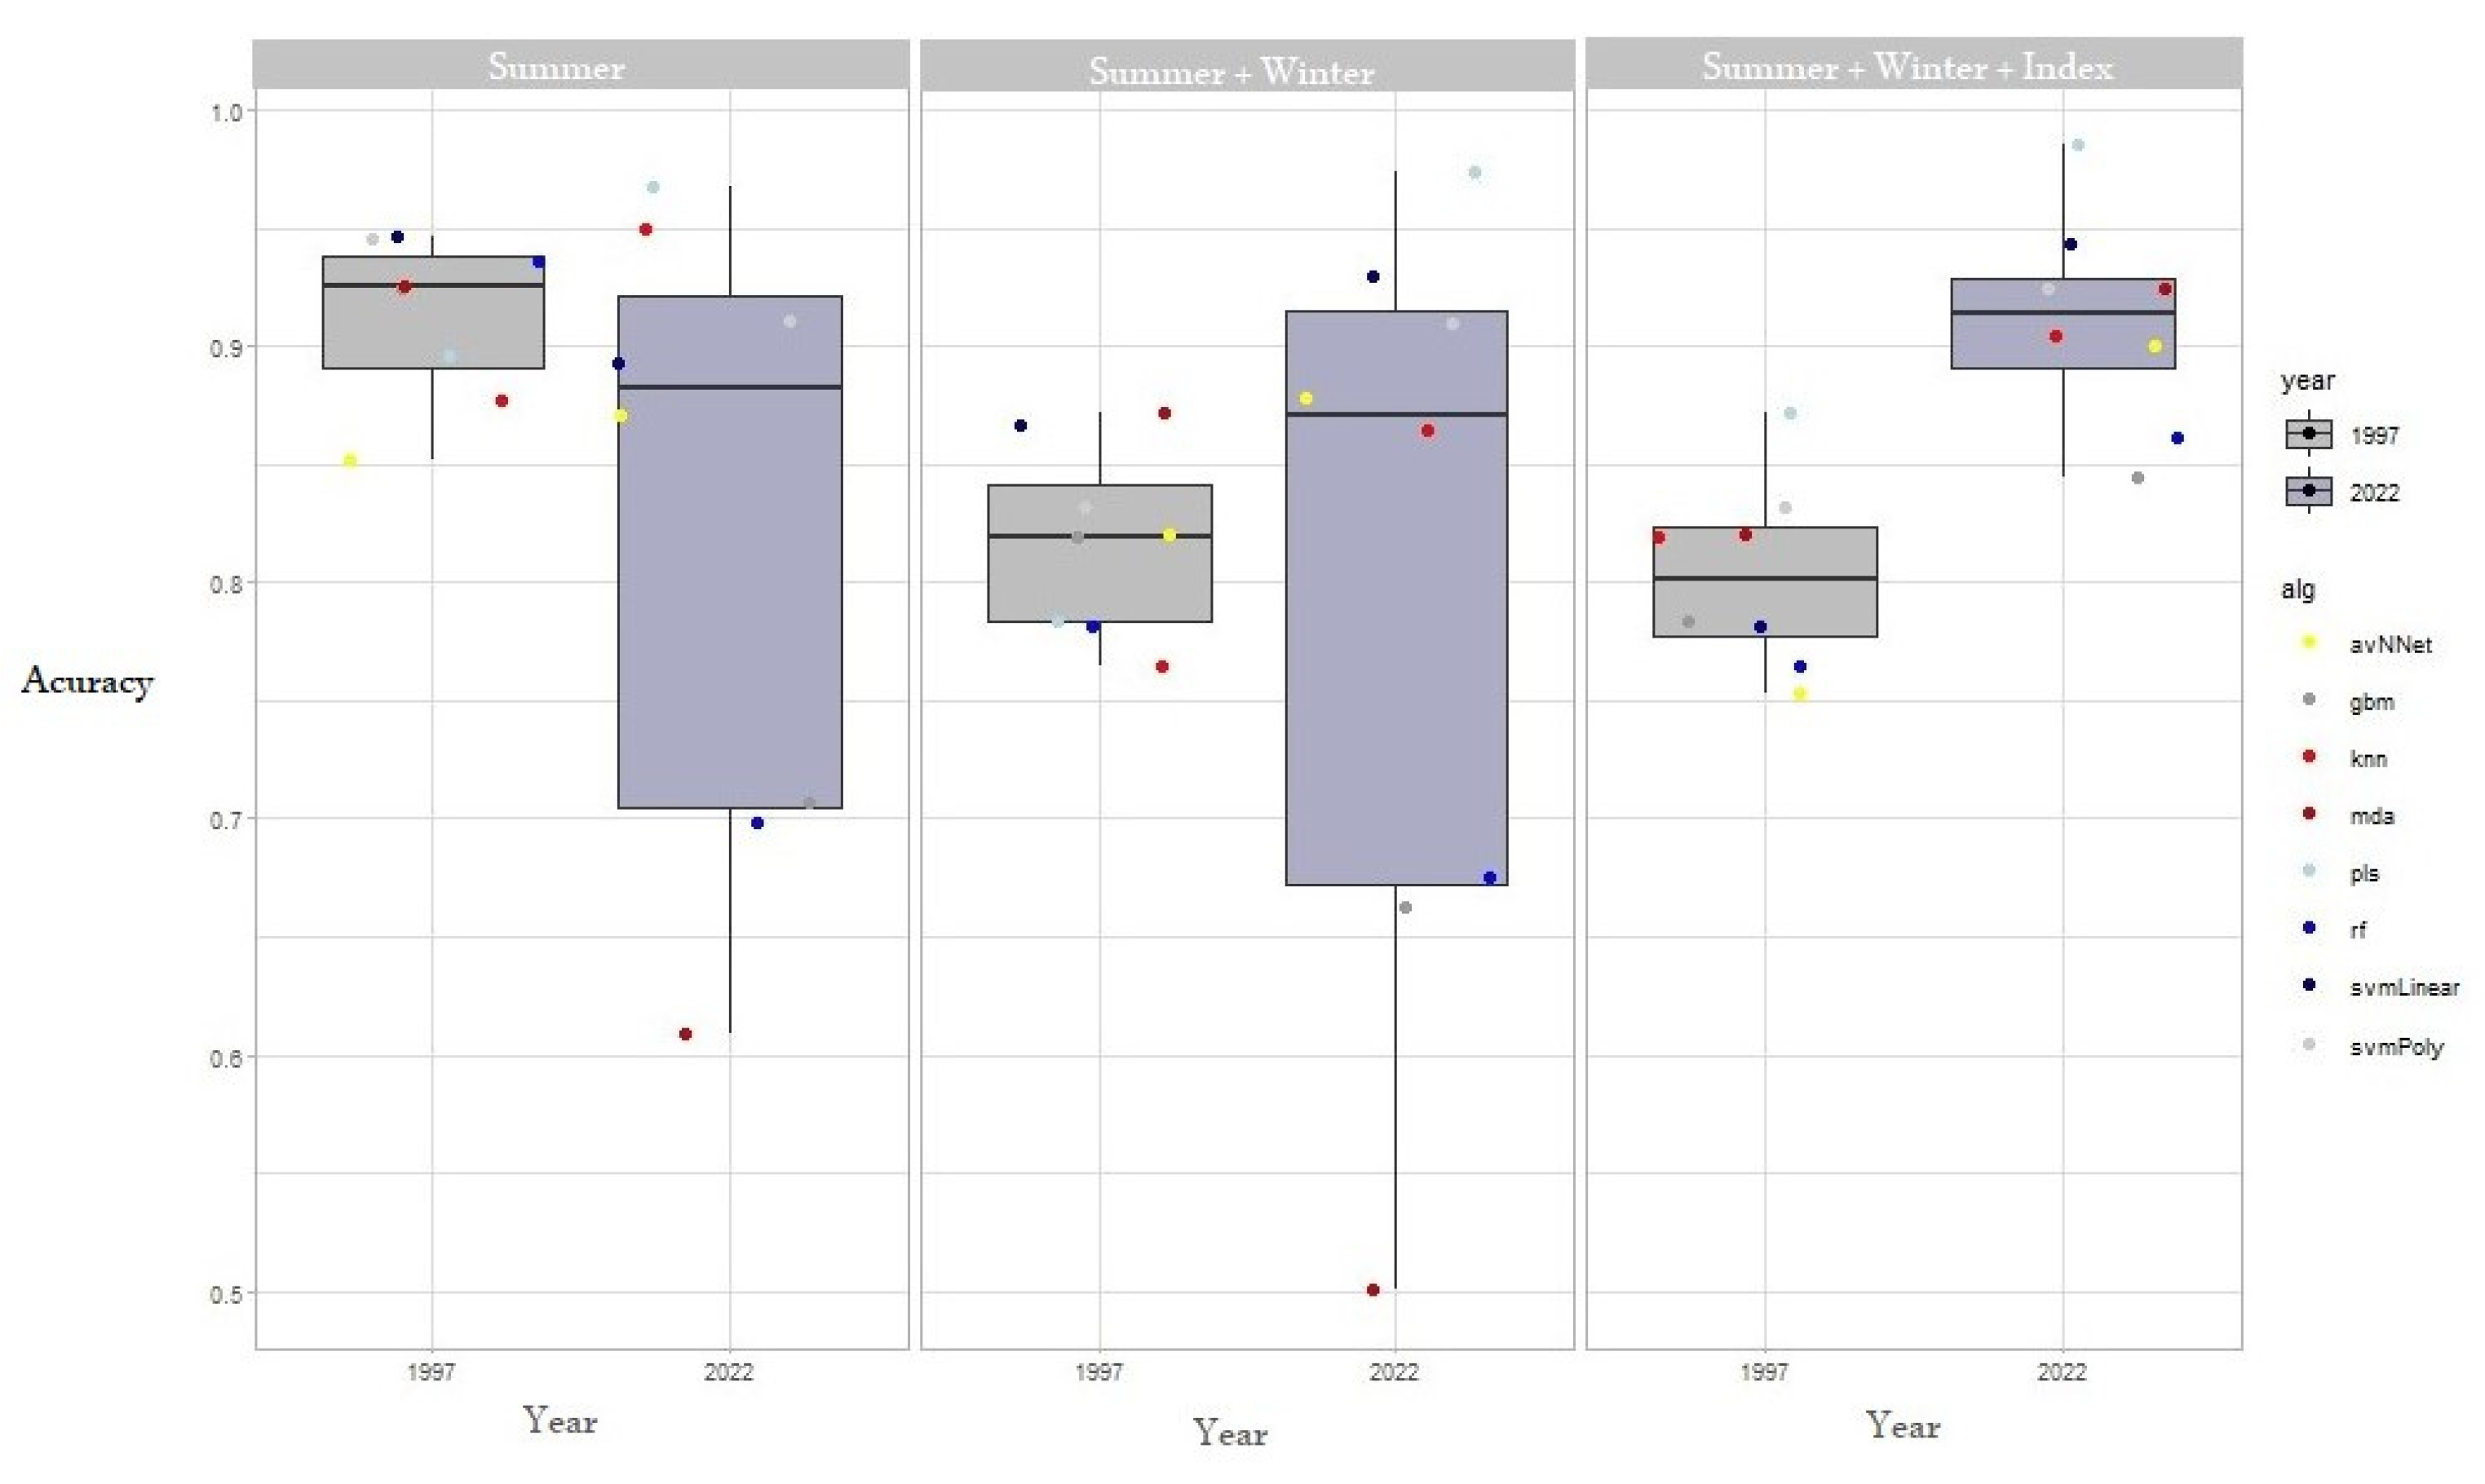
The performance of the classification algorithms was assessed with error matrices, indicating the overall accuracy (i.e., the percentage of correctly classified pixels), user’s accuracy, producer’s accuracy, and kappa index. The Kappa index is a statistical measure of observed agreement that takes into account the effect of chance [34]. We compared the results obtained using the different classification algorithms mentioned earlier. To evaluate the enhancement of the classification accuracy as additional information was integrated into the classifier, we compared the performance of each classifier using identical training areas as input data. We used images only from summer months, summer months plus winter months, and summer plus winter months with spectral indices. Only indices that were not correlated, meaning they did not provide redundant information, were finally included in the classification procedure. To evaluate differences in the accuracy of the different algorithms, we created boxplots with the overall accuracy data of all algorithms for each year and map. This was done to visualise the data and make comparisons between the information provided by each algorithm in the datasets.
2.2.3. Change Analysis
For the analysis of changes in the identified thematic classes, the map resulting from the classification process with the best overall accuracy and Kappa index value was selected. Once the maps were chosen, the area occupied by each habitat type was estimated for each year. To further understand the primary land-cover conversions occurring between 1997 and 2021, we constructed a transitional matrix.
3. Results
3.1. Accuracy Assessment
The results show a high correlation between several of the multispectral indices, namely EVI, SAVI, and NDVI, and NDWI2 and MNDWI (Figure 2). The variables least correlated with the other indices were NDWI2 and MSAVI. These indices were included in the classification process along with the spectral bands, allowing the incorporation of information related to ‘greenness’ and humidity, proxies for primary productivity and water balance.
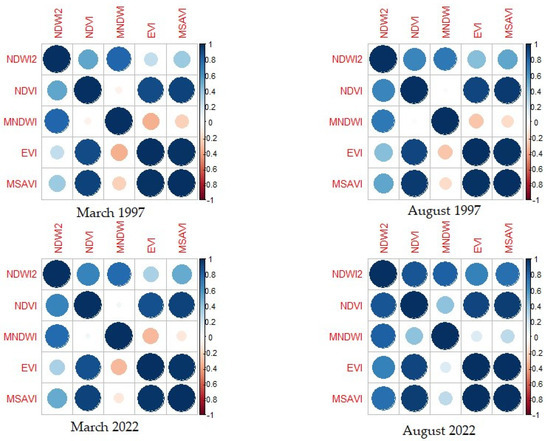
Figure 2.
Correlation diagram between multispectral indices. Top right: March 1997, top left: August 1997, bottom right: March 2022, and bottom left: July 2022.
The results do not show significant differences in the overall accuracy of the resulting maps derived from the different machine learning classifiers. The medians have very similar values, ranging from 0.8 to 0.95 in 1997 and from 0.7 to 0.9 in 2022 (Figure 3), indicating a consistently high overall classification capability of the identified land cover types. The image classification capability varies depending on the incorporated spectral information. In 1997, the incorporation of bands from two different periods decreases the predictive capability, while in 2022, there is less variability around the median, indicating some consistency among classifiers.

Figure 3.
Boxplot of the overall accuracy data of the algorithms for the summer maps (Summer), summer and winter maps (Summer + Winter), and summer, winter, and indices maps (Summer + Winter + Index) in the years 1997 and 2022. The line dividing the box represents the median, the box represents 50% of the data, the lines represent 25% of the data, and the points are outliers.
3.2. Change Analysis
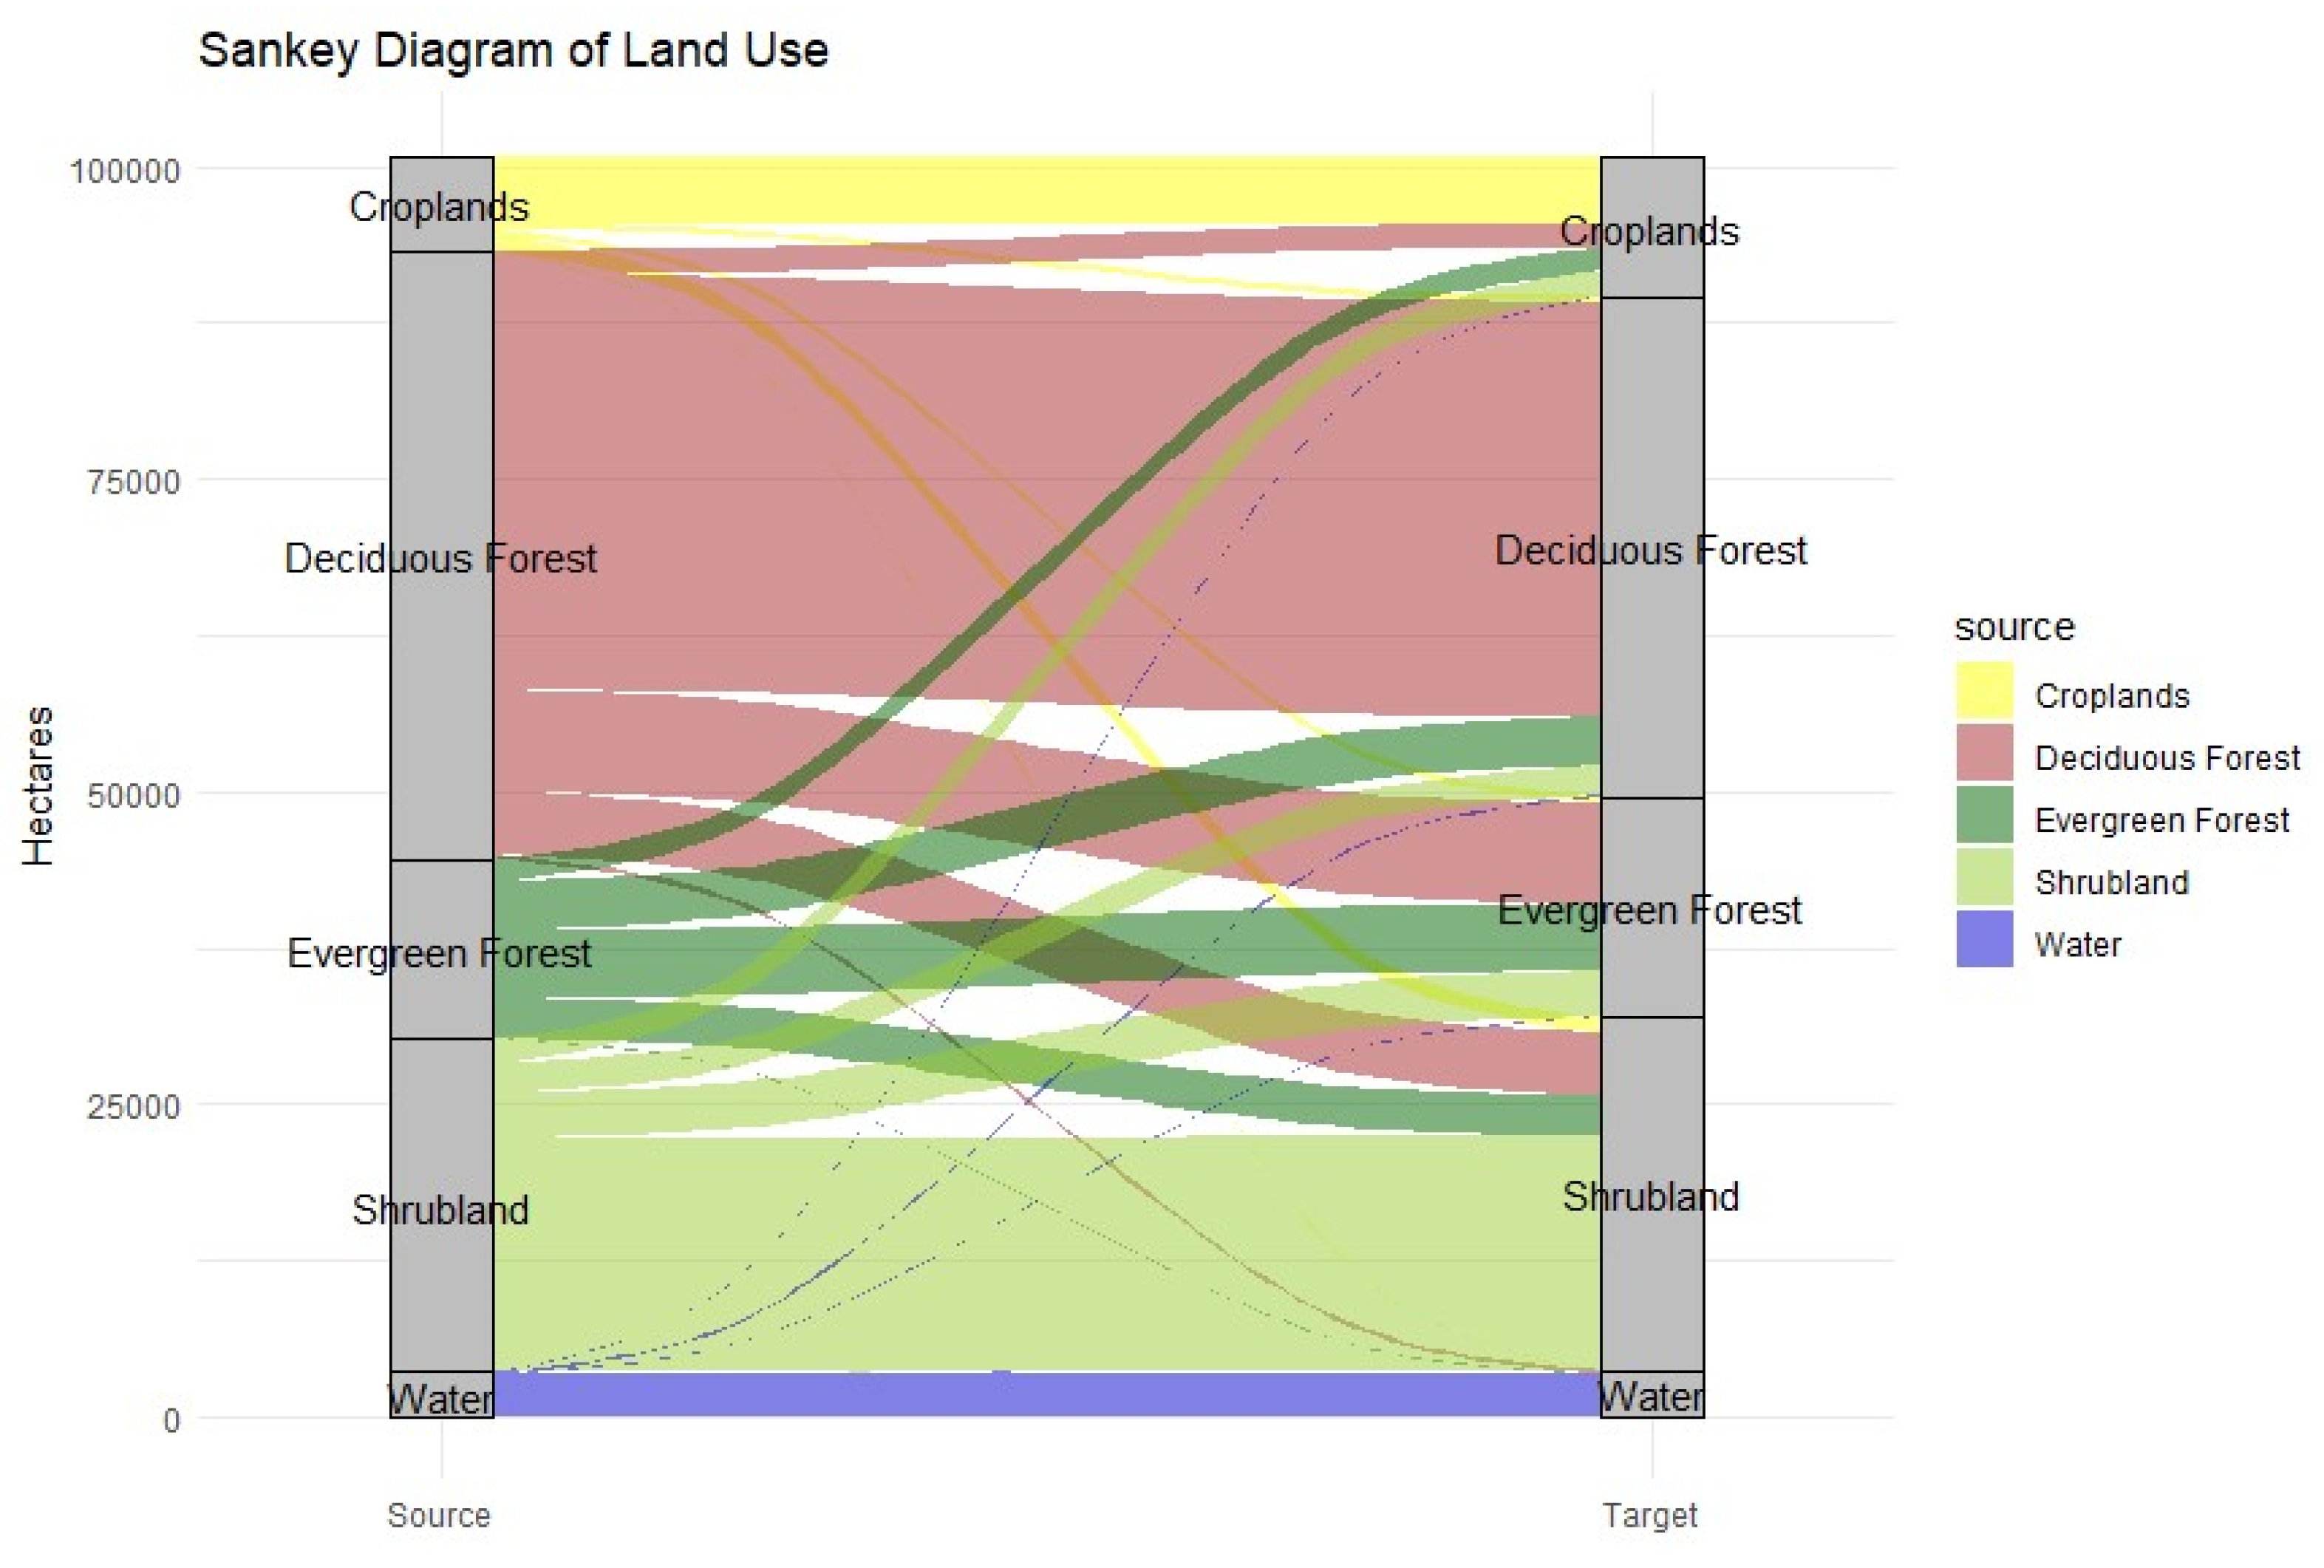
Changes in the Fragas de Eume Natural Park were analysed using the maps with the highest overall accuracy in 1997 and 2022, in this case, the ‘pls’ algorithm (overall accuracy of 0.87 and 0.98, respectively). From these data, we can observe significant changes in the extent of some areas over the period 1997–2022. We found that deciduous forest decreased (17.6%) from 1997 to 2022, while shrubland (18.2%), cropland (5.9%), and evergreen forest (i.e., eucalyptus plantations) increased (48.2%) (Figure 4, Figure 5 and Figure 6).

Figure 4.
This Sankey diagram illustrates the transitions between different land use types over time. The categories include croplands (yellow), deciduous forest (red), evergreen forest (green), shrubland (light green), and water (blue). The flow lines between the source (left) and target (right) nodes represent the changes in land use, measured in hectares, highlighting the dynamic nature of land cover transitions within the study area. The thickness of each line corresponds to the magnitude of change, facilitating the visualisation of how land use categories have evolved.
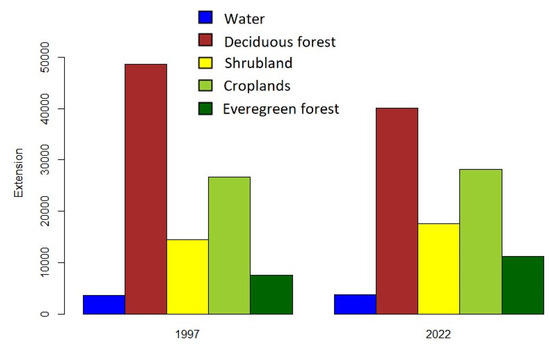
Figure 5.
Bar plot of land data by land type and year.
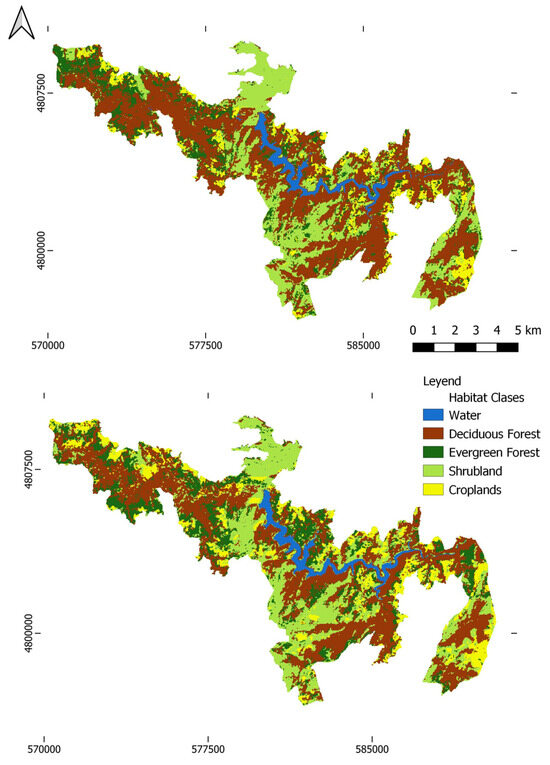
Figure 6.
Maps of land cover habitat classes for 1997 (top) and 2022 (bottom) in the ‘Fragas do Eume’ Natural Park. Coordinates are in the UTM coordinate system, WGS84 Zone 29N.
The primary land-cover transitions were from deciduous forest to evergreen forest and shrubland, and from evergreen forest to shrubland (Table 4).
Table 4.
Number of pixels and hectares for each class per year.
4. Discussion
The resulting maps derived from a supervised classification procedure indicate significant changes in the main land-cover types identified in the ‘Fragas do Eume’ Natural Park. There has been an increase in the area occupied by Eucalyptus plantations, a species that does not naturally belong to any habitat in the park (Table 4 and Figure 5). Additionally, the analysis of land-cover changes shows how the extent of deciduous forest has decreased from 1997 to 2022 in favour of evergreen forest by 7% (see Figure 5). These results confirm previous studies in the natural park. An analysis based on the Spanish forest map showed a loss of deciduous forest of 7% between 1998 and 2011, decreasing from 3608 to 2961 ha [21]. According to this study, much of it was replaced by new Eucalyptus plantations, which increased by 2.35%, from 1125 to 1340 ha. The estimates derived from our analysis are lower than those obtained in this study, although neither the study period nor the data source are the same. However, they do confirm a loss of native forest (see Figure 5). It is also important to consider possible classification errors, which can affect the final estimate of each class and therefore the conversion from one habitat type to another [32].
In addition, a forest fire that took place in the natural park in March 2012, affected 750 ha dominated by non-native vegetation, mainly Eucalyptus globulus, and 350 ha dominated by native vegetation, mainly Quercus robur [18]. However, a later study observed that vegetation in the mixed forest of the natural park recovered quickly after the fire, which did not seem to cause significant changes nor favoured the introduction of invasive species [35]. At the soil level, soil quality seems to have been more determined by the type of vegetation (native or non-native) than by the impact of the fire [18]. Therefore, the changes observed in our analysis seem to be mainly determined by the conversion of native forest into Eucalyptus plantations and, to a lesser extent, cropland (see Figure 4). This may be due to the higher economic profitability of plantations with fast-growing species, favoured by the absence of a management plan in the park for 25 years [36]. In fact, the increase in plantations in the park was one of the main threats to native forest before its designation as a natural park. Teixido et al. (2009) [8] found a 197% increase between 1957 and 2003. Native forest decreased during that period by 20%, partly due to Eucalyptus plantations and the construction of a reservoir.
These results point to potential implications for biodiversity conservation in the natural park. Eucalyptus globulus plantations have a lower biodiversity than native forests [37,38,39,40]. Therefore, the loss of deciduous forests directly affects the biodiversity of the ‘Fragas do Eume’ Natural Park. This could be due to both the lack of land management of protected areas and the reduced investment for conservation actions [20]. It also seems that there were no political or legal actions regarding Eucalyptus plantations within the park boundaries during the study period. On the other hand, it should be noted that fire also favours the establishment of new eucalyptus individuals, well-adapted to fires, as well as the germination and possible expansion of invasive species such as Acacias (e.g., Acacia melanoxylon) [41,42]. Moreover, this vegetation is more flammable, due to certain adaptive traits such as its oil content and bark type, which increases the risk of fire if not well managed [43,44]. Therefore, the presence of deciduous forests, mainly within an agroforestry matrix, presents multiple benefits in terms of biodiversity conservation, prevention of invasive species expansion, and defence against potential forest fires [45,46].
Despite finding a consistent result with previous studies, the extent quantified in our study differs from that observed in those studies. This may be largely due to the temporal period of analysis, as well as the different sources of information. In this sense, our study, which explicitly includes this aspect, highlights the need to consider the uncertainty associated with using different sources of information when analysing landscape changes. The inclusion of auxiliary information tends to increase the classification capacity of satellite images (see e.g., [47]). In our case, this only occurred for the year 2022, while for 1997 it did not improve the quality of the final maps. In other studies, additional information added into classification procedure provides more reliability to the map, but it seems that in this study, the data with additional information and without it are quite similar (Figure 3). Despite the high performance of the different machine learning techniques, our results show variability, both in accuracy during the classification process and in the determined extent (see Figure 3). This confirms the need to consider different classification techniques to represent this uncertainty [48,49]. This methodology can be easily applied to other socioecological systems, from natural or semi-natural to urban areas [50,51]. It enables the long-term change analysis of the main land cover typologies in standardised way at large scale. The development of cloud-computing platforms, such as Google Earth Engine, can facilitate the application of this protocol to other context and time periods. The inclusion of a wide range of learning machine methods would allow us to deal with the uncertainty associated with the classification algorithm. In addition, the methodology is flexible enough to incorporate ancillary data, as well as images from other satellite missions, such as Sentinel, which offers higher spatial and spectral resolution.
5. Conclusions
The maps resulting from the classification of the Landsat images indicate significant changes in the main land-cover types identified in the ‘Fragas do Eume’ Natural Park over the last 25 years. The increase in Eucalyptus plantations, a non-native species in the park, and the decrease in native deciduous forests are the most prominent changes. These results confirm the habitat loss previously observed in the area. The lack of effective conservation policies and economic pressure for the cultivation of fast-growing species appear to be driving this landscape transformation.
The uncertainty associated with the use of different sources of information and classification techniques highlights the need to address the variability in results and consider multiple analytical approaches to accurately interpret landscape changes. The accuracy of the machine learning algorithm is case-specific, and it requires comparison across different techniques. The integration of auxiliary information can improve the reliability of the resulting maps and thus provide more consistent information about changes in land cover.
This study underscores the urgency of implementing active and sustainable conservation measures to protect natural ecosystems and promote biodiversity in the ‘Fragas do Eume’ Natural Park. The lack of political and legal actions regarding Eucalyptus plantations requires an immediate response to ensure the long-term protection of this important natural area.
Author Contributions
Conceptualization, A.R.; Validation, P.D.-G.; Formal analysis, P.D.-G.; Investigation, P.D.-G. and A.R.; Data curation, P.D.-G.; Writing—original draft, P.D.-G.; Writing—review & editing, A.R.; Supervision, A.R. All authors have read and agreed to the published version of the manuscript.
Funding
A.R. was supported by the ‘Ramón y Cajal’ fellowship programs of the Spanish Ministry of Science and Innovation (RYC2022-036822-I).
Data Availability Statement
The raw data supporting the conclusions of this article will be made available by the authors on request.
Conflicts of Interest
The authors declare no conflict of interest.
References
- Shvidenko, A.; Barber, C.V.; Persson, R. Forests and woodland systems. In Ecosystems and Human Well-Being: Current State and Trends; Island Press: Washington, DC, USA, 2005; Volume 1, pp. 587–621. [Google Scholar]
- Thompson, I.; Mackey, B.; McNulty, S.; Mosseler, A. Forest resilience, biodiversity, and climate change. In A Synthesis of the Biodiversity/Resilience/Stability Relationship in Forest Ecosystems; Technical; Secretariat of the Convention on Biological Diversity: Montreal, QC, Canada, 2009; Series No. 43. [Google Scholar]
- Halleux, V. Preparing the Post-2020 Biodiversity Framework; Servicio de Investigación del Parlamento Europeo: Luxembourg, 2020. [Google Scholar]
- Convención de las Naciones Unidas de Río de Janeiro Sobre la Diversidad Biológica. 5 de junio de 1992. Available online: https://www.cbd.int/doc/legal/cbd-en.pdf (accessed on 24 September 2024).
- Directiva 92/43/CEE de 1992 [Consello das Comunidades Europeas] Relativa á Conservación dos Hábitats Naturais e da Fauna e Flora Silvestres 21 de Maio de 1992 DO, C.E. No. 206. Available online: https://eur-lex.europa.eu/LexUriServ/LexUriServ.do?uri=CONSLEG:1992L0043:20070101:es:PDF (accessed on 24 September 2024).
- Directiva 2009/147/CE de 2009 [Parlamento Europeo e Consello da Unión Europea]. Relativa á Conservación das Aves Silvestres. 30 de Novembro de 2009. D. O. I. 184. Available online: https://eur-lex.europa.eu/legal-content/ES/TXT/?uri=celex%3A32009L0147 (accessed on 24 September 2024).
- Banco de Datos da Natureza. Mapa Forestal de España (MFE50). Ministerio para a Transición Ecolóxicae o Reto Demográfico [MITECO]. 2010. Available online: https://www.miteco.gob.es/es/biodiversidad/servicios/banco-datosnaturaleza/informacion-disponible/mfe50.aspx (accessed on 24 September 2024).
- Ministerio para a Transición Ecolóxica e o Reto Demográfico [MITECO]. 9 Bosques. 2005. Available online: https://www.miteco.gob.es/es/biodiversidad/temas/espacios-protegidos/red-natura-2000/rn_fichas_esp_bosques.aspx (accessed on 24 September 2024).
- Roces, J.V.; García, L.; Colina, A.; Álvarez, P.; Atlánticos, B. Evaluación de los Ecosistemas del Milenio de España (EME); Universidad de Oviedo-INDUROT: Mieres, Spain, 2016. [Google Scholar]
- Teixido, A.L.; Quitanilla, L.G.; Carreño, F. Fragmentación del bosque y pérdida del hábitat de helechos amenazados en el Parque Natural Fragas do Eume (NW de España). Ecosistemas 2009, 18, 60–73. [Google Scholar]
- Seidl, R.; Thom, D.; Kautz, M.; Martin-Benito, D.; Peltoniemi, M.; Vacchiano, G.; Wild, J.; Ascoli, D.; Petr, M.; Honkaniemi, J.; et al. Forest disturbances under climate change. Nat. Clim. Chang. 2017, 7, 395–402. [Google Scholar] [CrossRef] [PubMed]
- Castroviejo, S.; Aedo, C.; Cirujano, S.; Laínz, M.; Montserrat, P.; Morales, R.; Garmendia, F.M.; Navarro, C.; Paiva, J.; Soriano, C. (Eds.) Flora Ibérica 2: 17–36; Real Jardín Botánico, CSIC: Madrid, Spain, 1990. [Google Scholar]
- García-Borregón, R.; Fernández, R.; Bris, B.; Ramil, P.; Crecente, R.; Ferreiro, J.; Hinojo, B.A.; de Novoa, B.; Rubinos, M.A.; Rodríguez, M.A.; et al. Plan Director da Rede Natura 2000 de Galicia: Anexo VI: Espazos das Áreas Montañosas; Xunta de Galicia: Santiago de Compostela, Spain, 2012; pp. 23–41. [Google Scholar]
- Tecnologías y Servicios Agrarios, S.A. (TRAGSATEC). Cuarto Inventario Forestal Nacional: Galicia; Ministerio de Medio Ambiente, y Medio Rural y Marino: Madrid, Spain, 2011; Available online: https://www.miteco.gob.es/es/biodiversidad/temas/inventarios-nacionales/galicia_tcm30-531786.pdf (accessed on 24 September 2024).
- Villanueva-Aranguren, J.A.; Manuel-Valdés, C.M.; Gil-Sánchez, L. Tercer inventario forestal nacional 1997–2006: A Coruña, Lugo, Ourense, Pontevedra; Ministerio de Medio Ambiente: Madrid, España, 2002. [Google Scholar]
- Tomé, M.; Almeida, M.H.; Barreiro, S.; Branco, M.R.; Deus, E.; Pinto, G.; Silva, J.S.; Soares, P.; Rodríguez-Soalleiro, R. Opportunities and challenges of Eucalyptus plantations in Europe: The Iberian Peninsula experience. Eur. J. For. Res. 2021, 140, 489–510. [Google Scholar] [CrossRef]
- Madeira, M.; Cortez, N.; Azevedo, A.; Magalhães, M.C.; Ribeiro, C.; Fabião, A. As plantações de eucalipto e o solo. In O eucalipto em Portugal-Impactes Ambientais e Investigação Científica; En Alves, A.M., Pereira, J.S., Silva, J.M.N., Eds.; Departamento de Ciências do Ambiente, Instituto Superior de Agronomia, Universidade Técnica de Lisboa: Lisbon, Portugal, 2007; pp. 138–174. [Google Scholar]
- Lombao, A.; Barreiro, A.; Carballas, T.; Fontúrbel, M.T.; Martín, A.; Vega, J.A.; Fernández, C.; Díaz-Raviña, M. Changes in soil properties after a wildfire in Fragas do Eume Natural Park (Galicia, NW Spain). CATENA 2015, 135, 409–418. [Google Scholar] [CrossRef]
- Ceccon, E.; Martinez-Ramos, M. Aspectos ambientales referentes al establecimiento de plantaciones de eucalipto de gran escala en áreas tropicales: Aplicación al caso de México. Interciencia 1999, 24, 351–359. [Google Scholar]
- Cidrás, D.; Paül, V. Rewilding Shouldn’t Be Reactive: Fragas do Eume Natural Park in the Face of an Invasive Alien Species. J. Nat. Conserv. 2022, 69, 126252. [Google Scholar] [CrossRef]
- Cidrás, D. Reimagining (Un)Protected Areas. An Analysis of Eucalyptus Consolidation in Fragas do Eume Natural Park (Galicia, NW Iberian Peninsula). In Infinite Rural Systems in a Finite Planet: Bridging Gaps towards Sustainability; Paül, V., Lois, R., Trillo, J.M., Haslam-McKenzie, F., Eds.; Universidade de Santiago de Compostela: Santiago de Compostela, Spain, 2018; pp. 187–194. [Google Scholar]
- Decreto 218 de 1997 [Consellería de Agricultura, Gandería y Montes]. Polo que se declara parque naturas ás Fragas do Eume. 11 de agosto de 1997. D. O. G. Núm. 153. Available online: https://www.xunta.gal/dog/Publicados/1997/19970811/AnuncioA37A_es.html (accessed on 24 September 2024).
- Sandoval, A.; Sineiro, R.; Figueroa, R.; de Castro, C. Fragas do Eume: Parque Natural, 2nd ed.; Xunta de Galicia y Terranova: Santiago de Compostela, Spain, 2004. [Google Scholar]
- Consellería de Medio Ambiente, Territorio e Vivenda. Xunta de Galicia. (s.f.). Fauna Vulnerable. Available online: https://cmatv.xunta.gal/seccion-organizacion?content=Direccion_Xeral_Conservacion_Natureza/Biodiversidade/seccion.html&sub=Especies_ameazadas/&ui=Direccion_Xeral_Conservacion_Natureza/Dinamico/Especies/Ameazadas/Fauna_vulnerable/listado_especie_central.html&page=1 (accessed on 18 December 2023).
- Bañares, Á.; Blanca, G.; Güemes, J.; Moreno, J.C.; Ortiz, S. (Eds.) Atlas y Libro Rojo de la Flora Vascular Amenazada de España. Adenda 2017; Ministerio para la Transición Ecológica-Sociedad Española de Biología de la Conservación de Plantas: Madrid, Spain, 2019; p. 220. [Google Scholar]
- Directiva 37/201 [Consellería de Medio Ambiente, Territorio e Infraestruturas]. Polo Que Se Declaran Zonas Especiais De Conservación Os Lugares De Importancia Comunitaria De Galicia E Se Aproba O Plan Director Da Rede Natura 2000 de Galicia. Available online: https://www.xunta.gal/dog/Publicados/2014/20140331/AnuncioCA02-270314-0001_es.html (accessed on 24 September 2024).
- Instituto Geográfico Nacional (IGN). Teledetección. 2020. Available online: https://www.ign.es/web/resources/docs/IGNCnig/OBS-Teledeteccion.pdf (accessed on 24 September 2024).
- Sacristán Romero, F. La Teledetección satelital y los sistemas de protección ambiental. Civilizar 2005, 5, 13–41. [Google Scholar] [CrossRef]
- Pons, X.; Sevillano, E.; Moré, G.; Serra, P.; Cornford, D.; Ninyerola, M. Distribución espacial de la incertidumbre en mapas de cubiertas obtenidos mediante teledetección. Rev. Teledetección 2014, 42, 1. [Google Scholar] [CrossRef]
- Chuvieco Salinero, E. Teledetección ambiental: La Observación de la Tierra Desde el Espacio; 1a. ed. en Esta Presentación, Actualizada; Ariel: Barcelona, Spain, 2008. [Google Scholar]
- Earth Resources Observation and Science (EROS) Centre of the United States Geological Survey (USGS). Available online: https://earthexplorer.usgs.gov/ (accessed on 1 October 2022).
- Sandler, A.M.; Rashford, B.S. Misclassification error in satellite imagery data: Implications for empirical land-use models. Land Use Policy 2018, 75, 530–537. [Google Scholar] [CrossRef]
- García, A.; Martínez, G.L.; Núñez, G.; Guzmán, A. Clasificación supervisada inducción de árboles de decisión, algoritmo k-d. In Proceedings of the Simposium Internacional de Computación CIC-98, Mexico City, Mexico, 11–13 November 1998; Volume 20. [Google Scholar]
- Carletta, J. Squibs and Discussions: Assessing Agreement on Classification Tasks: The Kappa Statistic. Comput. Linguist. 1996, 22, 249–254. [Google Scholar]
- Martínez-Gómez, C.; García-Duro, J.; Pesqueira, X.M.; Basanta, M.; Reyes, O.; Casal, M. Afectou o lume á estrutura e á diversidade vexetal das fragas do Parque Natural Fragas do Eume (NW España)?/Did fire affect the structure and plant diversity of the oak woodlands of the Natural Park Fragas do Eume (NW Spain)? NACC Biol. Nova Acta Cient. Compostel. 2015, 22, 55–68. [Google Scholar]
- Cidrás, D.; Paül, V. Fragas do Eume, 25 años de un parque natural sin plan de gestión: Un estudio crítico desde la ecología política de la conservación. Polígonos. Rev. Geogr. 2021, 33, 1–20. [Google Scholar] [CrossRef]
- López, S.B.; Rivera, J.G.; Sobral, M. Biodiversidad en plantaciones de eucalipto y en robledales del sur de Galicia: Plantas y aves. Nova Acta Cient. Compostel. 2018, 25, 71–81. [Google Scholar]
- Calviño-Cancela, M.; Rubido-Bará, M.; van Etten, E.J. Do eucalypt plantations provide habitat for native forest biodiversity? For. Ecol. Manag. 2012, 270, 153–162. [Google Scholar] [CrossRef]
- Proença, V.M.; Pereira, H.M.; Guilherme, J.; Vicente, L. Plant and bird diversity in natural forests and in native and exotic plantations in NW Portugal. Acta Oecologica 2010, 36, 219–226. [Google Scholar] [CrossRef]
- Goded, S.; Ekroos, J.; Domínguez, J.; Azcárate, J.G.; Guitián, J.A.; Smith, H.G. Effects of eucalyptus plantations on avian and herb species richness and composition in North-West Spain. Glob. Ecol. Conserv. 2019, 19, e00690. [Google Scholar] [CrossRef]
- Nunes, L.J.; Raposo, M.A.; Meireles, C.I.; Gomes, C.J.P.; Ribeiro, N.M.A. The Impact of Rural Fires on the Development of Invasive Species: Analysis of a Case Study with Acacia dealbata Link. in Casal do Rei (Seia, Portugal). Environments 2021, 8, 44. [Google Scholar] [CrossRef]
- Arán, D.; García-Duro, J.; Reyes, O.; Casal, M. Fire and invasive species: Modifications in the germination potential of Acacia melanoxylon, Conyza canadensis and Eucalyptus globulus. For. Ecol. Manag. 2013, 302, 7–13. [Google Scholar] [CrossRef]
- Popović, Z; Bojović, S; Marković, M; Cerdà, A. Tree species flammability based on plant traits: A synthesis. Science of the Total Environment 2021, 800, 149625.
- Pausas, J.G.; Keeley, J.E.; Schwilk, D.W. Flammability as an ecological and evolutionary driver. J. Ecol. 2017, 105, 289–297. [Google Scholar] [CrossRef]
- Pais, S.; Aquilué, N.; Campos, J.; Sil, Â.; Marcos, B.; Martínez-Freiría, F.; Domínguez, J.; Brotons, L.; Honrado, J.P.; Regos, A. Mountain farmland protection and fire-smart management jointly reduce fire hazard and enhance biodiversity and carbon sequestration. Ecosyst. Serv. 2020, 44, 101143. [Google Scholar] [CrossRef]
- Lima, C.G.; Campos, J.C.; Regos, A.; Honrado, J.P.; Fernandes, P.M.; Freitas, T.R.; Santos, J.A.; Vicente, J.R. Fire Suppression and Land-Use Strategies Drive Future Dynamics of an Invasive Plant in a Fire-Prone Mountain Area under Climate Change. SSRN 2023. [Google Scholar] [CrossRef] [PubMed]
- Regos, A.; Ninyerola, M.; Moré, G.; Pon, X. Linking land cover dynamics with driving forces in mountain landscape of the Northwestern Iberian Peninsula. Int. J. Appl. Earth Obs. Geoinf. 2015, 38, 1–14. [Google Scholar] [CrossRef]
- Du, P.; Xia, J.; Zhang, W.; Tan, K.; Liu, Y.; Liu, S. Multiple classifier system for remote sensing image classification: A review. Sensors 2012, 12, 4764–4792. [Google Scholar] [CrossRef]
- Iglesias, M.C.; Hermoso, V.; Campos, J.C.; Carvalho-Santos, C.; Fernandes, P.M.; Freitas, T.R.; Azevedo, J.C. Climate-and fire-smart landscape scenarios call for redesigning protection regimes to achieve multiple management goals. J. Environ. Manag. 2022, 322, 116045. [Google Scholar] [CrossRef]
- Wang, C.; Ren, Z.; Du, Y.; Guo, Y.; Zhang, P.; Wang, G.; Li, T. Urban vegetation cooling capacity was enhanced under rapid urbanization in China. J. Clean. Prod. 2023, 425, 138906. [Google Scholar] [CrossRef]
- Zhang, P.; Dong, Y.; Ren, Z.; Wang, G.; Guo, Y.; Wang, C.; Ma, Z. Rapid urbanization and meteorological changes are reshaping the urban vegetation pattern in urban core area: A national 315-city study in China. Sci. Total Environ. 2023, 904, 167269. [Google Scholar] [CrossRef]


Disclaimer/Publisher’s Note: The statements, opinions and data contained in all publications are solely those of the individual author(s) and contributor(s) and not of MDPI and/or the editor(s). MDPI and/or the editor(s) disclaim responsibility for any injury to people or property resulting from any ideas, methods, instructions or products referred to in the content. |
© 2024 by the authors. Licensee MDPI, Basel, Switzerland. This article is an open access article distributed under the terms and conditions of the Creative Commons Attribution (CC BY) license (https://creativecommons.org/licenses/by/4.0/).