Urban Planning Perspective on Food Resilience Assessment and Practice in the Zhengzhou Metropolitan Area, China
Abstract
:1. Introduction
1.1. Background
1.2. Scientific Significance and Practical Value
1.3. Urban Food Resilience Theoretical Framework
2. Methods
2.1. Research Design
- 1.
- Spatial coverage and land use changes:
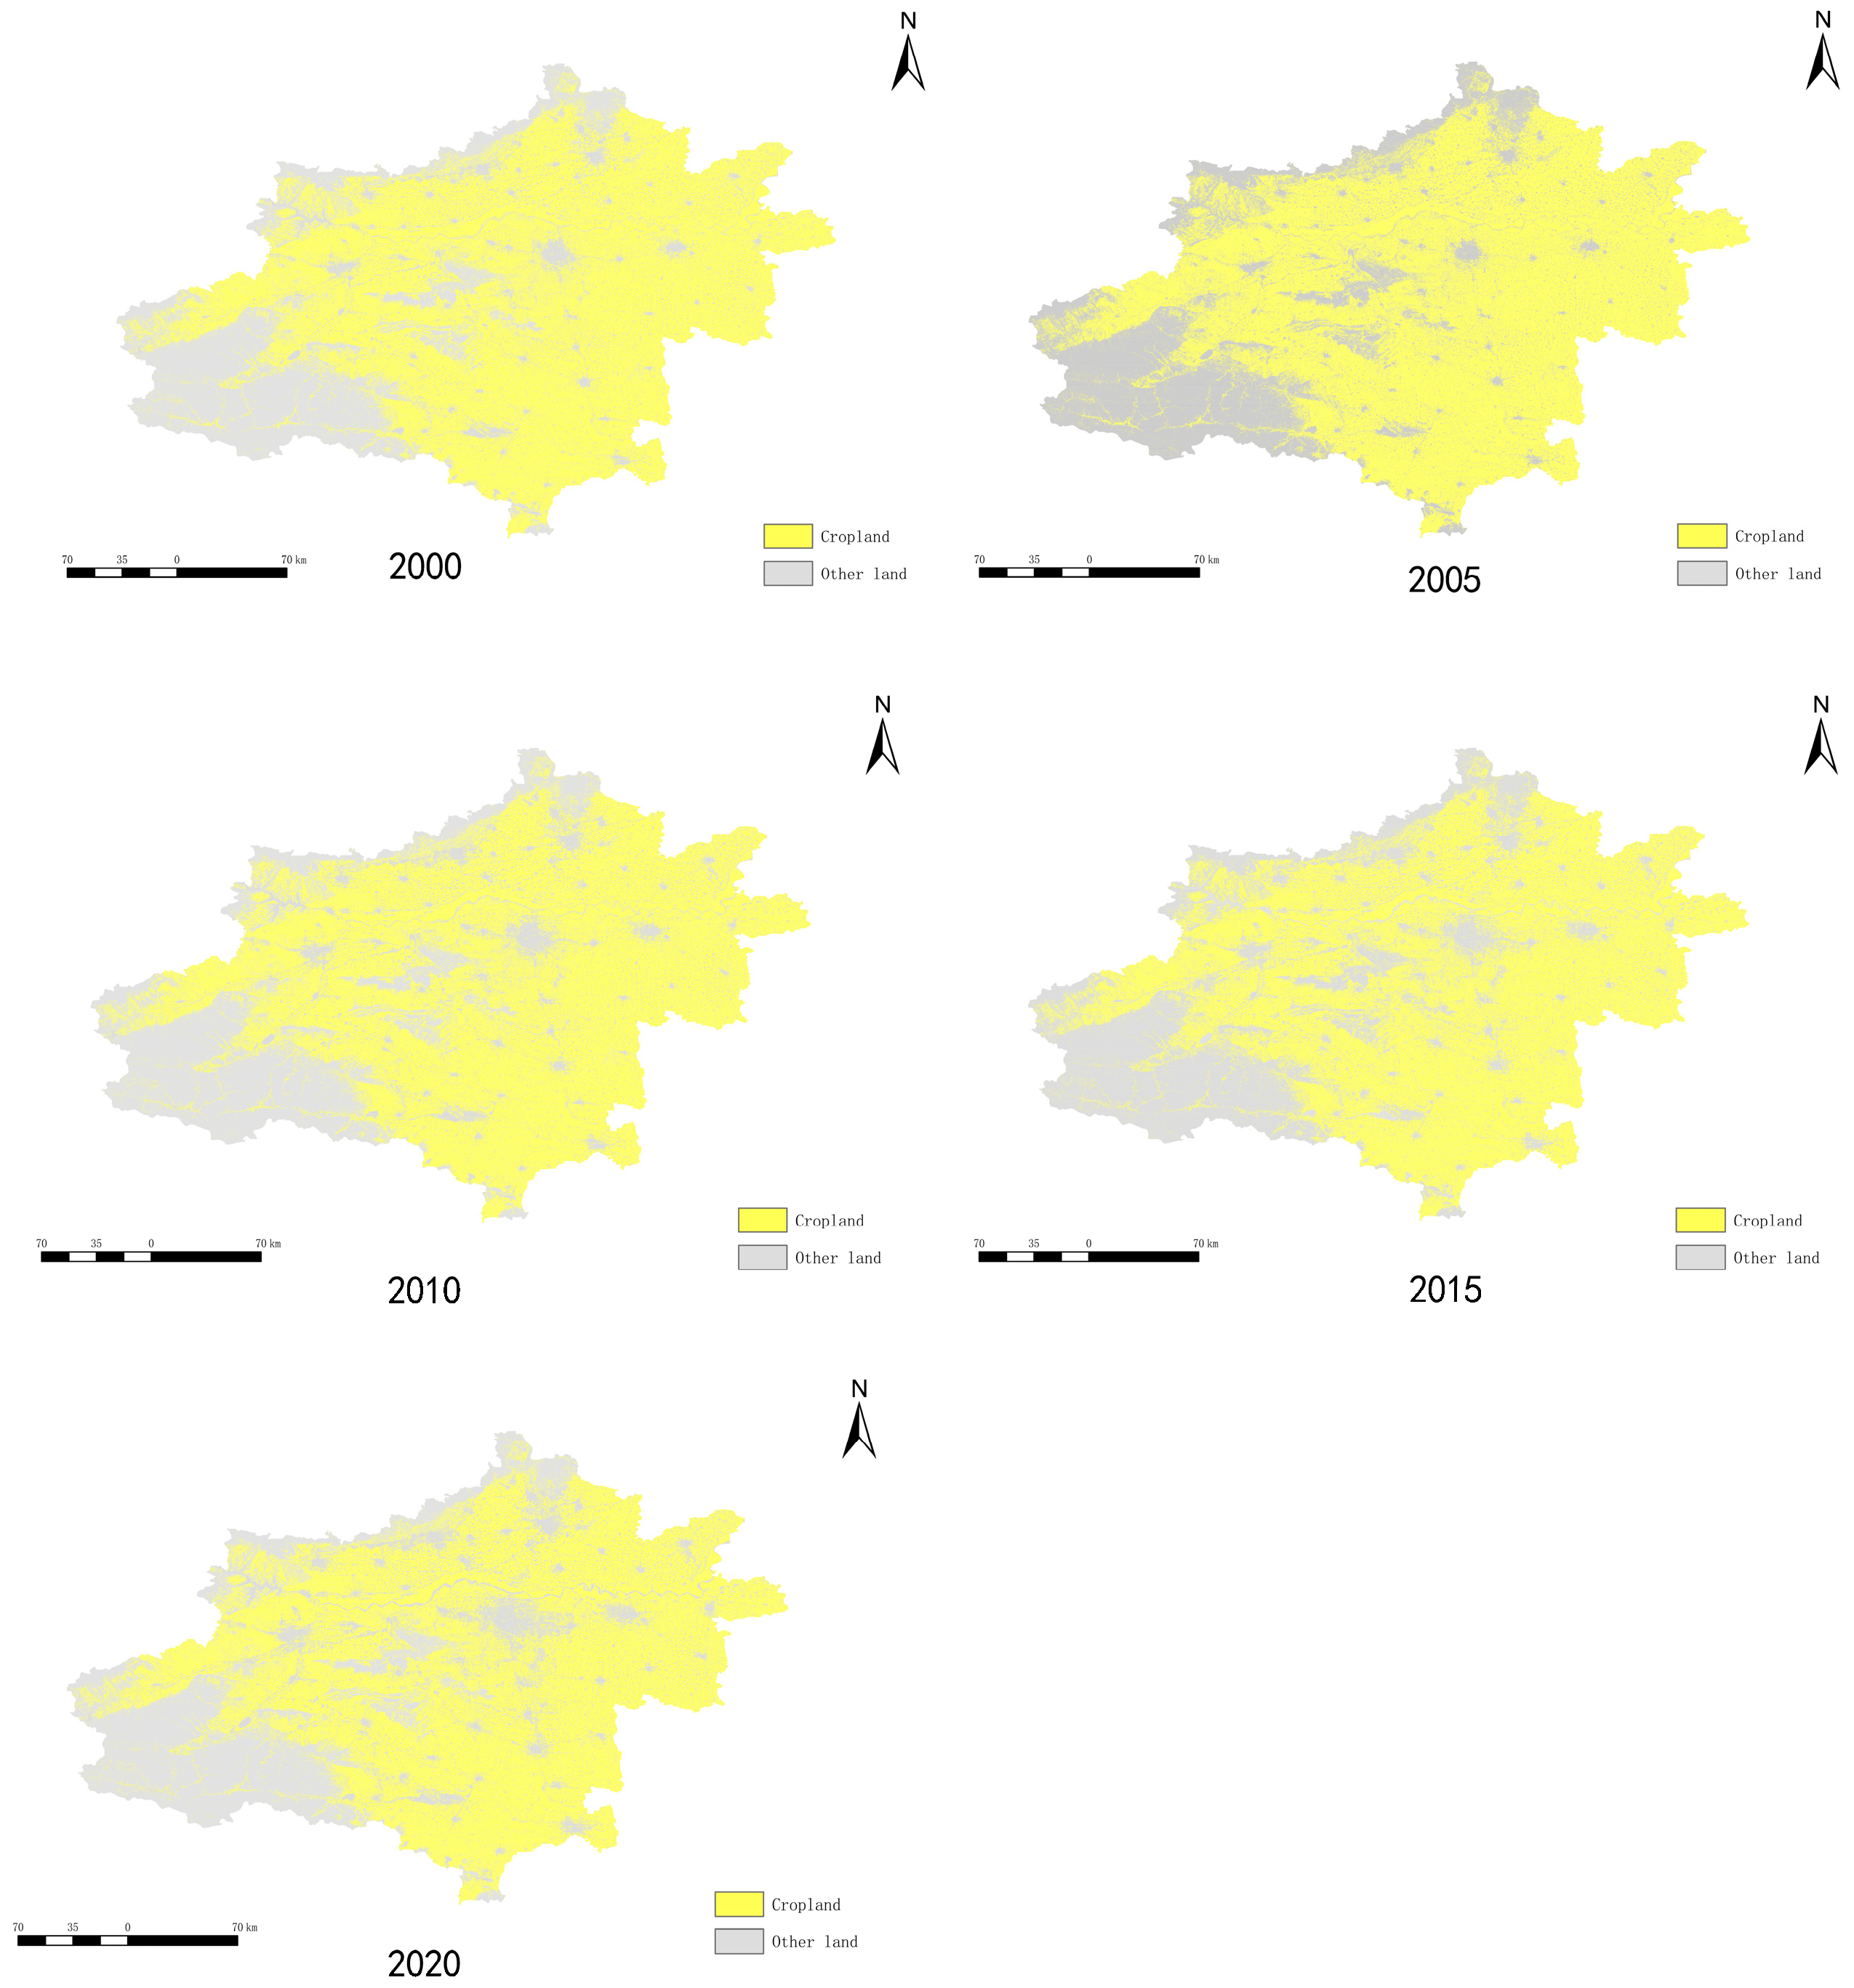
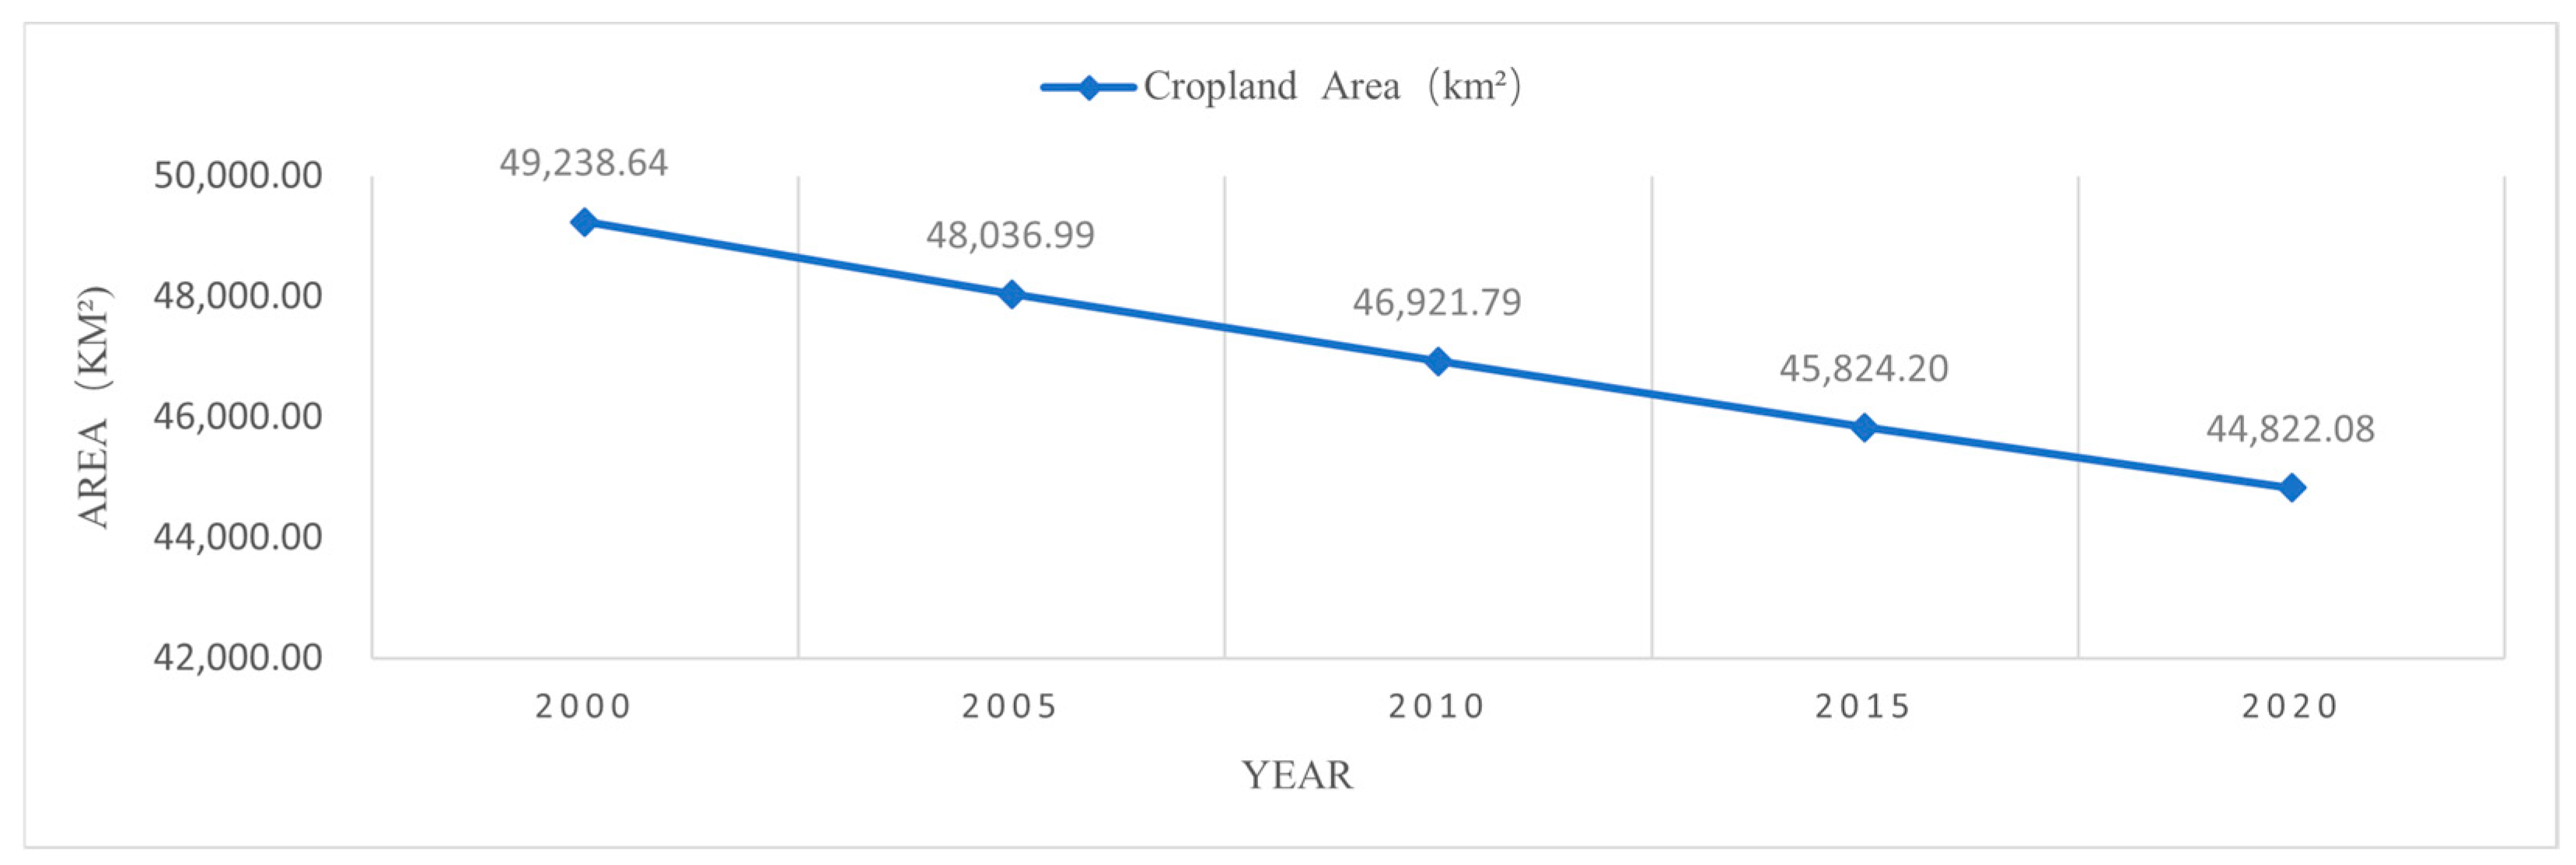
- Changes in the scale and distribution of agricultural land;
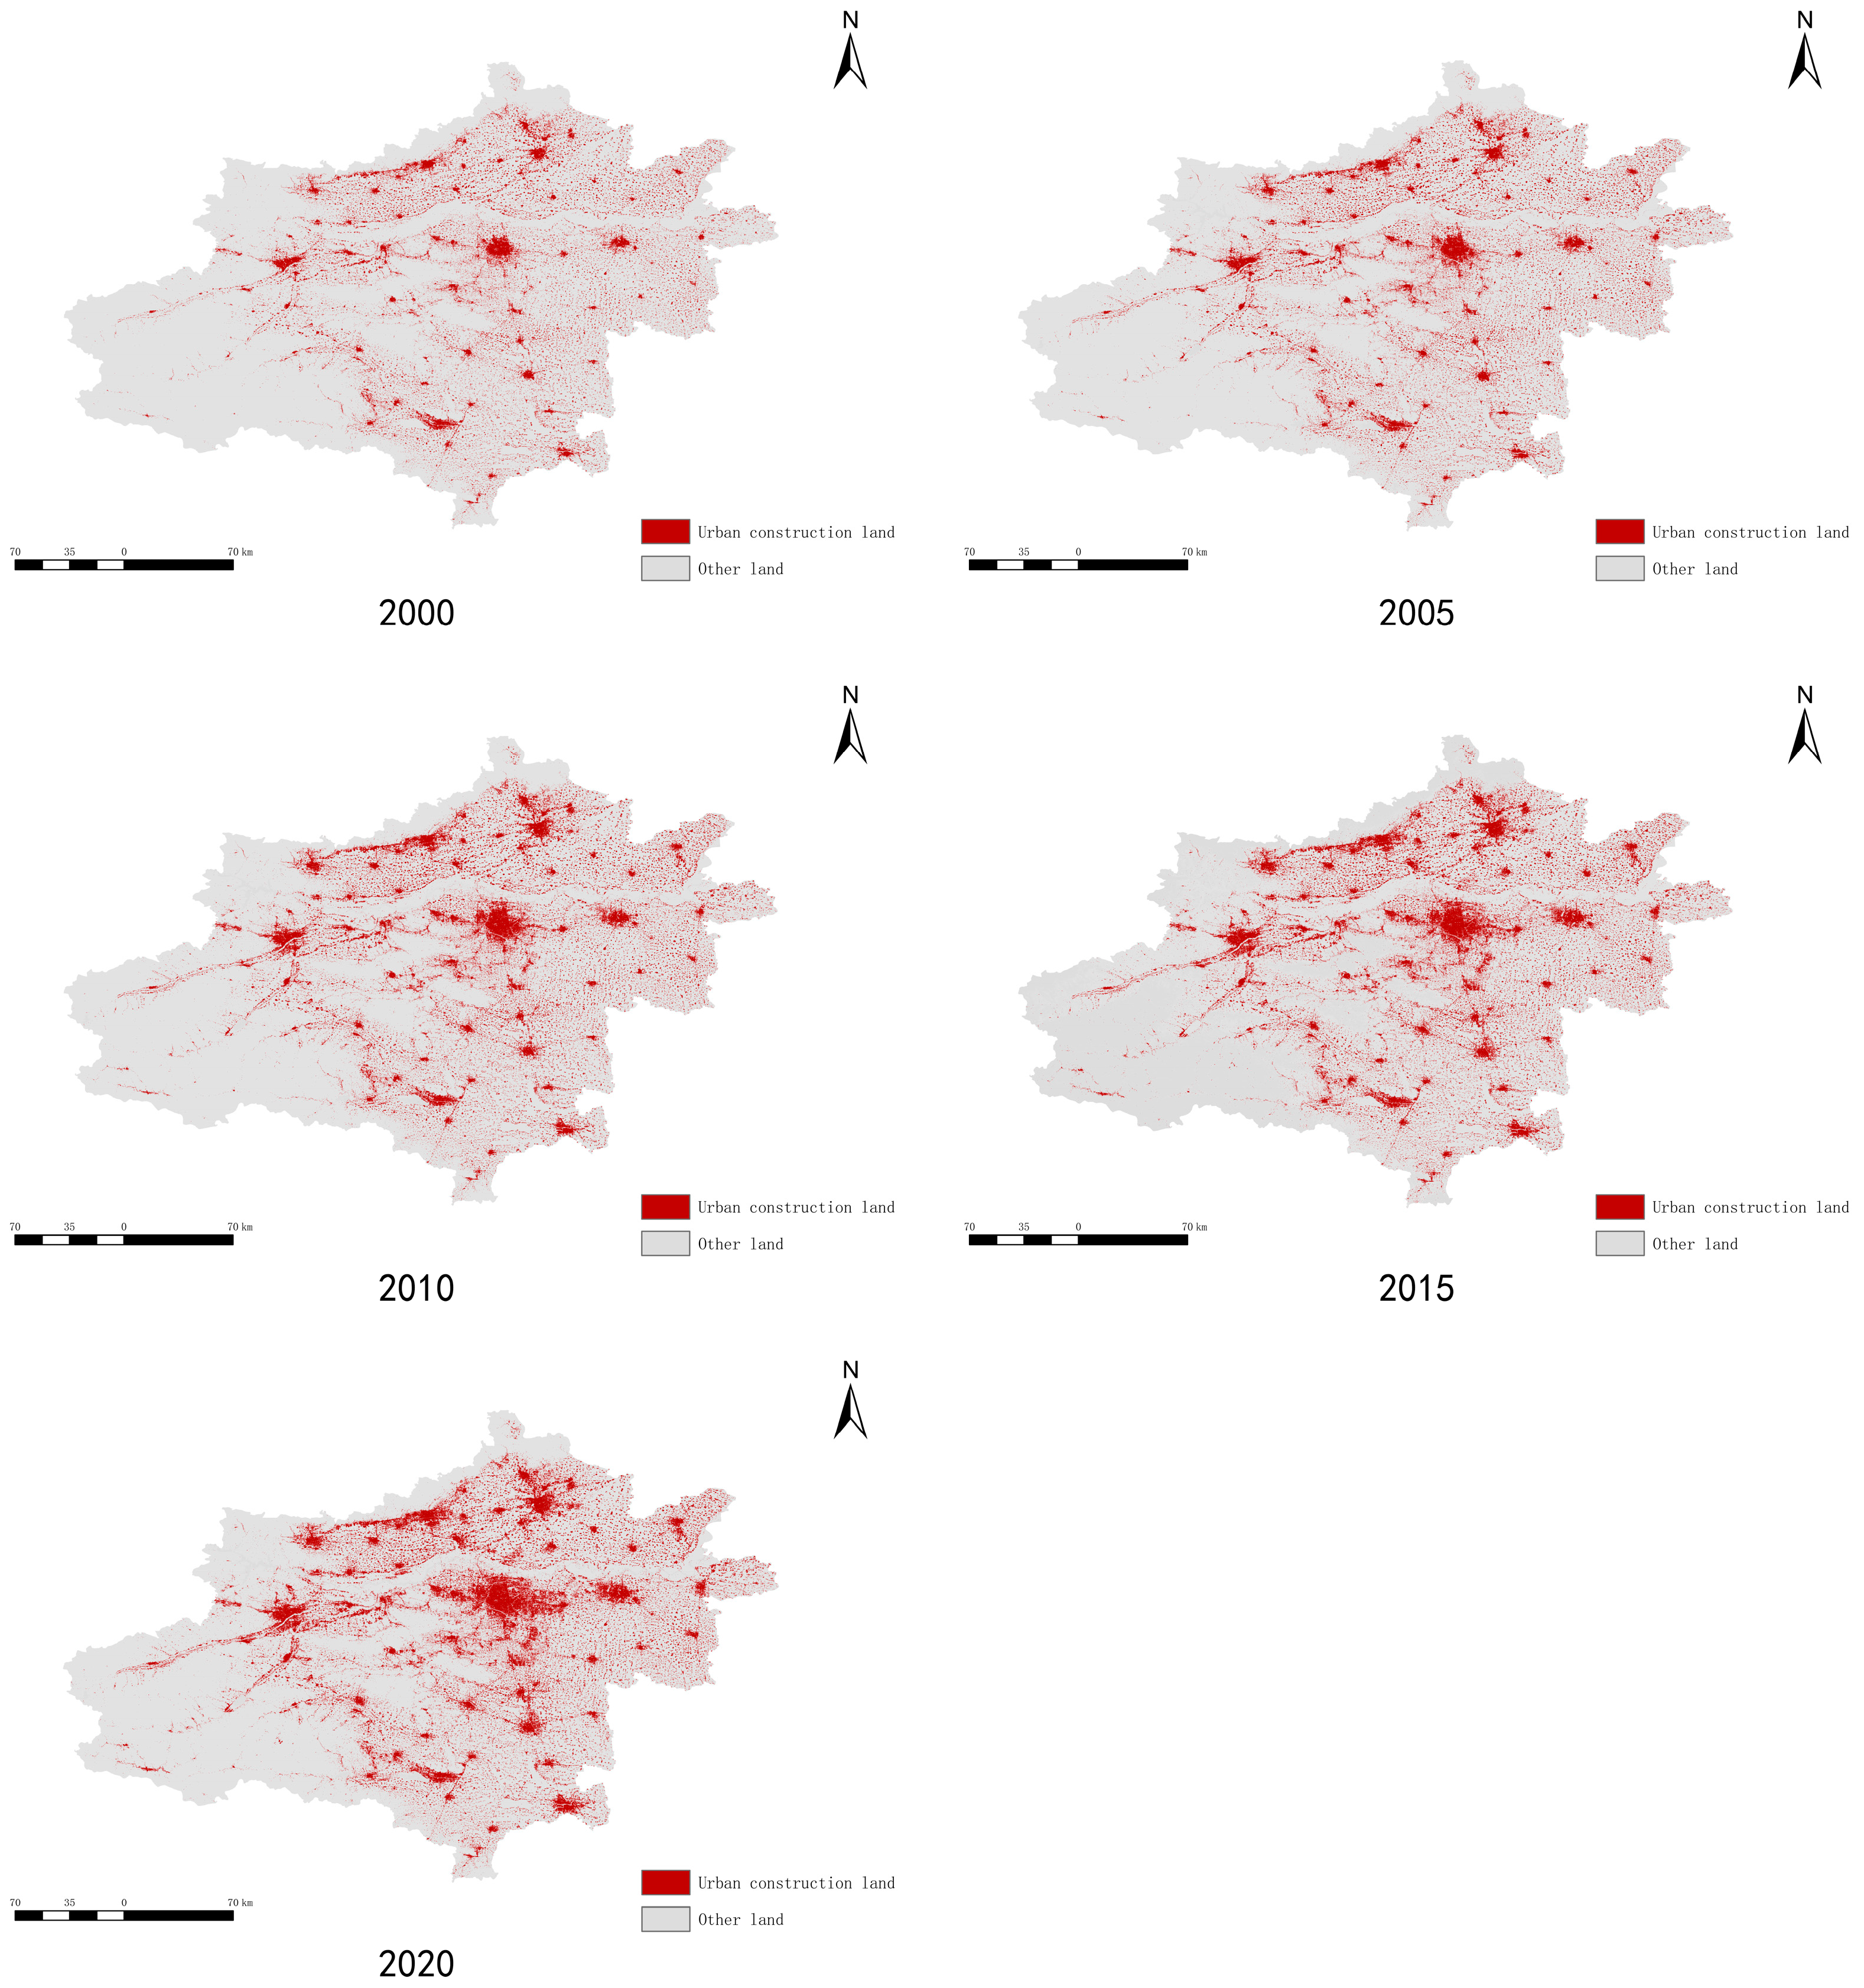
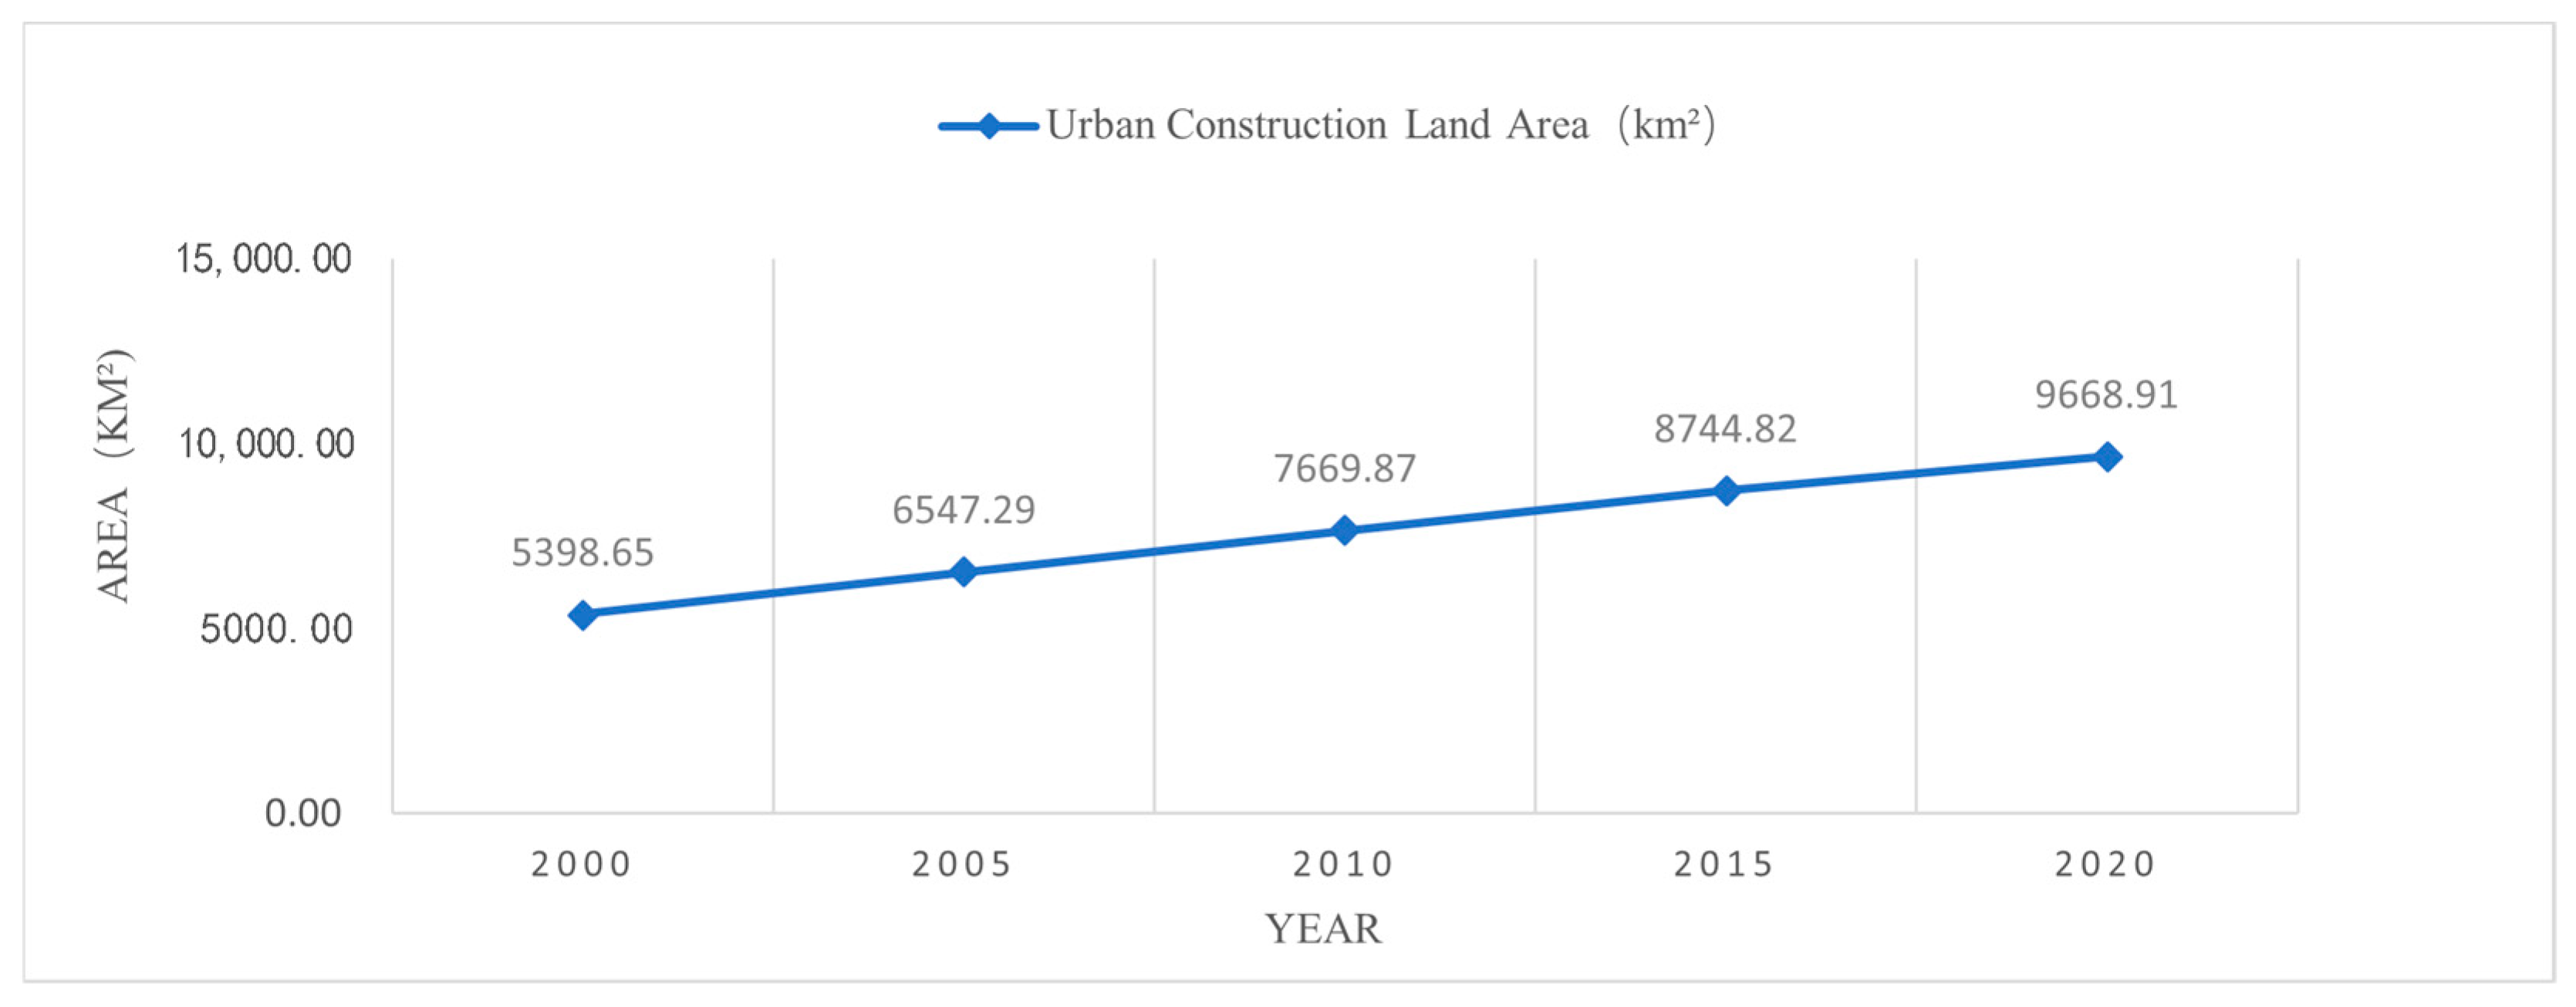
- Expansion of urban construction land;
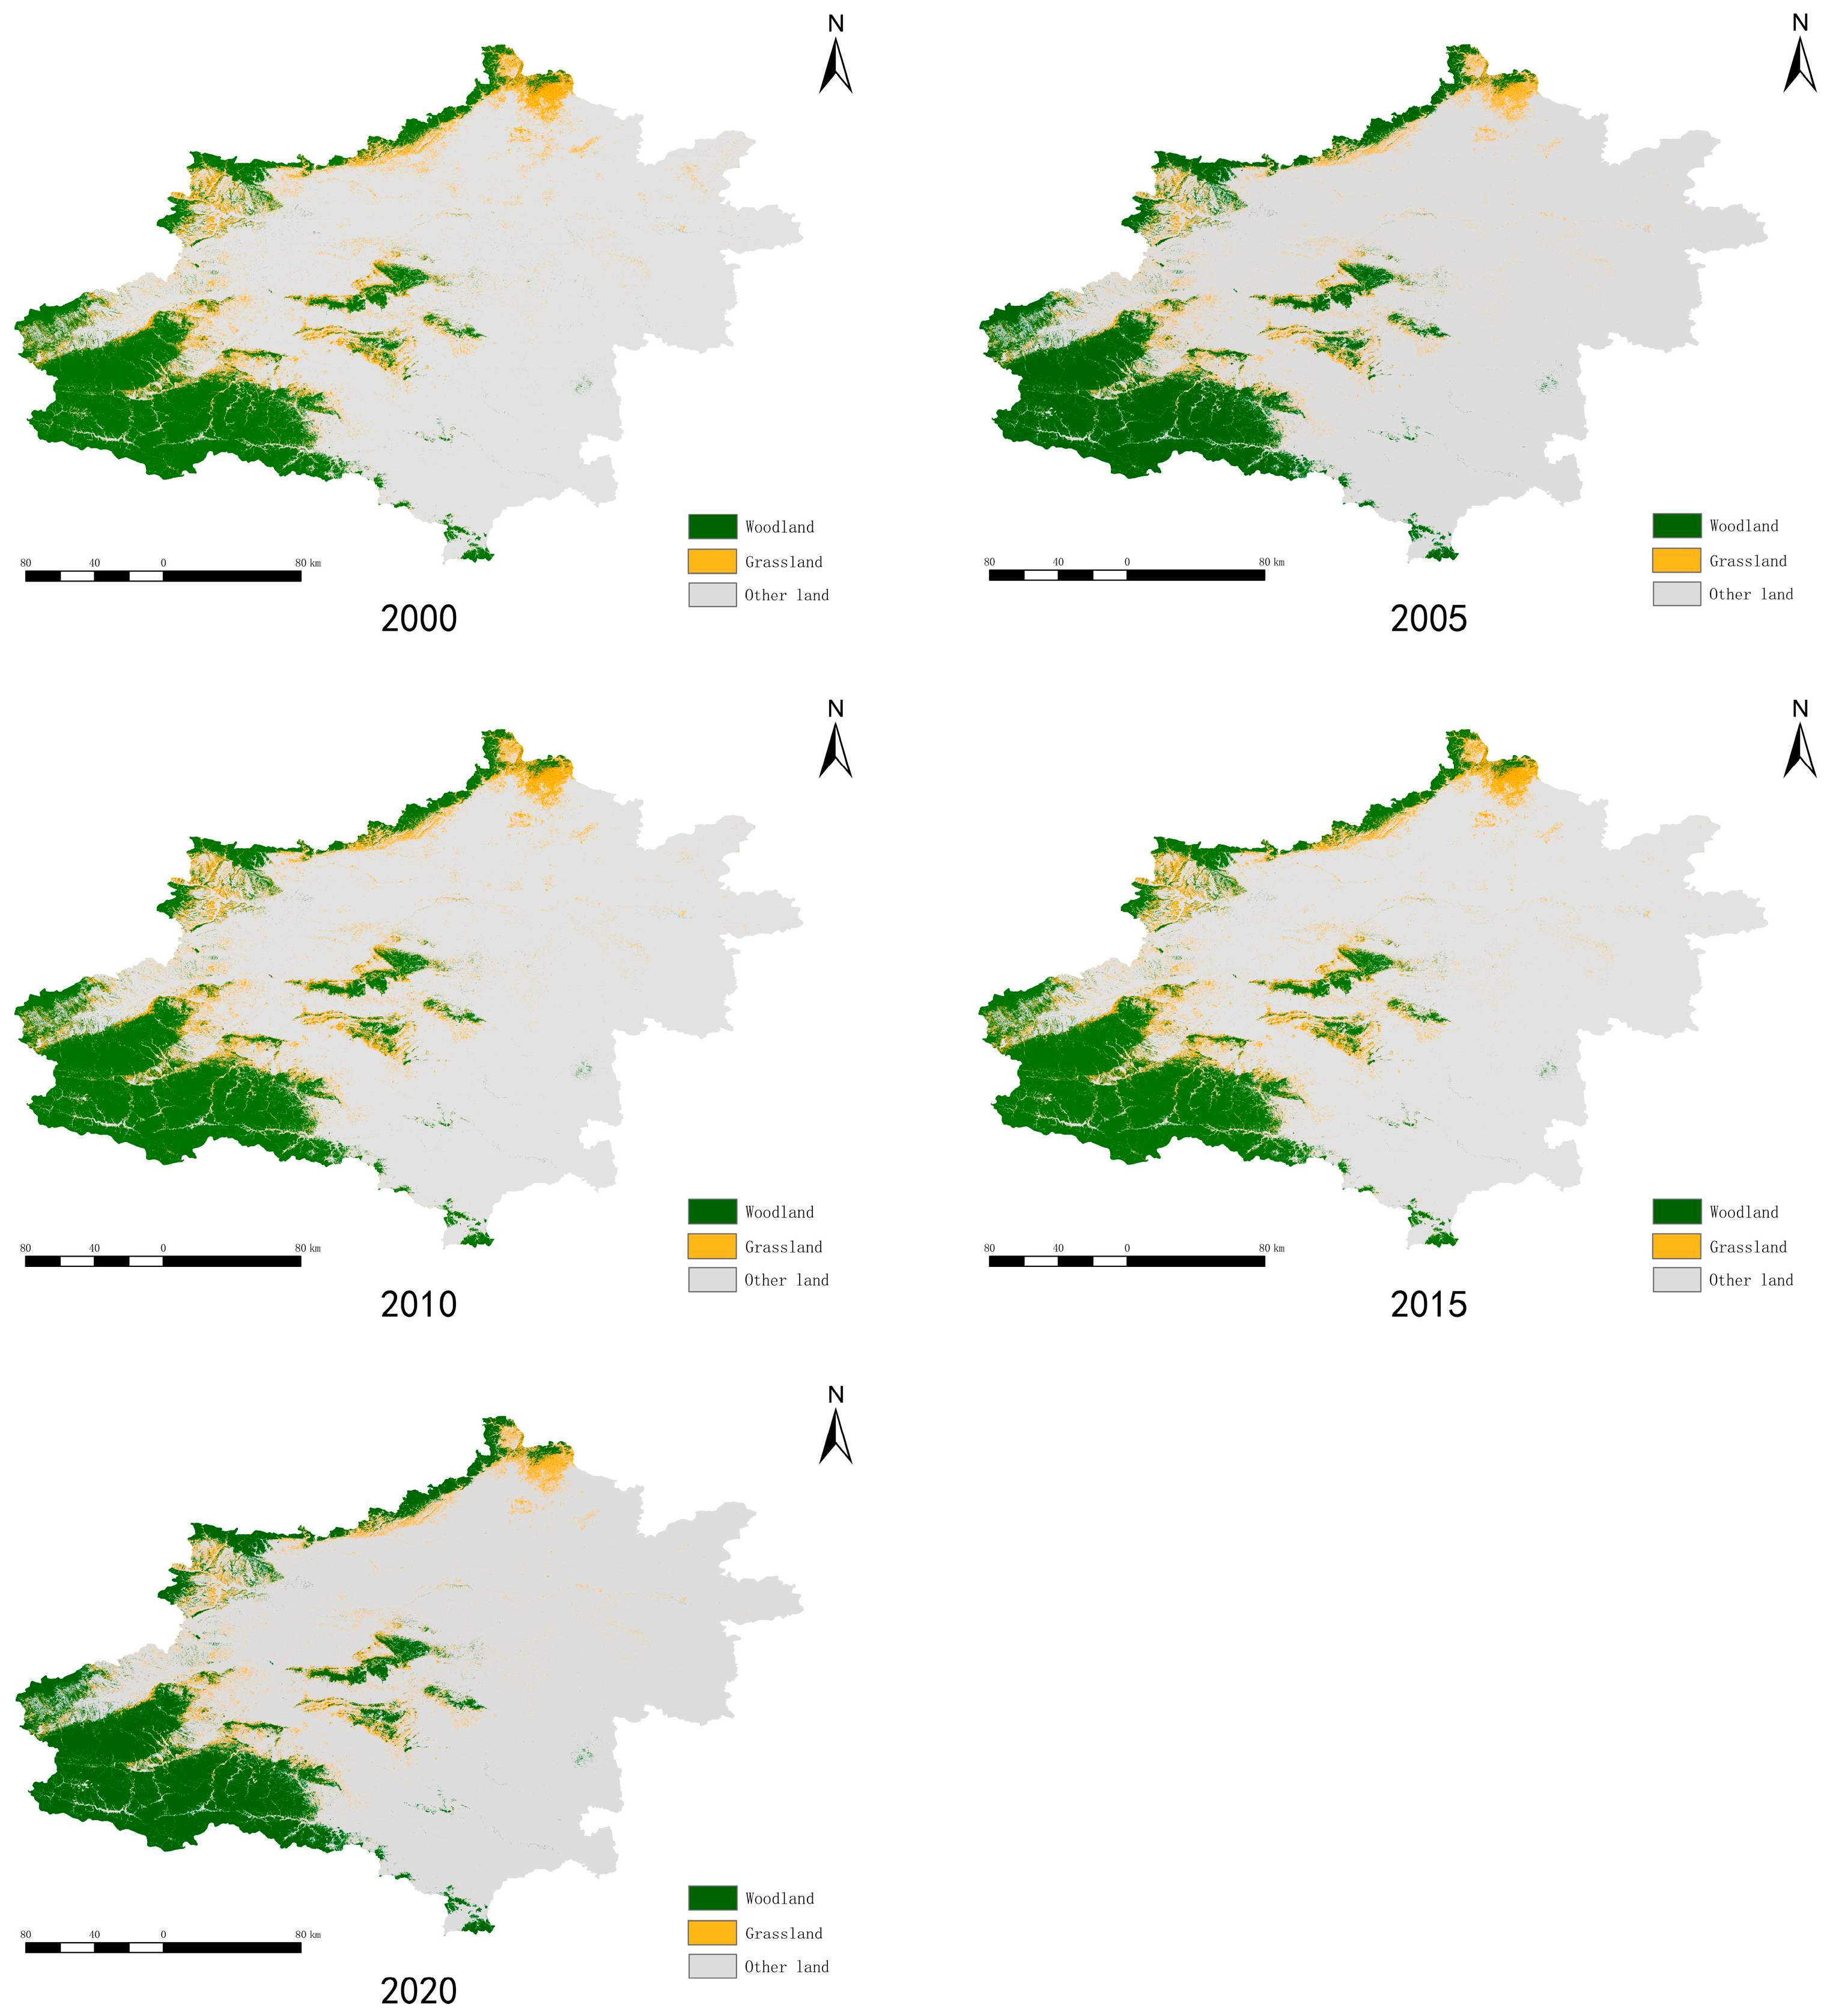
- Stability of woodland and grassland areas;
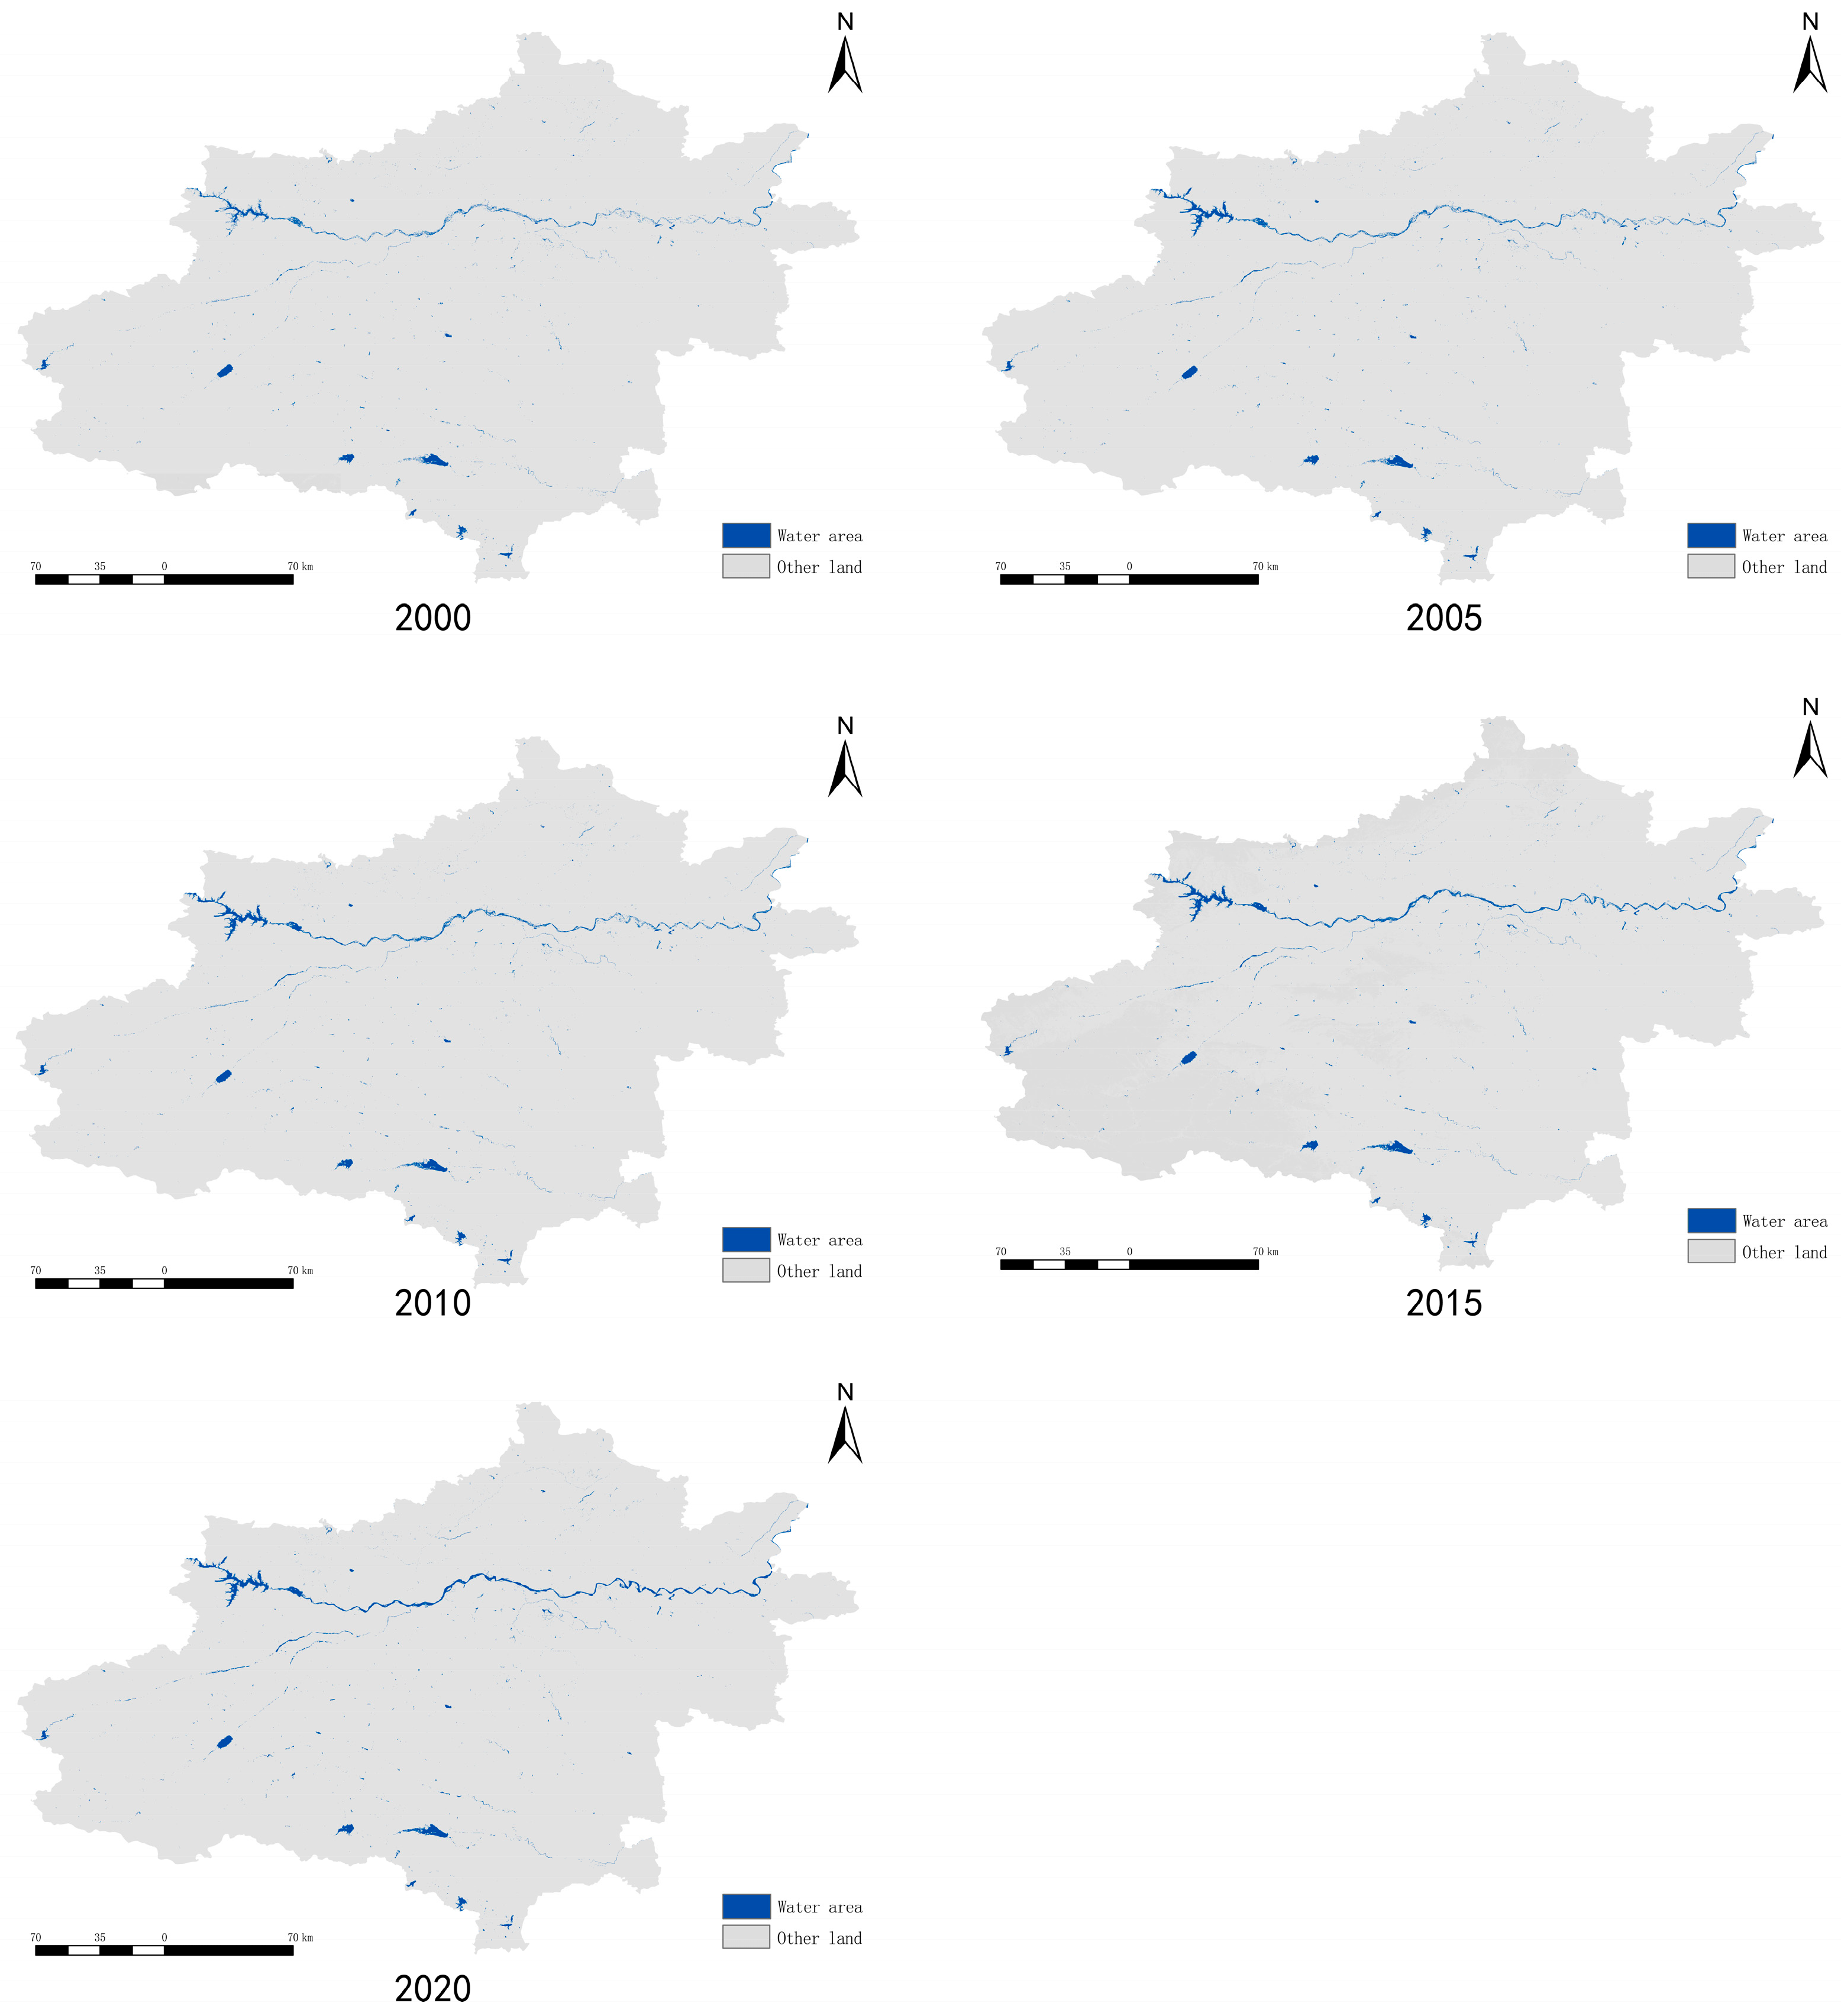
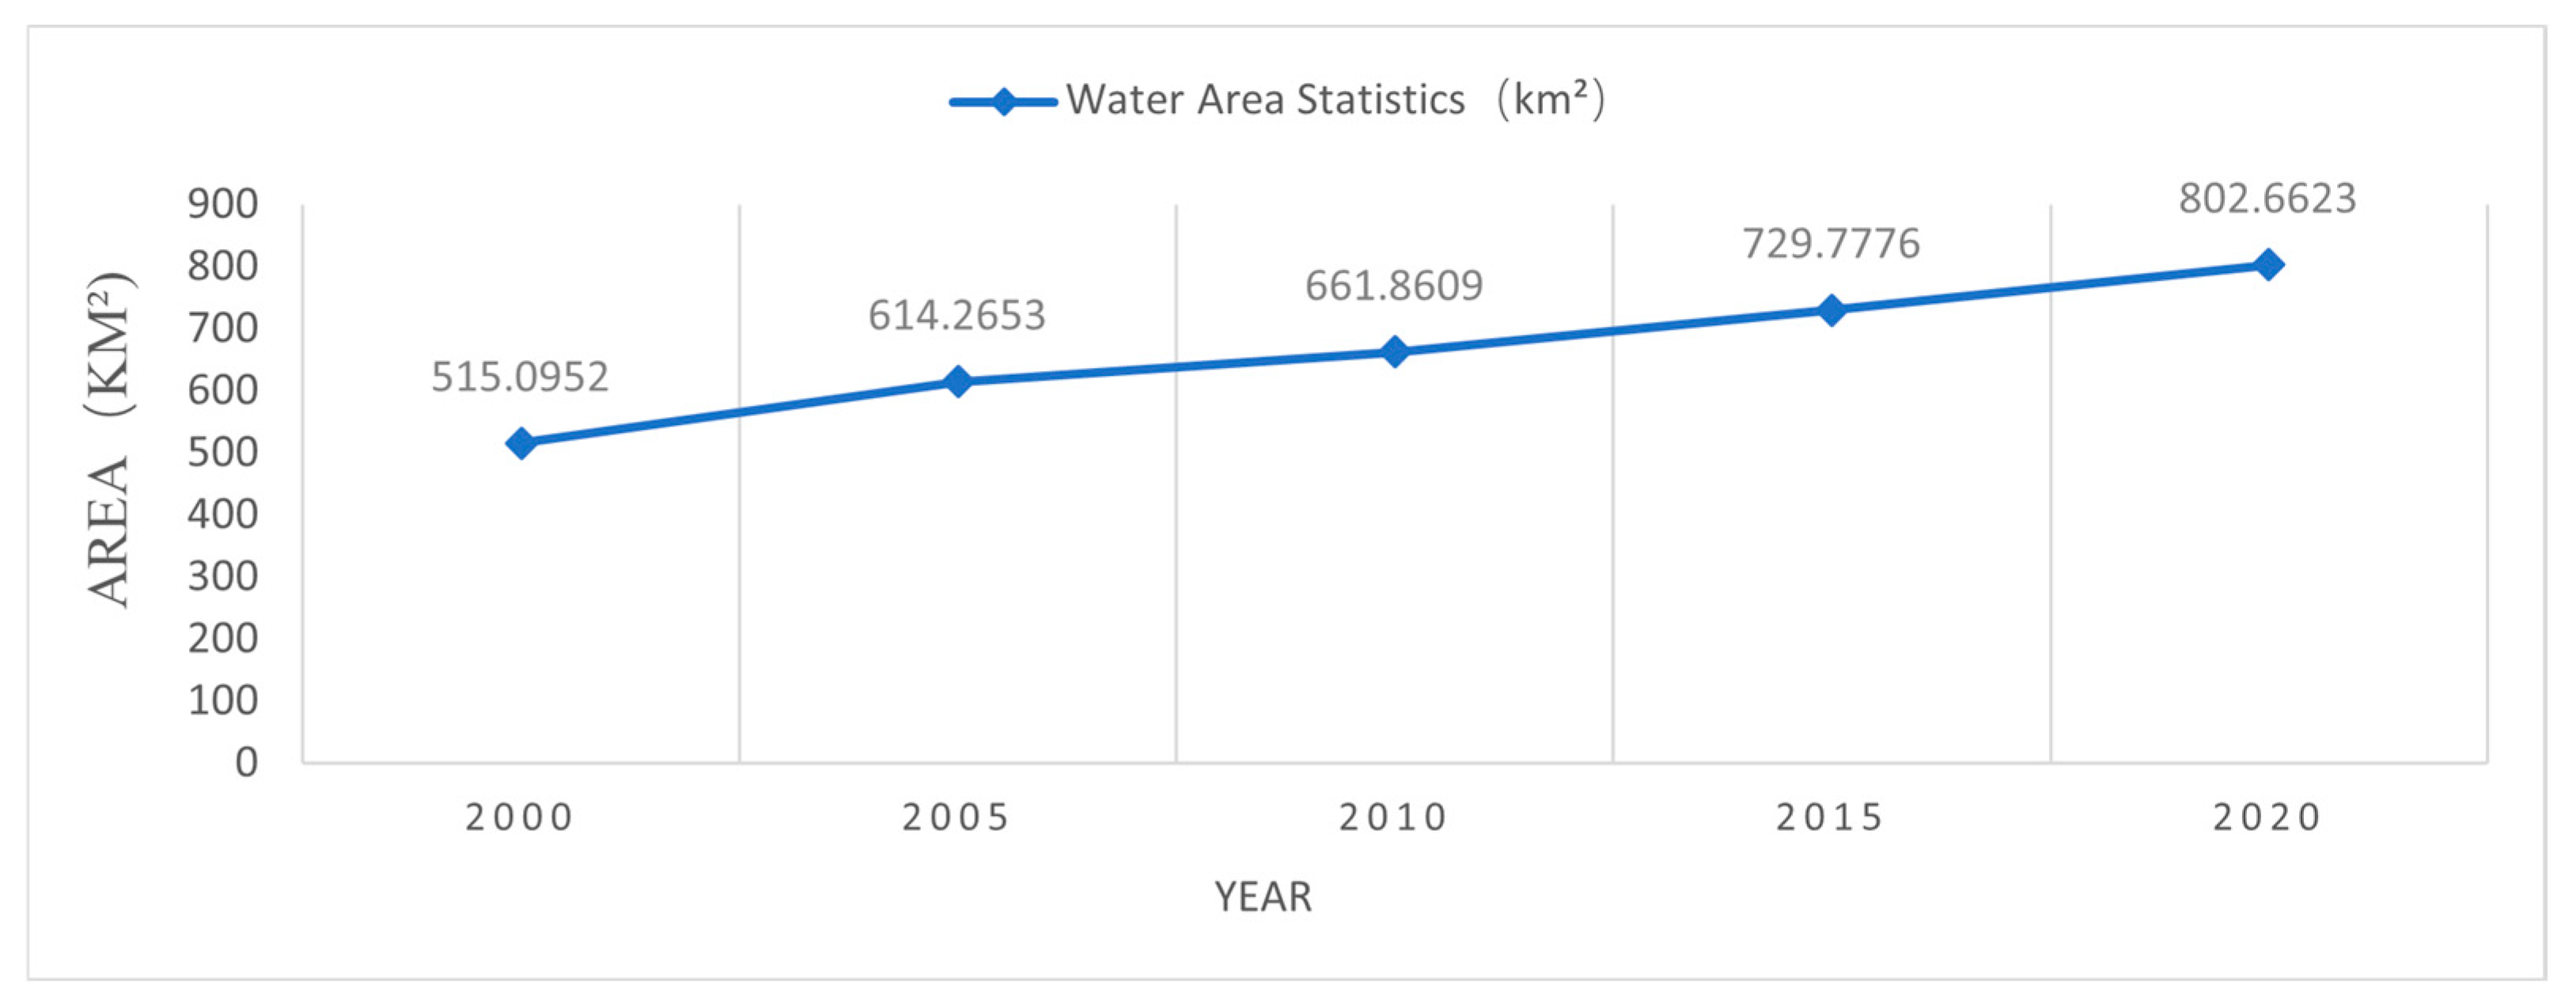
- Changes in water area, including wetlands.
- 2.
- Spatial distribution of food system infrastructure:
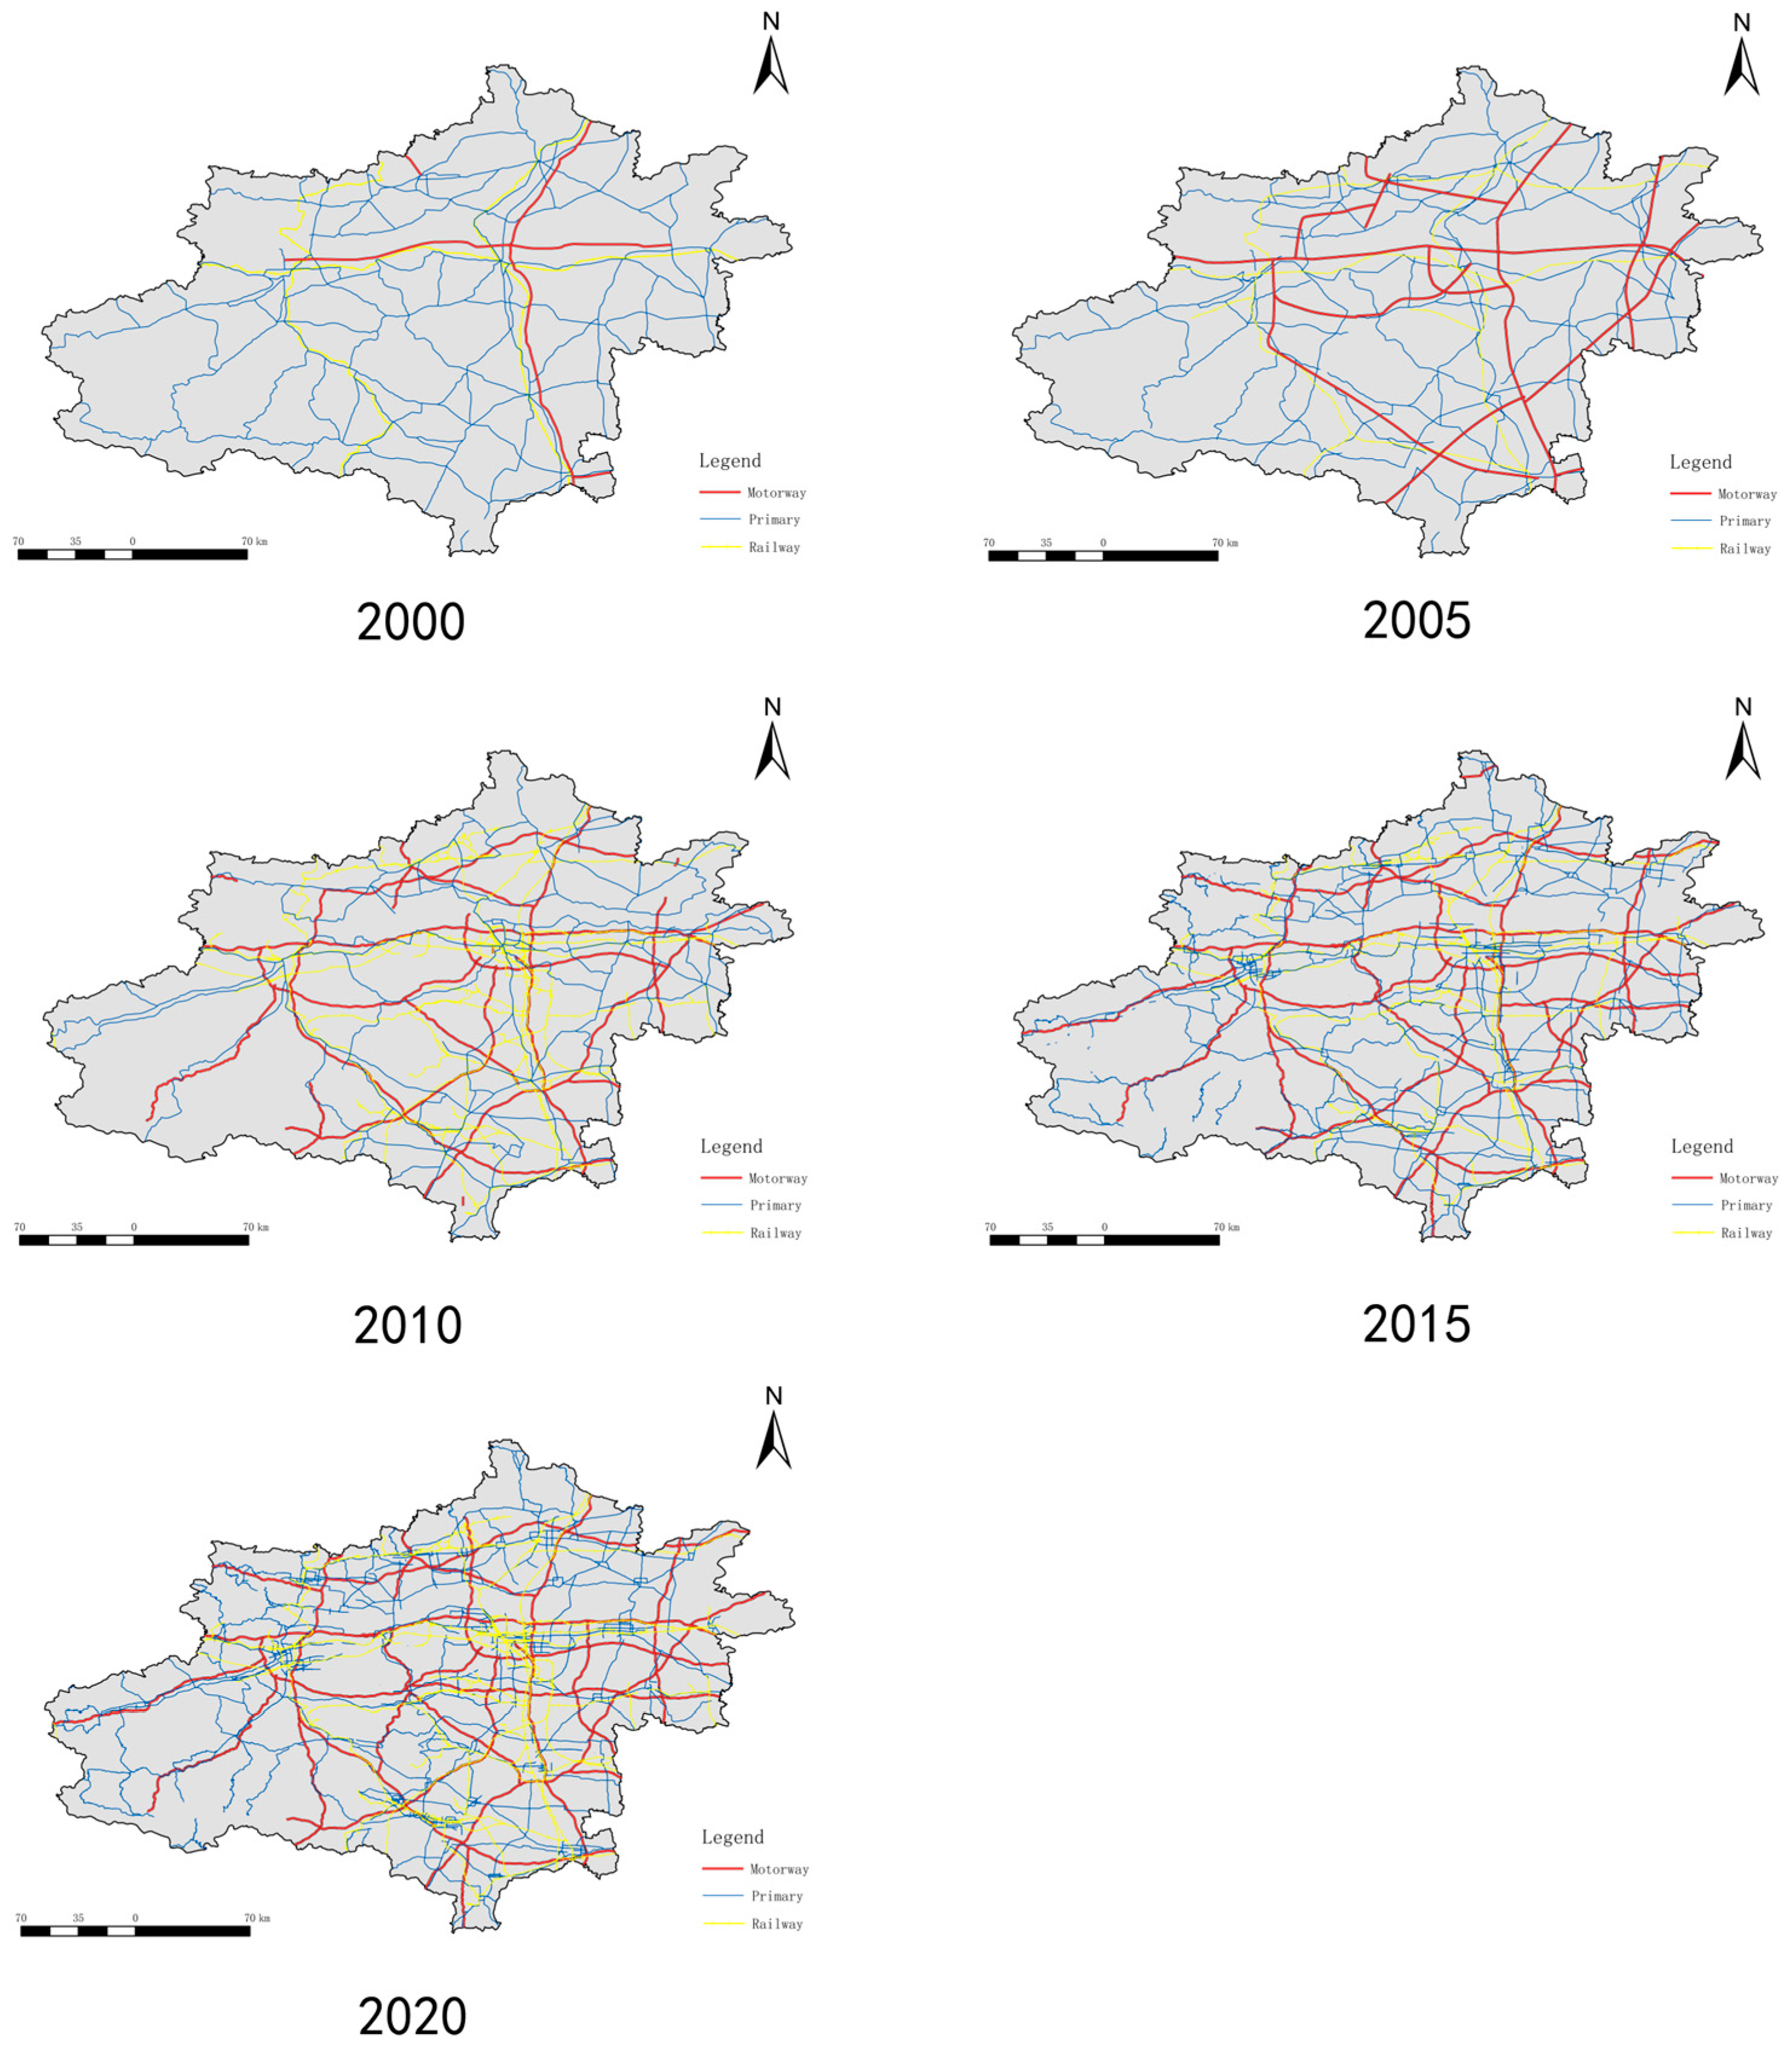
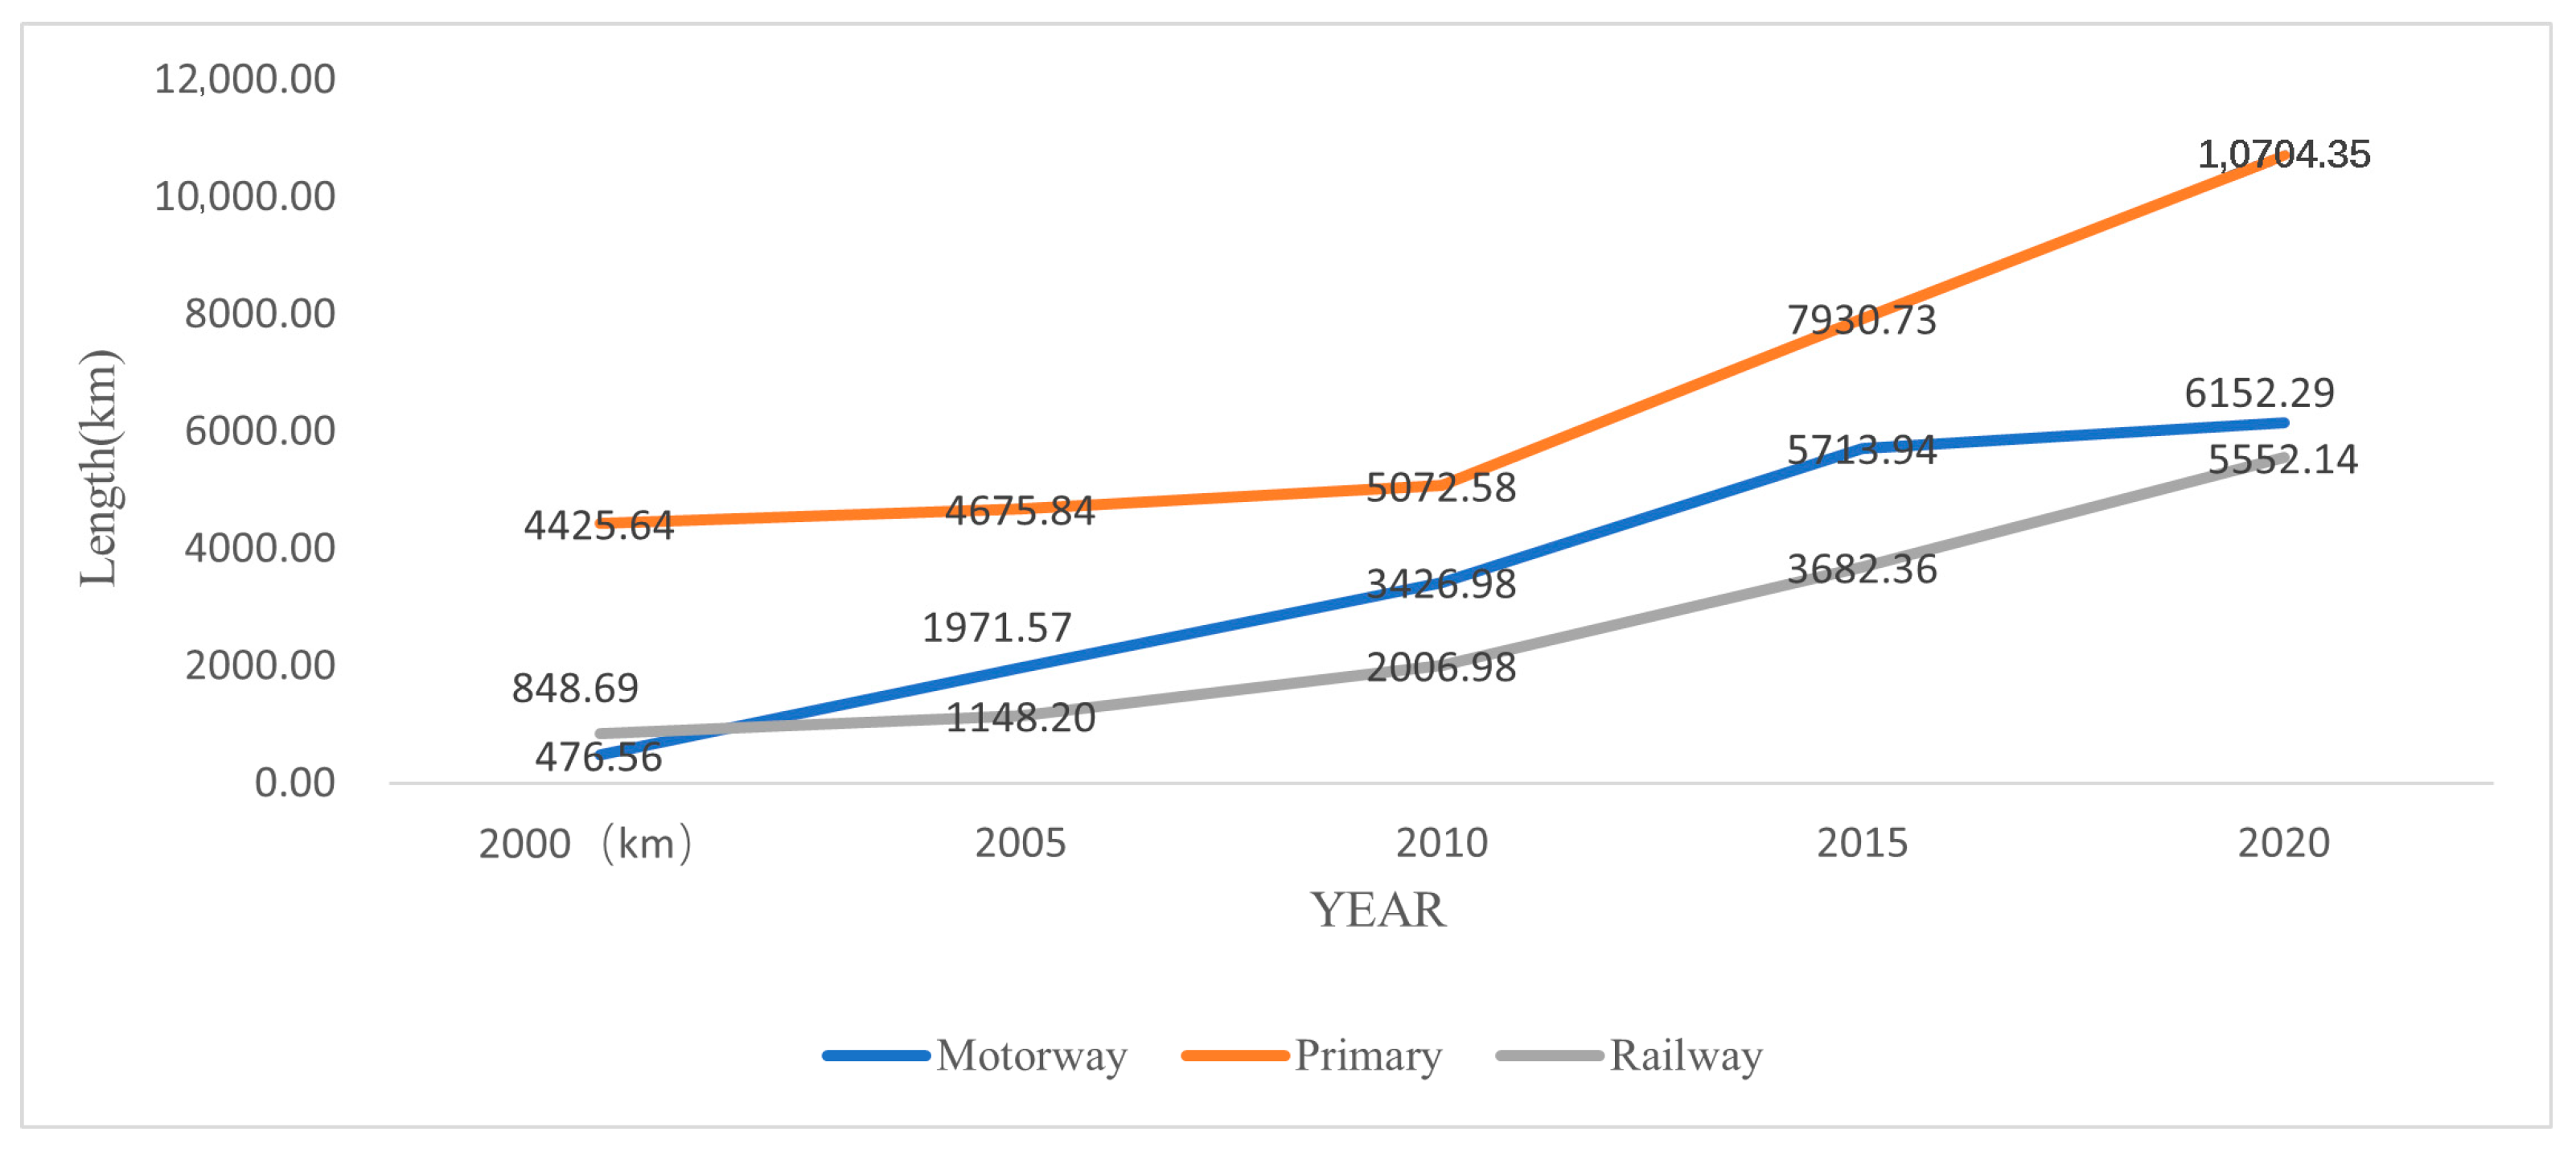
- Development and density of road networks, including highways, and railways;
- Coverage density and distribution of transportation hubs and stations;
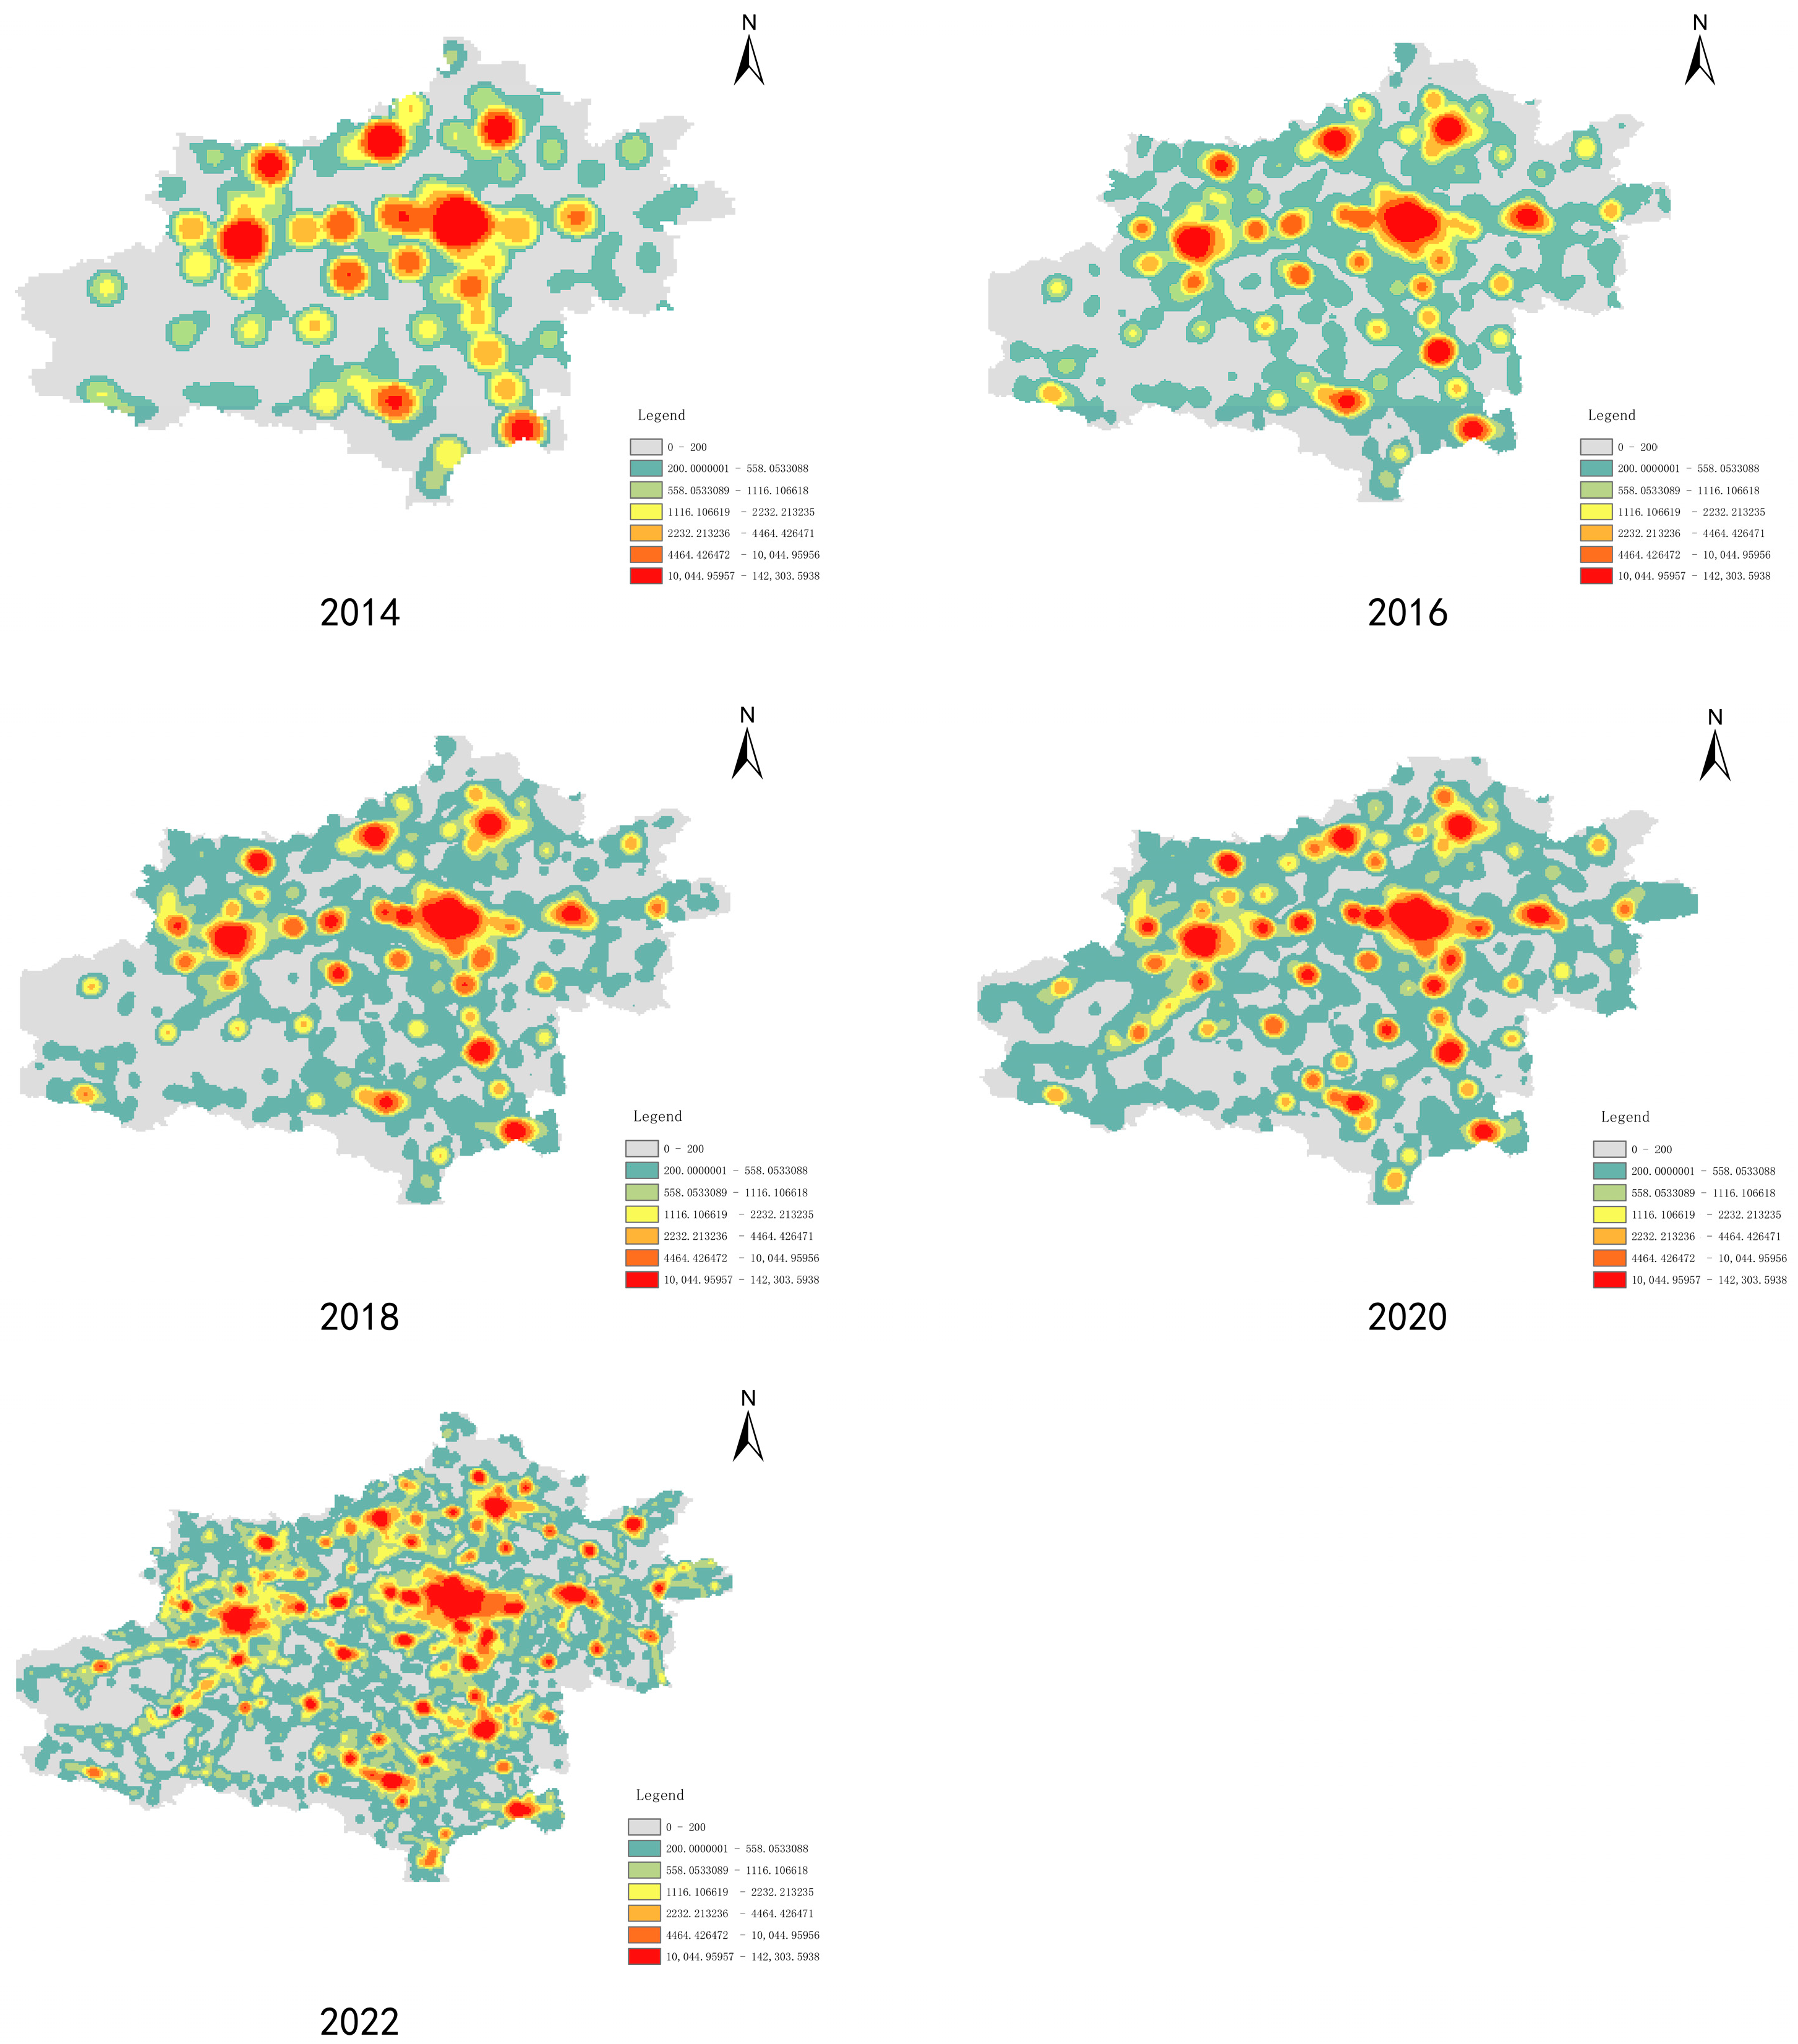
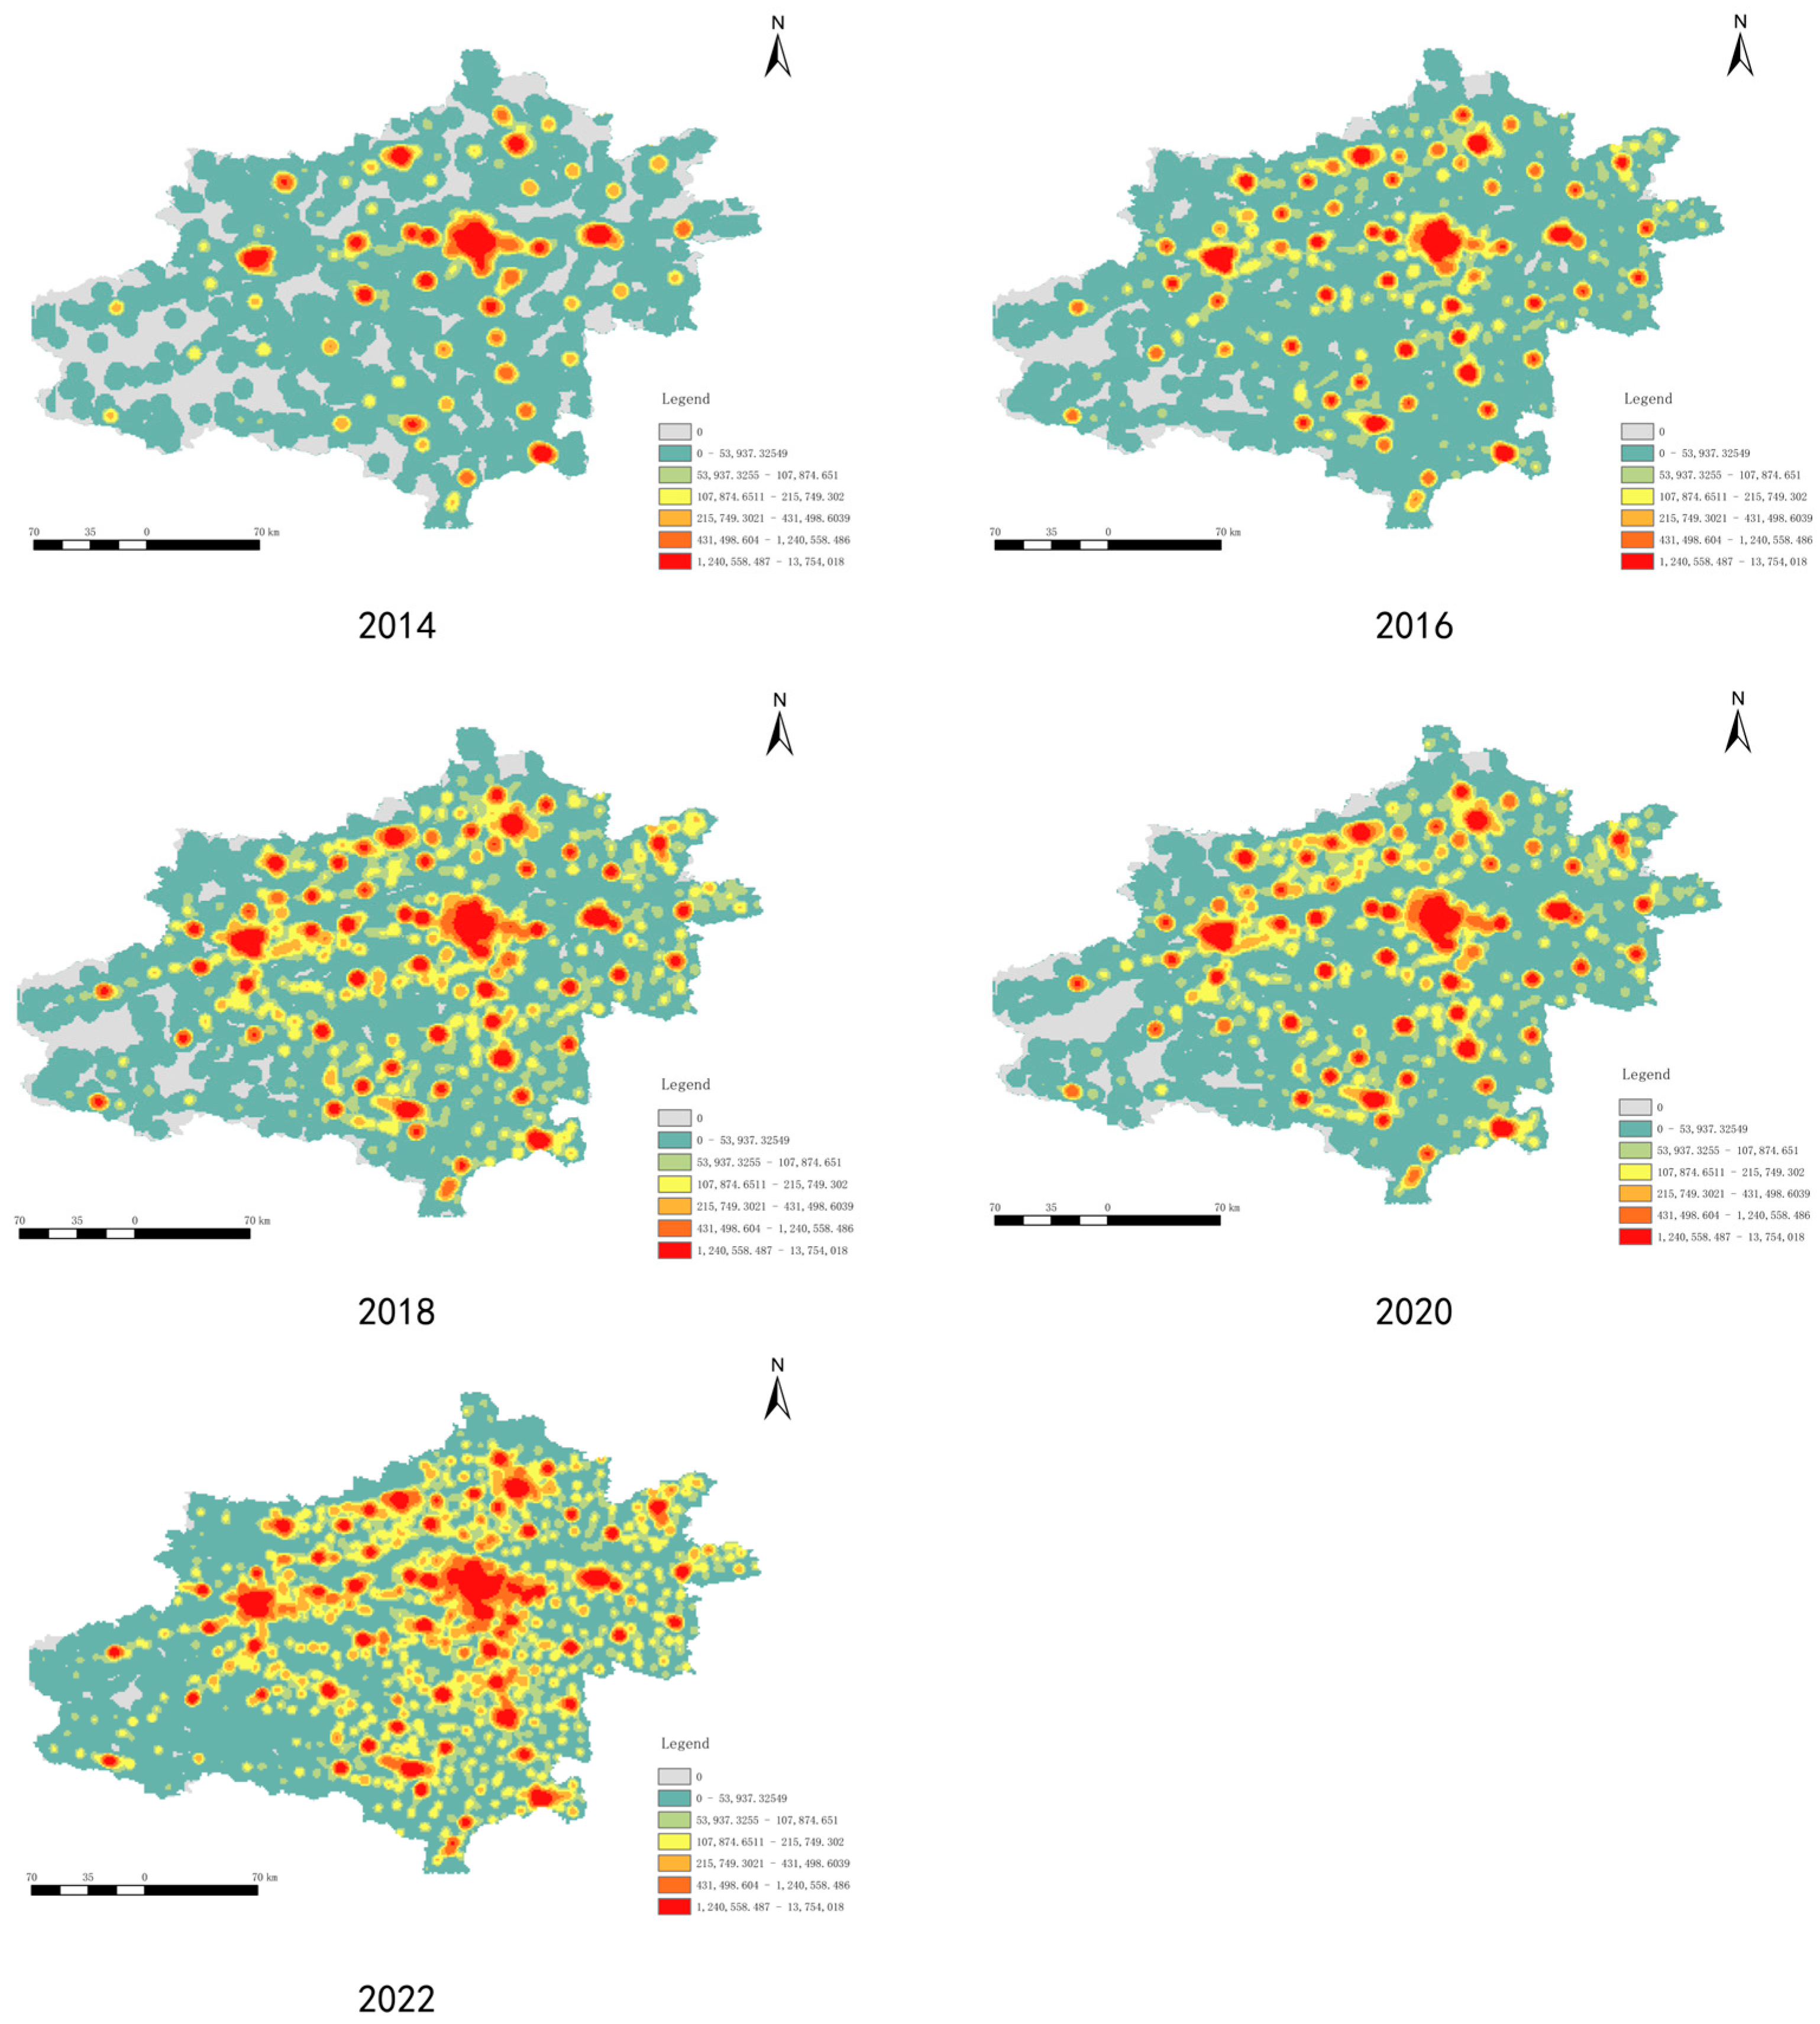
- Density and spatial distribution of malls and supermarkets.
- 3.
- Demographic and consumption patterns:
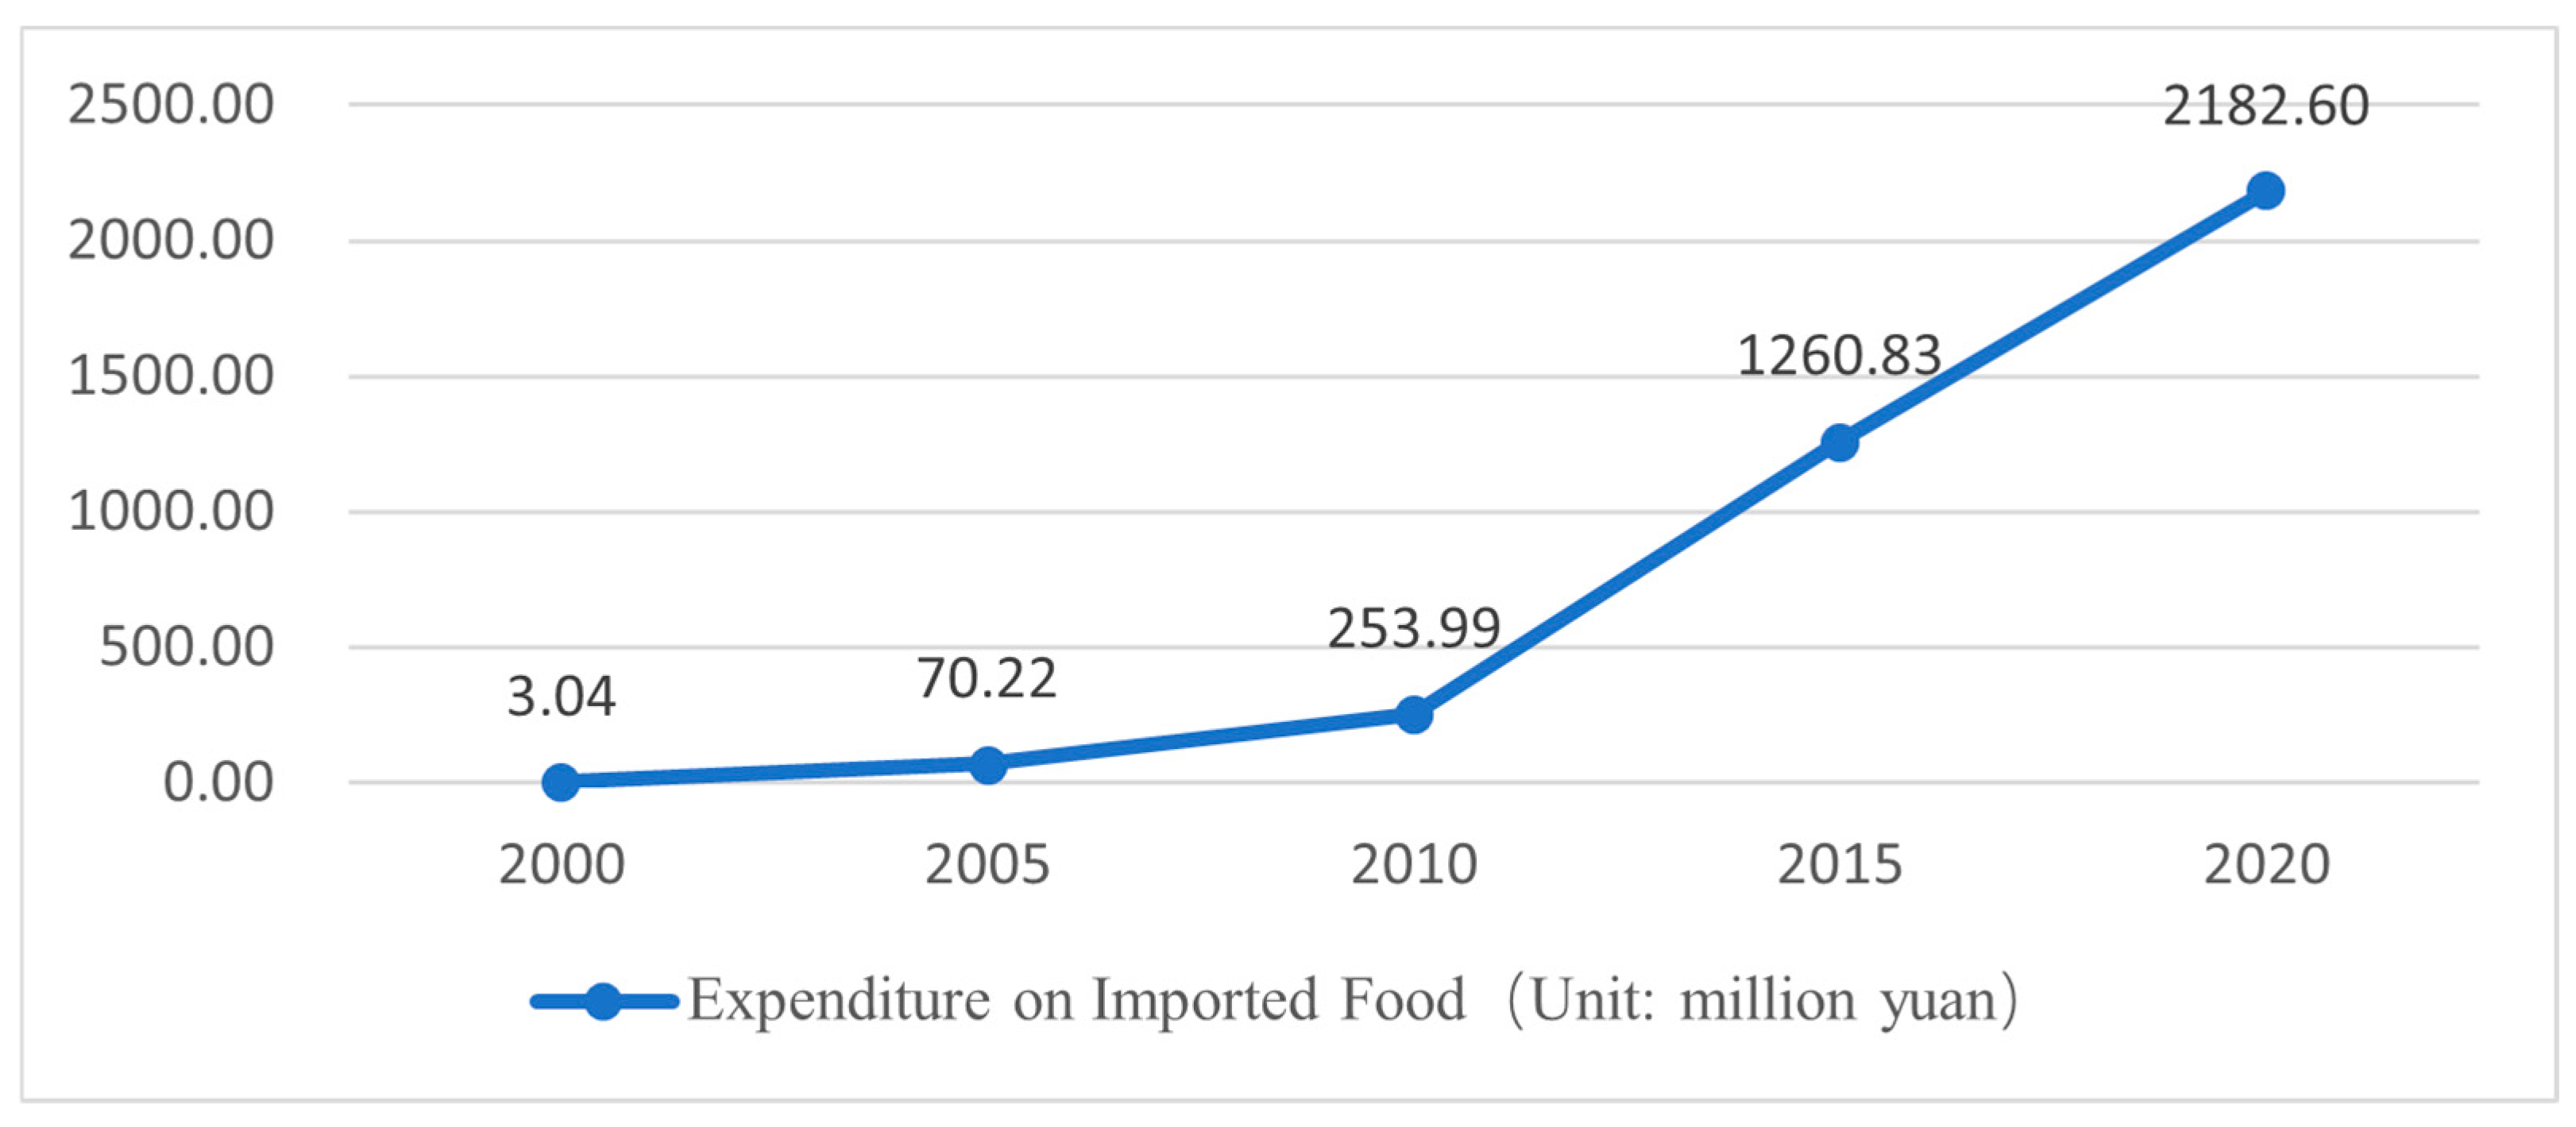
- Changes in consumption patterns, including the proportion of food consumption in residents’ expenditures and the increase in imported food consumption
2.2. Data Collection Methods
2.3. Analytical Techniques
3. Results
3.1. Impact of Urban Planning on the Urban Food System of the Zhengzhou Metropolitan Area (2000–2020)
3.1.1. Impact of Urbanization on Food Production
3.1.2. Impact of Urban Planning on Food Transportation and Distribution
3.1.3. Impact of Urban Planning on Food Consumers
3.2. Zhengzhou Metropolitan Area Urban Food Resilience Assessment (2018–2022)
3.2.1. Construction of the Indicator System
Principles of Construction
Explanation of Indicator Selection
Evaluation Criteria
Evaluation Method
3.2.2. Determination of Weights
Constructing Judgment Matrices
Consistency Test
Determination of Overall Goal Indicator Weights
3.2.3. Analysis of Evaluation Results
Interrelationships among Indicators
Contribution to Overall Resilience
Dynamic Changes Analysis
4. Discussion
4.1. Urban Food Resilience Practices
4.2. Dynamic Changes and Spatial Distribution Characteristics of Key Indicators
4.3. Key Event Impacts and Policy Effectiveness Assessment
4.4. Limitations and Recommendations
5. Conclusions
Author Contributions
Funding
Data Availability Statement
Acknowledgments
Conflicts of Interest
References
- Wheeler, T.; von Braun, J. Climate Change Impacts on Global Food Security. Science 2013, 341, 508–513. [Google Scholar] [CrossRef] [PubMed]
- Zhang, F.; Chen, X.; Vitousek, P. An experiment for the world. Nature 2013, 497, 33–35. [Google Scholar] [CrossRef] [PubMed]
- Liu, Y.; Zhou, Y. Reflections on China’s food security and land use policy under rapid urbanization. Land Use Policy 2021, 109, 105699. [Google Scholar] [CrossRef]
- Tendall, D.M.; Joerin, J.; Kopainsky, B.; Edwards, P.; Shreck, A.; Le, Q.B.; Kruetli, P.; Grant, M.; Six, J. Food system resilience: Defining the concept. Glob. Food Secur.-Agric. Policy Econ. Environ. 2015, 6, 17–23. [Google Scholar] [CrossRef]
- Barthel, S.; Parker, J.; Ernstson, H. Food and Green Space in Cities: A Resilience Lens on Gardens and Urban Environmental Movements. Urban Stud. 2015, 52, 1321–1338. [Google Scholar] [CrossRef]
- Blay-Palmer, A.; Santini, G.; Dubbeling, M.; Renting, H.; Taguchi, M.; Giordano, T. Validating the City Region Food System Approach: Enacting Inclusive, Transformational City Region Food Systems. Sustainability 2018, 10, 1680. [Google Scholar] [CrossRef]
- Sonnino, R.; Tegoni, C.L.S.; De Cunto, A. The challenge of systemic food change: Insights from cities. Cities 2019, 85, 110–116. [Google Scholar] [CrossRef]
- Bene, C.; Headey, D.; Haddad, L.; von Grebmer, K. Is resilience a useful concept in the context of food security and nutrition programmes? Some conceptual and practical considerations. Food Secur. 2016, 8, 123–138. [Google Scholar] [CrossRef]
- Henan Province Bureau of Statistics. Statistical Bulletin of National Economic and Social Development of Henan Province for 2021; Henan Province Bureau of Statistics: Zhengzhou, China, 2022.
- Ministry of Agriculture and Rural Affairs of China. National Grain Production Data Statistics for 2020; Ministry of Agriculture and Rural Affairs of China: Beijing, China, 2021.
- Henan Province Bureau of Statistics. Statistical Bulletin of National Economic and Social Development of Henan Province in 2020; Henan Province Bureau of Statistics: Zhengzhou, China, 2021.
- Henan Province Bureau of Statistics. The Cost of Falling Quantity and Price Increased with the Increase of Planting Income; Henan Province Bureau of Statistics: Zhengzhou, China, 2021.
- Henan Provincial Development and Reform Commission. Outline of the “14th Five-Year Plan” of Henan Province; Henan Provincial Development and Reform Commission: Zhengzhou, China, 2021.
- Ye, G.; Ma, F.; Liu, T.; Jia, Y. Zhengzhou Urban Development Report (2021); Social Sciences Academic Press: Zhengzhou, China, 2021. [Google Scholar]
- Fang, C.; Yu, D. Urban agglomeration: An evolving concept of an emerging phenomenon. Landsc. Urban Plan. 2017, 162, 126–136. [Google Scholar] [CrossRef]
- Bai, X.; McPhearson, T.; Cleugh, H.; Nagendra, H.; Tong, X.; Zhu, T.; Zhu, Y.-G. Linking Urbanization and the Environment: Conceptual and Empirical Advances. Annu. Rev. Environ. Resour. 2017, 42, 215–240. [Google Scholar] [CrossRef]
- Liu, Y.; Yin, G.; Ma, L.J.C. Local state and administrative urbanization in post-reform China: A case study of Hebi City, Henan Province. Cities 2012, 29, 107–117. [Google Scholar] [CrossRef]
- Seto, K.C.; Ramankutty, N. Hidden linkages between urbanization and food systems. Science 2016, 352, 943–945. [Google Scholar] [CrossRef] [PubMed]
- He, C.; Liu, Z.; Xu, M.; Ma, Q.; Dou, Y. Urban expansion brought stress to food security in China: Evidence from decreased cropland net primary productivity. Sci. Total Environ. 2017, 576, 660–670. [Google Scholar] [CrossRef] [PubMed]
- Li, Y.; Ye, S.; Wu, Q.; Wu, Y.; Qian, S. Analysis and countermeasures of the “7.20” flood in Zhengzhou. J. Asian Archit. Build. Eng. 2023, 22, 3782–3798. [Google Scholar] [CrossRef]
- Schipanski, M.E.; MacDonald, G.K.; Rosenzweig, S.; Chappell, M.J.; Bennett, E.M.; Kerr, R.B.; Blesh, J.; Crews, T.; Drinkwater, L.; Lundgren, J.G.; et al. Realizing Resilient Food Systems. Bioscience 2016, 66, 600–610. [Google Scholar] [CrossRef]
- Bene, C. Resilience of local food systems and links to food security—A review of some important concepts in the context of COVID-19 and other shocks. Food Secur. 2020, 12, 805–822. [Google Scholar] [CrossRef]
- Holling, C.S. Resilience and stability of ecological systems. Annu. Rev. Ecol. Evol. Syst. 1973, 4, 1–23. [Google Scholar] [CrossRef]
- Folke, C.; Carpenter, S.R.; Walker, B.; Scheffer, M.; Chapin, T.; Rockstrom, J. Resilience Thinking: Integrating Resilience, Adaptability and Transformability. Ecol. Soc. 2010, 15, 20. [Google Scholar] [CrossRef]
- Meerow, S.; Newell, J.P.; Stults, M. Defining urban resilience: A review. Landsc. Urban Plan. 2016, 147, 38–49. [Google Scholar] [CrossRef]
- Wiskerke, J.S. Urban food systems. In Cities and Agriculture; Routledge: Oxfordshire, UK, 2015; pp. 19–43. [Google Scholar]
- Worstell, J.; Green, J. Development, C. Eight qualities of resilient food systems: Toward a sustainability/resilience index. J. Agric. Food Syst. Community Dev. 2017, 7, 23–41. [Google Scholar]
- d’Amour, C.B.; Reitsma, F.; Baiocchi, G.; Barthel, S.; Guneralp, B.; Erb, K.-H.; Haberl, H.; Creutzig, F.; Seto, K.C. Future urban land expansion and implications for global croplands. Proc. Natl. Acad. Sci. USA 2017, 114, 8939–8944. [Google Scholar] [CrossRef] [PubMed]
- Saaty, T.L. Decision making with the analytic hierarchy process. Int. J. Serv. Sci. 2008, 1, 83–98. [Google Scholar] [CrossRef]
- Xu, X.; Zhang, Z.; Long, T.; Sun, S.; Gao, J. Mega-city region sustainability assessment and obstacles identification with GIS–entropy–TOPSIS model: A case in Yangtze River Delta urban agglomeration, China. J. Clean. Prod. 2021, 294, 126147. [Google Scholar] [CrossRef]
- Ning, J.; Liu, J.; Kuang, W.; Xu, X.; Zhang, S.; Yan, C.; Li, R.; Wu, S.; Hu, Y.; Du, G.; et al. Spatiotemporal patterns and characteristics of land-use change in China during 2010–2015. J. Geogr. Sci. 2018, 28, 547–562. [Google Scholar] [CrossRef]
- Meuwissen, M.P.M.; Feindt, P.H.; Spiegel, A.; Termeer, C.J.A.M.; Mathijs, E.; de Mey, Y.; Finger, R.; Balmann, A.; Wauters, E.; Urquhart, J.; et al. A framework to assess the resilience of farming systems. Agric. Syst. 2019, 176, 102656. [Google Scholar] [CrossRef]
- Zhan, Y.; Chen, K.Z. Building resilient food system amidst COVID-19: Responses and lessons from China. Agric. Syst. 2021, 190, 103102. [Google Scholar] [CrossRef]
- Longley, P.A.; Goodchild, M.F.; Maguire, D.J.; Rhind, D.W. Geographic Information Science and Systems; John Wiley & Sons: Hoboken, NJ, USA, 2015. [Google Scholar]
- Pontius Jr, R.G.; Shusas, E.; McEachern, M. Detecting important categorical land changes while accounting for persistence. Agric. Ecosyst. Environ. 2004, 101, 251–268. [Google Scholar] [CrossRef]
- Kahraman, C. Fuzzy Multi-Criteria Decision Making: Theory and Applications with Recent Developments; Springer Science & Business Media: Berlin/Heidelberg, Germany, 2008; Volume 16. [Google Scholar]
- Gu, C.; Hu, L.; Cook, I.G. China’s urbanization in 1949-2015: Processes and driving forces. Chin. Geogr. Sci. 2017, 27, 847–859. [Google Scholar] [CrossRef]
- Bryan, B.A.; Gao, L.; Ye, Y.; Sun, X.; Connor, J.D.; Crossman, N.D.; Stafford-Smith, M.; Wu, J.; He, C.; Yu, D.; et al. China’s response to a national land-system sustainability emergency. Nature 2018, 559, 193–204. [Google Scholar] [CrossRef]
- Zhang, Y.; Zhao, L.; Liu, J.; Liu, Y.; Li, C. The Impact of Land Cover Change on Ecosystem Service Values in Urban Agglomerations along the Coast of the Bohai Rim, China. Sustainability 2015, 7, 10365–10387. [Google Scholar] [CrossRef]
- Barthel, S.; Isendahl, C. Urban gardens, agriculture, and water management: Sources of resilience for long-term food security in cities. Ecol. Econ. 2013, 86, 224–234. [Google Scholar] [CrossRef]
- Zhang, P.; Li, X.; Yu, Y. Relationship between ecosystem services and farmers’ well-being in the Yellow River Wetland Nature Reserve of China. Ecol. Indic. 2023, 146, 109810. [Google Scholar] [CrossRef]
- Zhang, C.; Jia, Q.; Liu, Y.; Zheng, Z.; Gao, Y.; Li, K. Evaluation and multi scenario simulation of ecosystem service value in Zhengzhou Metropolitan Area based on PLUS model. Meas. Sens. 2024, 32, 101079. [Google Scholar] [CrossRef]
- Wang, S.; Sun, W.; Wang, X.; Sun, L.; Liu, S. The Role of Geological Methods in the Prevention and Control of Urban Flood Disaster Risk: A Case Study of Zhengzhou. Appl. Sci. 2024, 14, 1839. [Google Scholar] [CrossRef]
- Zhou, Z.-Y.; Liu, H.; Cao, L. Food Consumption in China: The Revolution Continues; Edward Elgar Publishing: Cheltenham, UK, 2014. [Google Scholar]
- Gao, J.; Li, F.; Gao, H.; Zhou, C.; Zhang, X. The impact of land-use change on water-related ecosystem services: A study of the Guishui River Basin, Beijing, China. J. Clean. Prod. 2017, 163, S148–S155. [Google Scholar] [CrossRef]
- Ericksen, P.J. Conceptualizing food systems for global environmental change research. Glob. Environ. Chang.-Hum. Policy Dimens. 2008, 18, 234–245. [Google Scholar] [CrossRef]
- Cutter, S.L.; Burton, C.G.; Emrich, C.T. Disaster Resilience Indicators for Benchmarking Baseline Conditions. J. Homel. Secur. Emerg. Manag. 2010, 7. [Google Scholar] [CrossRef]
- Mu, E.; Pereyra-Rojas, M. Understanding the analytic hierarchy process. In Practical Decision Making; Springer: Cham, Switzerland, 2018; pp. 7–22. [Google Scholar]
- Goepel, K.D. Implementing the analytic hierarchy process as a standard method for multi-criteria decision making in corporate enterprises–a new AHP excel template with multiple inputs. In Proceedings of the International Symposium on the Analytic Hierarchy Process, Sorrento, Italy, 15–18 June 2013; pp. 1–10. [Google Scholar]
- Pothukuchi, K.; Kaufman, J.L. The food system—A stranger to the planning field. J. Am. Plan. Assoc. 2000, 66, 113–124. [Google Scholar] [CrossRef]
- Hobbs, J.E. Food supply chains during the COVID-19 pandemic. Can. J. Agric. Econ.-Rev. Can. D Agroecon. 2020, 68, 171–176. [Google Scholar] [CrossRef]
- Wolfert, S.; Ge, L.; Verdouw, C.; Bogaardt, M. Big data in smart farming—A review. Agric. Syst. 2017, 153, 69–80. [Google Scholar] [CrossRef]
- Pulighe, G.; Lupia, F. Food First: COVID-19 Outbreak and Cities Lockdown a Booster for a Wider Vision on Urban Agriculture. Sustainability 2020, 12, 501. [Google Scholar] [CrossRef]
- Fan, S.; Teng, P.; Chew, P.; Smith, G.; Copeland, L. Food system resilience and COVID-19? Lessons from the Asian experience. Glob. Food Secur.-Agric. Policy Econ. Environ. 2021, 28, 100501. [Google Scholar] [CrossRef] [PubMed]
- Martin, A.; Markhvida, M.; Hallegatte, S.; Walsh, B. Socio-economic impacts of COVID-19 on household consumption and poverty. Econ. Disasters Clim. Chang. 2020, 4, 453–479. [Google Scholar] [CrossRef] [PubMed]
- Garnett, P.; Doherty, B.; Heron, T. Vulnerability of the United Kingdom’s food supply chains exposed by COVID-19. Nat. Food 2020, 1, 315–318. [Google Scholar] [CrossRef] [PubMed]
- Doherty, B.; Haugh, H.; Lyon, F. Social enterprises as hybrid organizations: A review and research agenda. International journal of management reviews 2014, 16, 417–436. [Google Scholar] [CrossRef]
- Prosperi, P.; Allen, T.; Cogill, B.; Padilla, M.; Peri, I. Towards metrics of sustainable food systems: A review of the resilience and vulnerability literature. Environ. Syst. Decis. 2016, 36, 3–19. [Google Scholar] [CrossRef]
- Cohen, M.J.; Garrett, J.L. The food price crisis and urban food (in)security. Environ. Urban. 2010, 22, 467–482. [Google Scholar] [CrossRef]
- Satterthwaite, D.; McGranahan, G.; Tacoli, C. Urbanization and its implications for food and farming. Philos. Trans. R. Soc. B-Biol. Sci. 2010, 365, 2809–2820. [Google Scholar] [CrossRef]
- Reardon, T.; Swinnen, J. COVID-19 and resilience innovations in food supply chains. In COVID-19 and Global Food Security; International Food Policy Research Institute (IFPRI): Washington, DC, USA, 2020. [Google Scholar]
- Eckert, S.; Kohler, S. Urbanization and health in developing countries: A systematic review. World Health Popul. 2014, 15, 7–20. [Google Scholar] [CrossRef]
- Rosenzweig, C.; Parry, M.L. Potential Impact of Climate-Change on World Food-Supply. Nature 1994, 367, 133–138. [Google Scholar] [CrossRef]
- Cutter, S.L.; Boruff, B.J.; Shirley, W.L. Social vulnerability to environmental hazards. Soc. Sci. Q. 2003, 84, 242–261. [Google Scholar] [CrossRef]
- Gunderson, L.H. Ecological resilience—In theory and application. Annu. Rev. Ecol. Syst. 2000, 31, 425–439. [Google Scholar] [CrossRef]
- Walker, B.; Hollin, C.S.; Carpenter, S.R.; Kinzig, A. Resilience, adaptability and transformability in social-ecological systems. Ecol. Soc. 2004, 9, 5. [Google Scholar] [CrossRef]
- Liu, J.; Dietz, T.; Carpenter, S.R.; Alberti, M.; Folke, C.; Moran, E.; Pell, A.N.; Deadman, P.; Kratz, T.; Lubchenco, J.; et al. Complexity of coupled human and natural systems. Science 2007, 317, 1513–1516. [Google Scholar] [CrossRef] [PubMed]
- Pinstrup-Andersen, P. Food security: Definition and measurement. Food Secur. 2009, 1, 5–7. [Google Scholar] [CrossRef]
- Moragues-Faus, A.; Morgan, K. Reframing the foodscape: The emergent world of urban food policy. Environ. Plan. A-Econ. Space 2015, 47, 1558–1573. [Google Scholar] [CrossRef]





| Objective Layer | Criterion Layer | Indicator Layer |
|---|---|---|
| Metropolitan Food Resilience Evaluation System | Food Supply Chain Management B1 | Storage Capacity C1 |
| Actual Storage Amount C2 | ||
| Controlled Atmosphere Grain Storage Capacity C3 | ||
| Low Temperature Near-Low Temperature Grain Storage Capacity C4 | ||
| Time Required from Food Production to Sale (in days) C5 | ||
| Loss Rate: Percentage of food loss or damage during production, storage, transportation, and sale C6 | ||
| Economic and Affordability B2 | Food Price Index C7 | |
| Number of People Employed in Agriculture C8 | ||
| Average Annual Income of Agricultural Population C9 | ||
| Food Consumption and Demand B3 | Annual Per Capita Food Consumption (in kilograms) C10 | |
| Variety of Food Types Consumed C11 | ||
| Daily Caloric Intake Per Capita (in grams or milligrams) C12 | ||
| Proportion of Food Purchases by Channel C13 | ||
| Household Reserves of Specific Foods C14 | ||
| Emergency Preparedness and Management B4 | Proportion of Emergency Grain Reserves C15 | |
| Emergency Logistics Network Response Time: Average transportation time from food reserve locations to demand sites C16 | ||
| Disaster Recovery Time: Time required to restore normal operations when supply chain disruptions or bottlenecks occur C17 | ||
| Number of Emergency Training and Simulation Drills: Number of emergency response trainings and practical simulation drills conducted for relevant personnel C18 | ||
| Number of Community Food Distribution Centers: Number of community centers or other facilities capable of distributing food in emergency situations C19 | ||
| Coordination and Cooperation Mechanisms with Neighboring Areas: Number of coordination mechanisms during food resilience crises with other cities or regions C20 | ||
| Social Participation and Governance B5 | Public Participation Level: Number of public involvement activities in food resilience policymaking or project implementation C21 | |
| Participation Level of Non-Governmental Organizations (NGOs) and Community Organizations C22 | ||
| Establishment Score of Feedback and Complaint Channels: Number of channels available for the public to provide feedback or raise issues regarding food resilience C23 | ||
| Number of Social Governance Innovation Projects: Number of social governance innovation projects related to food resilience implemented C24 | ||
| Number of Media Reports on Food Resilience Issues C25 |
| Level | Interval | Status | Indicator Characteristics |
|---|---|---|---|
| 1 | [0, 0.30] | Very Poor | Societal activities are stagnant, and the condition of food resilience is extremely poor. |
| 2 | [0.30, 0.60] | Poor | Societal activities are slow, and food resilience is significantly damaged. |
| 3 | [0.60, 0.80] | Moderate | Societal activities are normal, and food resilience is noticeably affected. |
| 4 | [0.80, 1] | Good | Societal activities are active, and food resilience is minimally impacted. |
| ak | B1 | B2 | B3 | … | Bn |
|---|---|---|---|---|---|
| B1 | b11 | b12 | b13 | … | b1n |
| B2 | b21 | b22 | b23 | … | b2n |
| B3 | b31 | b32 | b33 | … | b3n |
| … | … | … | … | … | … |
| Bn | bn1 | bn2 | bn3 | … | bnn |
| Scale Value | Meaning |
|---|---|
| 1 | Indicators Bi and Bj are equally important |
| 3 | Indicator Bi is more important than Bj, conversely 1/3 |
| 5 | Indicator Bi is significantly more important than Bj, conversely 1/5 |
| 7 | Indicator Bi is very important compared to Bj, conversely 1/7 |
| 9 | Indicator Bi is extremely important compared to Bj, conversely 1/9 |
| 2, 4, 6, 8 | Intermediate values between the above indicators |
| A | B1 | B2 | B3 | B4 | B5 | Weight |
|---|---|---|---|---|---|---|
| B1 | 1 | 2 | 1.667 | 1.667 | 1.429 | 29.04% |
| B2 | 0.5 | 1 | 1 | 0.5 | 1.25 | 15.03% |
| B3 | 0.6 | 1 | 1 | 0.5 | 1 | 14.86% |
| B4 | 0.6 | 2 | 2 | 1 | 2 | 26.20% |
| B5 | 0.7 | 0.8 | 1 | 0.5 | 1 | 14.87% |
| B1 | C1 | C2 | C3 | C4 | C5 | C6 | Weight |
|---|---|---|---|---|---|---|---|
| C1 | 1 | 0.2 | 2 | 2 | 0.2 | 1 | 9.86% |
| C2 | 5 | 1 | 2.857 | 2.857 | 3.03 | 3.333 | 36.07% |
| C3 | 0.5 | 0.35 | 1 | 1 | 0.25 | 0.2 | 6.27% |
| C4 | 0.5 | 0.35 | 1 | 1 | 0.25 | 0.2 | 6.27% |
| C5 | 5 | 0.33 | 4 | 4 | 1 | 1 | 22.38% |
| C6 | 1 | 0.3 | 5 | 5 | 1 | 1 | 19.15% |
| B2 | C7 | C8 | C9 | Weight |
|---|---|---|---|---|
| C7 | 1 | 2 | 2 | 49.98% |
| C8 | 0.5 | 1 | 1.111 | 25.89% |
| C9 | 0.5 | 0.9 | 1 | 24.13% |
| B3 | C10 | C11 | C12 | C13 | C14 | Weight |
|---|---|---|---|---|---|---|
| C10 | 1 | 1.111 | 1.25 | 1.25 | 1.111 | 22.48% |
| C11 | 0.9 | 1 | 1.429 | 1.667 | 2 | 26.37% |
| C12 | 0.8 | 0.7 | 1 | 1.25 | 1 | 18.19% |
| C13 | 0.8 | 0.6 | 0.8 | 1 | 1 | 16.14% |
| C14 | 0.9 | 0.5 | 1 | 1 | 1 | 16.81% |
| B4 | C15 | C16 | C17 | C18 | C19 | C20 | Weight |
|---|---|---|---|---|---|---|---|
| C15 | 1 | 2 | 2.222 | 1.429 | 2.5 | 0.5 | 22.46% |
| C16 | 0.5 | 1 | 0.333 | 1.25 | 1 | 0.667 | 11.35% |
| C17 | 0.45 | 3 | 1 | 1.25 | 2 | 0.667 | 18.55% |
| C18 | 0.7 | 0.8 | 0.8 | 1 | 0.5 | 0.5 | 10.73% |
| C19 | 0.4 | 1 | 0.5 | 2 | 1 | 0.833 | 13.52% |
| C20 | 2 | 1.5 | 1.5 | 2 | 1.2 | 1 | 23.40% |
| B5 | C21 | C22 | C23 | C24 | C25 | Weight |
|---|---|---|---|---|---|---|
| C21 | 1 | 0.909 | 0.769 | 1.429 | 2 | 22.16% |
| C22 | 1.1 | 1 | 0.5 | 1.25 | 1.429 | 19.23% |
| C23 | 1.3 | 2 | 1 | 1.667 | 2 | 29.62% |
| C24 | 0.7 | 0.8 | 0.6 | 1 | 1 | 15.41% |
| C25 | 0.5 | 0.7 | 0.5 | 1 | 1 | 13.57% |
| Goal Layer | Criterion Layer | Indicator Layer | Weight | Total Weight |
|---|---|---|---|---|
| Metropolitan Area Food Resilience Evaluation System A | B1 Food Supply Chain Management (0.2904) | C1 Storage Capacity | 0.0986 | 0.0286 |
| C2 Actual Storage Quantity | 0.3607 | 0.1048 | ||
| C3 Controlled Atmosphere Grain Storage Capacity | 0.0627 | 0.0182 | ||
| C4 Low and Near-Low Temperature Grain Storage Capacity | 0.0627 | 0.0182 | ||
| C5 Time Required from Food Production to Sale | 0.2238 | 0.0650 | ||
| C6 Loss Rate | 0.1915 | 0.0556 | ||
| B2 Economic and Affordability (0.1503) | C7 Food Price Index | 0.4998 | 0.0751 | |
| C8 Number of Agricultural Employees | 0.2589 | 0.0389 | ||
| C9 Average Annual Income of Agricultural Population | 0.2413 | 0.0363 | ||
| B3 Food Consumption and Demand (0.1486) | C10 Annual Per Capita Food Consumption | 0.2248 | 0.0334 | |
| C11 Number of Food Types Consumed | 0.2637 | 0.0392 | ||
| C12 Daily Caloric Intake Per Capita | 0.1819 | 0.0270 | ||
| C13 Proportion of Food Purchasing Channels | 0.1614 | 0.0240 | ||
| C14 Family Specific Food Reserves | 0.1681 | 0.0250 | ||
| B4 Emergency Preparedness and Management (0.2620) | C15 Proportion of Emergency Grain Reserves | 0.2246 | 0.0588 | |
| C16 Emergency Logistics Network Response Time | 0.1135 | 0.0297 | ||
| C17 Post-Disaster Recovery Time | 0.1855 | 0.0486 | ||
| C18 Number of Emergency Training and Simulation Drills | 0.1073 | 0.0281 | ||
| C19 Number of Community Food Distribution Centers in Built-up Areas | 0.1352 | 0.0355 | ||
| C20 Coordination and Cooperation Mechanisms with Neighboring Areas | 0.2340 | 0.0613 | ||
| B5 Social Participation and Governance (0.1487) | C21 Public Participation Level | 0.2216 | 0.0330 | |
| C22 Participation of NGOs and Community Organizations | 0.1923 | 0.0286 | ||
| C23 Establishment Rating of Feedback and Demand Channels | 0.2962 | 0.0440 | ||
| C24 Number of Social Governance Innovation Projects | 0.1541 | 0.0229 | ||
| C25 Number of Media Reports on Food Resilience Issues | 0.1357 | 0.0202 |
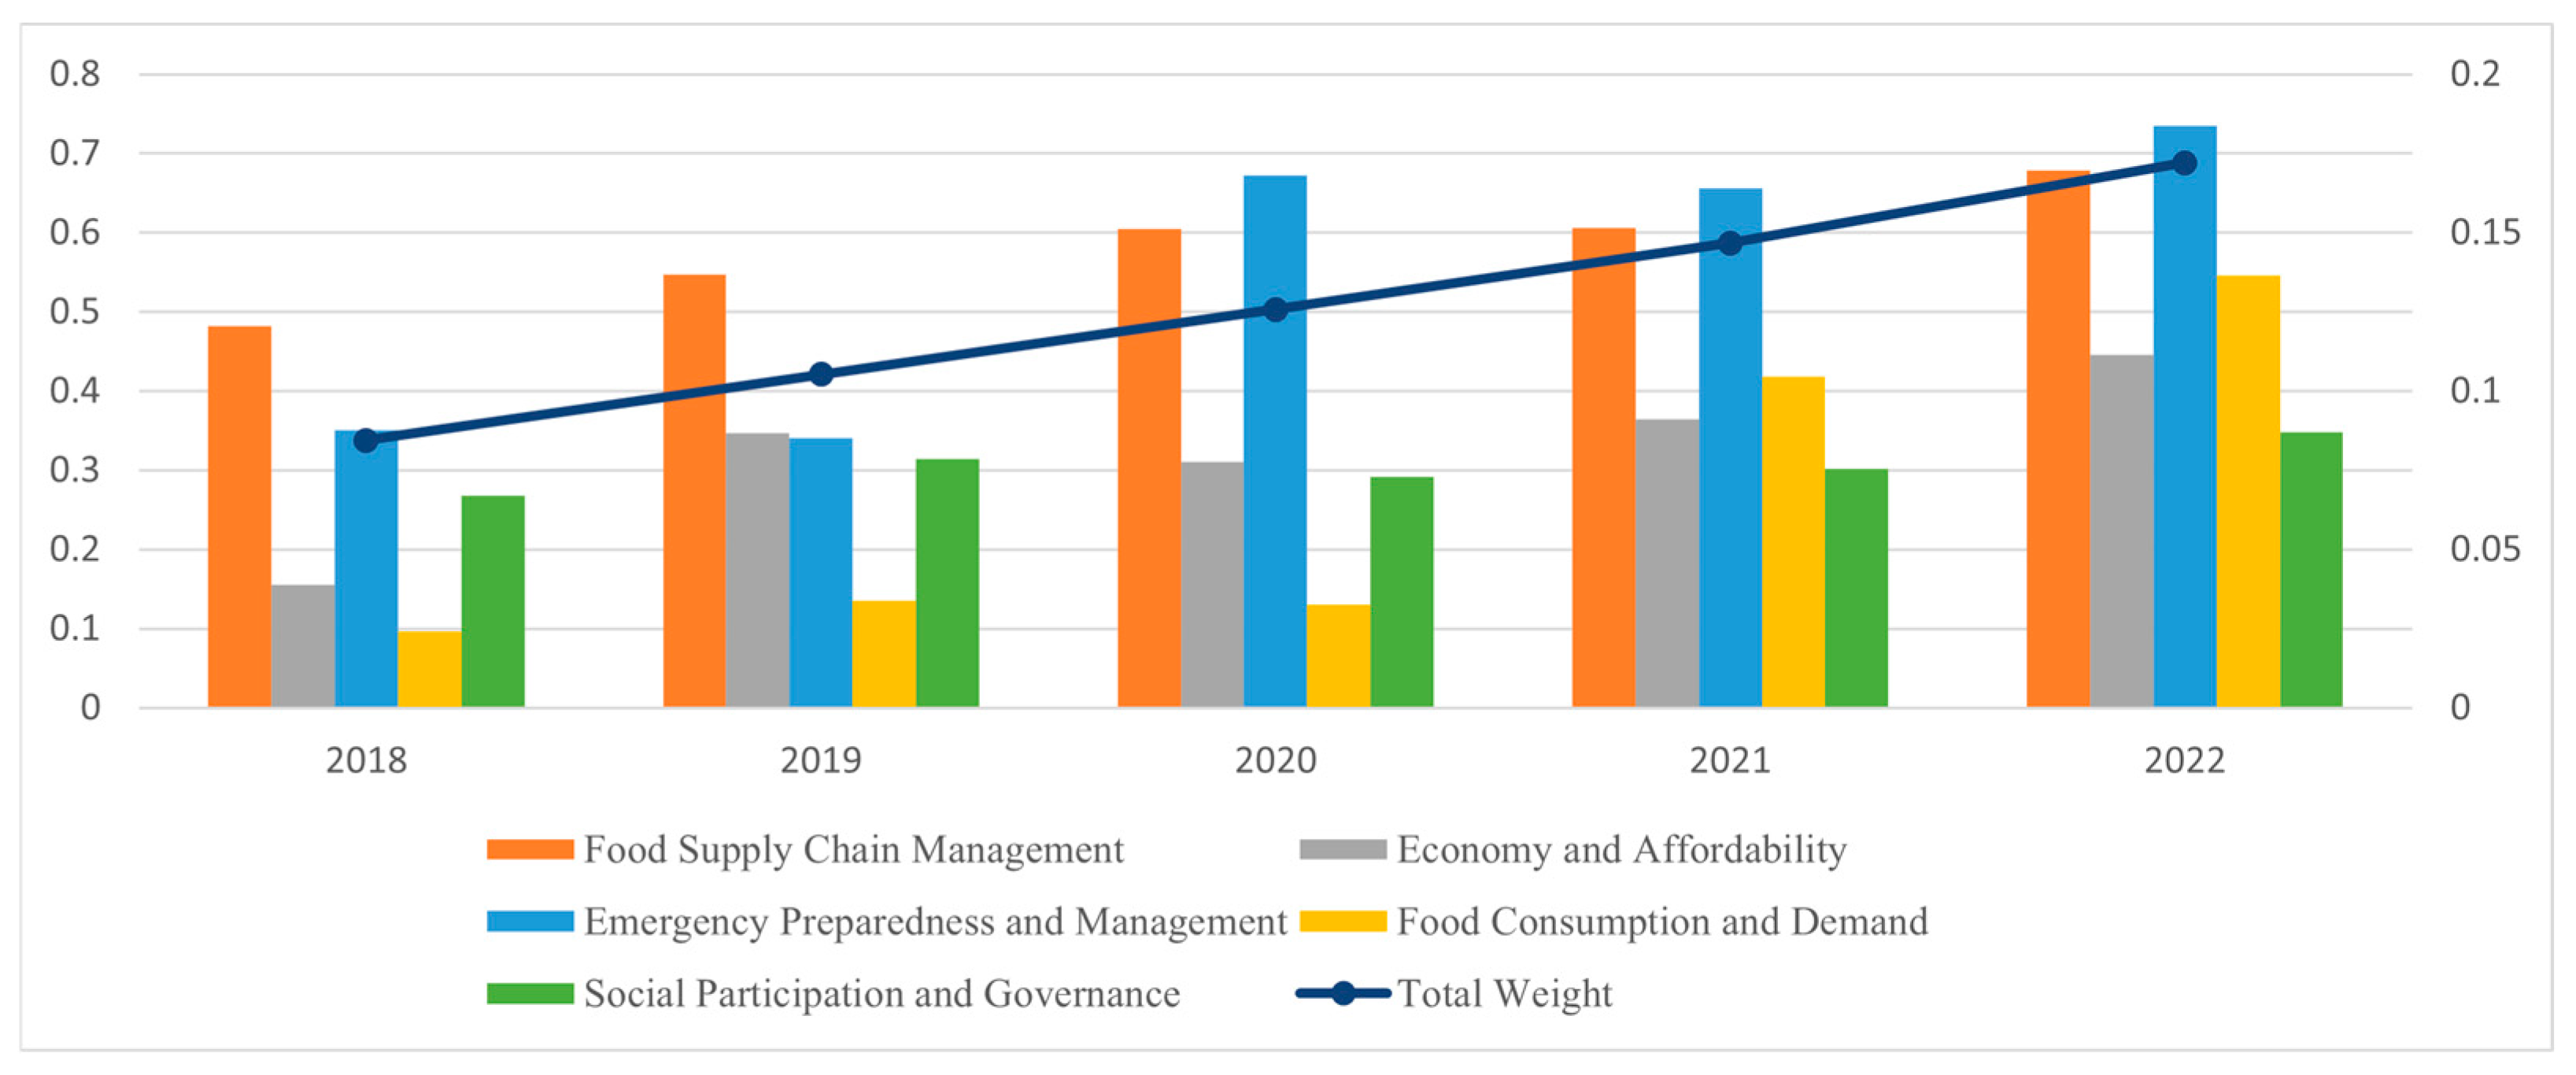
| Year | Food Supply Chain Management | Economic and Affordability | Food Consumption and Demand | Emergency Preparedness and Management | Social Participation and Governance | Total Weight | Benefit Level |
|---|---|---|---|---|---|---|---|
| 2018 | 0.1206 | 0.0389 | 0.0240 | 0.0877 | 0.0669 | 0.3381 | Poor |
| 2019 | 0.1368 | 0.0866 | 0.0340 | 0.0851 | 0.0787 | 0.4213 | Poor |
| 2020 | 0.1511 | 0.0778 | 0.0327 | 0.1681 | 0.0731 | 0.5028 | Poor |
| 2021 | 0.1516 | 0.0910 | 0.1047 | 0.1640 | 0.0754 | 0.5867 | Poor |
| 2022 | 0.1698 | 0.1114 | 0.1366 | 0.1837 | 0.0871 | Moderate |
Disclaimer/Publisher’s Note: The statements, opinions and data contained in all publications are solely those of the individual author(s) and contributor(s) and not of MDPI and/or the editor(s). MDPI and/or the editor(s) disclaim responsibility for any injury to people or property resulting from any ideas, methods, instructions or products referred to in the content. |
© 2024 by the authors. Licensee MDPI, Basel, Switzerland. This article is an open access article distributed under the terms and conditions of the Creative Commons Attribution (CC BY) license (https://creativecommons.org/licenses/by/4.0/).
Share and Cite
Gu, Y.; Sun, J.; Cai, J.; Xie, Y.; Guo, J. Urban Planning Perspective on Food Resilience Assessment and Practice in the Zhengzhou Metropolitan Area, China. Land 2024, 13, 1625. https://doi.org/10.3390/land13101625
Gu Y, Sun J, Cai J, Xie Y, Guo J. Urban Planning Perspective on Food Resilience Assessment and Practice in the Zhengzhou Metropolitan Area, China. Land. 2024; 13(10):1625. https://doi.org/10.3390/land13101625
Chicago/Turabian StyleGu, Yi, Jinyu Sun, Jianming Cai, Yanwen Xie, and Jiahao Guo. 2024. "Urban Planning Perspective on Food Resilience Assessment and Practice in the Zhengzhou Metropolitan Area, China" Land 13, no. 10: 1625. https://doi.org/10.3390/land13101625
APA StyleGu, Y., Sun, J., Cai, J., Xie, Y., & Guo, J. (2024). Urban Planning Perspective on Food Resilience Assessment and Practice in the Zhengzhou Metropolitan Area, China. Land, 13(10), 1625. https://doi.org/10.3390/land13101625


