Article

Analysis of Surface Urban Heat Island in the Guangzhou-Foshan Metropolitan Area Based on Local Climate Zones

1
School of Architecture, South China University of Technology, Guangzhou 510641, China
2
School of Civil Engineering and Architecture, Guangxi Minzu University, Nanning 530008, China
3
State Key Laboratory of Subtropical Building and Urban Science, Guangzhou 510640, China
*
Authors to whom correspondence should be addressed.
Land 2024, 13(10), 1626; https://doi.org/10.3390/land13101626
Submission received: 30 August 2024 / Revised: 29 September 2024 / Accepted: 5 October 2024 / Published: 7 October 2024
(This article belongs to the Special Issue Planning for Sustainable Urban and Land Development)

Abstract

:
Understanding the driving mechanisms behind surface urban heat island (SUHI) effects is essential for mitigating the degradation of urban thermal environments and enhancing urban livability. However, previous studies have primarily concentrated on central urban areas, lacking a comprehensive analysis of the entire metropolitan area over distinct time periods. Additionally, most studies have relied on regression analysis models such as ordinary least squares (OLS) or logistic regression, without adequately analyzing the spatial heterogeneity of factors influencing the surface urban heat island (SUHI) effects. Therefore, this study aims to explore the spatial heterogeneity and driving mechanisms of surface urban heat island (SUHI) effects in the Guangzhou-Foshan metropolitan area across different time periods. The Local Climate Zones (LCZs) method was employed to analyze the landscape characteristics and spatial structure of the Guangzhou-Foshan metropolis for the years 2013, 2018, and 2023. Furthermore, Geographically Weighted Regression (GWR), Multi-scale Geographically Weighted Regression (MGWR), and Geographical Detector (GD) models were utilized to investigate the interactions between influencing factors (land cover factors, urban environmental factors, socio-economic factors) and Surface Urban Heat Island Intensity (SUHII), maximizing the explanation of SUHII across all time periods. Three main findings emerged: First, the Local Climate Zones (LCZs) in the Guangzhou-Foshan metropolitan area exhibited significant spatial heterogeneity, with a non-linear relationship to SUHII. Second, the SUHI effects displayed a distinct core-periphery pattern, with Large lowrise (LCZ 8) and compact lowrise (LCZ 3) areas showing the highest SUHII levels in urban core zones. Third, land cover factors emerged as the most influential factors on SUHI effects in the Guangzhou-Foshan metropolis. These results indicate that SUHI effects exhibit notable spatial heterogeneity, and varying negative influencing factors can be leveraged to mitigate SUHI effects in different metropolitan locations. Such findings offer crucial insights for future urban policy-making.

1. Introduction

With the rapid development of urbanization and the ongoing effects of global warming, urban heat island (UHI) issues—where land surface temperatures (LST) in cities are higher than those in surrounding rural areas—are increasingly becoming a major challenge for urban planners and experts in related fields [1,2,3,4,5]. Rapid industrialization typically leads to the expansion of urban construction land, characterized by the conversion of diverse ecological and agricultural land into built environments. This transformation results in an increase in impervious surfaces and a deterioration of the urban thermal environment [6]. Urban areas, as major economic growth centers, attract almost 57% of the world’s population, with 35% of that population being under 15 years old or over 65 years old [7]. In the future, cities are expected to remain highly attractive, with projections indicating that more than 67% of the population will reside in urban areas by 2050 [8]. Therefore, it is essential to explore the complex relationship between urban development and UHI effects, summarizing the various factors influencing the UHI effect and providing a quantitative basis for future urban planning and management.
In recent years, the deterioration of urban thermal environments has prompted extensive research on the mechanisms behind urban heat island (UHI) effects. Many previously overlooked factors such as tree crown shadow areas and historical and economic factors have been reemphasized [9,10,11]. Additionally, many new analytical methods including random forests, multiple linear regression, and machine learning have been introduced to analyze UHI effects [12,13,14]. Despite this progress, defining surface urban heat island intensity (SUHII) across different urban areas has become a challenge. Previous studies relied on binary urban-rural classifications or landscape feature analysis methods to measure the intensity of urban heat island (UHI) effects in different types of urban areas, but these surface landscape classification methods lack precision [15,16]. The introduction of local climate zones (LCZs) has addressed this issue, offering a framework for SUHII calculation by categorizing built types into 10 categories (1–10) and land cover types into 7 categories [5,17,18]. Numerous scholars have employed LCZs to study the UHI effects and their mechanisms. For instance, Badaro-Saliba et al. [17] utilized the LCZ scheme to assess the SUHI effects in complex urban regions, highlighting that UHI effects in coastal cities are influenced by factors like building height and impervious surface ratio. Xi et al. [19] analyzed seasonal UHI effects in Hefei city using LCZs, employing geographical detectors and regression analysis to explore the impact mechanisms. Yin et al. [20] studied 1920 blocks in Hangzhou city, utilizing an urban weather generator (UWG), LCZs, and deep learning to analyze the UHII across different local climate zones. This research also provided urban planning and design recommendations, such as limiting the proportion of compact high-rise (LCZ 1) types and increasing green space ratios.
Numerous researchers have established a relatively standardized approach to study SUHI effects and have developed a framework for calculating SUHI intensity [5,15,19,21,22]. This prevalent framework primarily relies on satellite remote sensing of infrared radiation to estimate LST across different local climate zones (LCZs). Temperature differences are then compared to calculate the SUHII. Following this, the relevant factors contributing directly or indirectly to the generation of SUHI are summarized. This framework has been widely applied in various studies. For instance, Shi et al. [23] investigated the SUHII in Wuhan city by computing the temperature difference between LCZs and LCZ D, utilizing the formula of T = T L C Z X T L C Z D . While other researchers also calculate SUHII by different formulae such as T = T L C Z X T L C Z B or T = T L C Z X T L C Z A [24,25,26]. Based on the information above, it is inferred that researchers have basically reached a consensus on the calculation method of SUHII. Through multiple empirical tests and calculations, it is believed that the formula using LCZ D as an indicator of SUHI effect is more reliable.
In exploring the mechanisms of SUHI effects, researchers have summarized various influencing factors and indicators [2,15,27,28]. Moon et al. [29] investigated the relationship between urban green space (UGS) layout and UHI effects, revealing that green space in central urban areas mitigates the UHI effect the most. Peng et al. identified correlations between urban morphology and UHI effects, while Li et al. [30] concluded that block types in different urban renewal areas significantly impact SUHI. Additionally, numerous studies have confirmed that factors such as population density, building density, traffic density, nightlight, and urban morphology significantly influence UHI effects [19,31,32].
Despite the significant achievements in existing research, certain limitations remain that necessitate further exploration. On one hand, when examining the relationship between the Surface Urban Heat Island (SUHI) effect and various Land Cover Zones (LCZ) using ordinary least squares (OLS) or logistic multiple regression analysis, researchers often overlook the spatial heterogeneity of influencing factors at different time periods. This oversight can lead to an inadequate exploration of the impact factors across different locations and times within the city [20,32]. On the other hand, studies analyzing the influencing factors of the SUHI effect typically focus on urban areas or central business districts (CBDs), with few investigations adopting a broader regional perspective. By examining the SUHI effects and their influencing factors from the standpoint of urban agglomerations or metropolitan areas, these studies often result in a limited consideration of the relevant factors [33,34,35,36].
To address these research gaps, this study employs a multi-scale geographically weighted regression (MGWR) model to analyze the influencing factors of the Surface Urban Heat Island (SUHI) effect across diverse locations and time periods within the Guangzhou-Foshan metropolitan area. Additionally, Geodetectors are utilized to explore the interactions between influencing factors and their effects on SUHI [37,38,39]. By comparing multiple models, this research aims to provide a comprehensive analysis of the factors affecting the urban heat island effect in metropolitan areas and offers quantitative suggestions and guidance for future urban renewal and construction efforts. This study seeks to answer the following two questions: (1) What is the influential mechanism of SUHI impact factors across different time periods and locations within a metropolitan area characterized by a complete core-periphery spatial pattern? (2) Which types of Land Cover Zones (LCZ) have positive or negative impacts on SUHI effects, and how do the impacts of different LCZs vary? The remainder of this paper is organized as follows: Section 2 introduces the research materials and methods. Section 3 presents the classification of the LCZ scheme in the Guangzhou-Foshan metropolitan area and explores the influencing factors of various LCZs that impact SUHI effects at different locations and times. Section 4 discusses the key findings of this research, comparing them with previous studies, and proposes planning and policy recommendations to mitigate the SUHI effect. Finally, the concluding section summarizes the findings and offers suggestions for future research directions.

2. Materials and Methods

2.1. Study Area

The core region of this study is the Guangzhou-Foshan metropolitan area, which comprises the two principal cities of Guangzhou and Foshan, located in southern China. These cities serve as key components of the Guangdong-Hong Kong-Macao Greater Bay Area (Figure 1). The metropolitan area spans longitude 112°22′ E–113°03′ E and latitude 22°26′ N–23°56′ N, with a population of approximately 30 million residents and an area of 11,235.12 km2. This region experiences a subtropical monsoon climate, with average annual temperatures ranging from 21.7 °C to 23.1 °C throughout the year. In the past five years, summer temperatures have peaked at 39.1 °C, indicating a significant increase in the SUHI effect [40,41]. This study focuses on the Guangzhou-Foshan metropolitan area, specifically examining the summers of 2013, 2018, and 2023 as research periods. The SUHI effects and their influencing factors during these three periods were analyzed and compared, providing insights into the mechanisms underlying the SUHI phenomenon.

2.2. Data Source

As shown in Table 1, the data utilized in this research were obtained from reliable sources. (1) Landsat images were provided by the United States Geological Survey (USGS) from the Landsat-8 satellite, equipped with a Thermal Infrared Sensor (TIRS). The quality of the data was ensured by selecting cloud-free and rain-free images from the summers of 2013, 2018, and 2023 to retrieve land surface temperatures (LST) [42,43]. (2) The Land-Use and Land-Cover Change (LUCC) data were acquired from the Chinese Academy of Sciences, which maintains remote sensing monitoring datasets of annual land use in China (https://www.resdc.cn/Default.aspx, accessed on 15 May 2024). (3) High-quality nighttime light images were obtained from the DMSP-OLS dataset (https://dataverse.harvard.edu/dataset.xhtml?persistentId=doi:10.7910/DVN/GIYGJU, accessed on 15 May 2024) [44]. (4) Annual road data were sourced from OpenStreetMap (OSM). (5) Points of Interest (POI) data were obtained from opensource data from Amap v10.0.5. (6) Digital elevation model (DEM) data were acquired from NASA’s dataset (https://www.earthdata.nasa.gov, accessed on 1 May 2024). (7) Gross Domestic Product (GDP) and population data were derived from the China Urban Statistical Yearbook, Guangdong Provincial Statistical Yearbook, Guangzhou Statistical Yearbook, and other sources.

2.3. Methods

The methodology of this research consists of four parts (Figure 2): Classification of LCZs: The first step involves classifying the Local Climate Zones (LCZs) in the Guangzhou-Foshan metropolitan area. Training samples for various LCZs were drawn from Google Earth. A combination of LCZ generators and random forest (RF) classification techniques was employed to categorize the surface landscape features of Guangzhou and Foshan into different LCZ types, ensuring a recognition accuracy greater than 75% [45,46,47]. Calculation of SUHII: The second step calculates the Surface Urban Heat Island Intensity (SUHII) by comparing the land surface temperatures (LSTs) of different LCZs. The LSTs used for this comparison were obtained using a single-window algorithm to analyze high-quality Landsat images [48,49,50,51]. Selection of Influencing Factors: The third step involves selecting the influencing factors. Based on previous research and practical experience, this study identified three categories of influencing factors: remote sensing data, urban multi-source big data, and urban panel data [2,15,31]. Exploration of Influencing Mechanisms: The fourth step aims to explore the mechanisms influencing SUHI. Following the steps outlined above, this study intends to identify the influencing factors and mechanisms of SUHI effects through the application of geographically weighted regression (GWR). Additionally, multi-scale geographically weighted regression (MGWR) will be employed to investigate the influencing factors related to the built types of LCZ. Finally, the interactions between these factors will be examined using geographic detectors [21,26,52].

2.3.1. Local Climate Zones Measurement

The LCZ generator and random forest classification were the two primary methods employed to create the LCZ mapping in this research [45,53]. The LCZ generator, developed in 2017 based on the World Urban Database and Access Portal Tools (WUDAPT), has been widely used in studies of urban landscape feature analysis and the Urban Heat Island (UHI) effect, as well as in related fields [7,54,55,56,57,58]. The generation logic process involves selecting training sets for different types of LCZs within the research area on Google Maps and exporting these as KML format; the selected area should ideally be within 300 m × 300 m. The generator (https://lcz-generator.rub.de, accessed on 15 May 2024) will select similar images from the WUDAPT database to fit and generate LCZ maps of the target region. In this research, the LCZ classification scheme classified land surface morphology into eight built types and seven land cover types, among which the built types include LCZ 2 (compact midrise), LCZ 3 (compact lowrise), LCZ 4 (open highrise), LCZ 5 (open midrise), LCZ 6 (open lowrise), LCZ 8 (large lowrise), LCZ 9 (sparsely built), LCZ 10 (heavy industry); and the land cover types include LCZ A (dense trees), LCZ B (scattered trees), LCZ C (bush, scrub), LCZ D (low plants), LCZ E (bare rock or paved), LCZ F (bare soil or sand), LCZ G (water) [45,59] (Table 2).
However, the satellite remote sensing imagery data in WUDAPT database primarily originate from cities in Europe and the Americas, which may render it unsuitable for Asian regions, increasing the likelihood of errors in classifying Asian urban landscapes. To address this issue, this study employed the random forests method to rectify the LCZ maps of the Guangzhou-Foshan metropolitan area produced by LCZ generator. Due to the confusion between LCZ 2 (compact midrise) and LCZ 3 (compact lowrise), as well as confusing LCZ 5 (open midrise) with LCZ 6 (open lowrise) in Asian contexts based on the original WUDAPT LCZ-generator, random forest classification was utilized to reclassify satellite image training samples for these pairs, thereby enhancing the identification accuracy of LCZ types 2, 3, 5, and 6 [60]. For each LCZ type, 5–10 training samples were selected from high-resolution satellite imagery, with adjustments made continuously until the accuracy exceeded 75% [61].

2.3.2. Surface Urban Heat Island Measurement

The measurement of SUHII consists of two steps: (1) computing land surface temperature and (2) comparing the land surface temperature between LCZ X and LCZ D.
Calculating LST involves three parts. First, calculate the fractional vegetation cover index with the following equations [62]:
NDVI = (NIR − R)/(NIR + R)
FC = ( N D V I N D V I m i n ) / ( N D V I m a x N D I V m i n )
where NDVI is Normalized Difference Vegetation Index; NIR indicates the near infrared reflectance; R represents the red band reflectance; FC means the fractional vegetation cover index.
Secondly, calculate black-body radiation brightness value with the following equations:
ε s u r f a c e = 0.9625 + 0.0614 F C 0.0461 F C 2
ε b u i l d i n g = 0.9589 + 0.086 F C 0.0671 F C 2
where ε s u r f a c e is natural surface emissivity and ε b u i l d i n g is urban surface emissivity.
According to the radiation transfer equation and Planck’s law, the formula for the black-body temperature (T) in the thermal infrared band is expressed as the following equation:
B ( T S ) = [ L λ L   τ 1 ε L ] / τ · ε
where B ( T S ) is the temperature of black-body radiant brightness in the thermal infrared band; L and L represent the upward and downward radiance of the atmosphere; ε indicates land surface emissivity; τ is atmospheric transmittance in the thermal infrared band; and L λ represents brightness value in the thermal infrared band.
Finally, calculate the LST by B ( T S ) with the following equation:
L S T = K 2 / I n ( K 1 / B ( T S ) + 1 )
where LST is land surface temperature; as for K 1 and K 2 , according to data from NASA’s official website and collaborating websites, it can be inferred that K 1 is 666.09 w / ( m 2 · s r · μ m ) , K 2 = 1282.71 K.
SUHII is defined as the temperature difference between built types LCZ and land cover types LCZ. Considering the characteristics of the Guangzhou-Foshan metropolitan area, LCZ D was selected as the measurement standard for the SUHI effect in this study. The formula for calculation is presented as follows:
S U H I I = T L C Z X T L C Z D
where T L C Z X represents the temperature of LCZ X and T L C Z D indicates the temperature of LCZ D, which consists of low plant surface scenery.

2.3.3. Analysis of Driving Mechanism of SUHI

In previous studies, many scholars have explored the formation mechanisms of urban heat island (UHI) effects based on classifying local climate zones (LCZ). The surface urban heat island intensity (SUHII) in different types of LCZ as a symbolic indicator is often used as the dependent variable. When selecting independent variables, land cover elements are the primary considerations [63]. Some scholars have incorporated urban environment factors on top of the existing land cover factors when conducting urban studies [64,65,66]. However, as research progressed, the explanatory power of these two factors for SUHI effects proved somewhat insufficient. Subsequently, urban socioeconomic factors were added to the analysis [67,68,69]. Therefore, in this study, we refer to previous research and comprehensively consider three types of influencing factors: land cover factors, urban environmental factors and social-economic factors (Table 3).
To ensure the depth and comprehensiveness of this study, three kinds of regression models were selected to reveal the impact mechanism of ten independent variables on the SUHI effects in diverse LCZs of the metropolis. Firstly, the GWR model is used to analyze the global characteristics of influencing factors, allowing for the assessment of the average impact of each type of influencing factor on the SUHII of different LCZs, and identifying the most significant factor types within the overall range of the Guangzhou-Foshan metropolitan area. Secondly, based on the GWR model analysis, the MGWR model is employed to further identify the impact of each type of factor on the SUHII of LCZs at different geographical locations. This study examines the effects of different factors in the core, transition, and peripheral areas within the “core-peripheral” metropolitan area. Finally, the geographic detectors (GD) model is used to investigate the interactions between different factors, providing a deeper understanding of how various types of factors influence SUHII of different LCZs.
The GWR model was applied to analyze the driving mechanism of SUHI on all types of LCZs, with the final result values ranging between −1 and 1. The closer the result value is to 1, the more positive effect the influencing factor has on SUHI, and the closer the result is to −1, the more negative effect the factor has on SUHII. The formula is as follows:
y i = β 0 ( u i , v i ) + k = 1 m β k ( u i , v i ) x i k + ε i
where y i represents the SUHII of LCZ X i ; β 0 is intercept; u i   a n d   v i indicate the longitude and latitude of LCZ X i ; β k ( u i , v i ) is the fitting coefficient of the k explanatory variable of LCZ X i ; x i k means the value of the k explanatory variable at the LCZ X i ; and ε i is random error term.
The MGWR model is one of the important methods for analyzing spatial heterogeneity. As an optimized model of GWR model, it allows each research variable to have different bandwidths, exploring the impact range and mechanisms of various influencing factors across different geographical spaces. This makes it a more accurate spatial model, resulting in more reliable outcomes. In this study, the MGWR model was exploited to analyze the driving mechanism of SUHII on built types of LCZs, representing the impact of influencing factors on the SUHII of LCZ at different spatial-temporal positions. This study utilizes the MGWR library based on the Python platform [70].
The calculating formula is as follows:
y i = j = 1 k β b w j ( u i , v i ) x i j + ε i
where b w j represents the bandwidth used for the regression coefficient of the j variable; The vitality index representing the LCZ X i ; y i represents the SUHII of the LCZ X i ; ( u i , v i ) represents the centroid coordinates of the LCZ X i ; β b w j represents the regression coefficient of the j independent variable of bandwidth in the LCZ X i ; k represents the number of samples; and ε i represents the random error term.
The GD model was utilized to analyze the driving mechanism of SUHI on all types of LCZs, with its four approaches for analysis: risk detection, factor detection, ecological detection, and interaction detection. This study mainly used factor detection and dual factor interaction detection. In this study, a geographic detector model based on the R language platform was used, in which the influencing factors were divided into 3–8 categories based on the actual situation [37].
Factor detection can be used to detect the spatial heterogeneity of different types of LCZ. Meanwhile, it can be applied to explore the significance p and correlation q of different influencing factors on SUHI heterogeneity. For the p-value, that under 0.05 indicates a significant impact, that less than 0.01 indicates a more significant impact, while that equal to 0 indicates an extremely significant impact. For the q-value, the specific formula for calculating it is as follows:
q = 1 i = 1 L N i σ i 2 N σ 2
where up-script L represents the classification number of the influencing factors; N is the total number of samples;   N i is the total number of the i type factor; σ i 2 is the variance of the i type factor; and σ is the variance of SUHI for different types of LZC. The range of q-value is presented as: q [0, 1]. The larger the q-value of the influencing factor, the stronger its impact on SUHI.
The interaction detector was used to identify the explanatory power of SUHI, explaining how factors impact on different LCZs when any two influencing factors work together. As shown in Table 4, the geographical detector (GD) explanatory power can be divided into five types.

3. Results

3.1. LCZ Maps

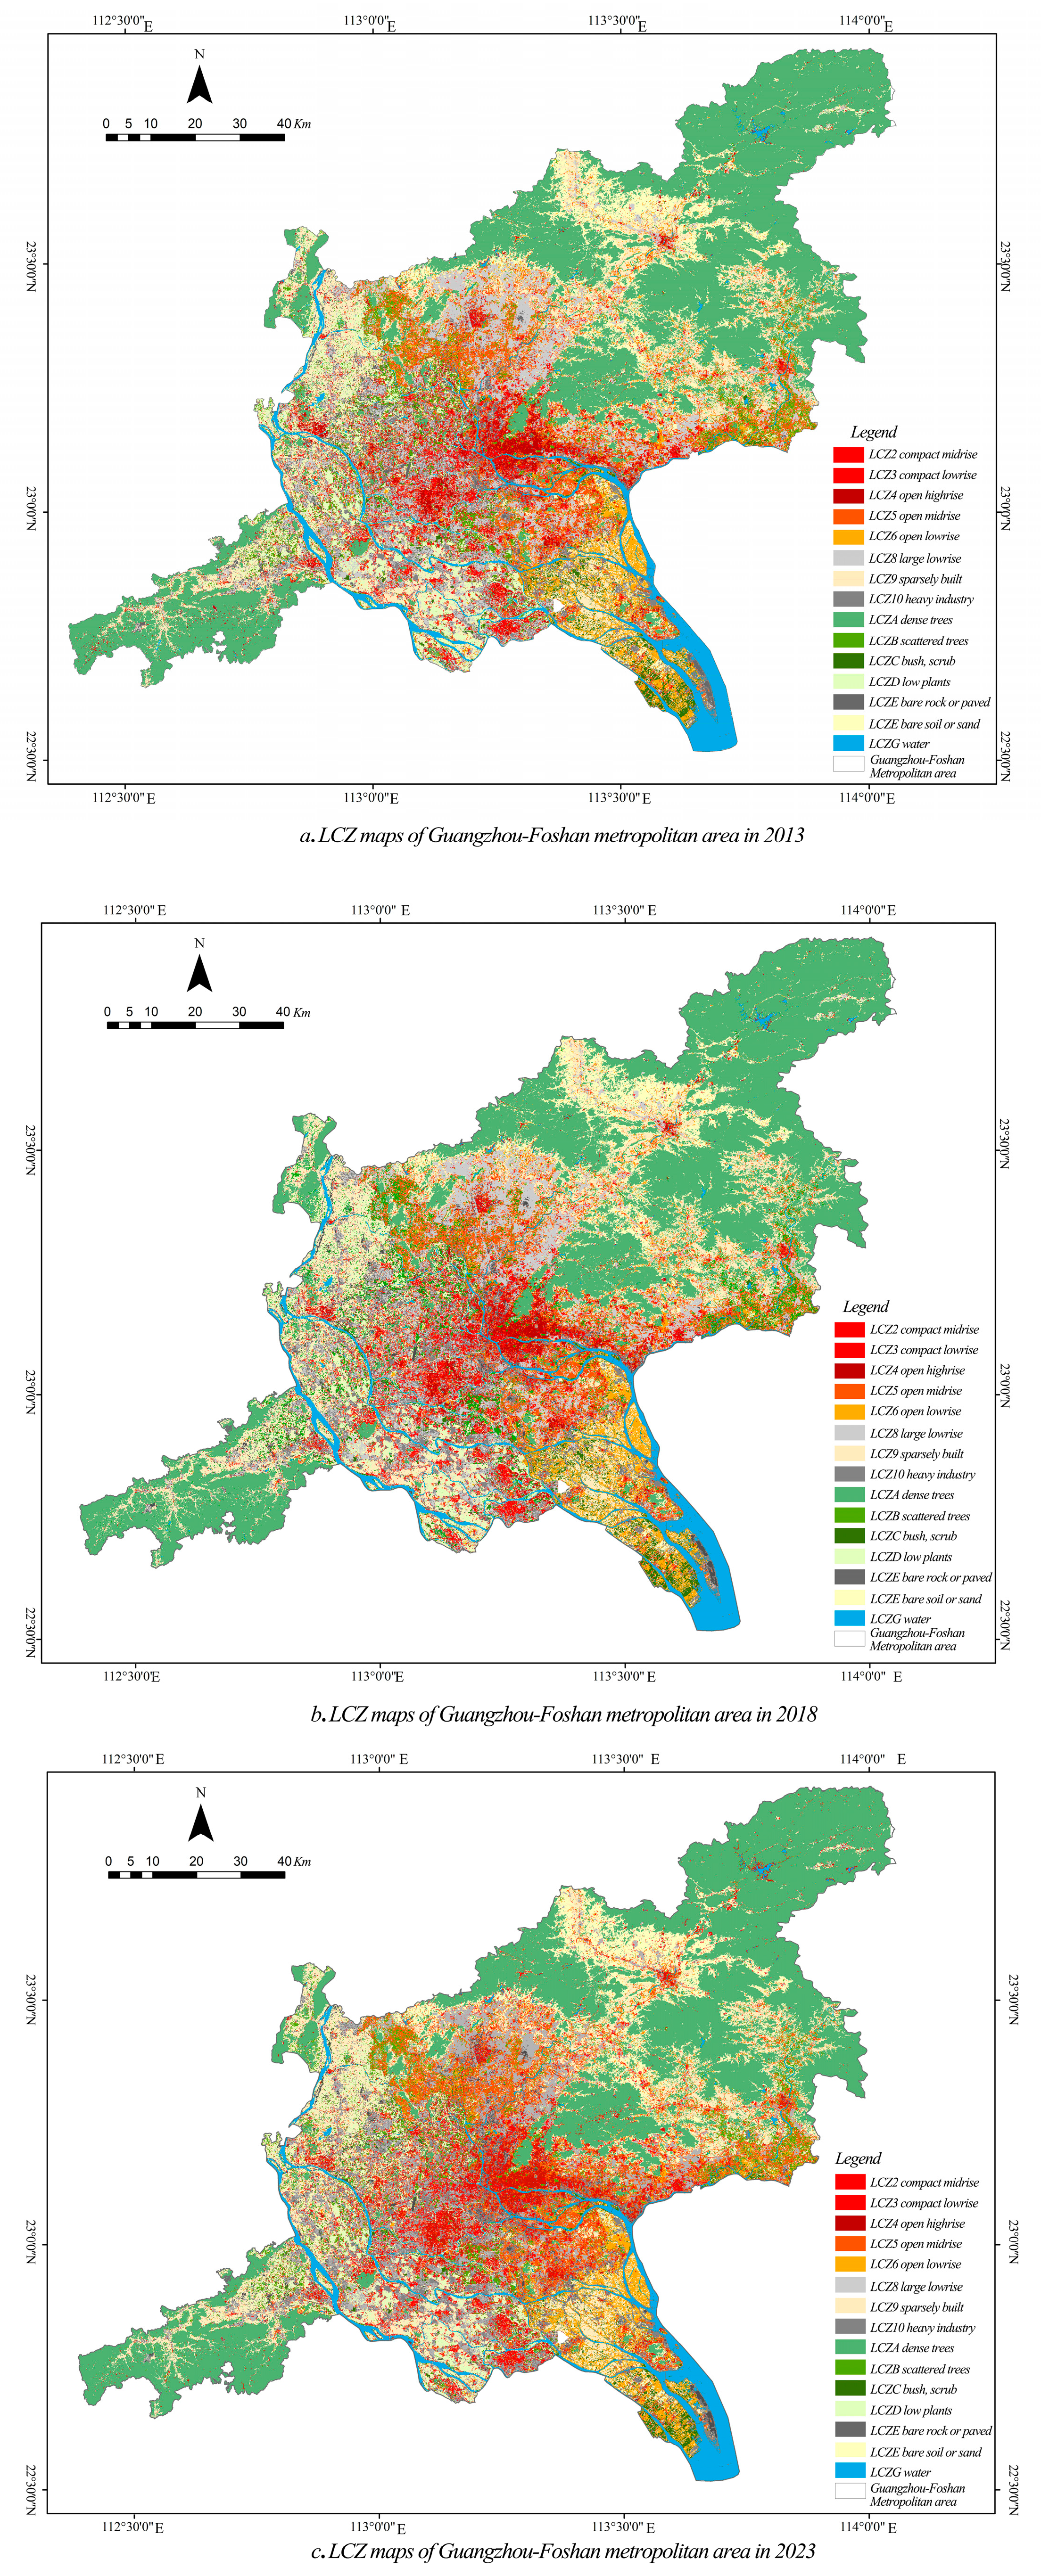
The characteristics of the surface landscape in the Guangzhou-Foshan metropolitan area were classified by LCZ generator and random forest. After several rounds of adjustment, the final Kappa coefficients turned out to be 0.88 (2013), 0.76 (2018), and 0.91 (2023) (Figure 3). Among built LCZ types, sparsely built (LCZ9) and Large lowrise (LCZ8) took up the largest proportion of land within the overall scope, while open highrise (LCZ4) and open midrise (LCZ5) had the largest proportion of land area in the central urban area. As for the factors in land cover LCZ types, dense tree (LCZ A) has the largest land occupation ratio.
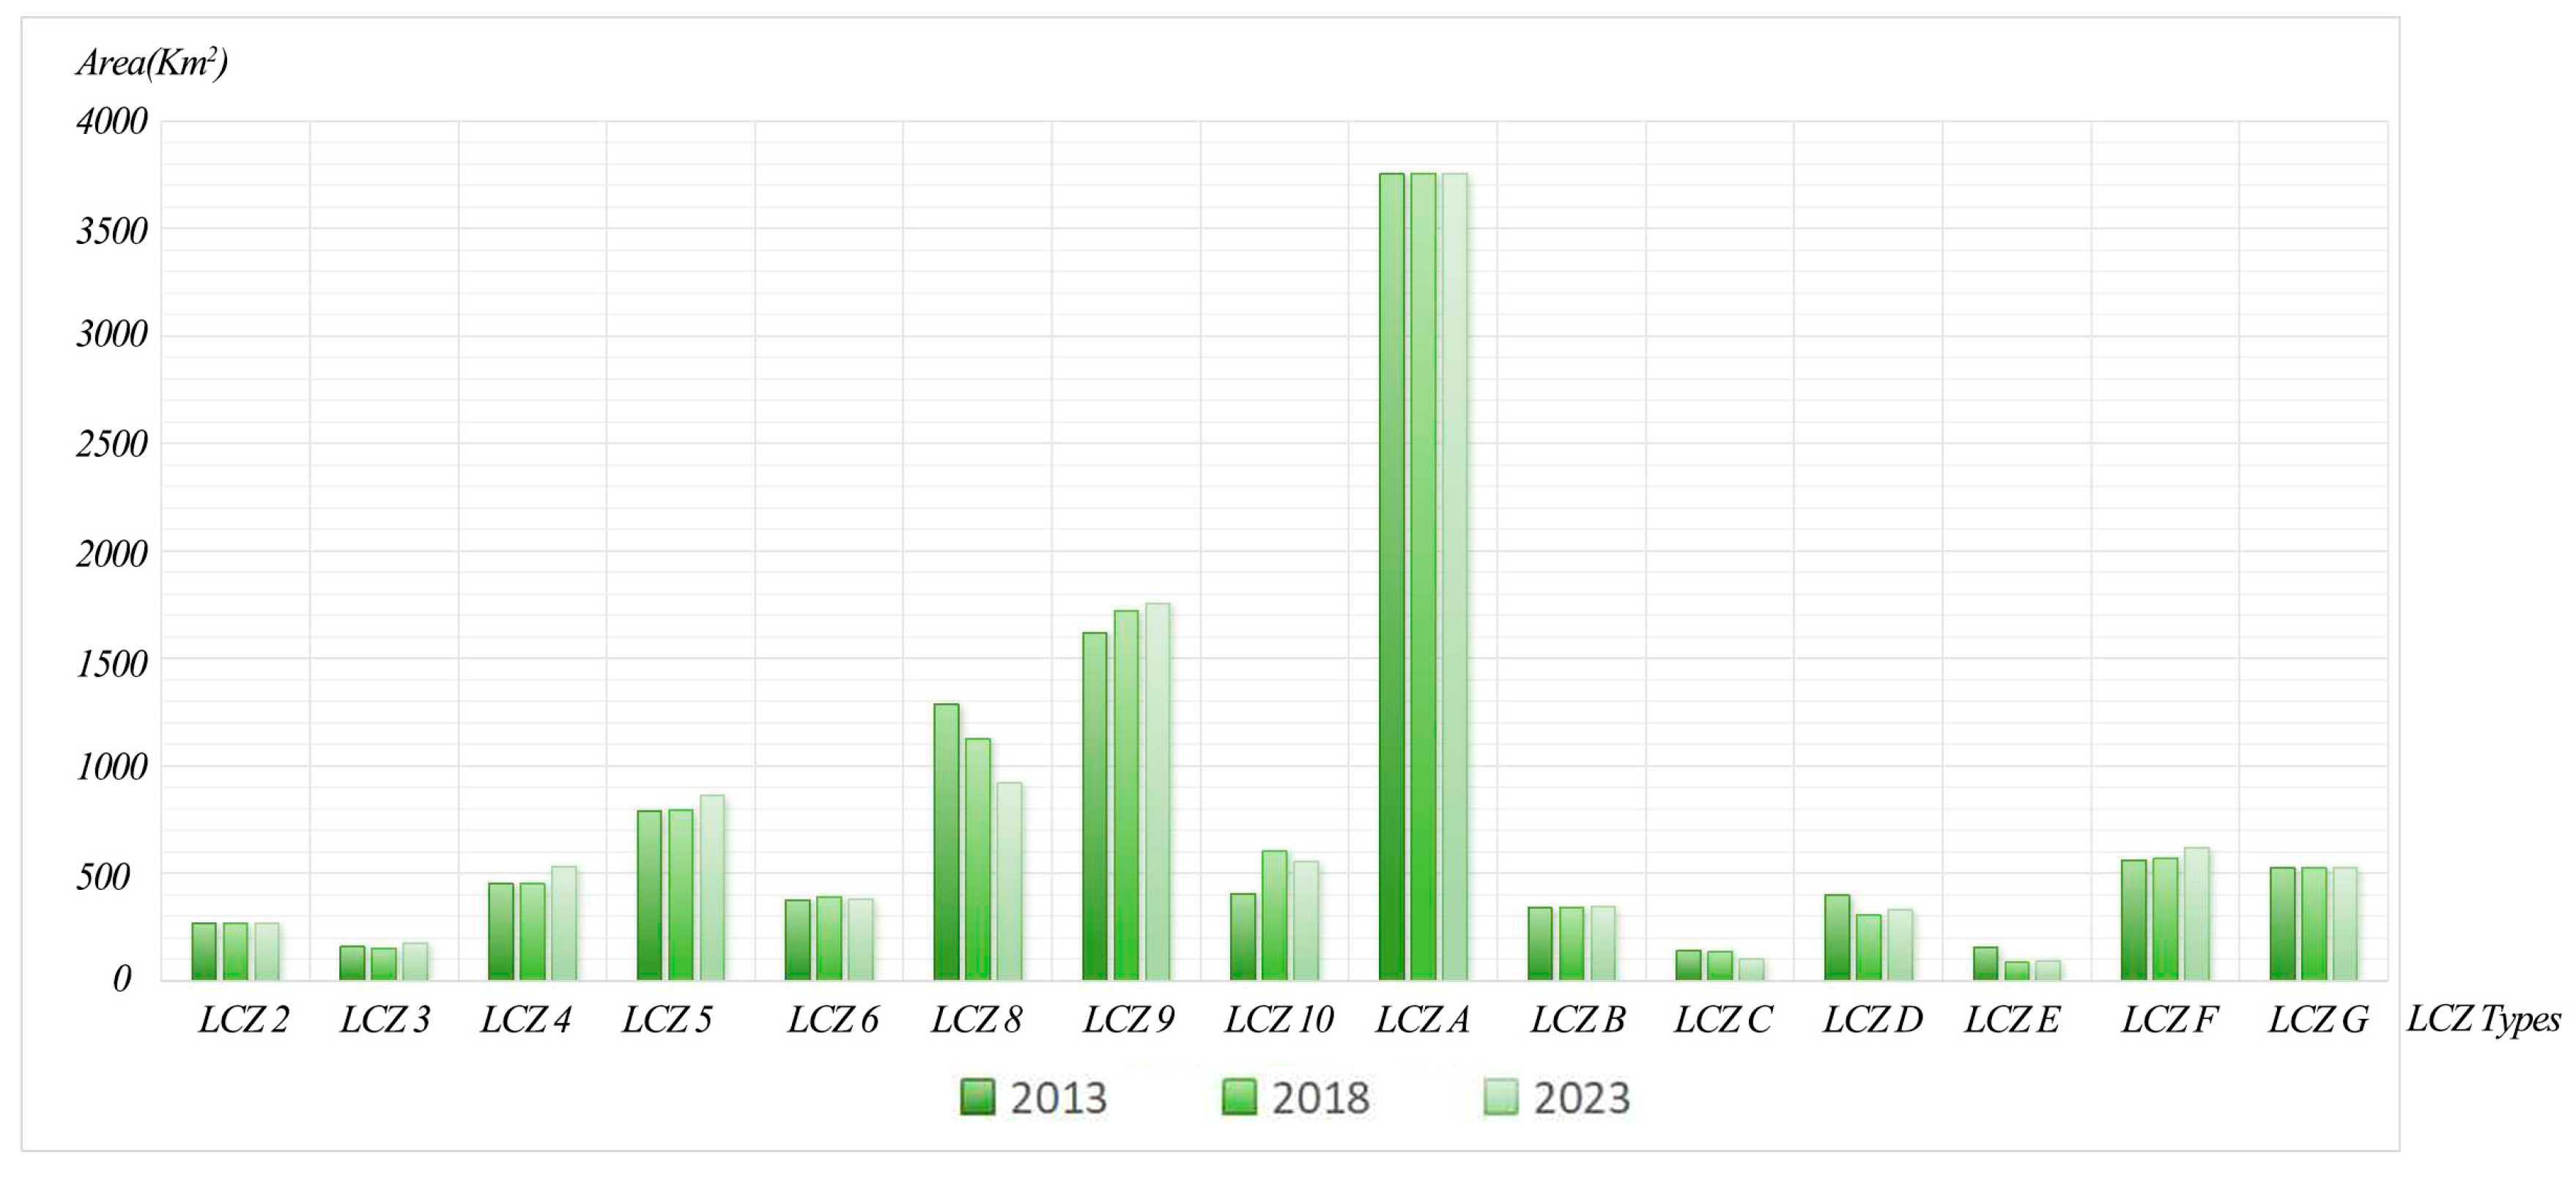
Figure 4 and Table 5 illustrate the change of diverse LCZs in 2013, 2018 and 2023. This figure demonstrates a significant growth trend in highrise (LCZ4), open midrise (LCZ5) and sparsely built (LCZ9), with LCZ9 having the largest growth area, increasing from 1618.563 km2 to 1755.408 km2, leading to a total growth of 136.845 km2. LCZ4 had the second largest growth area, with a total growth of 80.557 km2, increasing from 450.274 km2 to 530.831 km2. LCZ5 was the object of the least growth of 74.152 km2 in area, increasing from 786.609 km2 to 860.761 km2. On the contrary, Large lowrise (LCZ8), bush, scrub (LCZ C) and bare rock or paved (LCZ E) represented a remarkable reduced trend, with LCZ8 experiencing the most drastic drop from 1285.022 km2 to 917.980 km2, a total decrease of 367.042 km2. LCZ E decreased the second most in area, from 152.330 km2 to 90.305 km2, marking a total decrease of 62.025 km2. LCZ C had the least decrease of 39.849 km2, from 138.346 km2 to 98.515 km2.

3.2. LST and SUHI of Guangzhou-Foshan Metropolitan Area

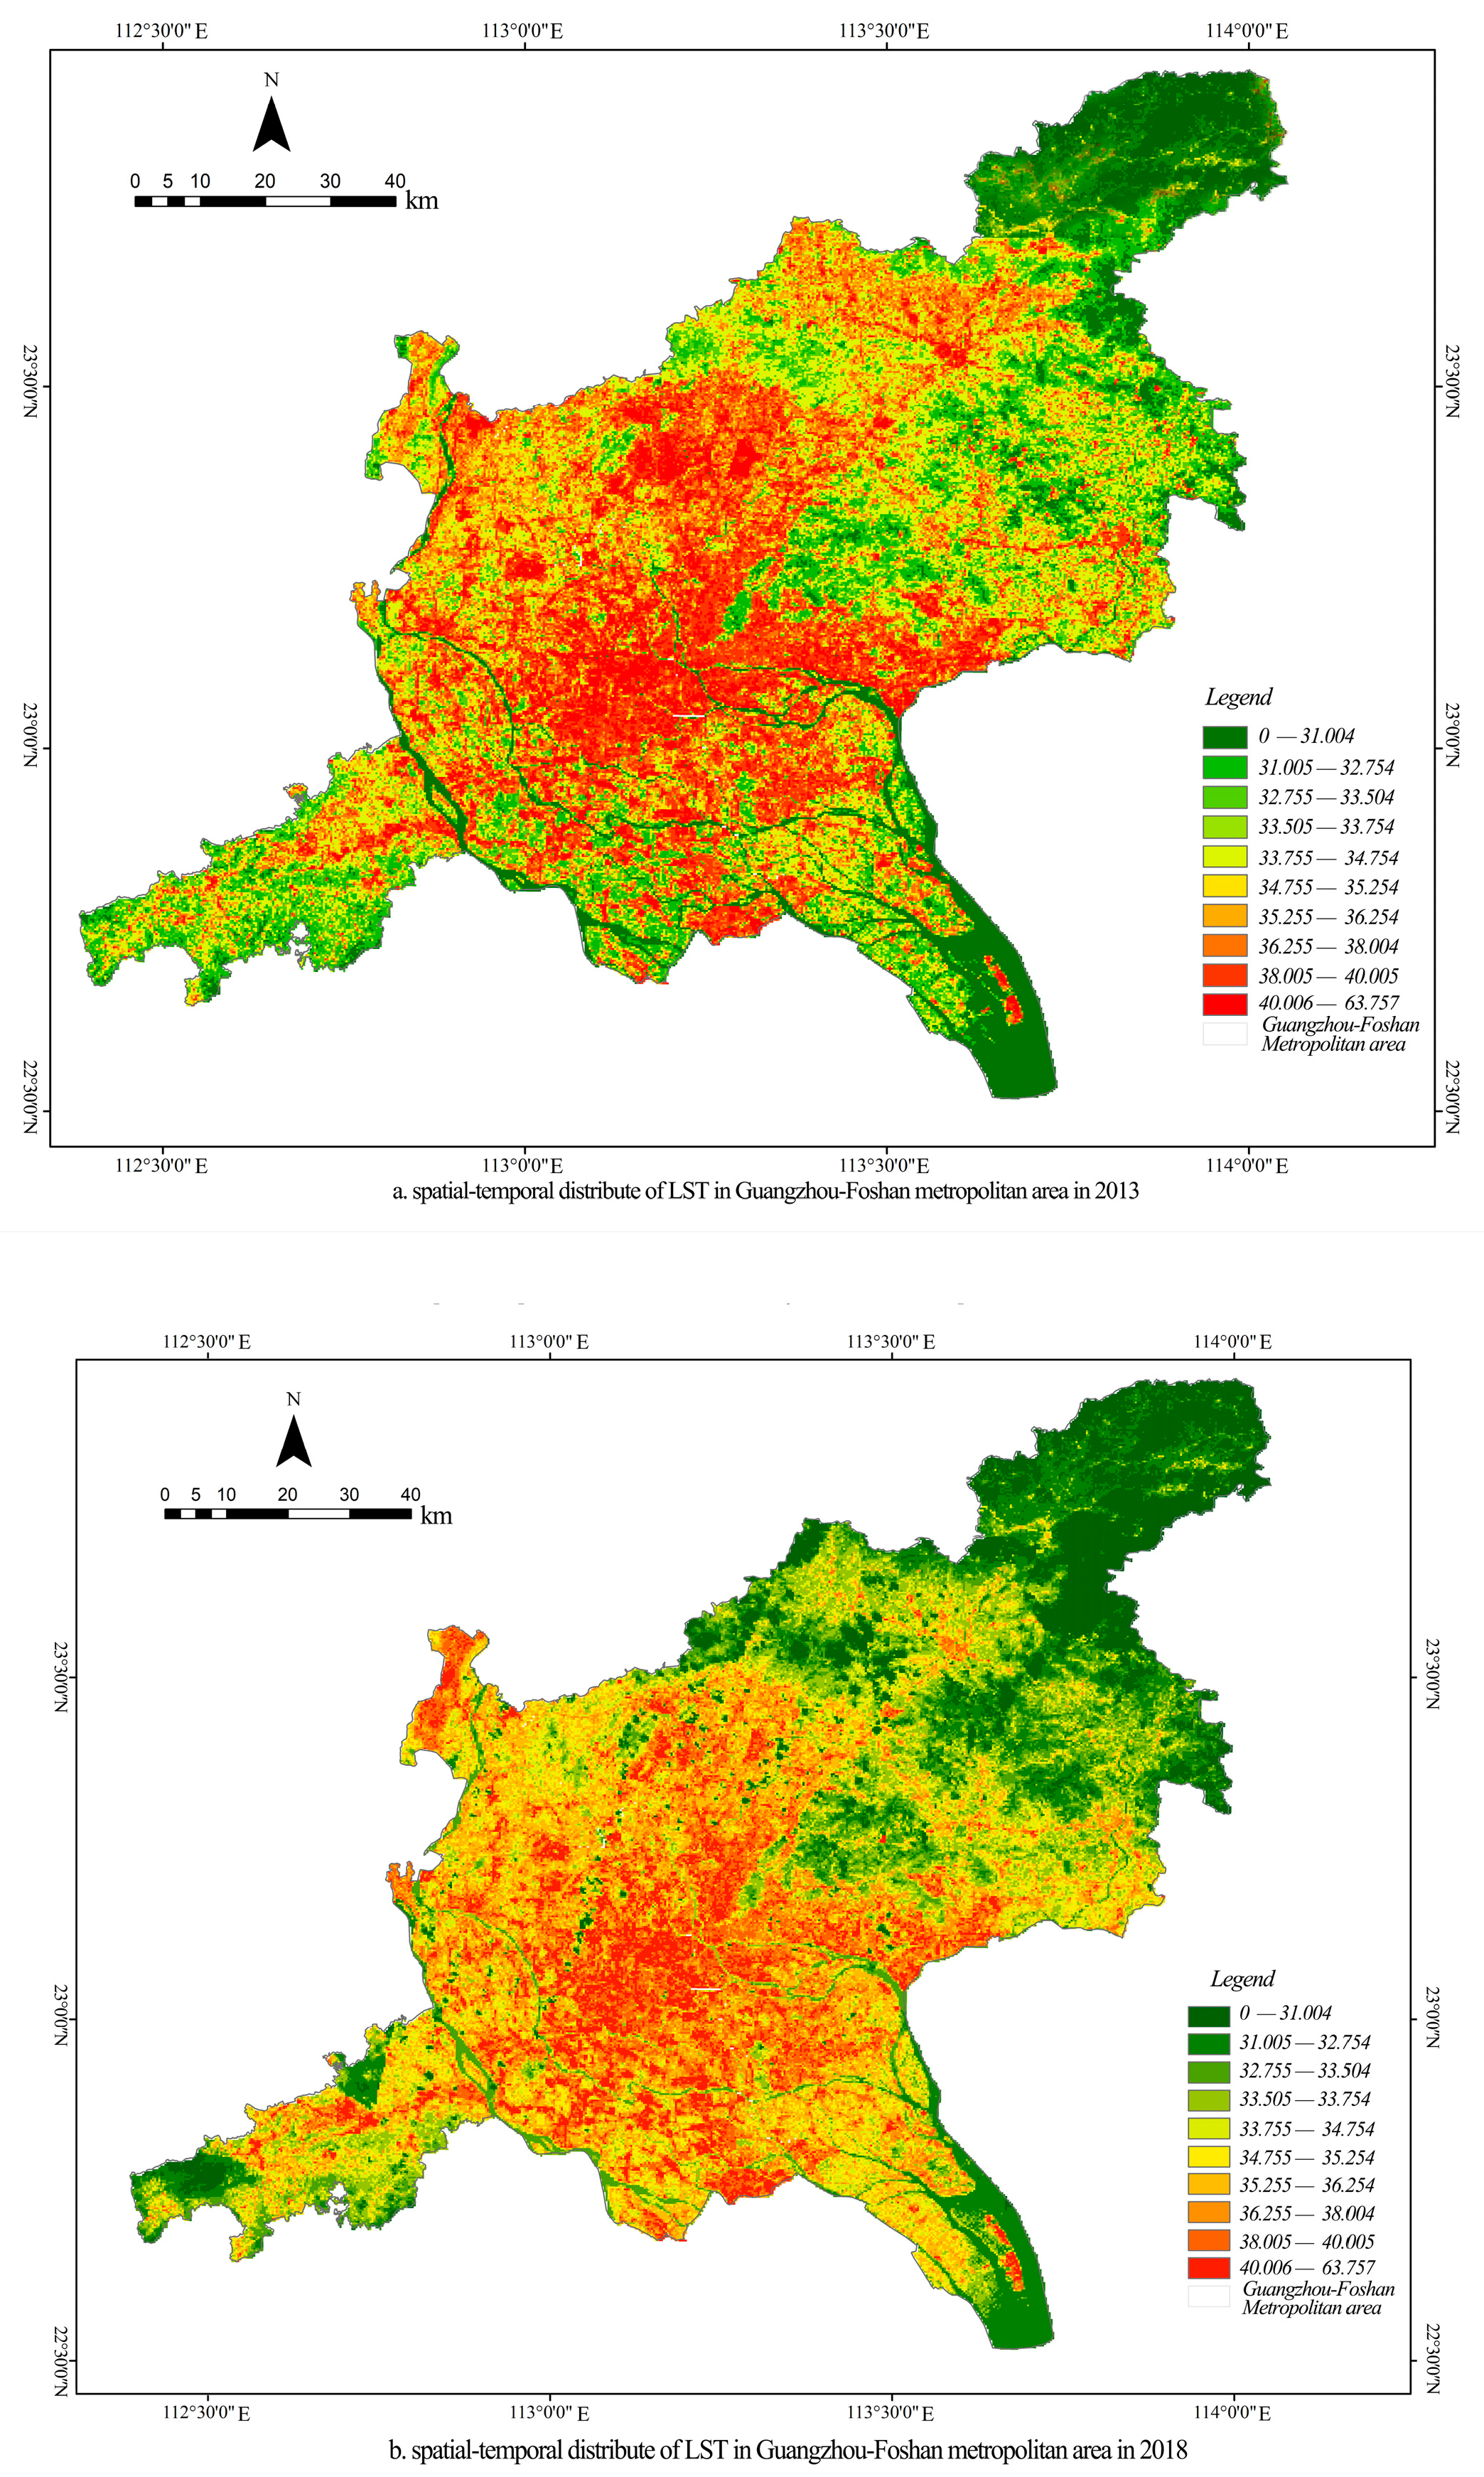
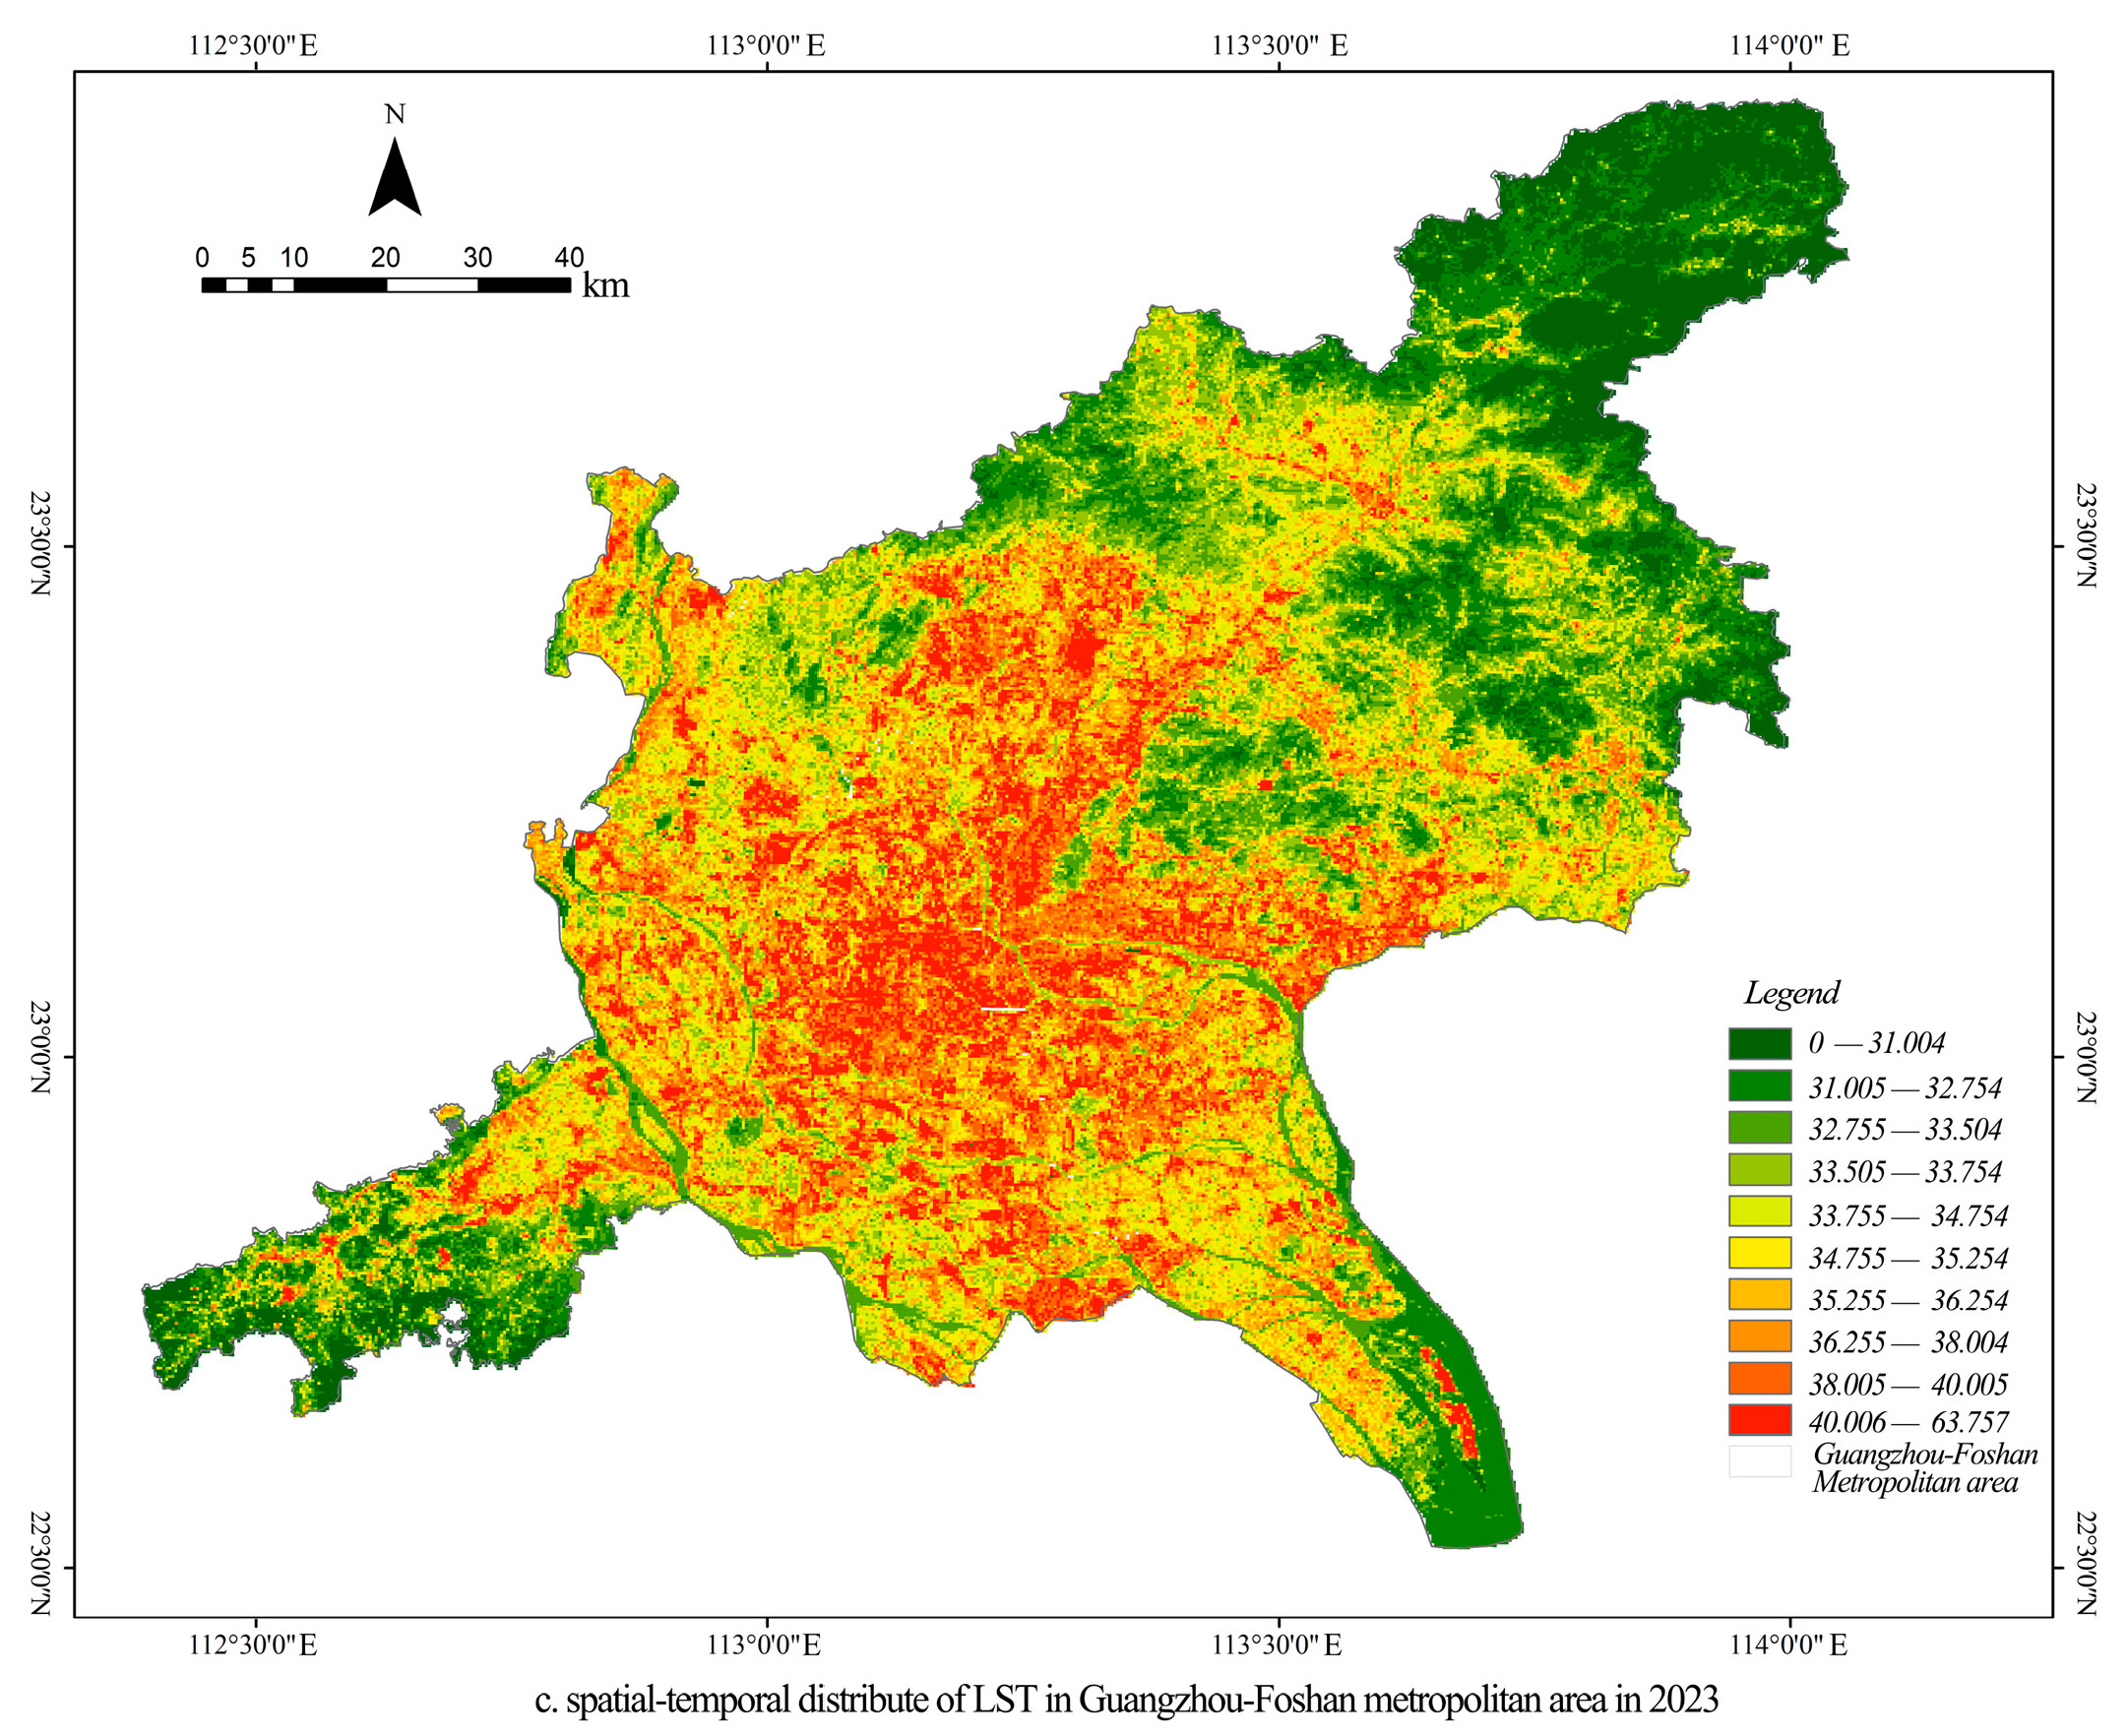
The Guangzhou-Foshan metropolitan area presents a complete core-periphery urban structure, resulting in a significant decrease of LST from the center to the outer edge of the metropolitan area. Figure 5 represents the spatial-temporal distribution of LST in Guangzhou-Foshan metropolitan area in 2013, 2018 and 2023, from which it can be observed that the LST in the central urban areas is significantly higher than the LST in the surrounding suburban areas. The central urban areas mainly consist of compact lowrise (LCZ3), open highrise (LCZ4) and open midrise (LCZ5) urban morphology, represented by Liwan District, Tianhe District, Yuexiu District, and Baiyun District in Guangzhou city, as well as Nanhai District and Chancheng District in Foshan city.
Based on the LST calculation results above, this paper computed SUHII by Formula (7). This study divided SUHII into seven types based on previous researches referred to in the literature review and practical experience: Super strong heat island (VII, 7 K < SUHII), Strong heat island (VI, 5 K < SUHII < 7 K), Normal heat island (V, 3 K < SUHII < 5 K), Weak heat island (IV, 1 K < SUHII < 3 K), No heat island (III, −1 K < SUHII < 1 K), Weak cold island (II, −3 K < SUHII < −1 K), Strong cold island (I, −3 K > SUHII) [26,71]. Figure 6 presents the spatial-temporal distribution of SUHII in Guangzhou-Foshan metropolitan area in 2013, 2018 and 2023, by observing which it can be inferred that the SUHI appears to be the strongest in the core area of the Guangzhou-Foshan metropolitan area, such as Liwan district, Yuexiu district in Guangzhou, and Nanhai district, Chancheng district in Foshan, with a radiate attenuation outwards.
The analysis results above show that the urban central area of Guangzhou-Foshan metropolis experienced severe SUHI effects in the summers of 2013, 2018, and 2023. Despite the fact that, generally speaking, the overall SUHI effects of Guangzhou-Foshan metropolitan area have been alleviated, they are still intensifying in urban core functional areas, especially in high-density high-rise areas (Table 6). In the summer of 2013, the land area with SUHI effect was 5232.58 km2, accounting for 45.94% of the total land area. Among different types of land area with SUHI effects, Type VII (Super strong heat island) had an area of 391.49 km2, accounting for the largest proportion of 3.44%. Furthermore, in the summer of 2018, the area with SUHI effect was 4088.73 km2, accounting for 35.90% of the total area, while Type VII (Super strong heat island) took up 399.46 km2, accounting for a proportion of 3.51%. Whereas in the summer of 2023, the area with SUHI effects was 3901.32 km2, accounting for 34.25%, with Type VII covering an area of 412.38 km2, accounting for the proportion of 3.62%.
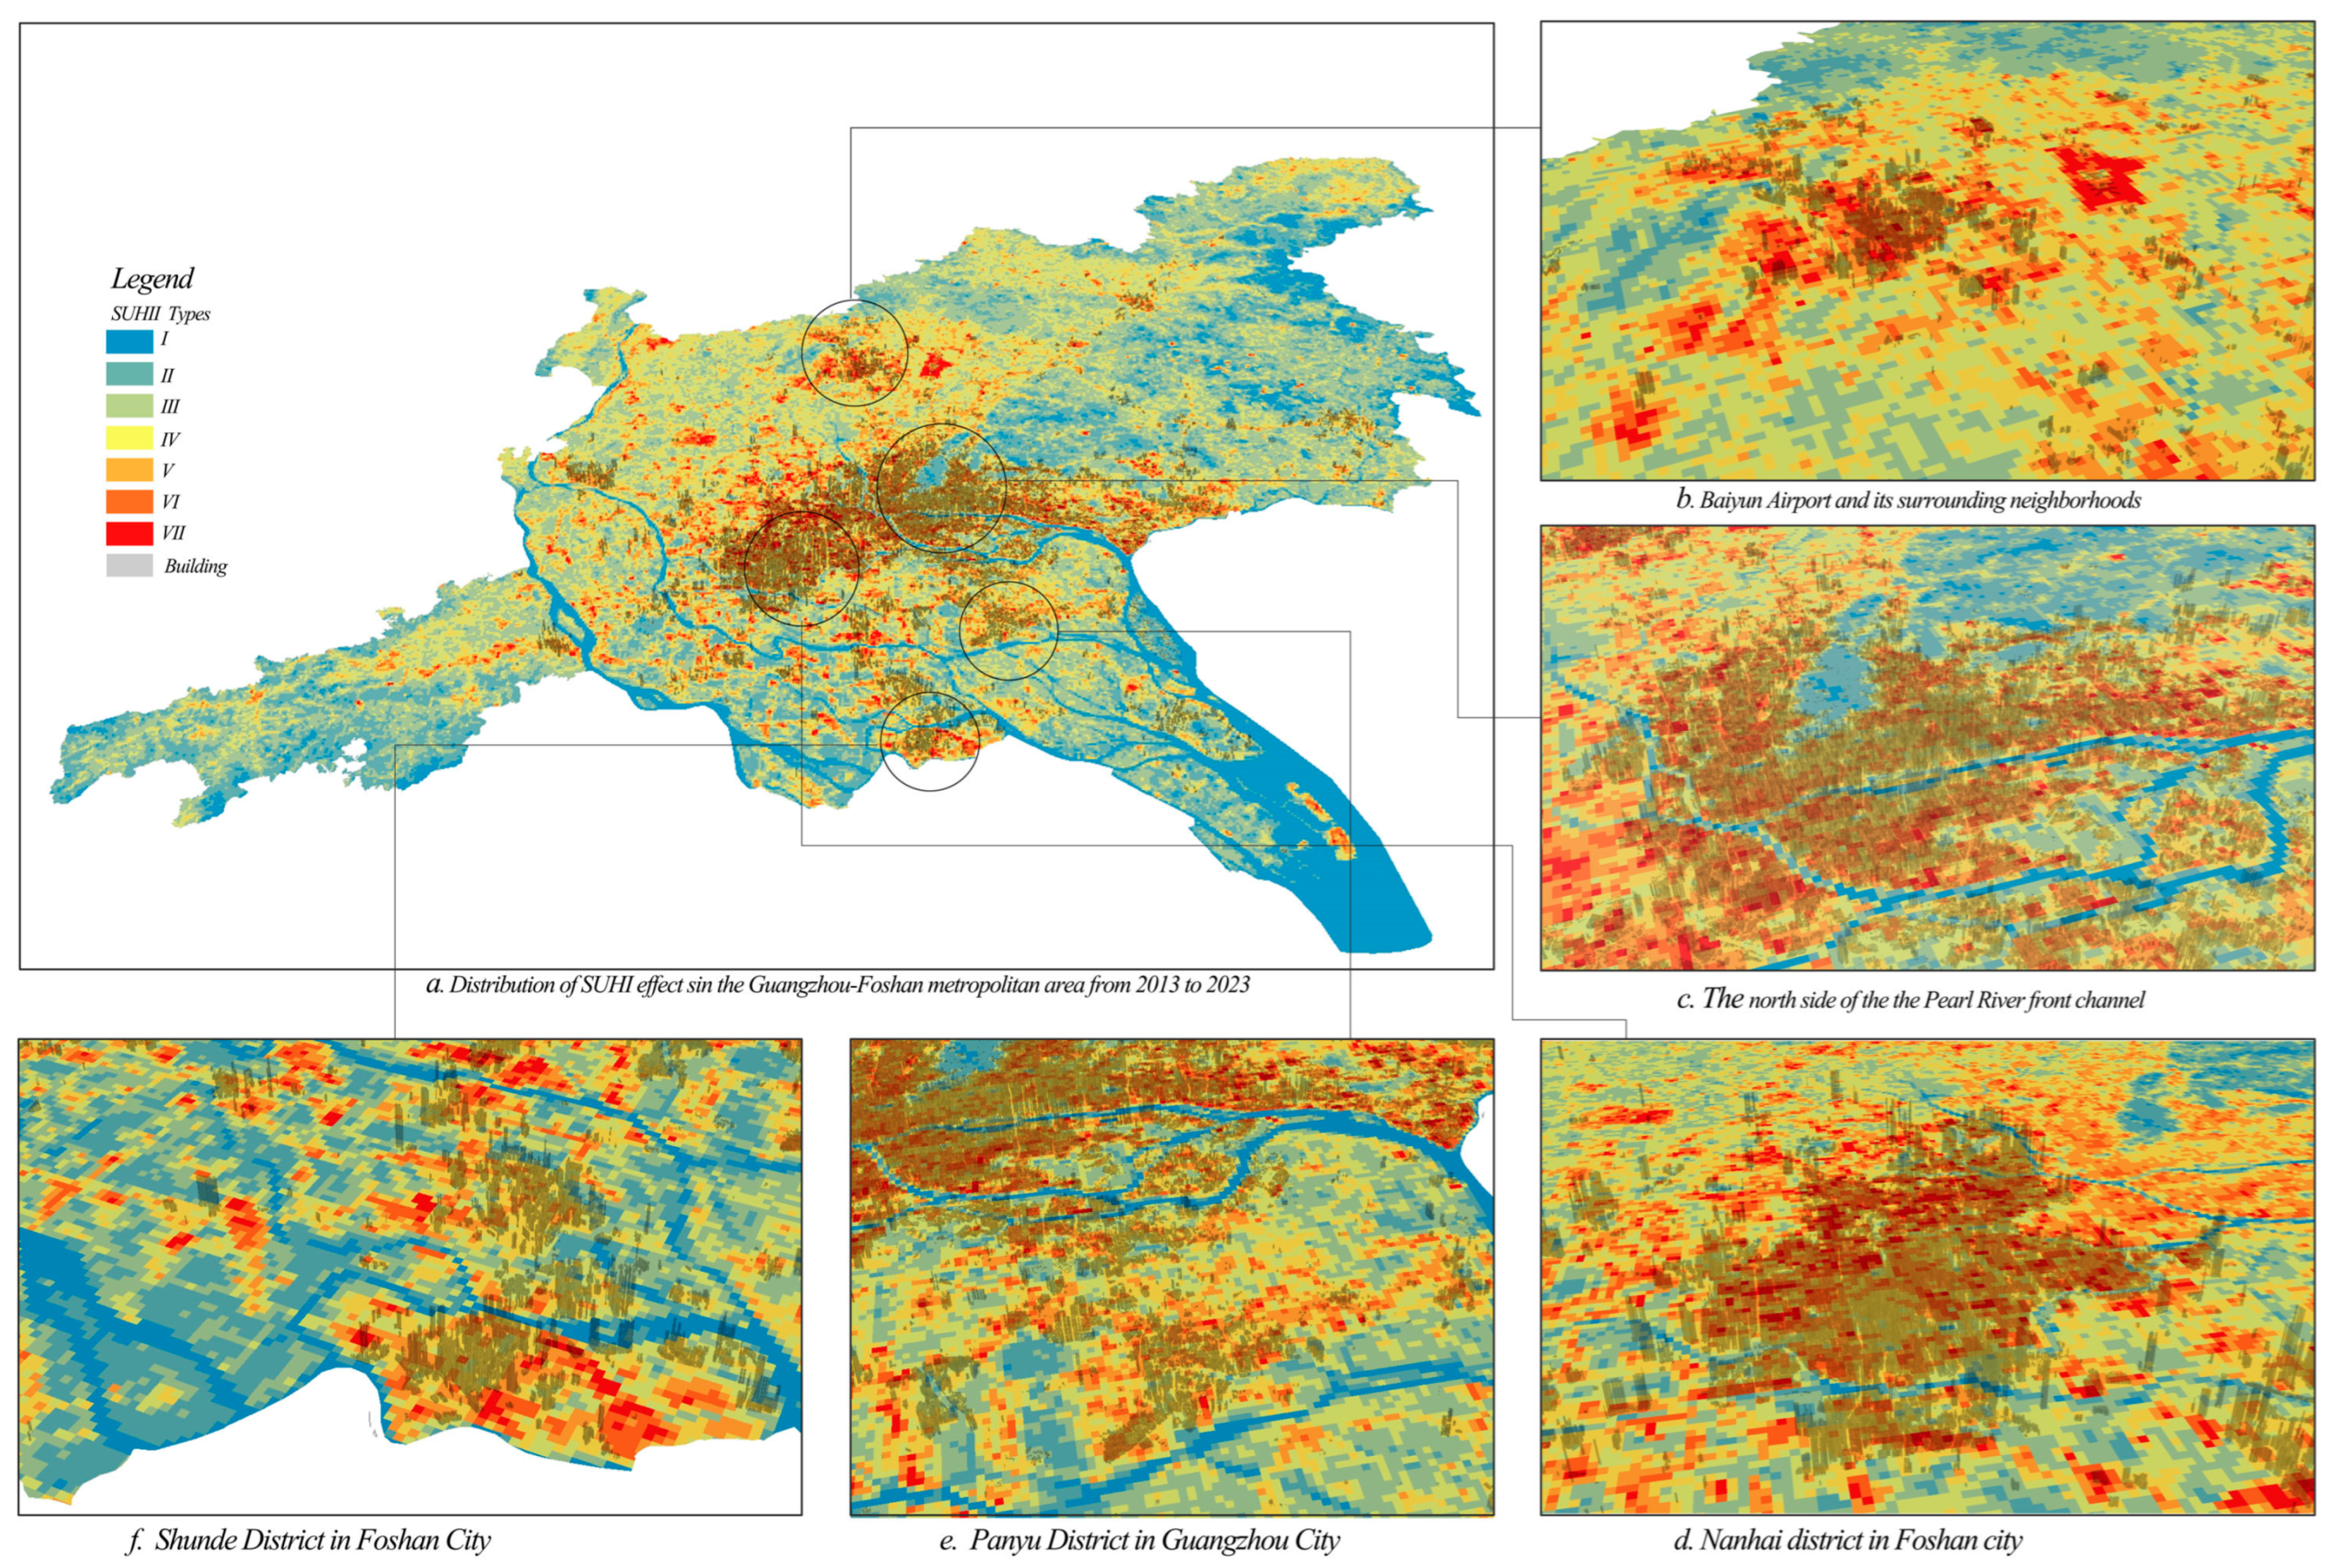
Figure 7a shows the distribution of blocks with extreme SUHI effects in the Guangzhou-Foshan metropolitan area from 2013 to 2023, and Figure 7b–f zoom in to display key blocks.
Figure 7b illustrates the SUHI effects of the important transportation hubs and their surrounding neighborhoods. As shown in the figure, there are two types of spaces that are more likely to be the object of SUHI effects: one type of space features blocks with a large area of hard paving, which is similar to the environment of Baiyun Airport; the other type of space is the urban central areas or urban functional areas featured by a large number of high-rise and compact buildings with diverse urban residential, commercial and recreational facilities.
As shown in Figure 7c, the SUHII value in the blocks around Yongqingfang, Beijing Road and the Pearl River New Town on the north side of the Pearl River front channel is relatively high. These blocks are mainly the central commercial and residential areas of Guangzhou city, characterized by dense road networks, large neighborhoods with high density, and numerous high-rise buildings. On the contrary, Figure 7d presents the blocks of high SUHI effects in Nanhai district in Foshan city, mainly consisting of large urban villages mixed with industrial zones.
As shown in Figure 7e, the high SUHI effect areas in Panyu District, Guangzhou City present scattered distribution. Similar to the urban morphology of Figure 7d, these areas are also composed of scattered villages mixed with a large area of industrial factory buildings.
Figure 7f shows the urban morphology of the Shunde District Government in Foshan City, with high-density residential and commercial areas covering the land, resulting in high SUHI effects.

3.3. Analysis of SUHI Influential Factors

3.3.1. The Relationship between Local Climate Zones and SUHI Effects

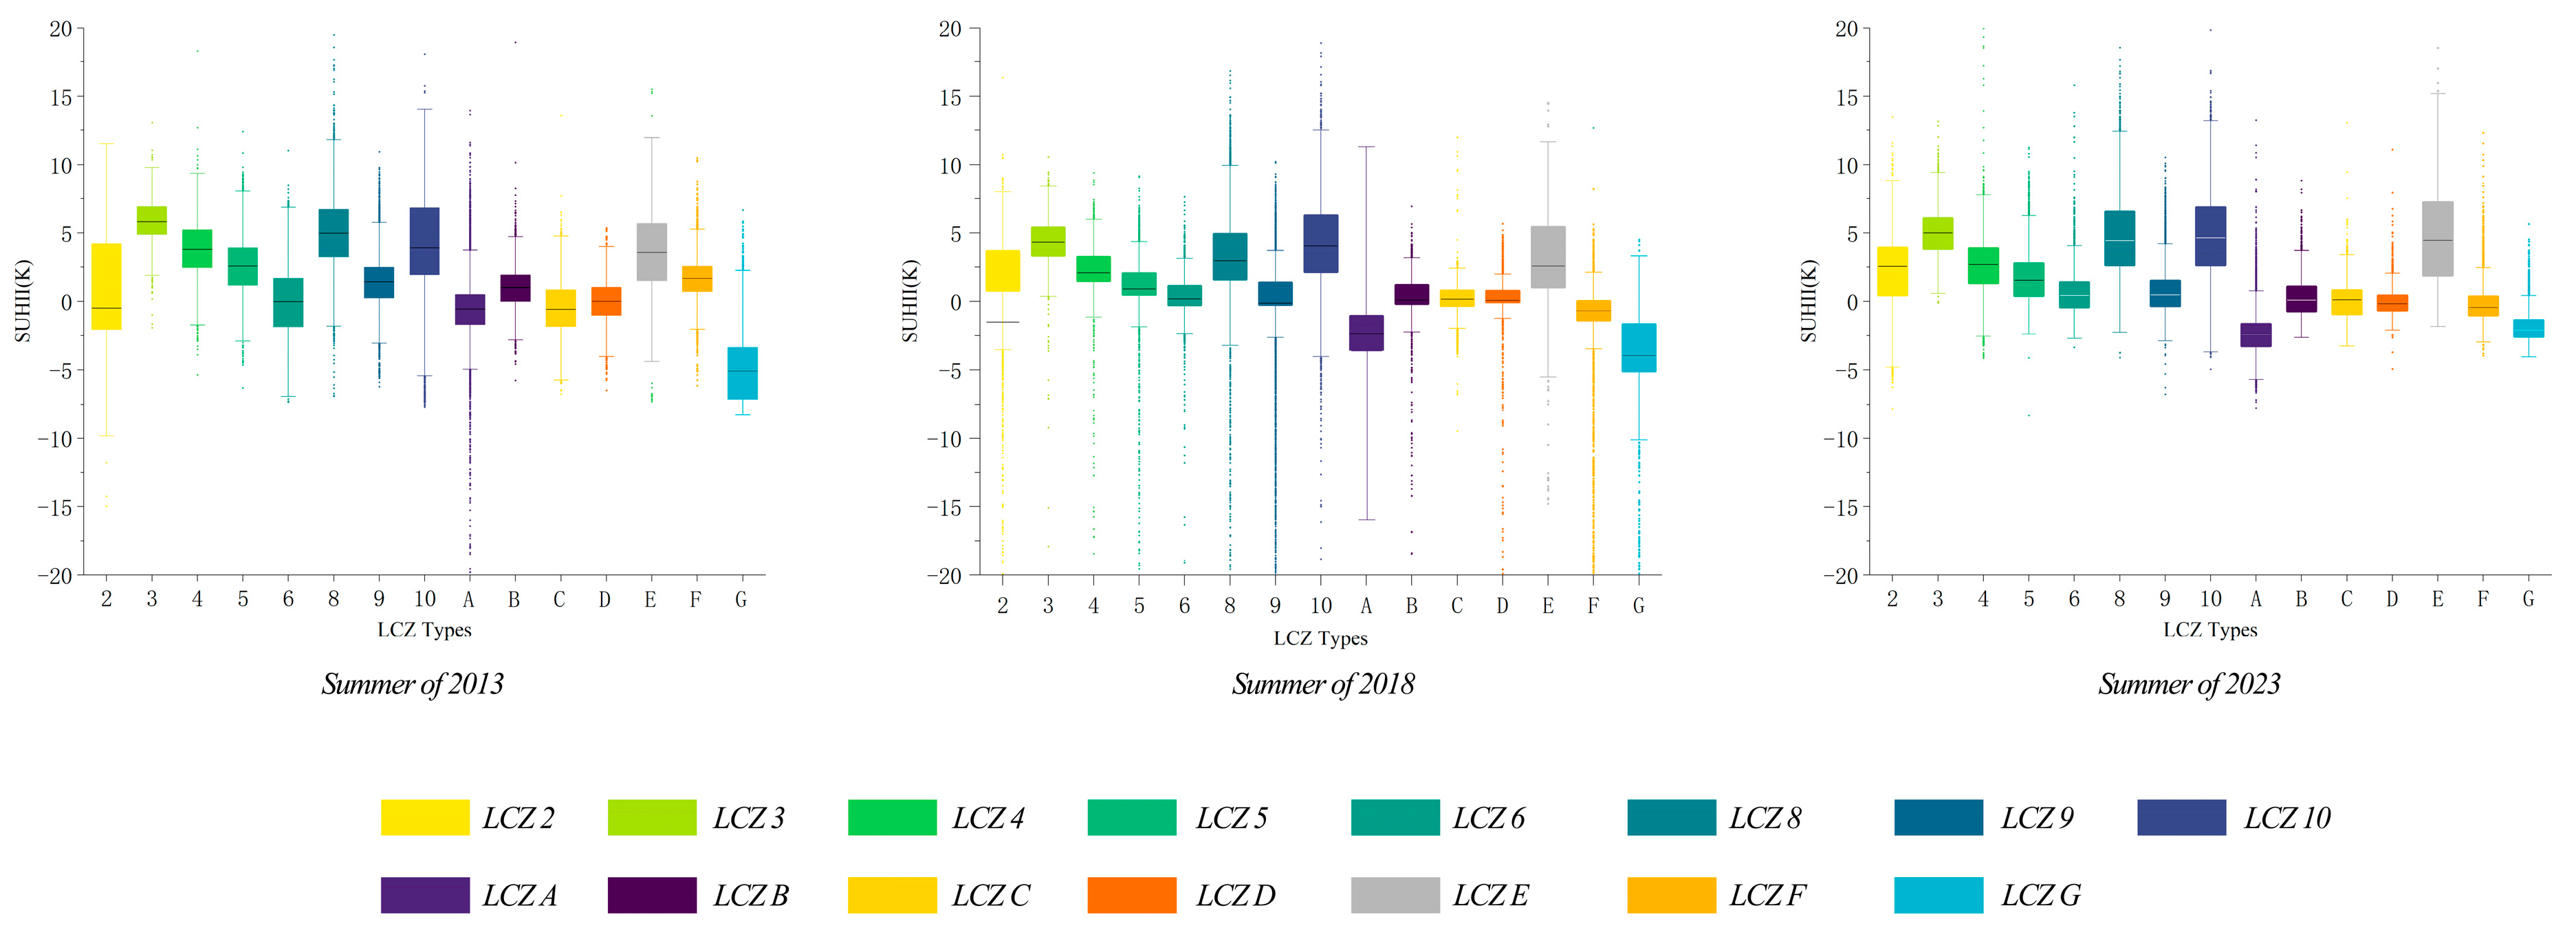
As shown in Figure 8, the SUHI effects of built types LCZs are significantly higher than those of the land cover types. Among the built types, LCZ 8 (large lowrise) and LCZ10 (heavy industry), characterized by large areas of impervious surfaces, substantial building volumes, and a lack of green coverage, have the most significant SUHI effects. These areas are also known for their vast blocks (typically over 300 m × 300 m) and wide roadways. Moreover, the SUHI effect of LCZ3 (compact lowrise) and LCZ4 (open highrise) is also significant in the built type. The main urban morphology of LCZ3 in the Guangzhou-Foshan metropolitan area is urban villages, while LCZ4 is mainly high-density, high-plot ratio residential areas with typical building heights of 12 floors or more, experiencing its fastest development between 2005 and 2015.
Among land cover types, the SUHI effect is more pronounced in LCZ E (bare rock or paved) and LCZ F (bare soil or sand). In the Guangzhou-Foshan metropolitan area, LCZ E is mainly composed of important transportation hubs, such as Guangzhou Baiyun Airport, Guangzhou South Station, Foshan Station, Foshan West Station, etc. The characteristic of this land cover type is that there are large areas of hard paving and large open squares with less green coverage. In contrast, the composition of LCZ F is much more complex. Through careful comparison, it is found that LCZ F includes pond fish farms, exposed farmland, and reorganized but not yet developed land.
From the comparison of the data collected in the summers of 2013, 2018, and 2023, it can be observed that the SUHI effects of LCZ2 (compact midrise) have been intensifying year by year, while the SUHI of LCZ3, LCZ4, and LCZ5 remained high. Such phenomenon indicates that the implementation of a series of greening-related policies such as park and community green space construction did not make significant impact on the alleviation of SUHI effects.

3.3.2. GWR Analysis of SUHI Effect Influential Factors

This study conducted a global regression analysis using GWR on the factors that may impact SUHI effects in 2013, 2018, and 2023. In the analysis results of GWR, the q-value, ranging from −1 to 1, represents the correlation between the factor under analysis and SUHI effects. The higher the absolute value, the greater the impact of the influencing factor on the SUHI effect. The p-value represents the significance of the influencing factors, with smaller values indicating a more significant impact. When the p-value is less than 0.05, the factor under analysis can be considered a significant influencing factor.
As shown in Figure 9, the q-values of NDVI and NDWI ranged from −0.66 to −0.1, indicating a significant negative impact on the SUHI effects of almost all types of LCZ, especially on LCZ2, LCZ4, LCZ5, and LCZ8. On the contrary, the q-value of NDBI ranging from 0.1 to 0.84 indicated a significant positive influence on the SUHI effects of diverse LCZ, particularly on LCZ3 and LCZ10.
Furthermore, factors such as RD, POI, and POP also had a significant positive impact on SUHI effects. To be more specific, RD had a significant positive impact on the SUHI effects of LCZ2, LCZ3, and LCZ4 in 2013, with q-values being 0.15, 0.19, and 0.14, respectively; in 2018, with q-values of 0.15 and 0.12, RD demonstrated a significant positive impact on LCZ2 and LCZ6; in 2023, the significant positive impact was on LCZ2, 3, 4, 5, 6, 8, and 10, with q-values ranging from 0.13 to 0.34. As for POI, it also had a positive impact on almost all types of LCZ in 2013, 2018, and 2023, with q-values ranging from 0.027 to 0.23. The impact of POP is similar to that of the two aforementioned factors, with a q-value range from −0.021 to 0.12.
Finally, factors such as GDP, NPP, NL, and DEM also impacted the SUHI effects of different types of LCZ in some periods, but in a comparatively less significant way, with their q-values generally distributed between −0.001 and 0.07.

3.3.3. MGWR Analysis of SUHI Effect Influential Factors

On the basis of the GWR analysis in the previous section, further analysis was conducted on the LCZ of built types, utilizing the MGWR model to analyze the impact of different influencing factors on SUHI effects at different geographical locations in the Guangzhou-Foshan metropolitan area.
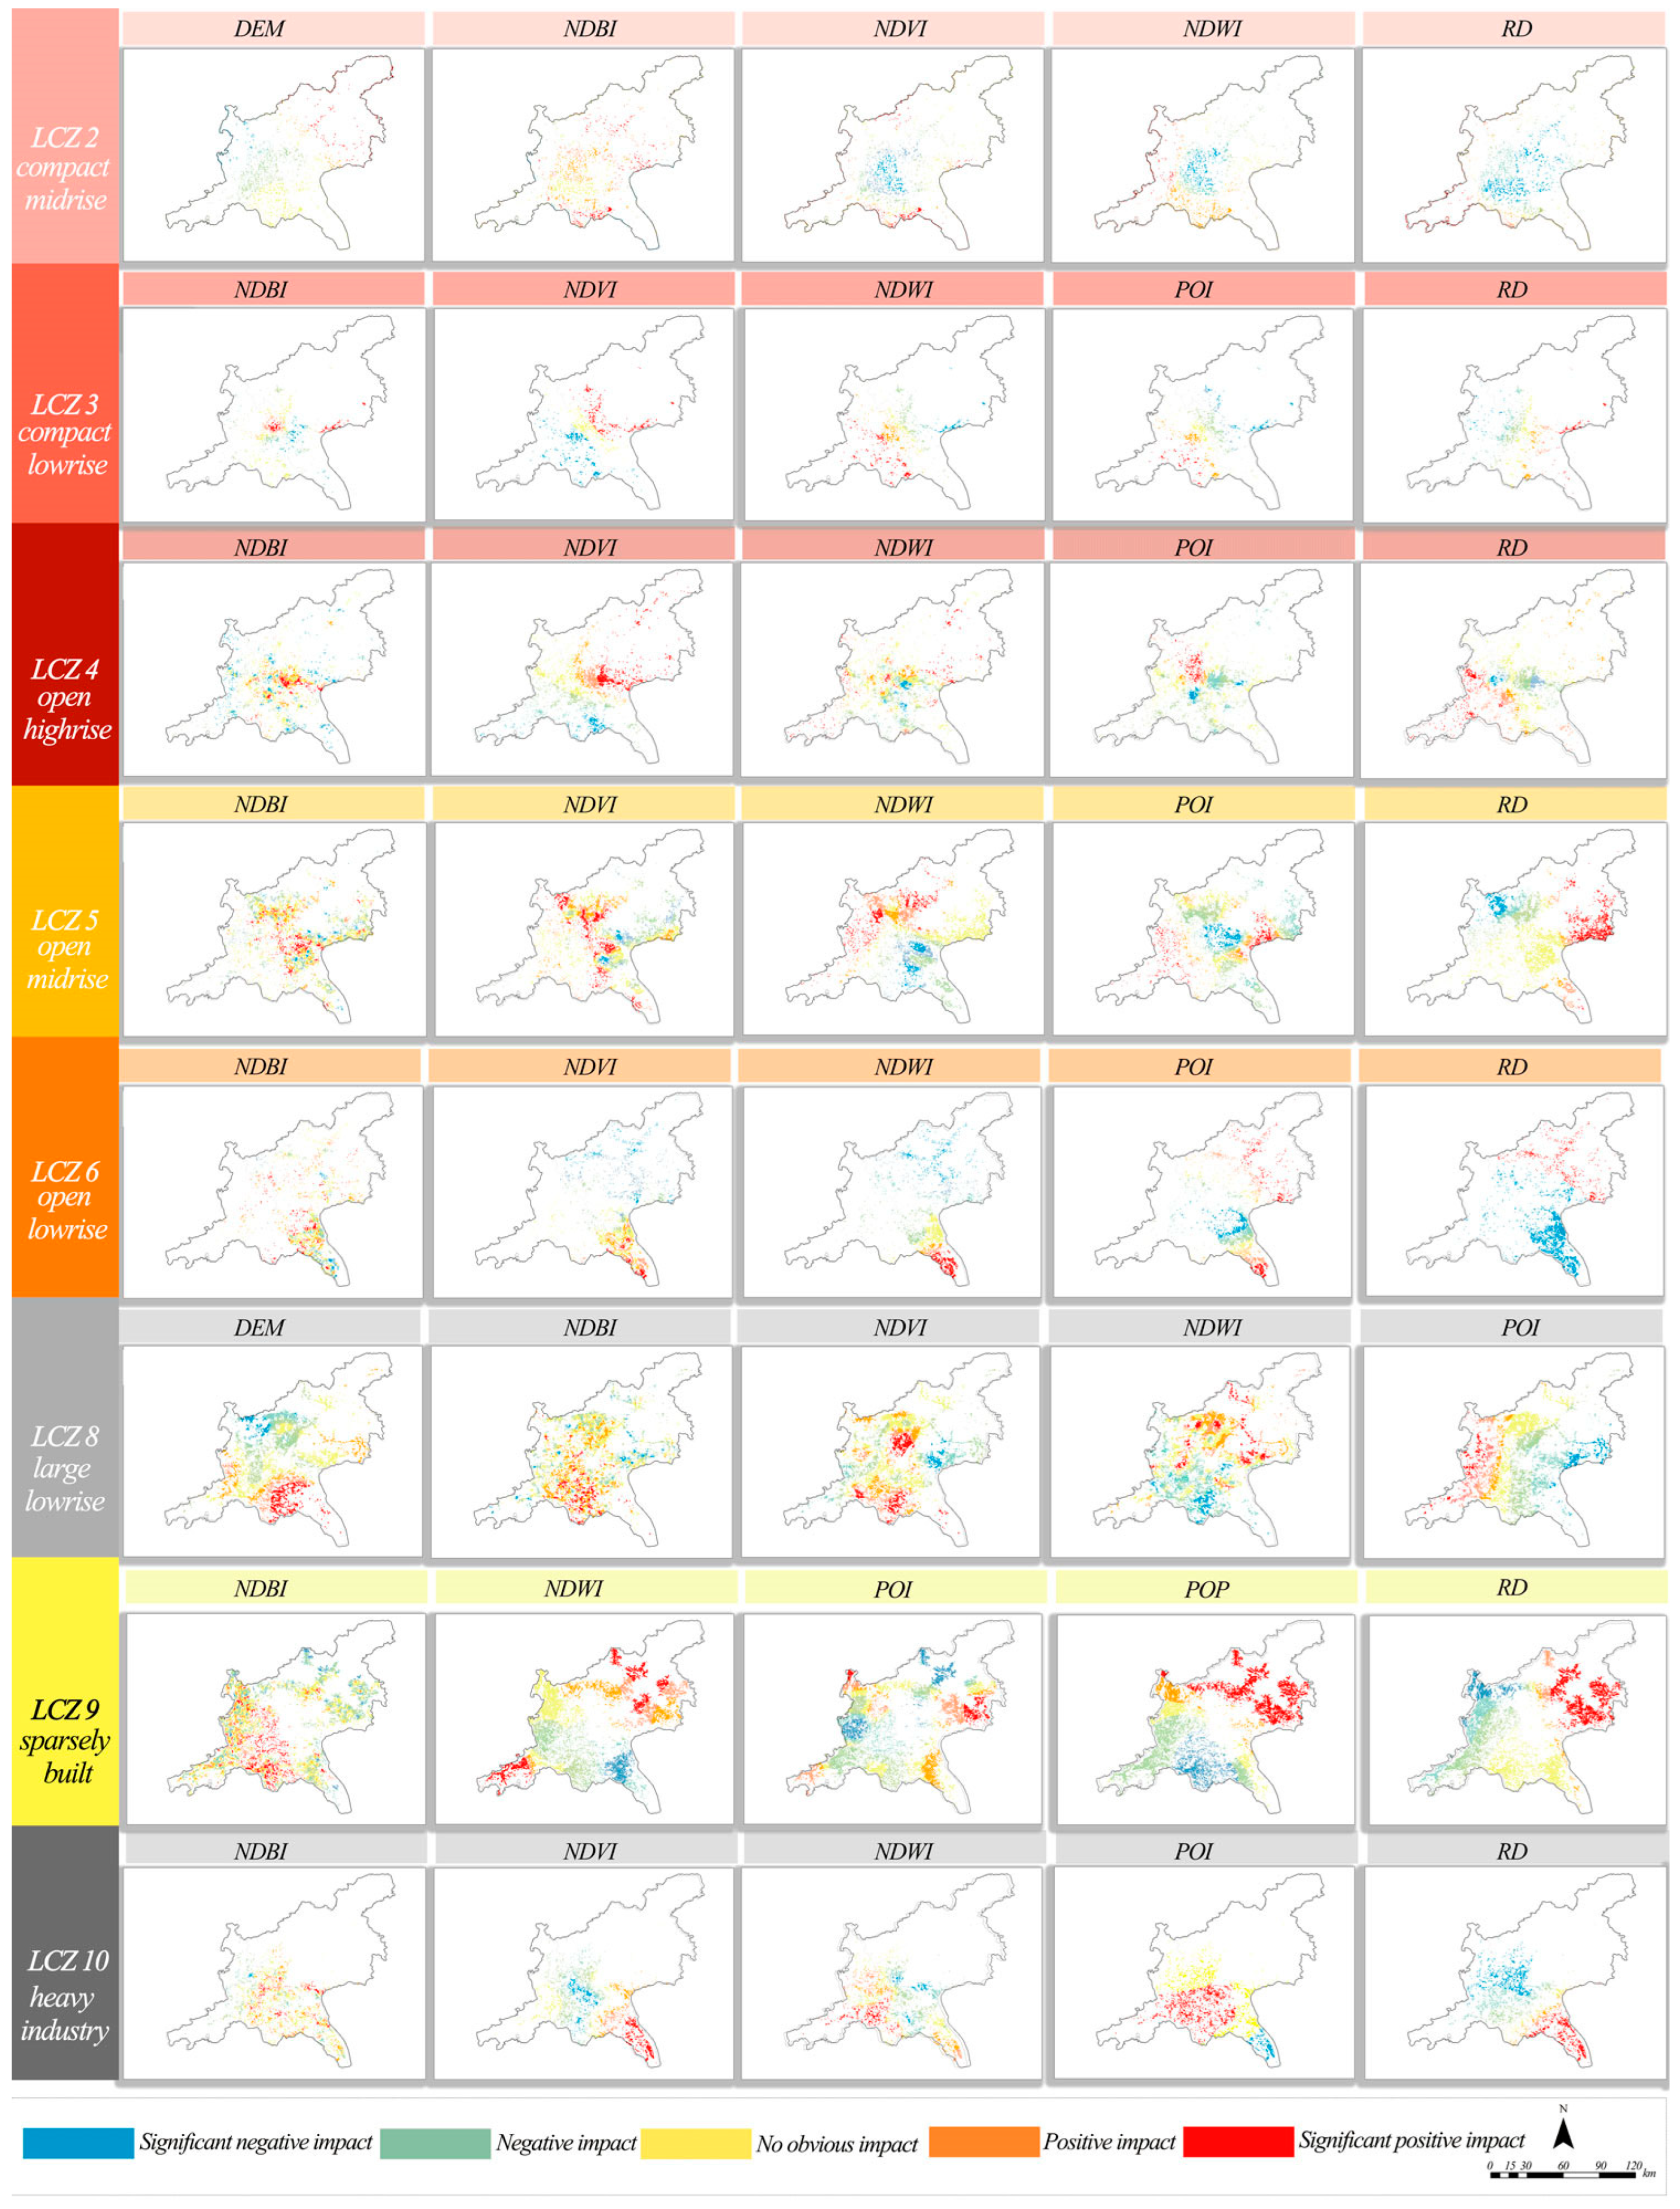
First of all, as shown in Figure 10, in 2013, the factors having the greatest impact on the SUHI effects in built type of LCZ were land cover factors (NDVI, NDBI, NDWI), among which NDVI and NDWI showed significant negative effects, while NDBI showed significant positive effects. The significance of the negative effect of NDVI and NDWI diverges from area to area, with a trend of greater negative impact in the core area and less negative impact in the peripheral area for LCZ 2, and a decreasing negative impact from east to west for LCZ 3. For LCZ 4 and LCZ 5, higher impact was exhibited in the northern part, with lower impact in the southern part of the metropolis. For LCZ 6–10, the impact demonstrated an outward decrease, with the significance of the impact lessening from the center of the urban block cluster to the peripheral area. As for NDBI, among the various built types of LCZs, the urban core such as the central business district had a high impact on the SUHI effects, while low impact was exhibited in the peripheral area. Moreover, urban environmental and socioeconomic factors such as POI and POP generally had a positive impact on the SUHI effects, with the overall trend showing higher impact in the urban core area and lower impact in the suburban or periphery area. Additionally, the RD factor belonging to urban environmental factors exhibited significant spatial heterogeneity, with an overall positive impact on the SUHI effects. Specifically speaking, it showed a significantly negative impact in the city center and a significantly positive impact in the outskirts or suburban areas.
Secondly, Figure 11 displays the results from the analysis of the impact factors of SUHI effects on different built types LCZs in 2018, using the MGWR model as the approach. Compared to the situation in 2013, land cover factors (NDVI, NDBI, NDWI) still had a significant impact on the SUHI effects of all built types LCZs. The main positive influencing factors included NDBI and POI, while the main negative influencing factors turned out to be NDVI, NDWI, and NPP. Different from the factors above, DEM exhibited different impact types in different locations, with a significant negative influence in the city center, but a significant positive effect in the suburban mountainous areas, especially in the northern part of the Guangzhou-Foshan metropolitan area. Similar to DEM, RD also exhibited significant spatial heterogeneity, with a negative influence in the city center and a positive influence in the port area in the southern part of the Guangzhou-Foshan metropolitan area.
To be more specific, the negative impact of NDVI and NDWI is more significant in the city center in LCZ 3–5. Nevertheless, such negative impact was not that significant in the city center of LCZ 2, 6, 7, 8, and 10, some of which were even the object of positive impact. Moreover, the impact of NDBI on LCZ5, 6, 8, and 9 is not as significant as its impact on other areas, while the impact of POI on the SUHI effects of LCZ 3, 5, 6, 9, and 10 is more significant than that of other areas, showing an influential situation where the south had greater impact than the north did and the west with greater impact than the east. As for the RD factor, it had a significant impact on the SUHI effects of built types LCZs, generally showing a negative impact in the central areas of the metropolis and a positive impact in the peripheral areas, with the port area in the southern part of the Guangzhou-Foshan metropolis circles having the most significant positive impact.
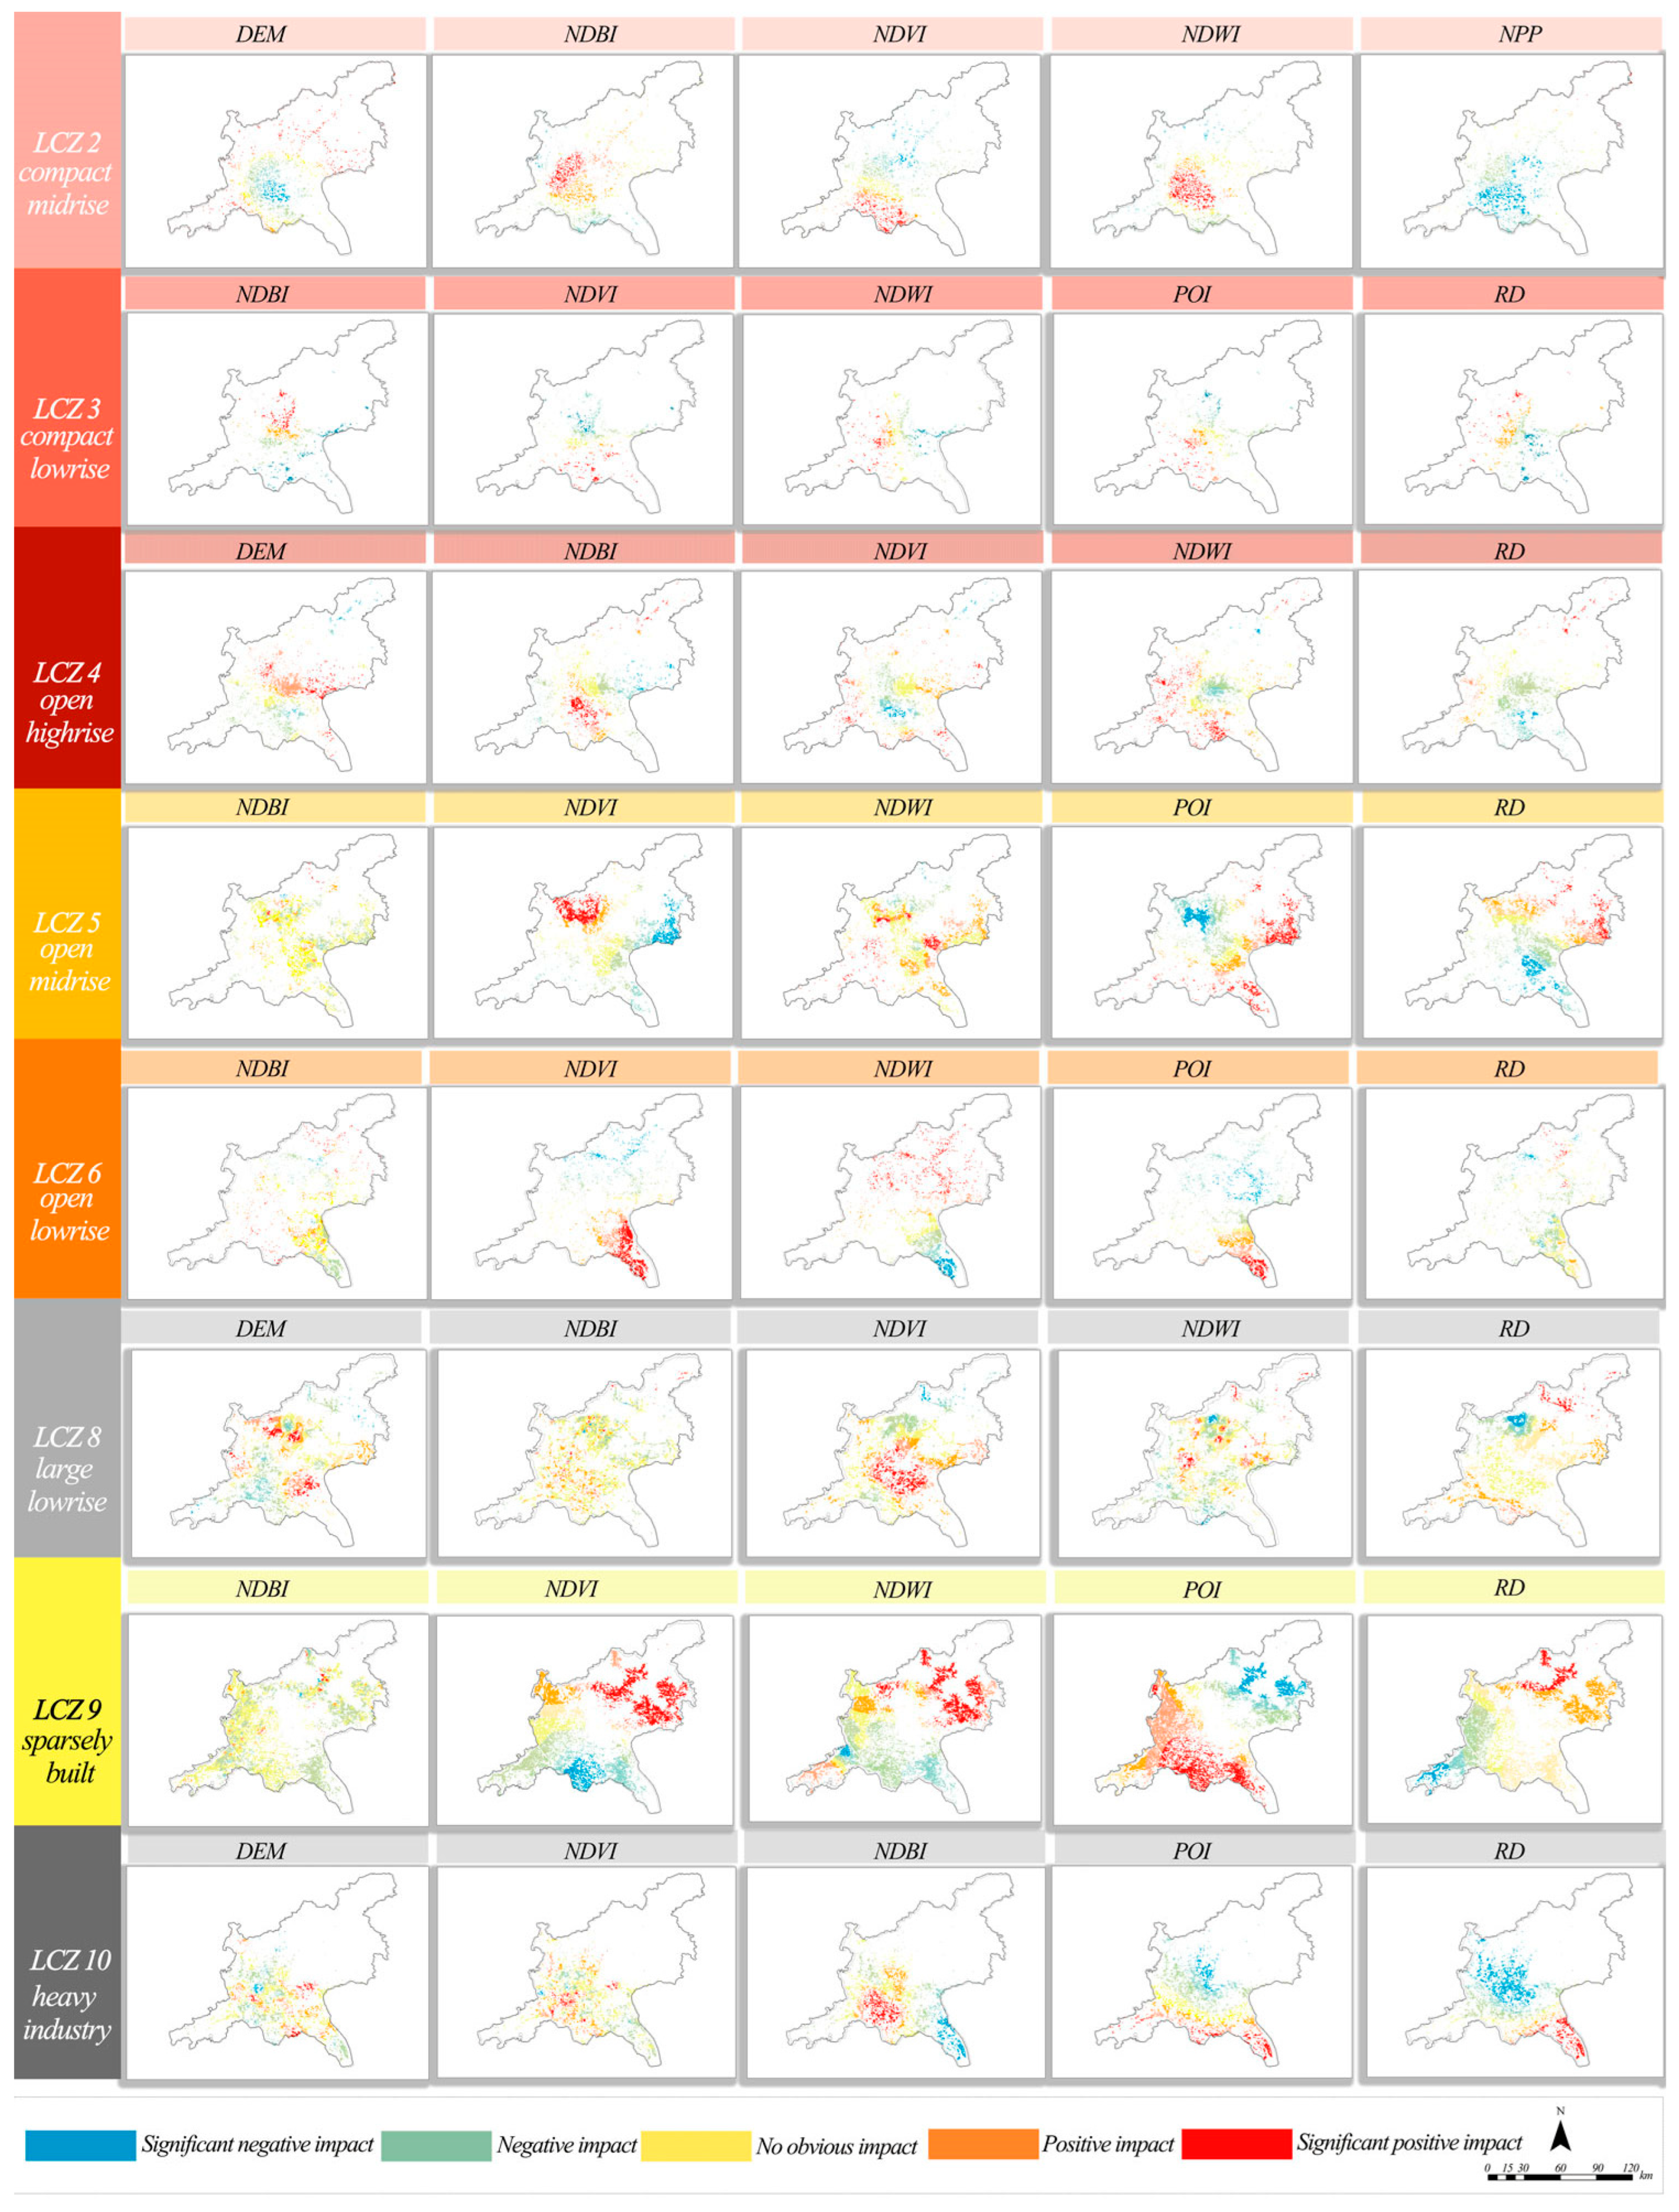
Finally, Figure 12 illustrates the results from the analysis of the driving mechanism of SUHI effects in 2023 through the application of the MGWR model. Compared with the analysis of 2013 and 2018 stated above, this analysis had the following similarities: (1) NDVI and NDWI had negative impacts on the SUHI effects of most LCZs; (2) NDVI and POI had significant positive impacts on the SUHI effects. The difference lies in: (1) the ability of NDVI and NDWI to alleviate SUHI effects is further weakened, especially for LCZ 2 and LCZ 3. NDVI and NDWI did not effectively slow down SUHI effects. (2) The positive impact of POI on SUHI effects is greater than NDBI, especially in the central urban area of the Guangzhou-Foshan metropolis, to be more specific, LCZ 4, LCZ 5, and LCZ 8. (3) The negative effect of RD on SUHI effects is more significant in the central urban area, especially for LCZ 2, 3, 4, and 5.
To summarize, there were three findings through the analysis of the driving mechanisms of SUHI effects in 2013, 2018, and 2023: firstly, with time going by, the types of factors that affect the SUHI effects gradually increase and show a diversified trend; secondly, the spatial heterogeneity of land cover factors (NDVI, NDWI, NDBI) is significant, showing different impact effects at different locations in the Guangzhou-Foshan metropolis; thirdly, the explanatory power of the influencing factors reflects that the power of land cover factors was greater than that of urban environmental factors, which is also greater than that of social economic factors.

3.3.4. GD Analysis of SUHI Effects Influential Factors

The above analysis by GWR and MGWR has explored the impact of different influencing factors on the SUHI effects of different types of LCZ. The further exploration of the impact mechanism of SUHI effects was conducted using the GD model to explore the impact of different influencing factors and the impact of their interactions on the SUHI effects of different types of LCZ in 2013, 2018, and 2023 [37,72,73]. The result values (q-values) of the GD model are distributed between 0 and 1. The closer the q-value is to 1, the greater the impact on SUHI effects is. Unlike GWR and MGWR models described in the previous section, the GD model bears the disadvantage that it is not possible to determine whether the influencing factor has a positive or negative impact on SUHI effects, for there are no positive or negative q values in the GD model.
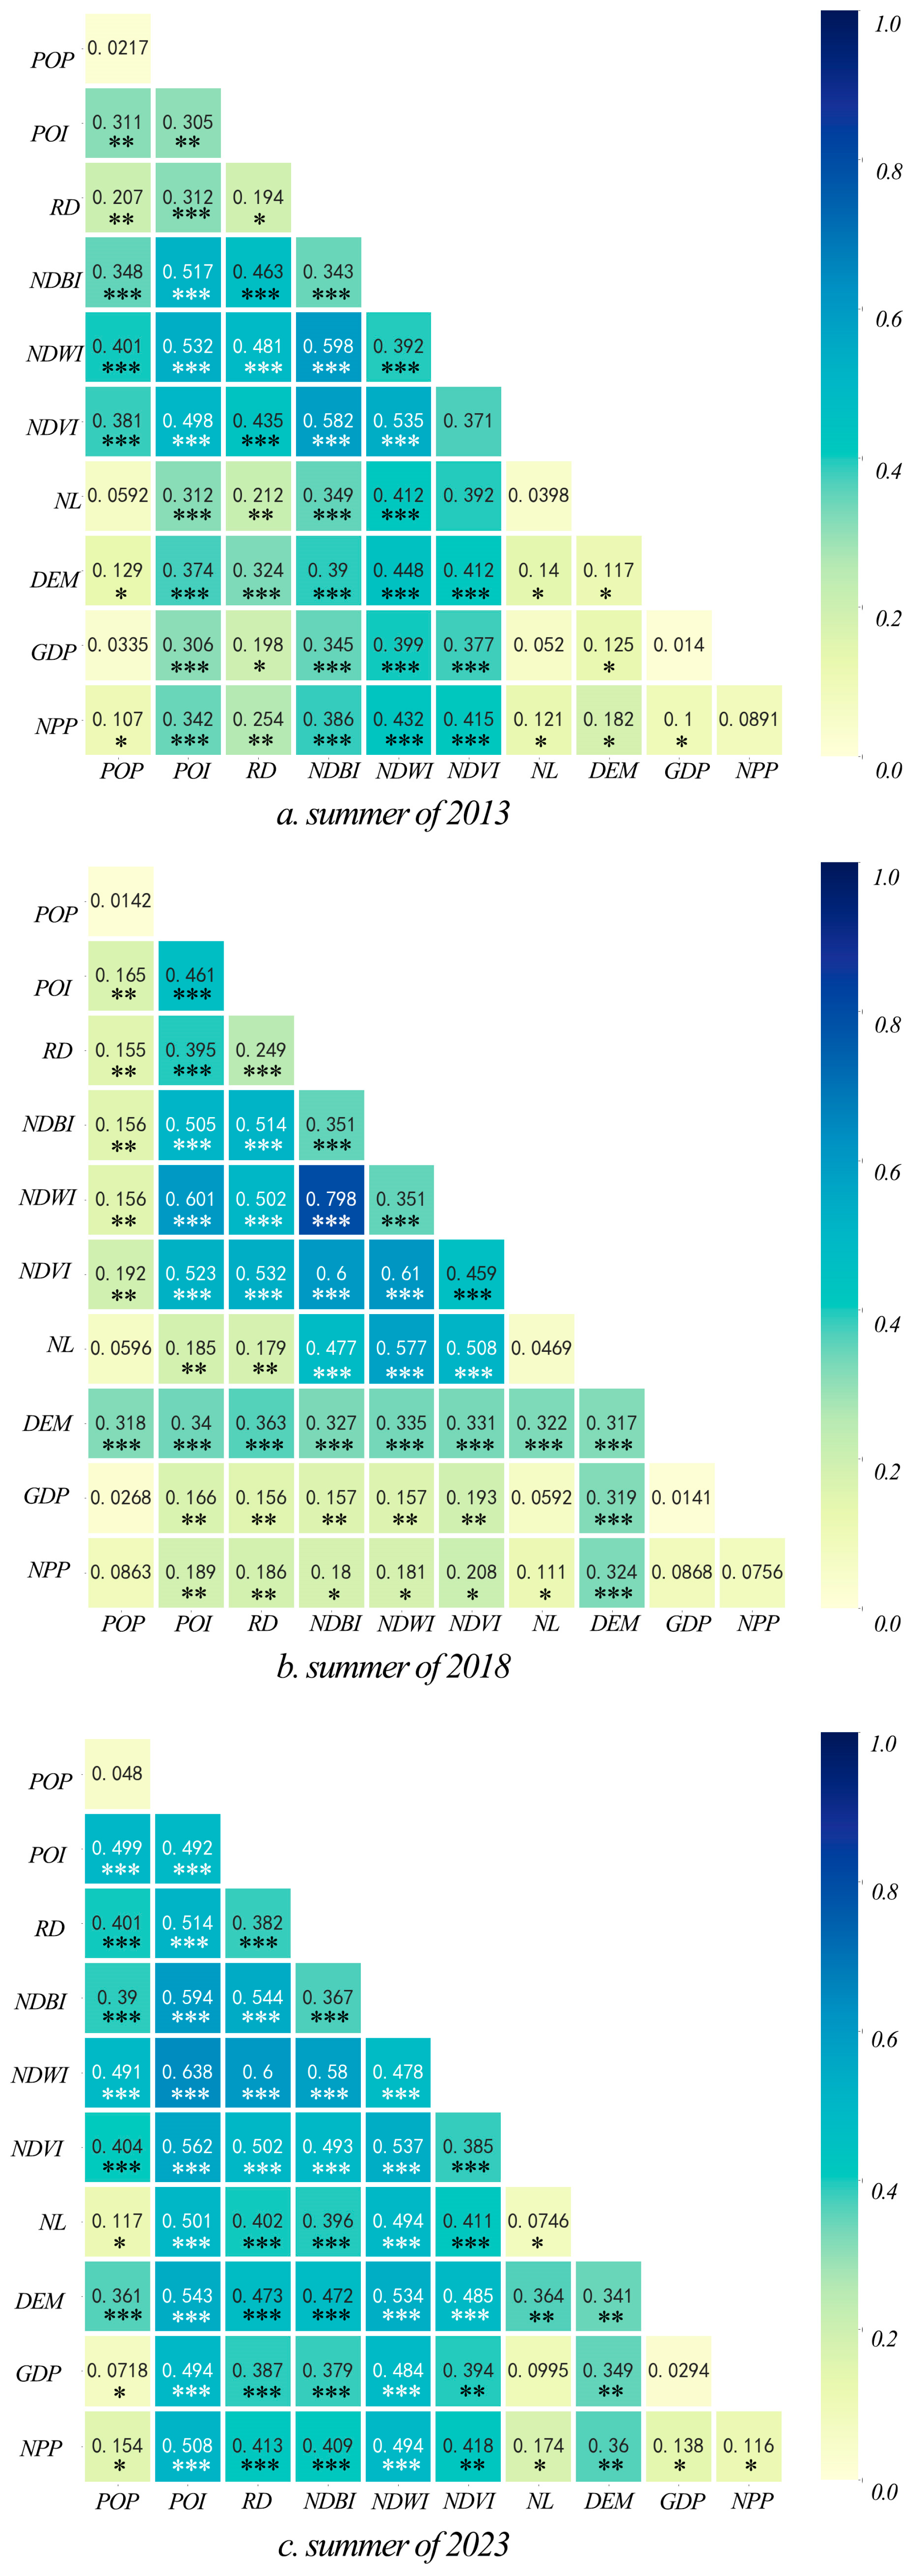
Figure 13 visually displays the q-values indicating the significance of the impact of individual influencing factors and that of their interactions on SUHI effects of diverse LCZ in 2013, 2018, and 2023. As shown in Figure 13a, in 2013, in terms of single factor impact, NDVI, NDBI, and NDWI had the highest impact on SUHI effect, with q-values of 0.371, 0.392, and 0.343, respectively. Considering the impact of interactions between factors on SUHI effects, the interaction between NDWI and NDBI had the most significant impact on SUHI effects, with a q-value of 0.598. Other significant interaction effects include: NDVI ∩ NDBI (0.582), NDVI ∩ NDWI (0.535), NDWI ∩ POI (0.532), NDBI ∩ POI (0.517), etc. These results indicated the fact that land cover factors, whether in terms of single factor influence or dual factor interaction, still played an important role in the driving mechanism of SUHI effects.
Figure 13b shows the results from the interaction detector of the GD model in 2018. In terms of single factor influence, POI demonstrated a significantly increased impact on the SUHI effects, with the q-value increasing from 0.305 in 2013 to 0.461 in 2018. The impact of NDVI on the SUHI effect is the second most significant one, with a q-value of 0.459. The q-values of NDVI and NDWI were both 0.351, following the q-values of POI and NDVI. In terms of dual factor interaction, similar to the situation in 2013, NDWI ∩ NDBI had the highest q-value of 0.798, while other interactions with less significant impact included NDVI ∩ NDWI (0.61), NDVI ∩ NDBI (0.6), POI ∩ NDWI (0.601), NL ∩ NDWI (0.577), RD ∩ NDVI (0.532), NDVI ∩ POI (0.523), RD ∩ NDBI (0.514), etc.
Figure 13c displays the results of GD analysis in 2023. In terms of single factor impact, compared to the factors in 2013 and 2018, the number of factors that affect SUHII is significantly larger in 2023, with the factors arranged from that of high q-value to that of low one as: POI (0.492), NDWI (0.478), NDVI (0.385), RD (0.382), NDBI (0.367), and DEM (0.341). In terms of factor interaction, the interaction effect between NDWI and POI is relatively significant, with a q-value of 0.638. The other interaction effects with lower q-values are RD ∩ NDWI (0.6), POI ∩ NDBI (0.594), POI ∩ NDVI (0.562), POI ∩ DEM (0.543), NDVI ∩ NDWI (0.537), DEM ∩ NDWI (0.534), etc. To summarize, the number of factors that have a significant impact on SUHI effects increased from the years 2013 and 2018 to 2023, with only land cover factors having a greater impact on SUHI in the past years while urban environmental factors and social economic factors gradually increased their impact to the significant level in 2023.

4. Discussion

4.1. The Spatial Heterogeneity of the SUHI Effects

Determining the surface urban heat island (SUHI) effects in various locations within a metropolis is always a crucial consideration. When investigating the surface urban heat island effects in target areas, while field observations were employed to obtain land surface temperature (LST), remote sensing images were more commonly used, often in conjunction with the analysis of local climate zones (LCZs) [64]. In previous studies, different types of Local Climate Zones (LCZs) have demonstrated varying surface urban heat island intensities (SUHII) based on the time and location of the research. However, a common finding across these studies is that LCZs 2, 3, 8, and 10 consistently show high surface urban heat island intensities (SUHII) [74,75,76].
Based on the results presented above, the spatial heterogeneity of the SUHI effects in the Guangzhou-Foshan metropolis demonstrated a significant core-periphery pattern. Figure 9 shows that the SUHII in the central area of the Guangzhou-Foshan metropolis is significantly higher than that in the surrounding areas, with the peak values of SUHII in 2013, 2018 and 2023 being 16.05 K, 15.20 K and 18.49 K, respectively. Similar to the research conducted in Wuhan, Nanjing, Changzhou, Chongqing, and Hefei, the LCZ types contributing the most to the SUHI effects were LCZ 2, 3, 4, 5, 8, and 10 [19,77,78,79,80]. In the central part of the Guangzhou-Foshan metropolitan area, the SUHI effects were mainly driven by LCZ 2, 3, 4, and 5, which were primarily characterized by urban villages, residential areas, and old neighborhoods, such as the South Residential Block in Panyu District, old neighborhoods in Liwan District, and large urban villages in Yuexiu District. In the peripheral area of the Guangzhou-Foshan metropolis, the SUHI effects were mainly triggered by LCZ 8 and LCZ 10, with the potential triggers being their components like transportation hubs, village-level industrial zones, and industrial zones mixed with urban villages, such as Baiyun Airport and Nanhai Industrial zones.
What is more, according to Figure 8, within the Guangzhou-Foshan metropolitan area, the surface urban heat island intensity (SUHII) in northern mountainous regions is significantly higher than that in southern coastal areas for LCZs of the same type. Consistent with other studies, LCZ3, LCZ8, and LCZ10, which are situated in mountainous areas, demonstrate the highest surface urban heat island intensity (SUHII). To further investigate the influencing factors, we employed the MGWR model, which effectively analyzes geographic spatial heterogeneity, to examine the underlying impact mechanisms [64,81].

4.2. Analysis of Main Influential Factors of SUHI Effects

Existing research has utilized various quantitative analysis models to examine the causes of the SUHI effects across different Local Climate Zones (LCZs). Among these, Ordinary Least Squares (OLS) is the most commonly employed method, primarily focusing on the global impact of various influencing factors on the Surface Urban Heat Island Intensity (SUHII). As research has progressed, the spatial heterogeneity of the urban heat island effect has gained increasing attention, particularly in studies utilizing LCZs. Different types of LCZs in various geographical locations demonstrate distinct heat island intensities. Consequently, models capable of analyzing spatial heterogeneity, such as Geographically Weighted Regression (GWR) and Multiscale Geographically Weighted Regression (MGWR), have begun to be adopted [82,83,84,85].
In this study, three types of regression models, GWR, MGWR, and GD, were applied to the analysis of SUHI effects to explore the driving mechanism. The results from GWR and MGWR models were similar in that both models exhibited that land cover factors played the most important role in the SUHI effects, with NDVI and NDWI being the most significant negative factors affecting the SUHI effects, and NDBI being the most significant positive factor. Different from the significant impact of land cover factors, the influence of urban environment factors was comparatively less. Among urban environment factors, POI and RD had a relatively strong impact on the SUHI effects, while DEM only had a relatively significant impact on some built types LCZ, such as LCZ 2, LCZ 4, LCZ 8, and LCZ 10. The spatial heterogeneity of the impact of DEM on SUHII in this study was relatively greater than that in the results of other researches [86,87]. Unlike other influencing factors, DEM had a non-linear impact on SUHII, mainly affecting mountainous areas with elevations above 98 m and coastal areas with elevations below 26 m. Furthermore, the analysis of the interactions between the influencing factors was conducted by the application of the GD model, the results of which showed that, in 2013 and 2018, the interaction results between NDWI and NDBI were the highest, with q-values of 0.598 and 0.798, respectively, while in 2023, the interaction results between NDWI and POI were the highest, with a q-value of 0.638. In summary, from 2013 to 2023, the impact of urban environmental factors and social economic factors on SUHI effects gradually increased, and their interactive impact values also gradually increased. The factors that influenced SUHI effects showed a diversified trend overall.

4.3. Policy Recommendations to Alleviate SUHI Effects

Based on the results and findings in this research, the following three policy recommendations can be proposed to mitigate the SUHII: firstly, since the results of this study showed that NDVI and NDWI had the highest negative impact on SUHII as single factors, especially for LCZ2 and LCZ3, it is necessary to introduce more related land types, such as small parks and water bodies in cities, especially pocket parks and lake water bodies. Based on previous research findings by scholars, it has been proven that such measures are effective in mitigating the SUHI effects [88,89,90,91]. Secondly, the results of the analysis on the factor interaction in this research showed that the interaction between NDVI and NDWI had the most significant negative effect on SUHI effects. Based on such finding and previous researches by other scholars, it is recommended to combine parks, important green patches, and water systems to form a blue-green network [92,93,94,95]. Thirdly, the Results part in Section 3.3 revealed the impact of urban environmental factors on SUHII, stating that the higher significance of the SUHI effect was related to the higher POI density, and that RD was negatively correlated with the SUHII in the central area of the city, and positively correlated with the SUHI effect outside the city. An on-site investigation revealed that most roads in the city center are lined with trees, effectively lowering LST. In contrast, the peripheral areas of the urban circle predominantly feature wide asphalt or hard-paved lanes, which lack sufficient greenery. Based on such findings, these relevant policies can be drawn: (1) In the city’s central area, the density of the road network can be appropriately increased, with a recommended size for commercial blocks of 150 m × 150 m. Additionally, incorporating tall trees as roadside vegetation can enhance the shaded area along roads and help reduce surface land surface temperature (LST). In the city’s peripheral areas, it is advisable to replace traditional road materials with permeable and cooling stone materials to minimize the exposure of asphalt pavement to direct sunlight. (2) The research findings indicate that the degree of POI agglomeration is positively correlated with the intensity of the urban heat island effect. Field verification reveals that areas with clustered POIs are often associated with continuous high-density urban development. Consequently, avoiding highly concentrated building construction can effectively mitigate the urban heat island effect. (3) Given their substantial SUHI effects, the compact lowrise and midrise areas (LCZ2 and LCZ3) in the central region of the Guangzhou-Foshan metropolitan area, along with the industrial district near the northern mountainous areas (LCZ8 and LCZ10), should be renovated and upgraded to enhance vegetation and water features. Alternatively, they could be demolished and rebuilt as part of urban renewal efforts to expand outdoor green spaces.

4.4. Limitation and Future Research Direction

This study consisted of three critical parts: firstly, the identification and division of LCZs based on remote sensing images; secondly, the calculation of SUHII derived from remote sensing surface temperature inversion; and thirdly, the identification of relevant factors and influencing mechanisms on SUHI effects.
However, there are still limitations in these parts, which require further improvement. Firstly, in the stage of LCZ recognition, this study mainly used the LCZ generator developed by WUDAPT, followed by precision adjustments through random forest [18,96,97]. However, the existing methods are prone to confuse LCZ 2 with LCZ 3 in built types, as well as confusing LCZ B with LCZ C in land cover types, for the remote sensing images of each pair are of high similarity. For further research, deep learning methods should be combined to improve the recognition accuracy of LCZs in the Guangzhou-Foshan metropolis. Secondly, the method of calculating SUHII in this study is mainly based on remote sensing inversion, only obtaining the LST. In subsequent research, the perceived temperature should be added as the dependent variable of the SUHI effects analysis. Meanwhile, research should be conducted to further explore the influencing factors that affect human beings on their perception of temperature in cities. Thirdly, in this study, the main factors affecting the SUHI effects were mainly two-dimensional factors such as NDVI or NDBI, lacking three-dimensional elements such as building materials, building volume, or building shape, etc. Therefore, further research could conduct analysis on the effects of three-dimensional influencing factors such as building height, shape, and material on the UHI effects [19,58]. What is more, since the relationship between the SUHII of different LCZs and influencing factors is non-linear, the GD model still has significant shortcomings in exploring the correlation of influencing factors. In the future, the random forest model in machine learning regression analysis and the YOLOv5 algorithm in deep learning will be used to deeply explore the influencing factors of SUHII [13,14,98,99].

5. Conclusions

A detailed analysis of the changes in local climate zones in the Guangzhou-Foshan metropolitan area from 2013 to 2023, as well as the influencing factors of the surface urban heat island (SUHI) effects in different types of LCZs, can provide quantitative support for future mitigation of the deterioration of urban thermal environment.
In this study, LCZ exhibited significant spatial heterogeneity and complex distribution in the Guangzhou-Foshan metropolitan area, in which LCZ 9 took up the largest proportion, yet its area kept increasing over time. In the central urban area, the proportion of LCZ 5 in the built types was the largest, and its area has been increasing annually. In the metropolitan area of Guangzhou-Foshan, the proportion of LCZ A in the land cover types was the largest, and its area remained relatively stable without annual increase or decrease.
The SUHI effects in the Guangzhou-Foshan metropolis exhibited a clear core-periphery pattern. A comparison between 2013, 2018, and 2023 showed that the overall SUHII in the Guangzhou-Foshan metropolitan area has been alleviated in general terms, but to a specific extent, the SUHII in the central urban area continued to increase, with the peak value of SUHII in 2023 significantly higher than that of 2013. Additionally, the analysis revealed that LCZ 8 had the highest positive impact on the SUHI effect, followed by LCZ 3; conversely, LCZ G had the greatest negative impact on the SUHI effect, followed by LCZ A.
In terms of single-factor influence, through the analysis of the GWR and MGWR regression models, it was found that land cover factors had the greatest impact on SUHII, with NDVI and NDWI showing significant negative effects and NDBI showing a significant positive effect. The comparison between the results from 2013 to 2023 showed that the factors influencing SUHII have become increasingly diverse, with factors such as POI and RD gradually becoming more influential. In terms of two-factor interactions, in 2013 and 2018, the interaction between NDBI and NDWI had the greatest impact on SUHII, while in 2023, the interactions between POI, RD, and land cover factors had a significant impact on the SUHII.
In conclusion, this study took the Guangzhou-Foshan Metropolitan Area as the research object, making a longitudinal comparison between the data collected at three different time periods in 2013, 2018, and 2023, applying multiple models. With the support of both quantitative and qualitative analysis, this study delved deeply into the driving mechanisms influencing the SUHI effects, providing suggestions for future policy-making.

Author Contributions

Conceptualization, X.H. and J.L.; methodology, X.H.; software, J.L.; validation, Y.Q., Q.Y. and G.L.; formal analysis, X.H.; investigation, X.H.; resources, J.L.; data curation, X.H. and J.L.; writing—original draft preparation, X.H.; writing—review and editing, Y.Q., J.L. and X.H.; visualization, X.H.; supervision, Y.Q.; project administration, Q.Y.; funding acquisition, Q.Y. All authors have read and agreed to the published version of the manuscript.

Funding

This research was funded by National Natural Science Foundation “Research on Technical Optimization of Land Spatial Planning in Urban-Rural Mixed Areas of the Guangdong-Hong Kong-Macao Greater Bay Area”, grant number 52478052; Major Project of the National Social Science Fund “Research on the Social Form of Suburban Communities with Chinese Characteristics”, grant number 21&ZD175.

Data Availability Statement

The data that support the findings of this study are available from the corresponding author upon reasonable request and approval from the study sites’ representative coauthors.

Acknowledgments

We would like to express our sincere gratitude to all individuals and institutions that contributed to the completion of this research. We extend our appreciation to our colleagues from the Subtropical Key Laboratory of South China University of Technology for their invaluable guidance and support throughout the study. Their insights and expertise were instrumental in shaping our understanding of urban heat islands and local climate zones.

Conflicts of Interest

The authors declare no conflict of interest.

Abbreviations

UHIUrban heat island
SUHISurface urban heat island
SUHIISurface urban heat island intensity
LSTLand surface temperature
LCZsLocal climate zones
POIPoints of interest
DEMDigital elevation model
NDVINormalized Difference Vegetation Index
NDBINormalized Difference Built-up Index
NDWINormalized Difference Water Index
POPPopulation Density
RDRoad density
GDPGross Domestic Product
NPPNet Primary Productivity
NLNight light
WUDAPTWorld Urban Database and Access Portal Tools

References

  1. Ward, K.; Lauf, S.; Kleinschmit, B.; Endlicher, W. Heat waves and urban heat islands in Europe: A review of relevant drivers. Sci. Total Environ. 2016, 569, 527–539. [Google Scholar] [CrossRef] [PubMed]
  2. Cheval, S.; Amihaesei, V.A.; Chitu, Z.; Dumitrescu, A.; Falcescu, V.; Irasoc, A.; Micu, D.M.; Mihulet, E.; Ontel, I.; Paraschiv, M.G.; et al. A systematic review of urban heat island and heat waves research (1991–2022). Clim. Risk Manag. 2024, 44, 100603. [Google Scholar] [CrossRef]
  3. Oke, T.R. City Size and Urban Heat Island. Atmos. Environ. 1973, 7, 769–779. [Google Scholar] [CrossRef]
  4. Oke, T.R. The Energetic Basis of the Urban Heat-island. Q. J. R. Meteorol. Soc. 1982, 108, 1–24. [Google Scholar] [CrossRef]
  5. Abougendia, S.M. Investigating surface UHI using local climate zones (LCZs), the case study of Cairo’s River Islands. Alex. Eng. J. 2023, 77, 293–307. [Google Scholar] [CrossRef]
  6. Chai, R.M. Relating Urban Morphology and Urban Heat Island During Extreme Heat Events in the Kansas City Metropolitan Area. Ph.D. Thesis, University of Kansas, Lawrence, KS, USA, 2018. [Google Scholar]
  7. Bureau, P.R. 2023-World-Population-Data-Sheet-Booklet; Population Reference Bureau: Washington, DC, USA, 2023. [Google Scholar]
  8. Debbage, N.; Shepherd, J.M. The urban heat island effect and city contiguity. Comput. Environ. Urban Syst. 2015, 54, 181–194. [Google Scholar] [CrossRef]
  9. Peng, W.; Wang, R.; Duan, J.; Gao, W.; Fan, Z. Surface and canopy urban heat islands: Does urban morphology result in the spatiotemporal differences? Urban Clim. 2022, 42, 101136. [Google Scholar] [CrossRef]
  10. Wen, C.; Mamtimin, A.; Feng, J.; Wang, Y.; Yang, F.; Huo, W.; Zhou, C.; Li, R.; Song, M.; Gao, J.; et al. Diurnal Variation in Urban Heat Island Intensity in Birmingham: The Relationship between Nocturnal Surface and Canopy Heat Islands. Land 2023, 12, 2062. [Google Scholar] [CrossRef]
  11. Yuan, D.; Zhang, L.; Fan, Y.; Sun, W.; Fan, D.; Zhao, X. Spatio-Temporal Analysis of Surface Urban Heat Island and Canopy Layer Heat Island in Beijing. Appl. Sci. 2024, 14, 5034. [Google Scholar] [CrossRef]
  12. Mirabi, E.; Davies, P.J. A systematic review investigating linear infrastructure effects on Urban Heat Island (UHIULI) and its interaction with UHI typologies. Urban Clim. 2022, 45, 101261. [Google Scholar] [CrossRef]
  13. Lin, J.; Wei, K.; Guan, Z. Exploring the connection between morphological characteristic of built-up areas and surface heat islands based on MSPA. Urban Clim. 2024, 53, 101764. [Google Scholar] [CrossRef]
  14. Jung, W.; Kim, G. Reduction of Fine Dust and Alleviation of Heat Island Effect: An Analysis of Cold Air Flow in Pohang City, South Korea. Land 2024, 13, 347. [Google Scholar] [CrossRef]
  15. Kang, S.; Lee, D.; Park, J.; Jung, J. Exploring Urban Forms Vulnerable to Urban Heat Islands: A Multiscale Analysis. Sustainability 2022, 14, 3603. [Google Scholar] [CrossRef]
  16. Zhang, J.; Tu, L.; Wang, X.; Liang, W. Comparison of Urban Heat Island Differences in the Yangtze River Delta Urban Agglomerations Based on Different Urban-Rural Dichotomies. Remote Sens. 2024, 16, 3206. [Google Scholar] [CrossRef]
  17. Badaro-Saliba, N.; Adjizian-Gerard, J.; Zaarour, R.; Najjar, G. LCZ scheme for assessing Urban Heat Island intensity in a complex urban area (Beirut, Lebanon). Urban Clim. 2021, 37, 100846. [Google Scholar] [CrossRef]
  18. Muhammad, F.; Xie, C.K.; Vogel, J.; Afshari, A. Inference of Local Climate Zones from GIS Data, and Comparison to WUDAPT Classification and Custom-Fit Clusters. Land 2022, 11, 747. [Google Scholar] [CrossRef]
  19. Xi, Y.; Wang, S.; Zou, Y.; Zhou, X.; Zhang, Y. Seasonal surface urban heat island analysis based on local climate zones. Ecol. Indic. 2024, 159, 111669. [Google Scholar] [CrossRef]
  20. Yin, S.; Xiao, S.Y.; Ding, X.T.; Fan, Y.F. Improvement of spatial-temporal urban heat island study based on local climate zone framework: A case study of Hangzhou, China. Build. Environ. 2024, 248, 111102. [Google Scholar] [CrossRef]
  21. Zhang, J.; Tu, L.; Shi, B. Spatiotemporal Patterns of the Application of Surface Urban Heat Island Intensity Calculation Methods. Atmosphere 2023, 14, 1580. [Google Scholar] [CrossRef]
  22. Qin, Y.; Ghalambaz, S.; Sheremet, M.; Baro, M.; Ghalambaz, M. Deciphering Urban Heat Island Mitigation: A Comprehensive Analysis of Application Categories and Research Trends. Sustain. Cities Soc. 2024, 101, 105081. [Google Scholar] [CrossRef]
  23. Shi, L.; Ling, F.; Foody, G.M.; Yang, Z.; Liu, X.; Du, Y. Seasonal SUHI Analysis Using Local Climate Zone Classification: A Case Study of Wuhan, China. Int. J. Environ. Res. Public Health 2021, 18, 7242. [Google Scholar] [CrossRef]
  24. Han, J.; Liu, J.; Liu, L.; Ye, Y. Spatiotemporal Changes in the Urban Heat Island Intensity of Distinct Local Climate Zones: Case Study of Zhongshan District, Dalian, China. Complexity 2020, 2020, 8820338. [Google Scholar] [CrossRef]
  25. Hu, J.; Yang, Y.; Pan, X.; Zhu, Q.; Zhan, W.; Wang, Y.; Ma, W.; Su, W. Analysis of the Spatial and Temporal Variations of Land Surface Temperature Based on Local Climate Zones: A Case Study in Nanjing, China. IEEE J. Sel. Top. Appl. Earth Obs. Remote Sens. 2019, 12, 4213–4223. [Google Scholar] [CrossRef]
  26. Bechtel, B.; Demuzere, M.; Mills, G.; Zhan, W.; Sismanidis, P.; Small, C.; Voogt, J. SUHI analysis using Local Climate Zones-A comparison of 50 cities. Urban Clim. 2019, 28, 100451. [Google Scholar] [CrossRef]
  27. Eldesoky, A.H.M.; Gil, J.; Pont, M.B. The suitability of the urban local climate zone classification scheme for surface temperature studies in distinct macroclimate regions. Urban Clim. 2021, 37, 100823. [Google Scholar] [CrossRef]
  28. Kamath, H.G.; Martilli, A.; Singh, M.; Brooks, T.; Lanza, K.V.; Bixler, R.P.; Coudert, M.; Yang, Z.L.; Niyogi, D. Human heat health index (H3I) for holistic assessment of heat hazard and mitigation strategies beyond urban heat islands. Urban Clim. 2023, 52, 101675. [Google Scholar] [CrossRef]
  29. Moon, S.Y.; Kim, J.; Chong, W.K.O.; Ariaratnam, S.T. Urban Green Space Layouts and Urban Heat Island: Case Study on Apartment Complexes in South Korea. J. Urban Plan. Dev. 2018, 144, 04018004. [Google Scholar] [CrossRef]
  30. Li, D.; Yan, S.F.; Chen, G.Z. Effects of Urban Redevelopment on Surface Urban Heat Island. IEEE J. Sel. Top. Appl. Earth Obs. Remote Sens. 2023, 16, 2366–2373. [Google Scholar] [CrossRef]
  31. Iamtrakul, P.; Padon, A.; Chayphong, S. Quantifying the Impact of Urban Growth on Urban Surface Heat Islands in the Bangkok Metropolitan Region, Thailand. Atmosphere 2024, 15, 100. [Google Scholar] [CrossRef]
  32. Ramírez-Aguilar, E.A.; Souza, L.C.L. Urban form and population density: Influences on Urban Heat Island intensities in Bogota, Colombia. Urban Clim. 2019, 29, 100497. [Google Scholar] [CrossRef]
  33. Murayama, Y.; Wang, R.C. Editorial: Special Issue on Geographical Analysis and Modeling of Urban Heat Island Formation. Remote Sens. 2023, 15, 4474. [Google Scholar] [CrossRef]
  34. Meng, F.; Yan, S.L.; Tian, G.H.; Wang, Y.D. Surface urban heat island effect and its spatiotemporal dynamics in metropolitan area: A case study in the Zhengzhou metropolitan area, China. Front. Environ. Sci. 2023, 11, 1247046. [Google Scholar] [CrossRef]
  35. Kim, H.; Seok, H.B.; Kim, Y.K. A Study on the Change of the Urban Heat Island Structure in Busan Metropolitan Area, Korea. J. Environ. Sci. Int. 2014, 23, 1807–1820. [Google Scholar] [CrossRef]
  36. Yu, Z.W.; Yao, Y.W.; Yang, G.Y.; Wang, X.R.; Vejre, H. Spatiotemporal patterns and characteristics of remotely sensed region heat islands during the rapid urbanization (1995-2015) of Southern China. Sci. Total Environ. 2019, 674, 242–254. [Google Scholar] [CrossRef]
  37. Song, Y.; Wang, J.; Ge, Y.; Xu, C. An optimal parameters-based geographical detector model enhances geographic characteristics of explanatory variables for spatial heterogeneity analysis: Cases with different types of spatial data. GIScience Remote Sens. 2020, 57, 593–610. [Google Scholar] [CrossRef]
  38. Yu, H.; Fotheringham, A.S.; Li, Z.; Oshan, T.; Kang, W.; Wolf, L.J. Inference in Multiscale Geographically Weighted Regression. Geogr. Anal. 2020, 52, 87–106. [Google Scholar] [CrossRef]
  39. Meng, L.; Zhu, C.G.; Pu, J.; Wen, B.; Si, W.T. Study on the Influence Mechanism of Intangible Cultural Heritage Distribution from Man-Land Relationship Perspective: A Case Study in Shandong Province. Land 2022, 11, 1225. [Google Scholar] [CrossRef]
  40. Huang, Y.; Lang, W.; Chen, T.T.; Wu, J.M. Regional Coordinated Development in the Megacity Regions: Spatial Pattern and Driving Forces of the Guangzhou-Foshan Cross-Border Area in China. Land 2023, 12, 753. [Google Scholar] [CrossRef]
  41. Ye, Y.Q.; Zhang, J.E.; Bryan, B.A.; Gao, L.; Qin, Z.; Chen, L.L.; Yang, J.Y. Impacts of rapid urbanization on ecosystem services along urban-rural gradients: A case study of the Guangzhou-Foshan Metropolitan Area, South China. Ecoscience 2018, 25, 235–247. [Google Scholar] [CrossRef]
  42. Malakar, N.K.; Hulley, G.C.; Hook, S.J.; Laraby, K.; Cook, M.; Schott, J.R. An Operational Land Surface Temperature Product for Landsat Thermal Data: Methodology and Validation. IEEE Trans. Geosci. Remote Sens. 2018, 56, 5717–5735. [Google Scholar] [CrossRef]
  43. Park, S.H.; Jung, H.S.; Shin, H.S. Time-series monitoring result of land surface temperature variation at Mt. Baekdu using Landsat images. In Proceedings of the Conference on Land Surface Remote Sensing II, Beijing, China, 13–16 October 2014. [Google Scholar]
  44. Li, S.J.; Cao, X.; Zhao, C.C.; Jie, N.; Liu, L.L.; Chen, X.H.; Cui, X.H. Developing a Pixel-Scale Corrected Nighttime Light Dataset (PCNL, 1992-2021) Combining DMSP-OLS and NPP-VIIRS. Remote Sens. 2023, 15, 3925. [Google Scholar] [CrossRef]
  45. Demuzere, M.; Kittner, J.; Bechtel, B. LCZ Generator: A Web Application to Create Local Climate Zone Maps. Front. Environ. Sci. 2021, 9, 637455. [Google Scholar] [CrossRef]
  46. Vaidya, M.; Keskar, R.; Kotharkar, R. Classifying heterogeneous urban form into local climate zones using supervised learning and greedy clustering incorporating Landsat dataset. Urban Clim. 2024, 53, 101770. [Google Scholar] [CrossRef]
  47. Zhao, N.; Ma, A.; Zhong, Y.; Zhao, J.; Cao, L. Self-Training Classification Framework with Spatial-Contextual Information for Local Climate Zones. Remote Sens. 2019, 11, 2828. [Google Scholar] [CrossRef]
  48. Yang, Y.M.; Qiu, J.X.; Su, H.B.; Bai, Q.M.; Liu, S.H.; Li, L.; Yu, Y.L.; Huang, Y.X. A One-Source Approach for Estimating Land Surface Heat Fluxes Using Remotely Sensed Land Surface Temperature. Remote Sens. 2017, 9, 43. [Google Scholar] [CrossRef]
  49. Cai, M.; Ren, C.; Xu, Y. Investigating the relationship between local climate zone and land surface temperature—A case study in Shanghai. In Proceedings of the Joint Urban Remote Sensing Event (JURSE), Dubai, United Arab Emirates, 6–8 March 2017. [Google Scholar]
  50. Nasehi, S.; Yavari, A.; Salehi, E.; Emmanuel, R. Role of local climate zone and space syntax on land surface temperature (case study: Tehran). Urban Clim. 2022, 45, 101245. [Google Scholar] [CrossRef]
  51. Quan, J.L. Diurnal land surface temperature characteristics of local climate zones: A case study in beijing, china. In Proceedings of the IEEE International Geoscience and Remote Sensing Symposium (IGARSS), Yokohama, Japan, 28 July–2 August 2019; pp. 7443–7446. [Google Scholar]
  52. Hong, S.-O.; Kim, D.-H.; Byon, J.-Y.; Park, H.; Ha, J.-C. Analysis of the Effects of Advection and Urban Fraction on Urban Heat Island Intensity using Unified Model for Seoul Metropolitan Area, Korea. Atmosphere 2019, 29, 381–390. [Google Scholar] [CrossRef]
  53. Bechtel, B.; Alexander, P.J.; Beck, C.; Boehner, J.; Brousse, O.; Ching, J.; Demuzere, M.; Fonte, C.; Gal, T.; Hidalgo, J.; et al. Generating WUDAPT Level 0 data—Current status of production and evaluation. Urban Clim. 2019, 27, 24–45. [Google Scholar] [CrossRef]
  54. Alghamdi, A.S.; Alzhrani, A.I.; Alanazi, H.H. Local Climate Zones and Thermal Characteristics in Riyadh City, Saudi Arabia. Remote Sens. 2021, 13, 4526. [Google Scholar] [CrossRef]
  55. Huang, F.; Jiang, S.D.; Zhan, W.F.; Bechtel, B.; Liu, Z.H.; Demuzere, M.; Huang, Y.; Xu, Y.; Ma, L.; Xia, W.J.; et al. Mapping local climate zones for cities: A large review. Remote Sens. Environ. 2023, 292, 113573. [Google Scholar] [CrossRef]
  56. Perera, N.G.R.; Emmanuel, R. A “Local Climate Zone” based approach to urban planning in Colombo, Sri Lanka. Urban Clim. 2018, 23, 188–203. [Google Scholar] [CrossRef]
  57. Xu, D.; Zhang, Q.; Zhou, D.; Yang, Y.J.; Wang, Y.Q.; Rogora, A.; Pitts, A. Local Climate Zone in Xi’an City: A Novel Classification Approach Employing Spatial Indicators and Supervised Classification. Buildings 2023, 13, 2806. [Google Scholar] [CrossRef]
  58. Xu, Y.N.; Hou, W.; Zhang, C.X. Spatial Association Rules and Thermal Environment Differentiation Evaluation of Local Climate Zone and Urban Functional Zone. Land 2023, 12, 1701. [Google Scholar] [CrossRef]
  59. Schonlau, M.; Zou, R.Y. The random forest algorithm for statistical learning. Stata J. 2020, 20, 3–29. [Google Scholar] [CrossRef]
  60. dos Anjos, C.S.; Lacerda, M.G.; Andrade, L.D.; Salles, R.N. Classification of urban environments using feature extraction and random forest. In Proceedings of the IEEE International Geoscience and Remote Sensing Symposium (IGARSS), Fort Worth, TX, USA, 23–28 July 2017; pp. 1205–1208. [Google Scholar]
  61. Sekertekin, A.; Bonafoni, S. Land Surface Temperature Retrieval from Landsat 5, 7, and 8 over Rural Areas: Assessment of Different Retrieval Algorithms and Emissivity Models and Toolbox Implementation. Remote Sens. 2020, 12, 294. [Google Scholar] [CrossRef]
  62. Garcia, D.H.; Diaz, J.A. Modeling of the Urban Heat Island on local climatic zones of a city using Sentinel 3 images: Urban determining factors. Urban Clim. 2021, 37, 100840. [Google Scholar] [CrossRef]
  63. Zhang, W.; Huo, H.; Geng, X.; Zhou, P.; Guo, L.; Li, Z.-L. Simulation of canopy urban heat island at a block scale based on local climate zones and urban weather generator: A case study of Beijing. Int. J. Remote Sens. 2023. early access. [Google Scholar] [CrossRef]
  64. Li, C.; Zhang, N.; Wang, Y.; Chen, Y. Modeling Urban Heat Islands and Thermal Comfort During a Heat Wave Event in East China With CLM5 Incorporating Local Climate Zones. J. Geophys. Res.-Atmos. 2023, 128, e2023JD038883. [Google Scholar] [CrossRef]
  65. Lin, Z.; Xu, H.; Yao, X.; Yang, C.; Yang, L. Exploring the relationship between thermal environmental factors and land surface temperature of a “furnace city” based on local climate zones. Build. Environ. 2023, 243, 110732. [Google Scholar] [CrossRef]
  66. Zhang, H.; Wang, C.; Yang, H.; Ma, Z. How do morphology factors affect urban heat island intensity? an approach of local climate zones in a fast-growing small city, Yangling, China. Ecol. Indic. 2024, 161, 111972. [Google Scholar] [CrossRef]
  67. Liu, W.; Zhang, L.; Hu, X.; Meng, Q.; Qian, J.; Gao, J.; Li, T. Nonlinear effects of urban multidimensional characteristics on daytime and nighttime land surface temperature in highly urbanized regions: A case study in Beijing, China. Int. J. Appl. Earth Obs. Geoinf. 2024, 132, 104067. [Google Scholar] [CrossRef]
  68. Sarricolea, P.; Smith, P.; Romero-Aravena, H.; Serrano-Notivoli, R.; Fuentealba, M.; Meseguer-Ruiz, O. Socioeconomic inequalities and the surface heat island distribution in Santiago, Chile. Sci. Total Environ. 2022, 832, 155152. [Google Scholar] [CrossRef] [PubMed]
  69. Wu, Z.; Xu, Y.; Cao, Z.; Yang, J.; Zhu, H. Impact of Urban Agglomeration and Physical and Socioeconomic Factors on Surface Urban Heat Islands in the Pearl River Delta Region, China. IEEE J. Sel. Top. Appl. Earth Obs. Remote Sens. 2021, 14, 8815–8822. [Google Scholar] [CrossRef]
  70. Chen, G.; Wei, Z. Exploring the impacts of built environment on bike-sharing trips on weekends: The case of Guangzhou. Int. J. Sustain. Transp. 2024, 18, 315–327. [Google Scholar] [CrossRef]
  71. Bechtel, B.; See, L.; Mills, G.; Foley, M. Classification of Local Climate Zones Using SAR and Multispectral Data in an Arid Environment. IEEE J. Sel. Top. Appl. Earth Obs. Remote Sens. 2016, 9, 3097–3105. [Google Scholar] [CrossRef]
  72. Liao, C.M.; Zuo, Y.F.; Law, R.; Wang, Y.Y.; Zhang, M. Spatial Differentiation, Influencing Factors, and Development Paths of Rural Tourism Resources in Guangdong Province. Land 2022, 11, 2046. [Google Scholar] [CrossRef]
  73. Yuan, W.R.; Chen, L.K.; Chen, H.X.; Deng, S.F.; Ji, H.; Liang, F.S. Assessing habitat quality at Poyang Lake based on InVEST and Geodetector modeling. Ecol. Evol. 2023, 13, e10759. [Google Scholar] [CrossRef] [PubMed]
  74. Lu, Y.; Yang, J.; Ma, S. Dynamic Changes of Local Climate Zones in the Guangdong-Hong Kong-Macao Greater Bay Area and Their Spatio-Temporal Impacts on the Surface Urban Heat Island Effect between 2005 and 2015. Sustainability 2021, 13, 6374. [Google Scholar] [CrossRef]
  75. Xiang, Y.; Zheng, B.; Bedra, K.B.; Ouyang, Q.; Liu, J.; Zheng, J. Spatial and seasonal differences between near surface air temperature and land surface temperature for Urban Heat Island effect assessment. Urban Clim. 2023, 52, 101745. [Google Scholar] [CrossRef]
  76. Zhao, Z.; Sharifi, A.; Dong, X.; Shen, L.; He, B.-J. Spatial Variability and Temporal Heterogeneity of Surface Urban Heat Island Patterns and the Suitability of Local Climate Zones for Land Surface Temperature Characterization. Remote Sens. 2021, 13, 4338. [Google Scholar] [CrossRef]
  77. Wang, Z.H.; Xing, W.; Huang, Y.; Xie, T.A. Studying the Urban Heat Island Using a Local Climate Zone Scheme. Pol. J. Environ. Stud. 2016, 25, 2609–2616. [Google Scholar] [CrossRef] [PubMed]
  78. Tian, W.S.; Yang, Y.J.; Wang, L.L.; Zong, L.; Zhang, Y.H.; Liu, D.Y. Role of local climate zones and urban ventilation in canopy urban heat island-heatwave interaction in Nanjing megacity, China. Urban Clim. 2023, 49, 101474. [Google Scholar] [CrossRef]
  79. Ma, L.; Huang, G.A.; Johnson, B.A.; Chen, Z.J.; Li, M.C.; Yan, Z.Y.; Zhan, W.F.; Lu, H.; He, W.Q.; Lian, D.J. Investigating urban heat-related health risks based on local climate zones: A case study of Changzhou in China. Sustain. Cities Soc. 2023, 91, 104402. [Google Scholar] [CrossRef]
  80. Shen, Y.; Zeng, C.; Cheng, Q.; Shen, H.F. Opposite Spatiotemporal Patterns for Surface Urban Heat Island of Two “Stove Cities” in China: Wuhan and Nanchang. Remote Sens. 2021, 13, 4447. [Google Scholar] [CrossRef]
  81. Deng, X.D.; Gao, F.; Liao, S.Y.; Liu, Y.; Chen, W.Y. Spatiotemporal evolution patterns of urban heat island and its relationship with urbanization in Guangdong-Hong Kong-Macao greater bay area of China from 2000 to 2020. Ecol. Indic. 2023, 146, 109817. [Google Scholar] [CrossRef]
  82. Guo, A.; Yang, J.; Xiao, X.; Xia, J.; Jin, C.; Li, X. Influences of urban spatial form on urban heat island effects at the community level in China. Sustain. Cities Soc. 2020, 53, 101972. [Google Scholar] [CrossRef]
  83. Huang, Y.; Yuan, M.; Lu, Y. Spatially varying relationships between surface urban heat islands and driving factors across cities in China. Environ. Plan. B-Urban Anal. City Sci. 2019, 46, 377–394. [Google Scholar] [CrossRef]
  84. Wang, L.; Hou, H.; Weng, J. Ordinary least squares modelling of urban heat island intensity based on landscape composition and configuration: A comparative study among three megacities along the Yangtze River. Sustain. Cities Soc. 2020, 62, 102381. [Google Scholar] [CrossRef]
  85. Wang, X.; Zhou, T.; Tao, F.; Zang, F. Correlation Analysis between UBD and LST in Hefei, China, Using Luojia1-01 Night-Time Light Imagery. Appl. Sci. 2019, 9, 5224. [Google Scholar] [CrossRef]
  86. Chen, P. Inequality in heat: The role of spatial patterns of urban green infrastructure. Urban Clim. 2024, 53, 101820. [Google Scholar] [CrossRef]
  87. Lan, Y.L.; Zhan, Q.M. How do urban buildings impact summer air temperature? The effects of building configurations in space and time. Build. Environ. 2017, 125, 88–98. [Google Scholar] [CrossRef]
  88. Wang, Y.S.; Zhan, Q.M.; Ouyang, W.L. How to quantify the relationship between spatial distribution of urban waterbodies and land surface temperature? Sci. Total Environ. 2019, 671, 1–9. [Google Scholar] [CrossRef] [PubMed]
  89. Wu, C.Y.; Li, J.X.; Wang, C.F.; Song, C.H.; Chen, Y.; Finka, M.; La Rosa, D. Understanding the relationship between urban blue infrastructure and land surface temperature. Sci. Total Environ. 2019, 694, 133742. [Google Scholar] [CrossRef]
  90. Xu, Z.Y.; Zhao, S.Q. Scale dependence of urban green space cooling efficiency: A case study in Beijing metropolitan area. Sci. Total Environ. 2023, 898, 165563. [Google Scholar] [CrossRef] [PubMed]
  91. Zölch, T.; Maderspacher, J.; Wamsler, C.; Pauleit, S. Using green infrastructure for urban climate-proofing: An evaluation of heat mitigation measures at the micro-scale. Urban For. Urban Green. 2016, 20, 305–316. [Google Scholar] [CrossRef]
  92. Asadi, A.; Arefi, H.; Fathipoor, H. Simulation of green roofs and their potential mitigating effects on the urban heat island using an artificial neural network: A case study in Austin, Texas. Adv. Space Res. 2020, 66, 1846–1862. [Google Scholar] [CrossRef]
  93. Chenary, K.; Soltani, A.; Sharifi, A. Street network patterns for mitigating urban heat islands in arid climates. Int. J. Digit. Earth 2023, 16, 3145–3161. [Google Scholar] [CrossRef]
  94. Irie, T. The cooling effect of green infrastructure in mitigating nocturnal urban heat islands: A case study of Yoyogi Park and Meiji Jingu Shrine in Tokyo. Landsc. Res. 2022, 47, 559–583. [Google Scholar] [CrossRef]
  95. Qian, W.Q.; Li, X.Y. A cold island connectivity and network perspective to mitigate the urban heat island effect. Sustain. Cities Soc. 2023, 94, 104525. [Google Scholar] [CrossRef]
  96. Wong, M.M.F.; Fung, J.C.H.; Ching, J.; Yeung, P.P.S.; Tse, J.W.P.; Ren, C.; Wang, R.; Cai, M. Evaluation of uWRF performance and modeling guidance based on WUDAPT and NUDAPT UCP datasets for Hong Kong. Urban Clim. 2019, 28, 100460. [Google Scholar] [CrossRef]
  97. Zonato, A.; Martilli, A.; Di Sabatino, S.; Zardi, D.; Giovanni, L. Evaluating the performance of a novel WUDAPT averaging technique to define urban morphology with mesoscale models. Urban Clim. 2020, 31, 100584. [Google Scholar] [CrossRef]
  98. Daemei, A.B.; Bradecki, T.; Pancewicz, A.; Razzaghipour, A.; Jamali, A.; Abbaszadegan, S.M.; Askarizad, R.; Kazemi, M.; Sharifi, A. An experimental analysis and deep learning model to assess the cooling performance of green walls in humid climates. Front. Energy Res. 2024, 12, 1447655. [Google Scholar] [CrossRef]
  99. Tanoori, G.; Soltani, A.; Modiri, A. Machine Learning for Urban Heat Island (UHI) Analysis: Predicting Land Surface Temperature (LST) in Urban Environments. Urban Clim. 2024, 55, 101962. [Google Scholar] [CrossRef]
Figure 1. Study area.
Land 13 01626 g001
Figure 2. The workflow of the research methodology.
Land 13 01626 g002
Figure 3. LCZ maps of Guangzhou-Foshan metropolitan area in 2013 (a), 2018 (b), 2023 (c).
Land 13 01626 g003
Figure 4. The trend of area variation for different LCZs in 2013, 2018 and 2023.
Land 13 01626 g004
Figure 5. Spatial-temporal distribution of LST in Guangzhou-Foshan metropolitan area in 2013 (a), 2018 (b), 2023 (c).
Land 13 01626 g005aLand 13 01626 g005b
Figure 6. Spatial-temporal distribution of SUHI effect in Guangzhou-Foshan metropolitan area in 2013 (left), 2018 (middle), 2023 (right).
Land 13 01626 g006
Figure 7. SUHI effects distribution in the Guangzhou-Foshan metropolitan area.
Land 13 01626 g007
Figure 8. SUHII (K) of diverse LCZ types.
Land 13 01626 g008
Figure 9. LCZ-based variables’ coefficients on SUHII in 2013 (a), 2018 (b), and 2023 (c). (Note: * indicates significant at p < 0.05, ** indicates significant at p < 0.01, *** indicates significant at p < 0.001).
Land 13 01626 g009
Figure 10. MGWR analysis of SUHI effects influential factors of built type LCZs in 2013.
Land 13 01626 g010
Figure 11. MGWR analysis of SUHI effects influential factors of built type LCZs in 2018.
Land 13 01626 g011
Figure 12. MGWR analysis of SUHI effects influential factors of built type LCZs in 2023.
Land 13 01626 g012
Figure 13. Contributions of influencing factors on SUHI effects. (Note: * indicates significant at p < 0.05, ** indicates significant at p < 0.01, *** indicates significant at p < 0.001).
Land 13 01626 g013
Table 1. List of data used in this research.
DataDateTypeSpatial ResolutionSource
Landsat images13 June 2013
3 August 2013
12 July 2018
11 August 2018
15 June 2023
22 June 2023
Raster30 m × 30 mUSGS
(https://landsat.visibleearth.nasa.gov, accessed on 4 October 2024)
Road network2013
2018
2023
Vector Open Street Map
(http://www.openstreetmap.org, accessed on 4 October 2024)
Digital elevation model2013Raster30 m × 30 mNASA (https://www.earthdata.nasa.gov, accessed on 4 October 2024)
Points of interest (POI)2013
2018
2023
Vector Amap
(https://www.amap.com, accessed on 4 October 2024)
LUCC2013
2018
2023
Raster30 m × 30 mChinese Academy of Science
(https://www.resdc.cn/DOI, accessed on 4 October 2024)
Nighttime light images2013
2018
2023
Raster30 m × 30 mDMSP-OLS dataset
(https://dataverse.harvard.edu/dataset.xhtml?persistentId=doi:10.7910/DVN/GIYGJU, accessed on 4 October 2024)
Population/GDP2013
2018
2023
Raster30 m × 30 m<China Urban Statistical Yearbook> etc.
Table 2. List of various types of LCZ training sample examples.
Built TypesLand Cover Types
LCZ TypesTraining Sample ExampleLCZ TypesTraining Sample Example
LCZ 2
compact midrise
Land 13 01626 i001LCZ A
dense trees
Land 13 01626 i002
LCZ 3
compact lowrise
Land 13 01626 i003LCZ B
scattered trees
Land 13 01626 i004
LCZ 4
open highrise
Land 13 01626 i005LCZ C
bush, scrub
Land 13 01626 i006
LCZ 5
open midrise
Land 13 01626 i007LCZ D
low plants
Land 13 01626 i008
LCZ 6
open lowrise
Land 13 01626 i009LCZ E
bare rock or paved
Land 13 01626 i010
LCZ 8
large lowrise
Land 13 01626 i011LCZ F
bare soil or sand
Land 13 01626 i012
LCZ 9
sparsely built
Land 13 01626 i013LCZ G
water
Land 13 01626 i014
LCZ 10
heavy industry
Land 13 01626 i015
Table 3. List of independent variables for SUHII analysis.
TypesIndicatorsFormulaDescription
Land cover factorsNDVI(NIR − R)/(NIR + R)NIR: infrared reflectance; R: red band reflectance
NDBI(SWIR − NIR)/(SWIR + NIR)SWIR: Short wave infrared reflectance; NIR: Infrared reflectance
NDWI(Green − NIR)/(Green + NIR)Green: Green light band; NIR: Infrared reflectance
NPPGPP − RGPP: Gross Primary Productivity; R: The loss of plant respiration
Urban environmental factorsPOI kernel density f n x = 1 n h i = 1 n k ( x x i h ) Where k is the kernel function, h is the smoothing parameter, X is the POI point, and x i is the sample observation point.
Road Density (RD) D = m = 1 n ( L m × V M ) / A i Where D is the line density value, n is the number of lines within the grid point search radius, L is the length of the lines, V is the weight of the lines, and A is the search area centered on the grid point.
DEM
Nighttime light
Social-economic factorsPopulation density
GDP
Table 4. List of geographical detector explanatory types.
TypesFormulaDegree of Influence
nonlinear enhancement q ( X 1 X2) > q(X1) + q(X2)Strong
independent q ( X 1 X2) = q(X1) + q(X2)Relatively Strong
linear enhancement q ( X 1 X2) > Max(q(X1), q(X2))Average
weakening Min ( q ( X 1 ) , q ( X 2 ) )   <   q ( X 1 X2) < Max(q(X1),q(X2))Relatively weak
nonlinear attenuation q ( X 1 X2) < Min(q(X1),q(X2))weak
Table 5. Area variation of different types of LCZs in 2013, 2018 and 2023 (km2).
Years201320182023
LCZ TypesArea (km2)
2267.162267.806267.381
3157.042151.017174.357
4450.274450.236530.831
5786.609791.185860.761
6375.630388.973377.779
81285.0221125.337917.980
91618.5631718.9231755.408
10403.269601.363553.087
A3753.0093757.3273757.472
B337.218338.616346.711
C138.346133.45498.515
D397.150304.506329.785
E152.33083.67990.305
F558.028567.559619.909
G524.774524.445524.145
Table 6. The land area and proportion of the SUHI effect in the Guangzhou-Foshan metropolis.
SUHII TypesArea (2013)
km2
Percentage (2013)Area (2018)
km2
Percentage (2018)Area (2023)
km2
Percentage (2023)
VII (Super strong heat island)391.493.44%399.463.51%412.383.62%
VI (Strong heat island)814.767.15%595.915.23%562.594.94%
V (Normal heat island)1515.0613.30%938.438.24%1069.119.39%
IV (Weak heat island)2511.2722.05%2184.9319.18%1857.2416.31%
III (No heat island)3261.6928.64%3510.930.83%3054.9626.82%
II (Weak cold island)1749.1515.36%1656.3614.54%3130.3827.49%
I (Strong cold island)1145.9910.06%2103.4218.73%1302.7511.44%
Disclaimer/Publisher’s Note: The statements, opinions and data contained in all publications are solely those of the individual author(s) and contributor(s) and not of MDPI and/or the editor(s). MDPI and/or the editor(s) disclaim responsibility for any injury to people or property resulting from any ideas, methods, instructions or products referred to in the content.