Abstract
Maintaining a balance between urban land (UL) expansion and urban population (UP) growth is one of the goals of sustainable development, and maintaining this balance requires more theoretical exploration and regional experience. This paper re-evaluated the imbalances in growth between urban land and urban population (IGULUP) from the perspective of allometric growth and explored its influencing mechanism, taking urban agglomerations (UAs) in China as a case. This paper reveals that the growth rate of UL in China is slightly higher than that of the UP. However, the IGULUP vary according to development stages. UAs in the primary stage and the early growth stage face the dilemma where UL grows faster than the UP. Conversely, for UAs in the later growth stage and the mature stage, the growth rate of the UP is higher than that of UL. Finally, an increase in economic development level, population agglomeration, fiscal expenditure, and urban compactness can help mitigate the gap between UL and UP. In contrast, industrial structure, urbanization level, and foreign direct investment may hinder the improvement of IGULUP by accelerating the rate of land expansion. These findings may make theoretical contributions to the formulation of more targeted land use control policies and urban population growth strategies.
1. Introduction
Imbalances in growth between urban land and urban population (IGULUP) caused by rapid urbanization have been considered central to the sustainability debate [1]. Policymakers and urban planners hope to achieve balanced regional development by promoting the matching and coordination of urban land (UL) and the urban population (UP) in terms of size and growth rate [2]. However, a large number of empirical studies have confirmed that the UL either grows faster than or lags behind the UP [1]. Globally, such growth imbalances will generate a range of problems, such as resource misallocation [3], environmental pollution [4], CO2 emission [5], and social welfare inequality [6]. This is particularly true in developing economies such as China, where urbanization is quite rapid and urban land expansion is expected to accelerate. Hence, quantifying the IGULUP and exploring their impact mechanisms can help formulate more targeted land use control policies and urban planning strategies.
Allometric growth is a concept derived from biology and was originally referred to as the disproportionate growth or development between different subsystems within the same system. This concept emphasizes not only the asynchronous development of the two subsystems, but also their interaction [7]. Hence, it is beneficial for explaining the unbalanced growth of two subsystems within a city [8,9], such as urban population–rural population [10], urban scale–economic output [11], urban scale–infrastructure density, industrial output value–land area, and population size–medical resources [12]. The existing literature uses the coupling coordination model [13,14] and the decoupling model [15] to describe the relationship between UL and the UP. However, such studies only highlight their synergistic growth or decoupling, failing to quantify the possible impact of changes in the UP on UL simultaneously. Although the agglomeration of the UP in one region leads to the expansion of UL [16], they do not always occur at a synchronized rate. Thus, re-examining the IGULUP from the perspective of allometric growth can provide new ideas and methods for evaluating the nonlinear relationship between UL and the UP.
As an open system, increasing intercity connection leads to prominent spatial spillover effects of influencing factors. However, spatial spillover effects are often ignored by mainstream approaches when exploring influencing mechanisms using a linear regression model [17], the Geo-Detector model [18], and the GWR model [19]. Generally speaking, the IGULUP of an area are determined by a combination of socio-economic factors in the local and surrounding areas. In this regard, spatial econometric models that include direct and indirect effects show strong advantages and should be used to explore the driving mechanisms of IGULUP [20]. In addition, research on regional heterogeneity is often based on a single criterion, such as city size, economic development level, or geographical location [21,22]. In fact, due to the large differences in economic power, population size, urban density, concentration, and degree of development, urban agglomerations (UAs) are often divided into different stages of development [23]. As a result, the heterogeneous outcomes of a single taxonomy often lead to policymaking failures. This paper argues that regional heterogeneity of urban development stages, which integrates economic development, population density, and urban comprehensive level, is more conducive to the pertinence and guidance of policymaking.
The purpose of this paper is to assess the IGULUP of UAs in China from the perspective of allometric growth during 2000–2020 and to explore their impact mechanisms, with the aim of achieving sustainable urban construction through land use optimization and population growth policies. UAs refer to a large-scale, multi-core, and multi-level urban consortium composed of cities at different levels in a geographically concentrated manner. They are important growth poles to support and promote China’s economic development. Diverse land development needs and population attraction policies in UAs have given rise to different patterns of IGULUP. Hence, this paper argues that compared with the provincial, national, or global levels, research at the scale of UAs can better achieve spatial balance, efficient allocation of resources, and sustainable development.
This research may offer two possible contributions to the literature. First, the allometric growth model was used to assess the IGULUP to depict both the impact of UP changes on UL and their unbalanced change trend, broadening the understanding of the nonlinear growth between UL and the UP. Second, this paper highlights that the emergence and change in IGULUP are determined by their development stage and the combination of local and non-local socio-economic factors, which complement the research methods and perspectives of influencing mechanisms and regional heterogeneity.
2. Materials and Methods
2.1. Study Area
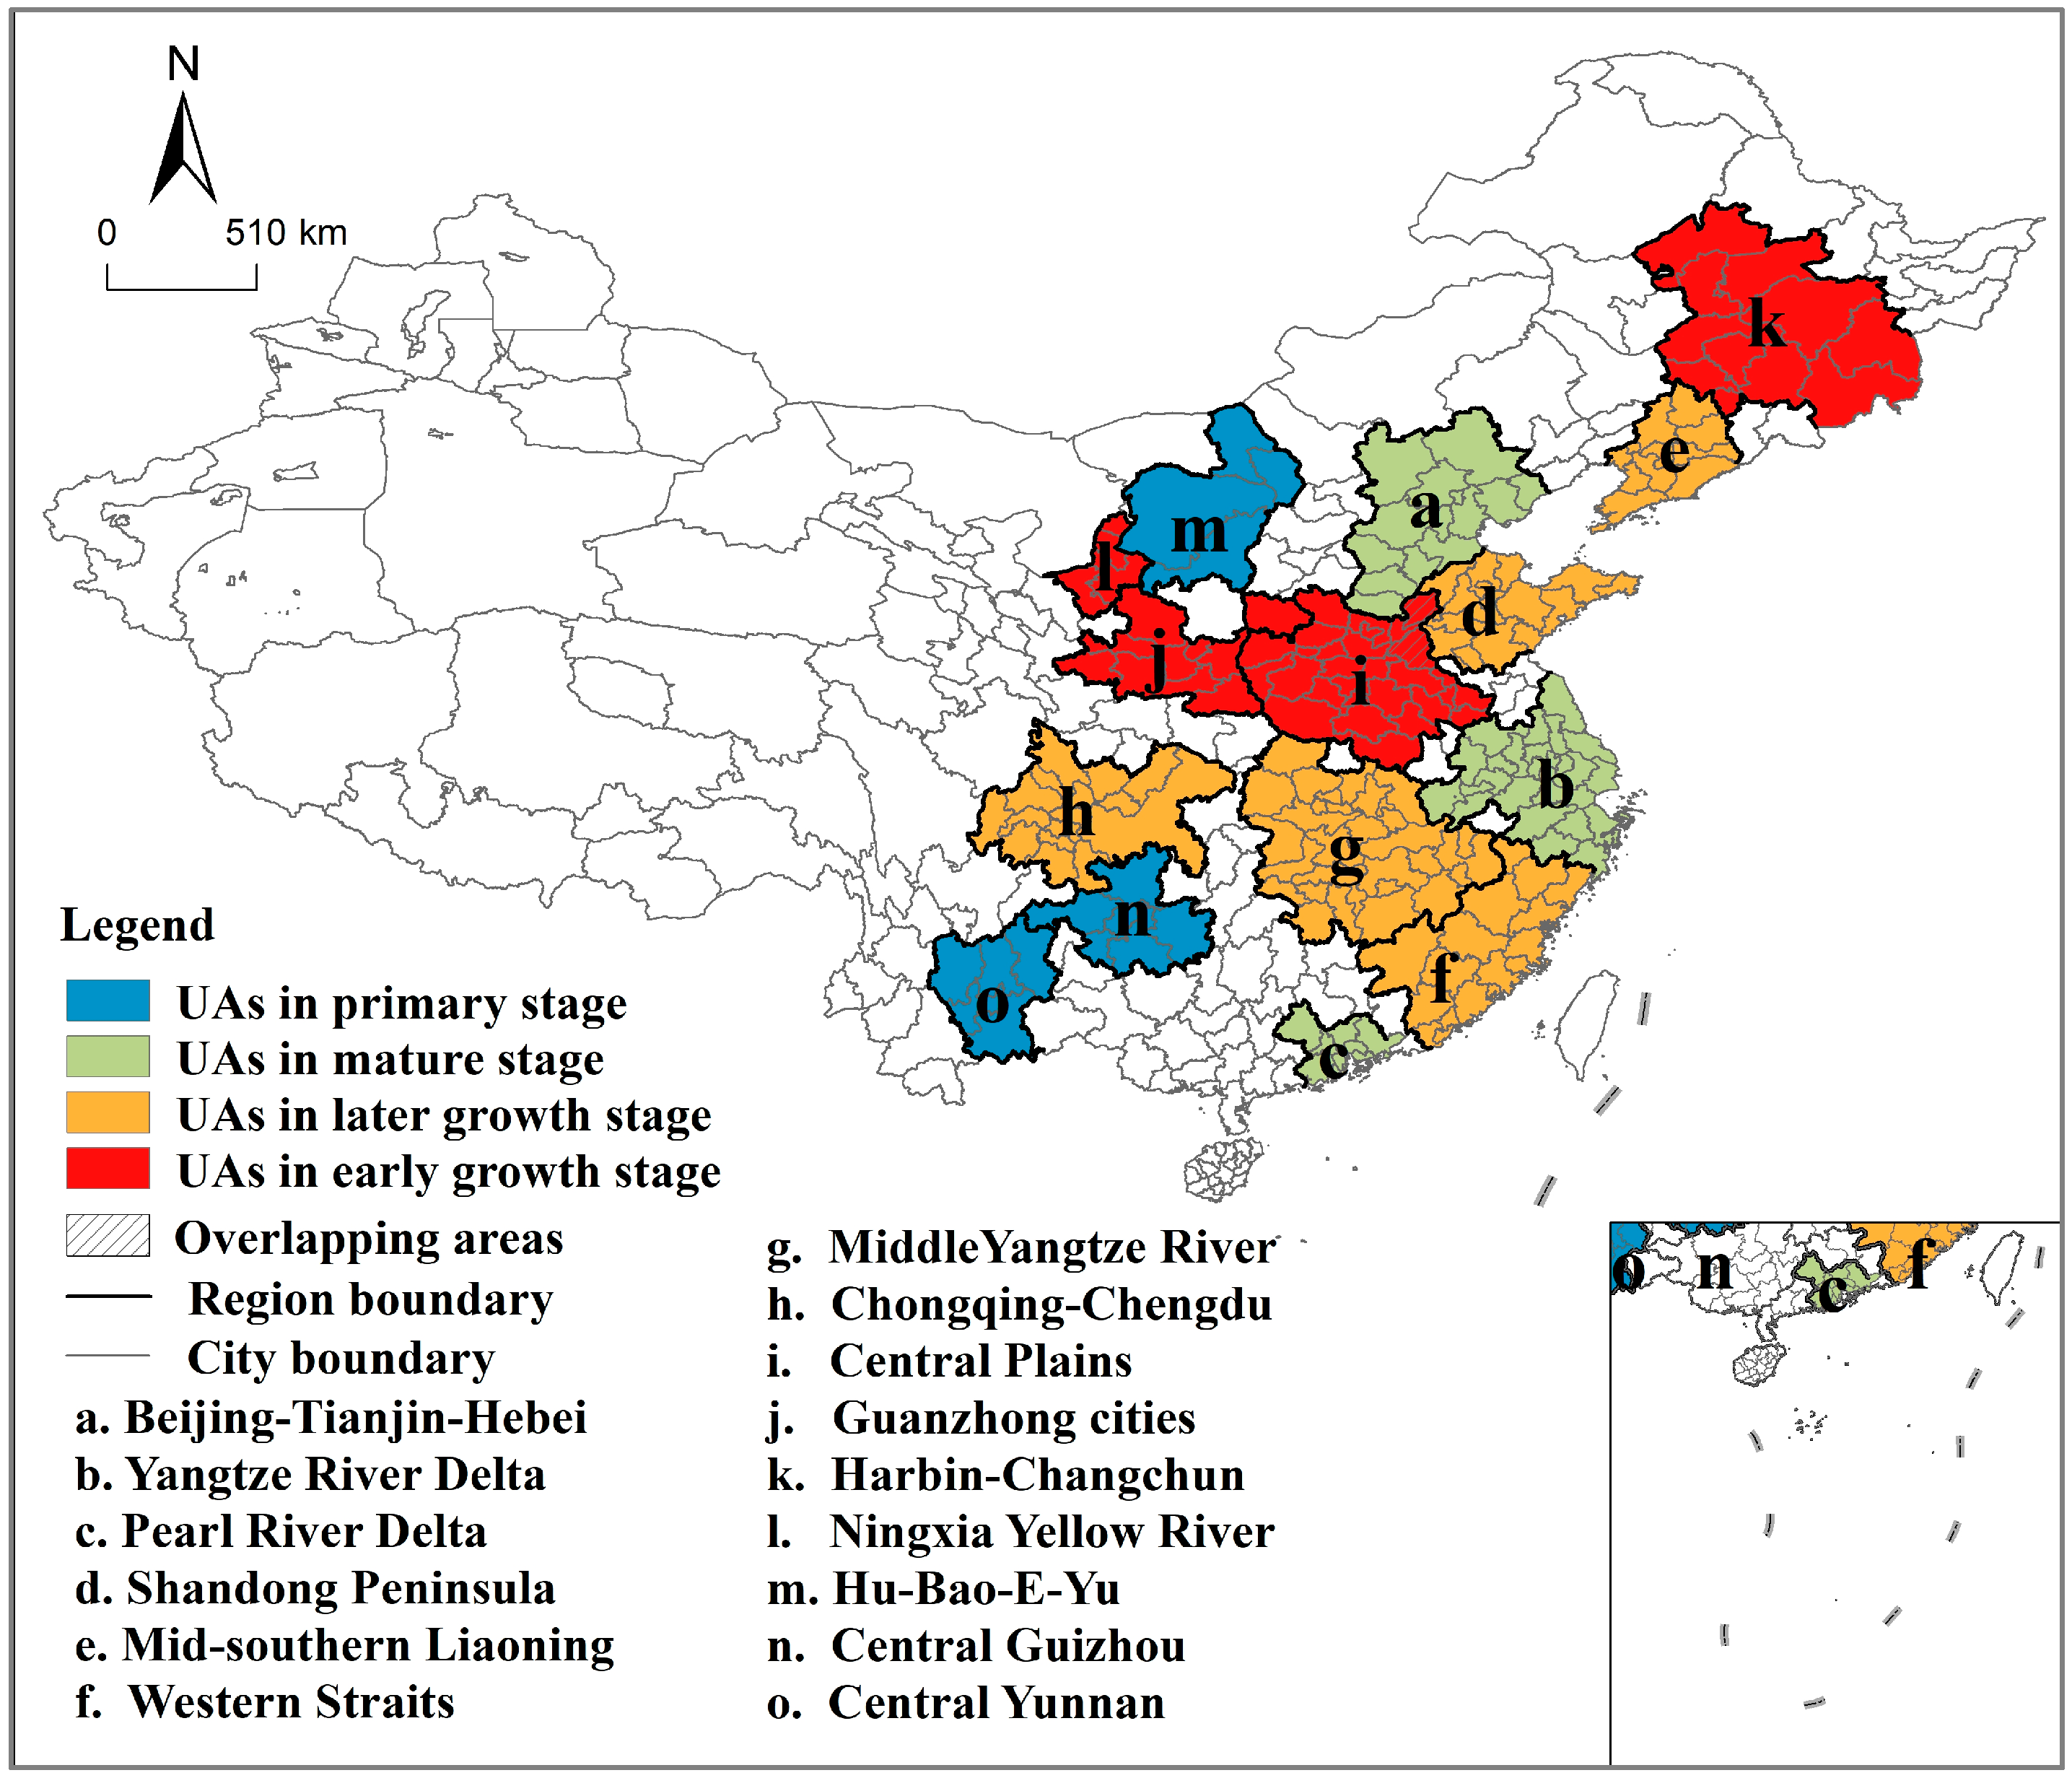
Given the availability and comparability of data, this paper selected 15 UAs in different stages of development (Figure 1), covering the primary stage, the early growth stage, the later growth stage, and the mature stage, according to the results of Fang et al. (2005) [23]. These results were obtained by evaluating the urban development level of UAs.
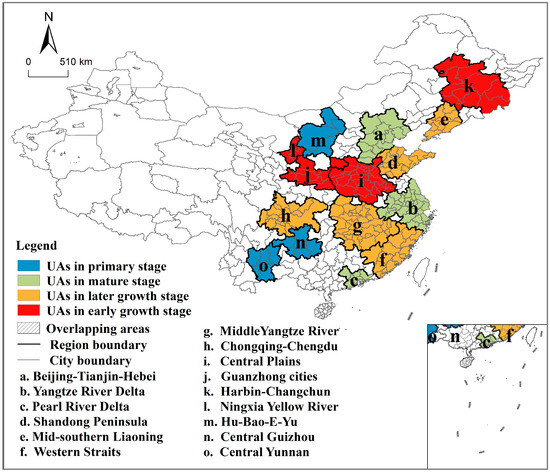
Figure 1.
Study areas.
2.2. Methods
2.2.1. Trend Surface Analysis
Trend surface analysis is a mathematical method that simulates the spatial trend of observed variables with a smooth mathematical surface. This paper utilized trend surface analysis to identify the potential growth direction of UL and the UP, as well as the uncertainty of IGULUP changes. The calculation formula is as follows [24]:
where and are the plane space coordinates of unit , respectively. and are the value of the observed variables and the fitting value of the trend surface unit , respectively. is the residual unit .
2.2.2. Allometric Growth Model
Allometric growth was originally used in biology to describe the relative rate of growth between two parts within an organism, including longitudinal allometric growth and transverse allometric growth. The former emphasizes the variation of allometric growth over a long-term time series, while the latter focuses on the allometric state in the same cross-section of time. This paper used an allometric growth model to evaluate IGULUP. The calculation method is as follows [16]:
where is the proportionality factor; and are the UL and UP at time t, respectively; and is the coefficient of allometric growth, describing the relationship between the growth rate of UL and the UP. In general, if b = 0.85, there is a relatively similar increase in speed between the UP and UL. If b > 0.85, the growth rate of UL is greater than that of the UP. If b < 0.85, the growth rate of UL is less than that of the UP.
2.2.3. Spatial Panel Econometric Model
The influencing factors related to urban development are generally spatially dependent. Since the change in IGULUP in a region are not only affected by local variables, but also by adjacent regions, this paper used a spatial panel econometric model to reveal the influencing mechanism of IGULUP. The formula is as follows [20]:
where and are the value of dependent and independent variables of region at time , respectively; is the spatial weight matrix; , and represent the spatial regression coefficient of the independent variables, the spatial lag coefficient, and the spatial regression coefficient, respectively; and , and are the space effect, the time effect, and the error term, respectively. If = 0, , the formula is the Spatial Panel Lag model (SPLM). If the formula is the Spatial Panel Error model (SPEM). Otherwise, the formula is the Spatial Panel Durbin model (SPDM).
2.2.4. Variables
The dependent variable was the allometric growth coefficient, which was measured by the allometric growth model.
This paper selected seven influencing factors. The reasons for selecting these indicators are described below.
- (1)
- Economic development level (): Rostow’s theory of economic growth stages argues for the key role of economic development in urban growth. A large number of empirical studies also suggest that the higher the in a region, the more prominent the population agglomeration effect [25] and the greater the demand for urban land [26]. Hence, should be an important influencing factor. It was measured by the GDP per capita.
- (2)
- Government expenditure (): As an important embodiment of the marketization of land resource allocation, land finance has become the main source of local government fiscal revenue [27]. In this context, the binding effect of “land finance–real estate–local economy” is becoming increasingly significant, and has accelerated the expansion of UL [28]. In addition, the structure of fiscal spending in economically developed regions that favors social welfare such as housing, education, and health care also has a significant impact on population migration and growth. The ratio of fiscal expenditure to land area was used as a proxy variable.
- (3)
- Population agglomeration (): is a dominant factor affecting land use structure and development intensity. Existing studies have shown that decisions about landscape or land use change are affected by demographic change/growth in time and space. On the one hand, the concentration of a population in a region increases the local demand for land, such as residential, commercial, and public infrastructure land [29]. On the other hand, can generate significant economies of scale, thereby increasing local land use efficiency and economic efficiency, as well as affecting the supply of urban land. The ratio of total population to land area was utilized to measure .
- (4)
- Foreign direct investment (FDI): The impact of globalization on the IGULUP is reflected in FDI. As a capital flow, FDI benefits recipient countries by increasing productivity, stimulating innovation, and providing liquidity. Studies have confirmed that such benefits have a significant positive impact on land expansion and population growth [30]. For example, the number of “development zones” and industrial parks in China doubled in order to receive and attract FDI during the period of 2003–2006. In addition, FDI may also attract more population inflows by creating more and better jobs, and by raising income levels. Hence, FDI was chosen as the main influencing factor.
- (5)
- Urban compactness (): Urban form refers to the spatial structure expressed by various activities in the city. In contrast to urban sprawl, emphasizes high density and mixed land use, which can reduce the need for new land. Existing theoretical and empirical studies on the spatial structure of cities have confirmed that the more compact the city, the more the population is supported by the limited land [31], thus affecting the IGULUP. The ratio of urban land area to perimeter was used to characterize [32].
- (6)
- Industrial structure (): As the embodiment of economic functions, affects the migration of the UP and the transformation of land use. In addition, can effectively improve the efficiency of land allocation through competition and agglomeration effects, thereby reducing the solicitation of new land [33]. Hence, is also a key factor affecting the IGULUP. The ratio of output value of the secondary industry to GDP was used to measure [34].
- (7)
- Urbanization level (): Urbanization, as an engine of national economic growth, has not only attracted a large number of agricultural populations to urban areas, but has also accelerated the expansion of UL. Hence, is considered to be an indispensable factor affecting the IGULUP and can even Granger-cause it [35]. This paper used the ratio of UP to total population to measure .
2.3. Data Source
Land use raster data with 30 m precision came from the Resource and Environment Science and Data Center (RESDC), covering 2000–2020. Socio-economic data were derived from the Chinese Urban Statistical Yearbook (2001–2021).
3. Results
3.1. Spatial Trend Surface Analysis of UA and UP
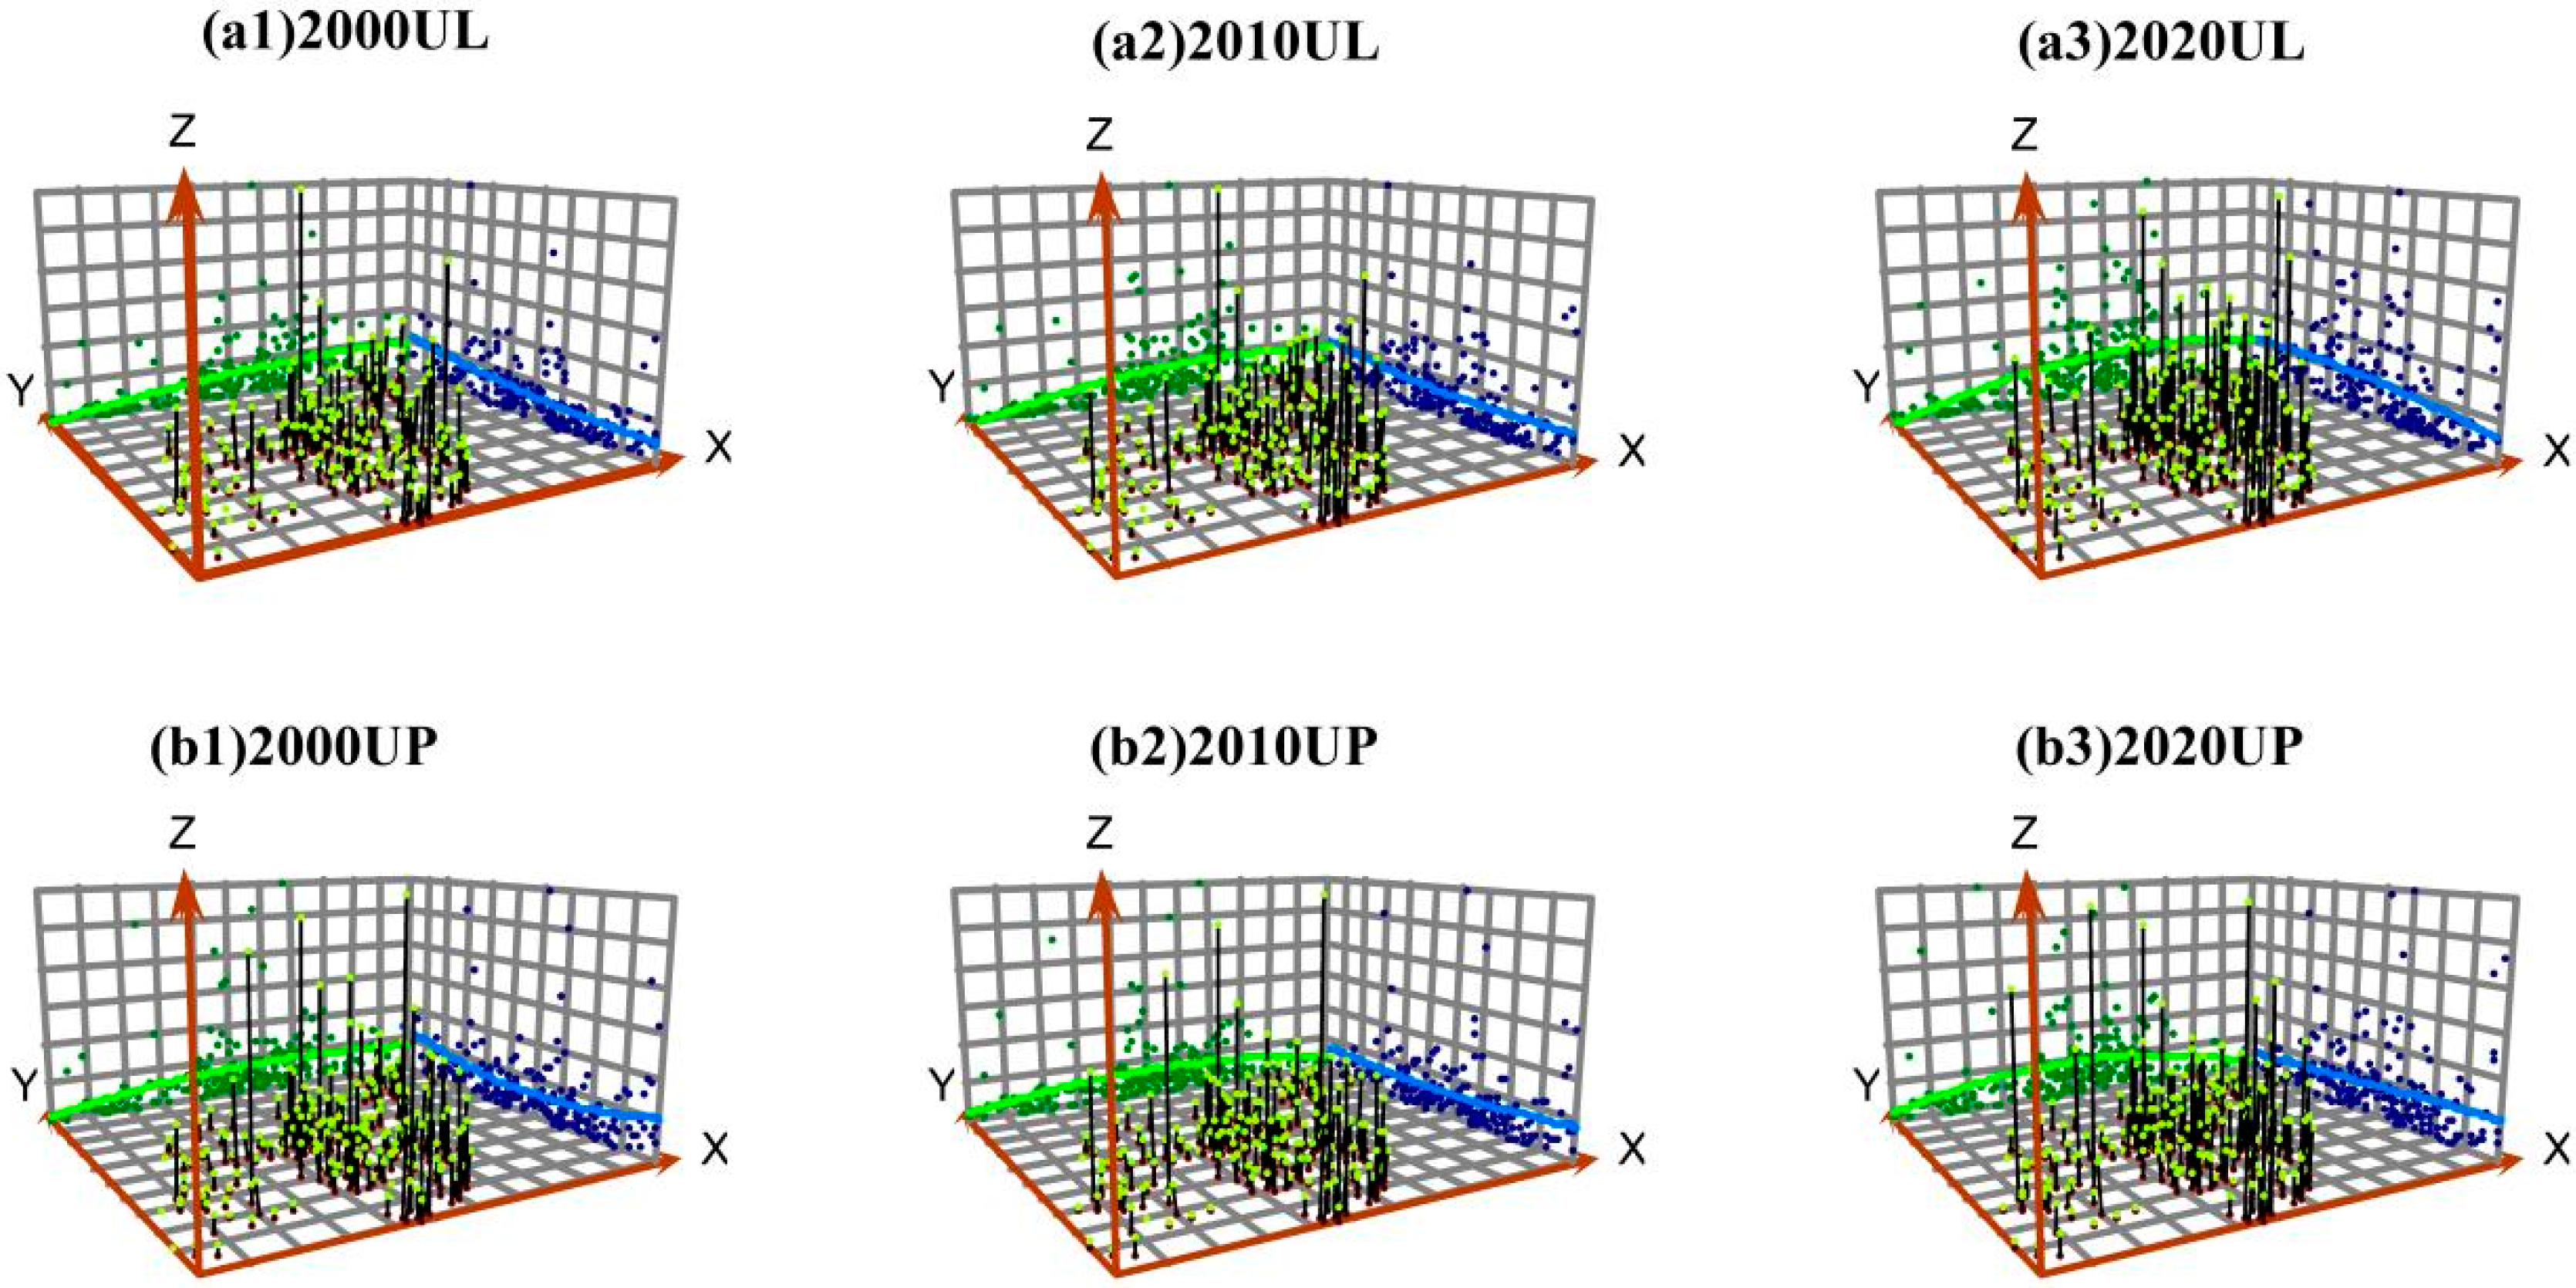
Figure 2 shows the trends in the UL and the UP in China from 2000 to 2020. The X-axis, Y-axis, and Z-axis are displayed in the east–west direction, in the north–south direction, and for the UL areas (or the UP scale), respectively. Overall, there is a significant increasing trend in UL and UP. Specifically, the gap in the UL area is gradually shrinking in the east–west direction and expanding in the north–south direction (Figure 2(a1–a3)). This can be observed from the morphological changes of the curves on the X- and Y-axis, respectively. The curve located on the X-axis changes from straight to U-shaped, while the curve located on the Y-axis changes from U-shaped to straight (Figure 2(a1–a3)). On the contrary, the gap in the size of the UP gradually decreases in the north–south, while widening in the east–west (Figure 2(b1–b3)). Hence, the change in the UA and the UP shows a spatial mismatch that is uncontrolled and unbalanced.
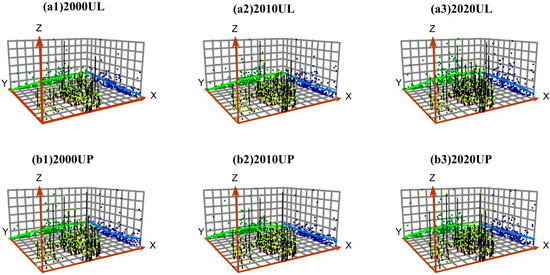
Figure 2.
Trend surface analysis of the UL and the UP from 2000 to 2020.
3.2. Spatiotemporal of IGULUP
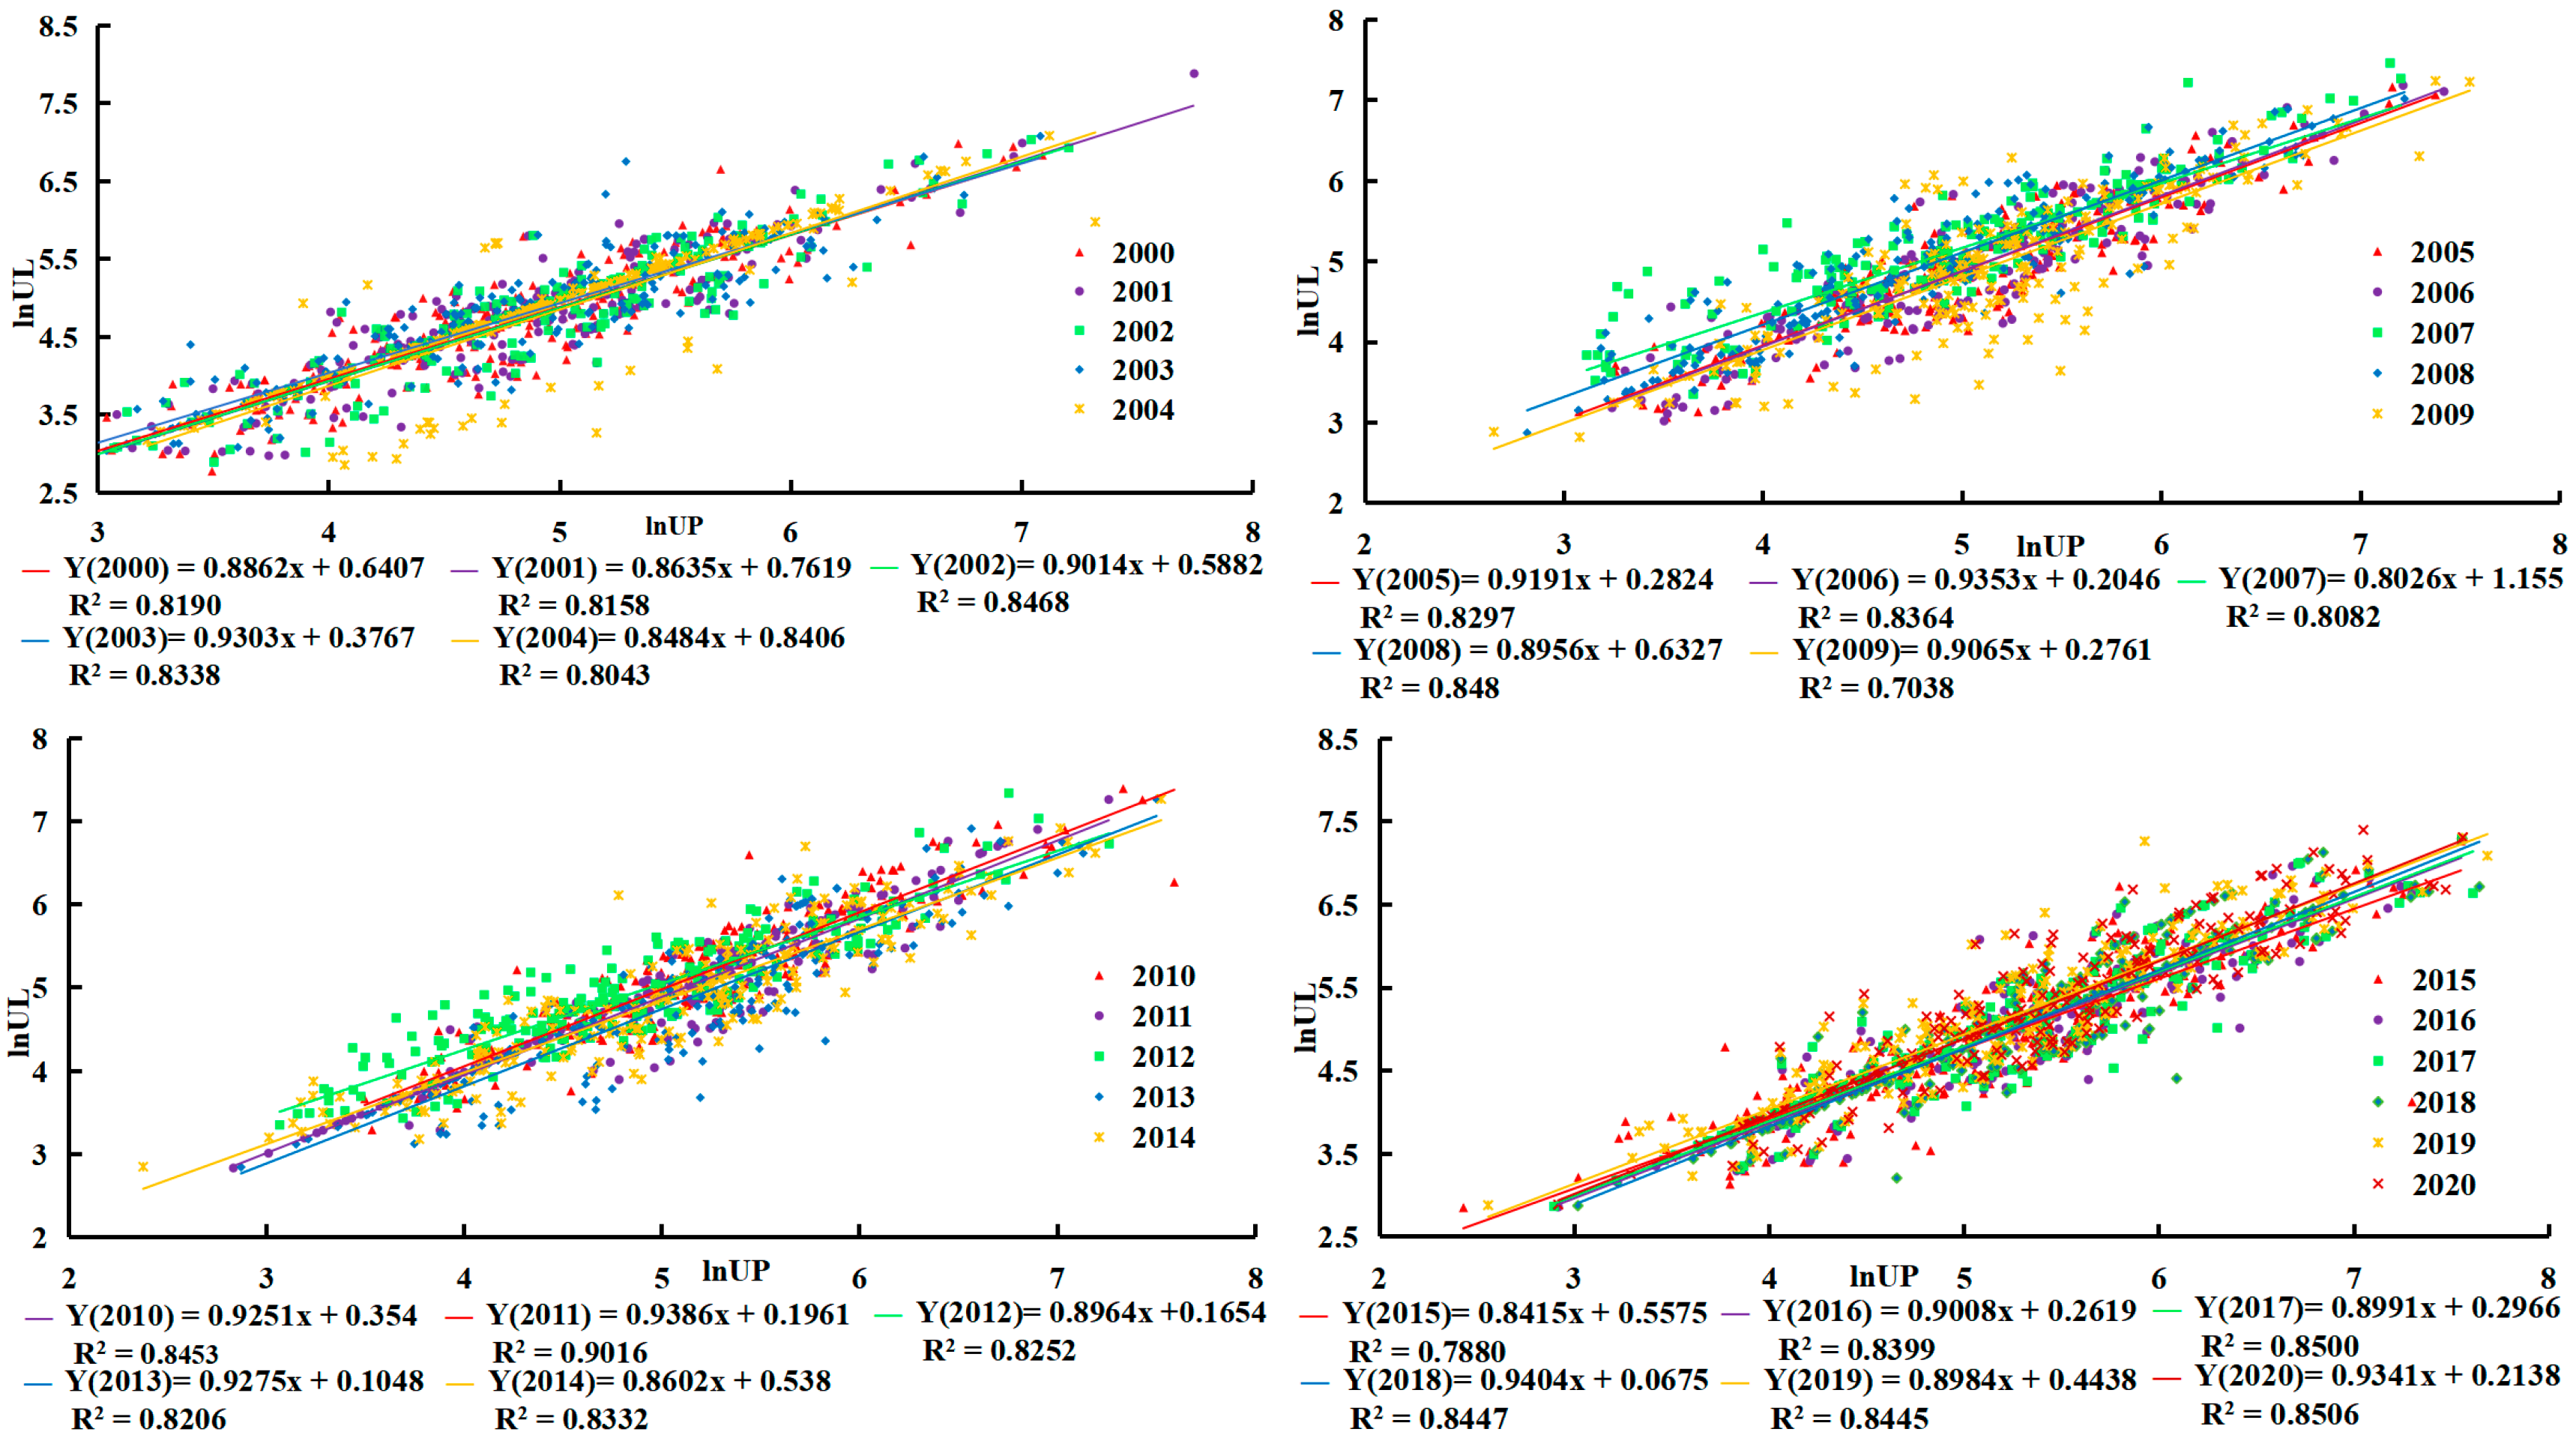
The scatter plots of the UL and the UP for UAs during 2000–2020 are shown in Figure 3, with a clear linear trend. In addition, there is a good fitting effect of the allometric growth model. The variation range of the value of b is [0.8026, 0.9404], reflecting that the growth rate of the UL in China was slightly higher than that of the UP during the study period.
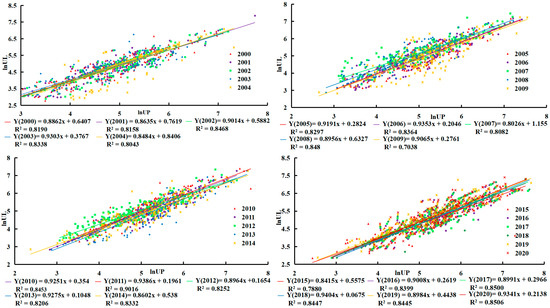
Figure 3.
Allometric scaling laws of the UL and the UP.
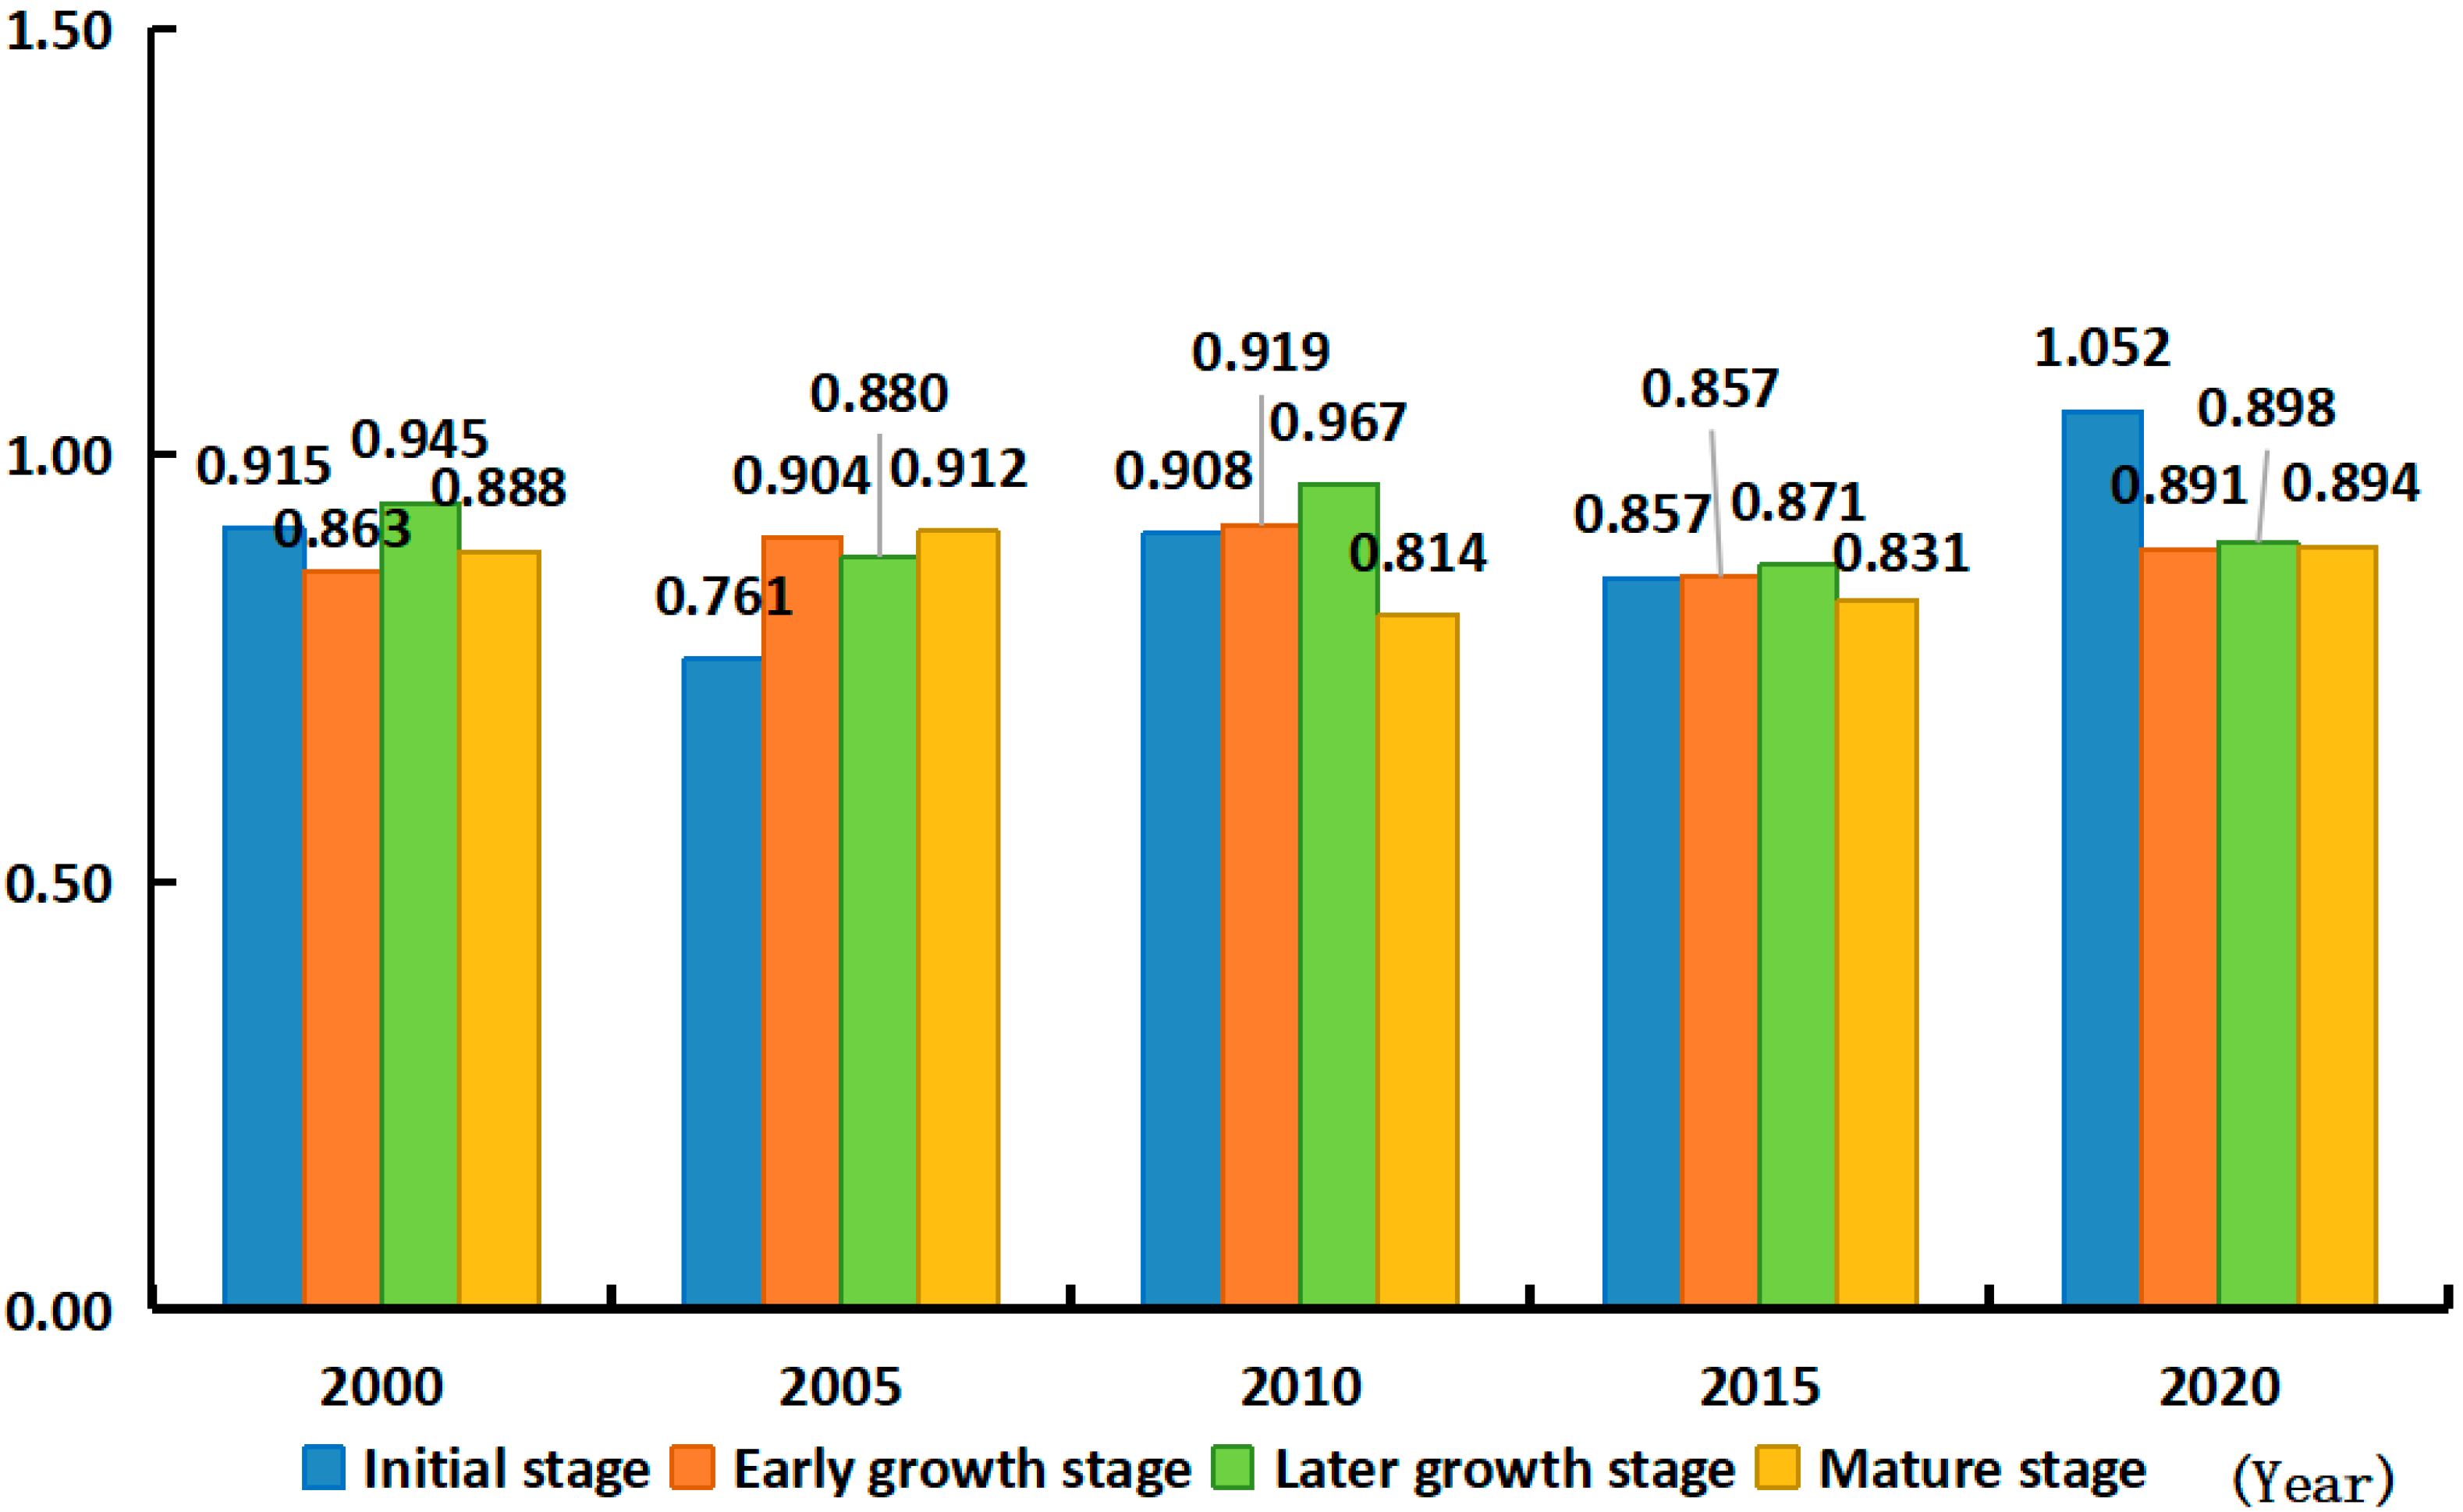
Figure 4 illustrates the spatiotemporal variation of the IGULUP in four different development stages. The allometric growth coefficients fluctuate between the ranges of [0.7178, 1.1110], [0.8125, 0.9755], [0.7322, 1.0400], and [0.8007, 0.9880], respectively, indicating there is a coordinated growth rate between the UL and the UP.
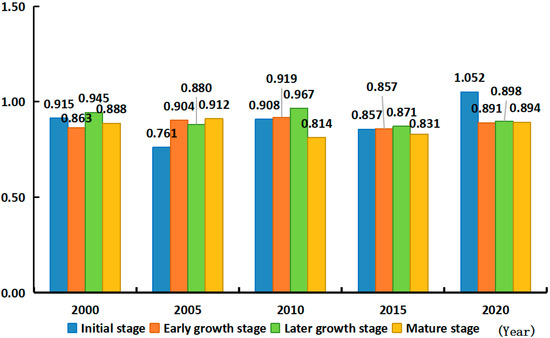
Figure 4.
Changes in the IGULUP at different stages of development.
3.3. Analysis of Influencing Factors
The variance inflation factor (VIF) of variables is less than five, indicating that there is significant independence between the variables. This paper performed a series of tests to determine the optimal model (Table 1). First, the coefficients of the Lagrange multiplier , and are at the 1% significance level, while the p value of the error is greater than 0.01 (column 3 in Table 1), indicating that there is significant spatial dependence among the influencing factors. Second, the coefficients of the and the likelihood ratio () tests are significant, with , showing that the SPDM is the most suitable model for exploring the impact mechanisms. This paper used the same method to identify and test the estimation models of UAs located in different development stages in order to analyze the internal differences of the IGULUP. The results show that the SPDM of spatial fixed effects is the optimal model.

Table 1.
Test results of the spatial panel econometric model.
Table 2 reports the results of the SPDM without fixed effects (Column 3 in Table 2), spatial fixed effects (Column 4 in Table 2), and individual fixed effects for non-spatial panel models (Column 2 in Table 2), respectively. The coefficients of , , , and are negative at the significance level of 1%, which illustrates that with an increase in , , and , the coefficient of allometric growth will decline. Hence, the IGULUP are expected to be mitigated and improved. Specifically, the coefficients of are −0.323 and −0.102 in column 2 and 4, respectively, with p < 0.01. This result indicates that when ignoring the spatial spillover effect, and with an increase in of 1%, the value of will decrease by 0.323%, which is 3.17 times that of the result that considers the spatial spillover effect. Thus, in practice, the IGULUP of a region are influenced not only by local factors, but also by adjacent regions. The coefficients of , and are positive at the significance level of 1%. In other words, an increase in FDI, and will accelerate the rate of urban land expansion, thus exerting greater pressure on the coordinated development of people and land.

Table 2.
Regression results of the panel model and the SPDM with fixed effects.
Table 3 reports the direct, indirect, and total effects of the influencing factors. The coefficients of the total effects of , , , and are −0.346, −0.445, −0.417, and −0.419, respectively, with p < 0.01. This means that an increase in , , and would decrease the value of . Conversely, the coefficients of , and are 0.260, 0.480, and 0.366, respectively, illustrating that I, and will increase the IGULUP by accelerating the rate of land expansion.

Table 3.
Direct, indirect, and total effects.
Specifically, with a 1% increase in , the value of will increase by 0.260%. Among them, the IGULUP of local and surrounding areas will increase by 0.124% and 0.136%, respectively. The results show that although FDI contributes to the fiscal revenue of the local government, it will exacerbate the IGULUP of both the local and surrounding areas. Moreover, the positive effect of FDI on the surrounding areas is greater than that on the local areas. FDI promotes a large amount of land located in the periphery of the city to be developed at a low price, which is manifested as a spatial driving effect. As the and increase by 1%, the allometric growth coefficient will increase by 0.480% and 0.366%, respectively. Hence, industrial structure and rapid urbanization do not always contribute to the balanced growth of cities. Conversely, cities are likely to fall into the trap of over-consuming resources.
In addition, with a 1% growth in , the value of will decrease by 0.346%, including a direct decline of 0.306% and an indirect decline of 0.040%, respectively. Regions with higher economic levels will improve the land use efficiency of the local and surrounding areas, which is conducive to mitigating the IGULUP. Similarly, with an increase in of 1%, the value of will decline 0.417%, which includes a direct decrease of 0.413% and an indirect decrease of 0.004%, respectively. With a 1% growth in , the value of will decline by 0.445%, and the coefficients of direct and indirect effects will be −0.352% and −0.093%, respectively. As the urban compactness increases by 1%, the value of will decline by 0.419%, which involves a 0.287% decline in local areas and a 0.132% decline in the surrounding areas, respectively. The more compact a region is, the lower the demand for UL, and the slower the rate of UL expansion. As such, this supports the view that fragmented urban forms have the potential to hinder sustainable urban construction. Conversely, the higher the degree of population agglomeration in a region, the smaller the per capita construction land area. This will reduce the land cost of increasing population urbanization.
Table 4 reports the results of the influencing mechanisms of the IGULUP at different development stages. In general, has a negative effect on the allometric growth coefficient, while the shows a positive effect. has the greatest inhibitory effect on the allometric growth coefficient of urban agglomerations located in the early development stage, followed by UAs located in the mature stage, the primary stage, and the later growth stage. Specifically, as increases by 1%, the allometric growth coefficient will decline by −0.630%, −0.934%, 0.587%, and 0.809% in UAs located in the four stages of development, respectively, including a −0.469%, −0.613%, −0.343%, and −0.504% direct decline, and a −0.161%, −0.321%, −0.244%, and −0.305% indirect decline, respectively. By attracting the inflow of the rural population, the economic level of cities can help narrow the IGULUP.

Table 4.
Direct, indirect, and total effect of different development stages.
As increases by 1%, b will decline by 0.660%, 0.399%, 0.302%, and 0.8589% in UAs, respectively, including a 0.596%, 0.112%, 0.253%, and 0.307% direct increase, and a 0.064%, 0.287%, 0.049%, and 0.282% indirect increase, respectively. In addition, and have a negative impact on b, except for UAs located in the early growth stage. and have a positive impact on UAs located in the primary and early stages of development, and inhibit UAs located in the later growth stage and the mature stage. will not only contribute to the economic and social development of cities, but also promote the construction of urban infrastructure.
4. Discussion
4.1. Explanation of Findings
The results of the allometric growth model show that the growth rate of the UL in China’s UAs is slightly higher than that of the UP. Some existing studies which measured the coordination of human–land relations in Chinese cities by the ratio of UL to UP have also reached the same conclusion [15,36]. Incentives for the promotion of government officials [37] and increasing competition pressure among regions in China have increased the dependence of local governments on land finance [38], which may lead to a sharp expansion of UL [39]. In addition, due to geographical proximity, there may be a strategic imitation of governments at the same level in an effort to pursue their short-term political goals [40]. These phenomena may easily lead to a low-level duplication of construction, which may increase the intensity of urban land expansion beyond the actual demand for population or industrial development.
IGULUP vary according to the development stage of UAs, which is similar to other findings that focus on development heterogeneity [41]. Differences in urban planning, land use policies, and national strategic orientation due to different urban development stages are the main factors affecting population and land imbalance [42]. For example, the UAs with the most severe imbalances are those located in the mature and later growth stages, such as the Yangtze River Delta, the Beijing-Tianjin-Hebei, and the Pearl River Delta. The reason behind this may be that although the land market in these regions is relatively saturated, it has a strong demographic attraction [43], leading to the blind expansion of the peripheral areas with relatively low land prices [44].
4.2. The Influence Mechanism of IGULUP
The findings of this paper confirm that all influencing factors have significant spatial spillover effects. In other words, the change in the IGULUP in a region is not only determined by local socio-economic factors, but also by the surrounding areas to a certain extent, which further highlights the importance of geospatial factors in New Economic Geography. In the process of urban development, production factors such as population will spontaneously concentrate in developed areas, while backward areas face the outflow of these factors [43], resulting in IGULUP. Hence, policies to achieve balanced growth between UL and the UP can be both local and non-local.
Overall, the increases in , and are conducive to improving the phenomenon whereby the growth rate of UL is greater than that of the UP. Previous literature has confirmed that economies of scale generated by economies and population agglomeration can decouple urban growth from land resource consumption [45]. In addition, can alleviate the conflict between limited land resource constraints and grow the urban population by improving urban land use efficiency. Hence, reducing the demand for new land by increasing economic density and , as well as strengthening , can be a universal strategy for governments to ameliorate such an imbalance.
Conversely, , and will exacerbate the dilemma of the imbalance in which the growth rate of UL is greater than that of the UP. This may be due to the fact that FDI can be effectively translated into economic and political incentives for construction land, which in turn drive urban sprawl [30]. Similar results can be found by Zhao, Bai, and Wang, 2018 [35]. However, unlike Wang et al., 2023 [46], Liu et al., 2021 [47], and Cheng et al., 2023 [48], who argued that and could alleviate conflicts over UL and UP through improving land use efficiency, we observed the negative impacts of and . The reason behind this is that does not always significantly reduce the demand for new construction land for urban development according to the theory of diminishing returns to land [33,49]. The rapid development of urbanization is always facing increasingly fierce industrial competition, which will weaken the agglomeration effect, increase the congestion effect, and thus reduce land use efficiency. Hence, it is crucial to identify the optimal scale of inputs for land use to improve the IGULUP.
There are differences in the influencing mechanisms of the IGULUP at different development stages, which are directly related to the development status and policy orientation of the UAs at that time [50,51]. For example, and have a positive impact on the allometric growth coefficient of UAs located in the primary and early growth stages and inhibit that of UAs located in the later growth and mature stages. Specifically, for UAs located in the primary and early growth stages, the and FDI will lead to a disproportionate increase in land use efficiency [52]. Conversely, the complexity of urban functions in UAs located in the later development and mature stages can decouple urban growth from urban land area [53,54]. Hence, policies that integrate the urban development stage can help alleviate or ameliorate such imbalances.
4.3. Advantages, Limitation and Future Directions
The possible contribution to the literature is twofold. First, this study re-examines the IGULUP from the perspective of allometric growth, which expands the application of allometric growth in urban geography. The allometric growth coefficient not only emphasizes the matching degree between UL and the UP, but also reflects the impact of the UP on UL. Hence, this study argues that sustainable urban growth is not a matter of simply controlling the scale or speed of urban land development, as traditionally believed, but of aligning the rate of expansion with population growth.
Second, this paper reveals that the development stage and a combination of local and non-local socio-economic factors jointly determine the changes in the IGULUP. For example, as increases by 1%, the allometric growth coefficient will decline by −0.630%, −0.934%, 0.587%, and 0.809% at four stages of development, respectively, including a −0.469%, −0.613%, −0.343%, and −0.504% direct decline, and a −0.161%, −0.321%, −0.244%, and −0.305% indirect decline, respectively. Therefore, policy formulation needs to integrate local, non-local, and developmental impacts.
There are several areas that require further research. First, 0.85 is used as the scale value of the allometric growth coefficient according to existing research, ignoring its universality and rationality. Second, the spatiotemporal evolution of IGULUP may depend on the height of urban buildings and the interaction among influencing factors. Therefore, future research can also use remote sensing data and the Geo-Detector method to investigate issues related to urban sustainability. Finally, although economic development or urbanization can alter the development level of urban agglomerations, the development stage of an urban agglomeration is considered to remain constant in order to maintain the unity of the research units. For example, if YRD was in the mature stage in 2020, it will always be in the mature stage during the study period. Hence, it may be more empirical to discuss the IGULUP and the influencing mechanisms in the context of the changing development stage of UAs.
4.4. Policy Implications
The paper has three policy implications. First, optimizing the spatial allocation of land should be prioritized. UAs located in the primary stage and the early development stage tend to face the dilemma of inefficient use of high-quality construction land and the outflow of a population. However, UAs located in the later growth stage and the mature stage are facing conflicts between overcrowding and land scarcity. Therefore, optimizing the spatial allocation of land through the establishment of cross-regional cooperation mechanisms or land use right purchase policies may be key approaches to improve this imbalance.
Second, the scale and spatial layout of urban expansion should be strictly controlled by determining differentiated per capita construction land standards. Linking urban expansion boundaries to the size and speed of permanent residents and new agricultural migrants can be an effective way to alleviate the intensification of urban construction expansion caused by economic development or blind competition among regions.
Finally, a comprehensive urban development strategy that crosses administrative divisions should by integrated in the urban development stage. The results of the spatial econometric model verify the spatial spillover effect of the influencing factors. The difference in direct and indirect effects at different development stages leads to the spatiotemporal evolution of the IGULUP. Hence, it is necessary to strengthen cross-regional linkages.
5. Conclusions
This paper assesses the IGULUP of UAs in China during 2000–2020 and then investigates their influencing mechanisms. This paper has three conclusions. First, there is an increase in the UL and the UP in China, while the scale changes of UL and the UP in different directions exhibit different characteristics. Second, the growth rate of UL was slightly higher than that of the UP during the study period at the national level. UAs located in the primary stage and the early growth stage are facing the dilemma where UL grows faster than the UP. Conversely, for UAs in the later growth stage and the mature stage, the growth rate of the UP is higher than that of UL. Third, an increase in , , and could lead to a decline in the allometric growth coefficient, while , and will increase IGULUP by accelerating the rate of land expansion.
Author Contributions
Methodology, W.Q.; Software, W.Q.; Validation, X.H. and S.Y.; Investigation, W.Q.; Writing—original draft, W.Q. and X.H.; Funding acquisition, W.Q. and S.Y. All authors have read and agreed to the published version of the manuscript.
Funding
This research was funded by National Natural Science Foundation of China with grant number 42301231; Humanity and Social Science Youth Foundation of Ministry of Education of China with grant number 23YJCZH282; Zhejiang Provincial Natural Science Foundation of China with grant number ZCLQ24D0101; Public Welfare Technology Application Research Project of Jinhua with grant number 2023-4-029; Startup Foundation for Introducing Talent of NUIST with grant number 1093142301015.
Data Availability Statement
The data presented in this study are available on request from the corresponding author, the data are not publicly available due to project confidentiality.
Conflicts of Interest
The authors declare no conflict of interest.
References
- Mahtta, R.; Fragkias, M.; Güneralp, B.; Mahendra, A.; Reba, M.; Wentz, E.A.; Seto, K.C. Urban land expansion: The role of population and economic growth for 300+ cities. npj Urban Sustain. 2022, 2, 5. [Google Scholar] [CrossRef]
- Qiao, W.; Huang, X. Assessment the urbanization sustainability and its driving factors in Chinese urban agglomerations: An urban land expansion—Urban population dynamics perspective. J. Clean. Prod. 2024, 449, 141562. [Google Scholar] [CrossRef]
- Gao, F.; Lin, Y.; Zhang, X.; Li, S.; Lv, Y. Interconnectedness between land resource misallocation and environmental pollution: Exploring the sustainable development potential in China. Resour. Policy 2023, 86 Pt B, 104156. [Google Scholar] [CrossRef]
- Wang, Y.; Fan, J.; Liu, D.; Fu, J.; Ding, L.; Zhang, J. Air pollution outcomes, land misallocation, and the transmission through urban sprawl. J. Environ. Manag. 2023, 345, 118730. [Google Scholar] [CrossRef] [PubMed]
- Qiao, W.; Hu, B.; Kattel, G.R.; Liu, J. Impact of urbanization on net carbon sink efficiency in economically developed area: A case study of the Yangtze River Delta urban agglomeration, China. Ecol. Indic. 2023, 157, 111211. [Google Scholar] [CrossRef]
- Zhang, D. Understanding mobility inequality through the lens of economic welfare: The difference in willingness-to-pay and actual fare matters. Cities 2023, 132, 104121. [Google Scholar] [CrossRef]
- He, J.-H.; Huang, Z. A novel model for allometric scaling laws for different organs. Chaos Solitons Fractals 2006, 27, 1108–1114. [Google Scholar] [CrossRef]
- Batty, M. The size, scale, and shape of cities. Science 2008, 319, 769–771. [Google Scholar] [CrossRef]
- Bettencourt, L.M.A. The origins of scaling in cities. Science 2013, 340, 1438–1441. [Google Scholar] [CrossRef]
- Xu, F.; Gu, J.; Liu, B. Study on the development phase of urbanization in Hunan province based on allometric analysis of urban and rural population. J. Urban Stud. 2018, 39, 24–29. [Google Scholar]
- Dong, L.; Wang, H.; Zhao, H.R. The definition of city boundary and scaling law. Acta Geogr. Sin. 2017, 72, 213–223. [Google Scholar] [CrossRef]
- Yu, S.G.; Peng, X.H. Analysis on the allometric scaling for urban healthcare service in China. Chin. Health Econ. 2016, 35, 54–56. [Google Scholar]
- Shi, J.-G.; Liu, M.; Duan, K. Spatiotemporal evolution of coupling coordination in population-land relationship and its influencing factors: A case study of 26 main cities in Yangtze River Delta, China. Phys. Chem. Earth Parts A/B/C 2022, 128, 103247. [Google Scholar] [CrossRef]
- Liu, S.; Ma, L.; Yao, Y.; Cui, X. Man-land relationship based on the spatial coupling of population and residential land—A case study of Yuzhong County in Longzhong Loess Hilly Region, China. Land Use Policy 2022, 116, 106059. [Google Scholar] [CrossRef]
- Cai, E.; Zhang, S.; Chen, W.; Li, L. Spatio–temporal dynamics and human–land synergistic relationship of urban expansion in Chinese megacities. Heliyon 2023, 9, e19872. [Google Scholar] [CrossRef]
- Chen, Y. Multi-scaling allometric analysis for urban and regional development. Phys. A Stat. Mech. Its Appl. 2017, 465, 673–689. [Google Scholar] [CrossRef]
- Xu, F.; Wang, Z.; Chi, G.; Zhang, Z. The impacts of population and agglomeration development on land use intensity: New evidence behind urbanization in China. Land Use Policy 2020, 95, 104639. [Google Scholar] [CrossRef]
- Wu, B.; Fu, Z.; Fu, B.; Yan, C.; Zeng, H.; Zhao, W. Dynamics of land cover changes and driving forces in China’s drylands since the 1970 s. Land Use Policy 2024, 140, 107079. [Google Scholar] [CrossRef]
- Gao, C.; Feng, Y.; Tong, X.; Lei, Z.; Chen, S.; Zhai, S. Modeling urban growth using spatially heterogeneous cellular automata models: Comparison of spatial lag, spatial error and GWR. Comput. Environ. Urban Syst. 2020, 81, 101459. [Google Scholar] [CrossRef]
- Qiao, W.; Huang, X. The impact of land urbanization on ecosystem health in the Yangtze River Delta urban agglomerations, China. Cities 2022, 130, 103981. [Google Scholar] [CrossRef]
- Gao, B.; Huang, Q.; He, C.; Sun, Z.; Zhang, D. How does sprawl differ across cities in China? A multi-scale investigation using nighttime light and census data. Landsc. Urban Plan. 2016, 148, 89–98. [Google Scholar] [CrossRef]
- Feng, Y.; Wang, X.; Du, W.; Liu, J.; Li, Y. Spatiotemporal characteristics and driving forces of urban sprawl in China during 2003–2017. J. Clean. Prod. 2019, 241, 118061. [Google Scholar] [CrossRef]
- Fang, C.L.; Song, J.T.; Zhang, Q. The formation, development and spatial heterogeneity patterns for the structures system of urban agglomerations in China. Acta Geograph. Sin. 2005, 60, 827–840. [Google Scholar]
- Lu, X.; Zhang, Y.; Lin, C.; Wu, F. Analysis and comprehensive evaluation of sustainable land use in China: Based on sustainable development goals framework. J. Clean. Prod. 2021, 310, 127205. [Google Scholar] [CrossRef]
- Wang, C.; Liu, H.; Zhang, M. Exploring the mechanism of border effect on urban land expansion: A case study of Beijing-Tianjin-Hebei region in China. Land Use Policy 2020, 92, 104424. [Google Scholar] [CrossRef]
- Zhu, C.; Zhang, X.; Wang, K.; Yuan, S.; Yang, L.; Skitmore, M. Urban–rural construction land transition and its coupling relationship with population flow in China’s urban agglomeration region. Cities 2020, 101, 102701. [Google Scholar] [CrossRef]
- Wu, F. Land financialisation and the financing of urban development in China. Land Use Policy 2019, 112, 104412. [Google Scholar] [CrossRef]
- Egidi, G.; Cividino, S.; Quaranta, G.; Alhuseen, A.; Salvati, L. Land mismatches, urban growth and spatial planning: A contribution to metropolitan sustainability. Environ. Impact Assess. Rev. 2020, 84, 106439. [Google Scholar] [CrossRef]
- Sumari, N.S.; Cobbinah, P.B.; Ujoh, F.; Xu, G. On the absurdity of rapid urbanization: Spatio-temporal analysis of land-use changes in Morogoro, Tanzania. Cities 2020, 107, 102876. [Google Scholar] [CrossRef]
- Ding, H.; Ni, B.; Xue, C.; Zhang, X. Land holdings and outward foreign direct investment: Evidence from China. J. Int. Money Financ. 2022, 124, 102630. [Google Scholar] [CrossRef]
- Peng, J.; Liu, Y.; Wu, J.; Lv, H.; Hu, X. Linking ecosystem services and landscape patterns to assess urban ecosystem health: A case study in Shenzhen City, China. Landsc. Urban Plan. 2015, 143, 56–68. [Google Scholar] [CrossRef]
- Li, X.; Lao, C.; Liu, X.; Chen, Y. Coupling urban cellular automata with ant colony optimization for zoning protected natural areas under a changing landscape. Int. J. Geogr. Inf. Sci. 2011, 25, 575–593. [Google Scholar] [CrossRef]
- Lu, X.H.; Chen, D.; Kuang, B. Indicator system design and regional difference of urban land use efficiency under the background of regional integration. China Popul. Resour. Environ. 2018, 28, 102–110. [Google Scholar]
- Wang, S.; Li, C.; Zhou, H. Impact of China’s economic growth and energy consumption structure on atmospheric pollutants: Based on a panel threshold model. J. Clean. Prod. 2019, 236, 117694. [Google Scholar] [CrossRef]
- Zhao, Z.; Bai, Y.; Wang, G.; Chen, J.; Yu, J.; Liu, W. Land eco-efficiency for new-type urbanization in the Beijing-Tianjin-Hebei Region. Technol. Forecast. Soc. Chang. 2018, 137, 19–26. [Google Scholar] [CrossRef]
- Zhao, J.; Xiao, Y.; Sun, S.; Sang, W.; Axmacher, J.C. Does China’s increasing coupling of ‘urban population’ and ‘urban area’ growth indicators reflect a growing social and economic sustainability? J. Environ. Manag. 2022, 301, 113932. [Google Scholar] [CrossRef]
- Li, H.; Zhou, L.-A. Political turnover and economic performance: The incentive role of personnel control in China. J. Public Econ. 2005, 89, 1743–1762. [Google Scholar] [CrossRef]
- Fan, X.; Qiu, S.; Sun, Y. Land finance dependence and urban land marketization in China: The perspective of strategic choice of local governments on land transfer. Land Use Policy 2020, 99, 105023. [Google Scholar] [CrossRef]
- Chen, D.; Li, Y.; Zhang, C.; Zhang, Y.; Hou, J.; Lin, Y.; Wu, S.; Lang, Y.; Hu, W.; Chen, D.; et al. Regional coordinated development policy as an instrument for alleviating land finance dependency: Evidence from the urban agglomeration development. Land Use Policy 2024, 143, 107182. [Google Scholar] [CrossRef]
- Chen, D.; Li, Y.; Hu, W.; Lang, Y.; Zhang, Y.; Cheng, C. Uncovering the influence of land finance dependency on inter-city regional integration: An explanatory framework integrating time-nonlinear and spatial factors. Land Use Policy 2024, 144, 107207. [Google Scholar] [CrossRef]
- Schiavina, M.; Melchiorri, M.; Corbane, C.; Florczyk, A.J.; Freire, S.; Pesaresi, M.; Kemper, T. Multi-scale estimation of land use efficiency (SDG 11.3.1) across 25 years using global open and free data. Sustainability 2019, 11, 5674. [Google Scholar] [CrossRef]
- Jia, M.; Liu, Y.; Lieske, S.N.; Chen, T. Public policy change and its impact on urban expansion: An evaluation of 265 cities in China. Land Use Policy 2020, 97, 104754. [Google Scholar] [CrossRef]
- Ruan, L.; He, T.; Xiao, W.; Chen, W.; Lu, D.; Liu, S. Measuring the coupling of built-up land intensity and use efficiency: An example of the Yangtze River Delta urban agglomeration. Sustain. Cities Soc. 2022, 87, 104224. [Google Scholar] [CrossRef]
- Li, Y.; Kong, X.; Zhu, Z. Multiscale analysis of the correlation patterns between the urban population and construction land in China. Sustain. Cities Soc. 2020, 61, 102326. [Google Scholar] [CrossRef]
- Liu, Y.; Zhang, X.; Kong, X.; Wang, R.; Chen, L. Identifying the relationship between urban land expansion and human activities in the Yangtze River Economic Belt, China. Appl. Geogr. 2018, 94, 163–177. [Google Scholar] [CrossRef]
- Wang, Z.; Fu, H.; Liu, H.; Liao, C. Urban development sustainability, industrial structure adjustment, and land use efficiency in China. Sustain. Cities Soc. 2023, 89, 104338. [Google Scholar] [CrossRef]
- Liu, J.; Hou, X.; Wang, Z.; Shen, Y. Study the effect of industrial structure optimization on urban land-use efficiency in China. Land Use Policy 2021, 105, 105390. [Google Scholar] [CrossRef]
- Cheng, Z.; Li, X.; Zhang, Q. Can new-type urbanization promote the green intensive use of land? J. Environ. Manag. 2023, 342, 118150. [Google Scholar] [CrossRef]
- Zhao, J.; Tang, J. Industrial structure change and economic growth: A China-Russia comparison. China Econ. Rev. 2018, 47, 219–233. [Google Scholar] [CrossRef]
- Han, Z.; Jiao, S.; Zhang, X.; Xie, F.; Ran, J.; Jin, R.; Xu, S. Seeking sustainable development policies at the municipal level based on the triad of city, economy and environment: Evidence from Hunan province, China. J. Environ. Manag. 2021, 290, 112554. [Google Scholar] [CrossRef]
- Zhang, Q.; Shen, J.; Sun, F. Spatiotemporal differentiation of coupling coordination degree between economic development and water environment and its influencing factors using GWR in China’s province. Ecol. Model. 2021, 462, 109794. [Google Scholar] [CrossRef]
- Hui, E.C.M.; Wu, Y.; Deng, L.; Zheng, B. Analysis on coupling relationship of urban scale and intensive use of land in China. Cities 2015, 42, 63–69. [Google Scholar] [CrossRef]
- Jiang, H.; Guo, H.; Sun, Z.; Xing, Q.; Zhang, H.; Ma, Y.; Li, S. Projections of urban built-up area expansion and urbanization sustainability in China’s cities through 2030. J. Clean. Prod. 2022, 367, 133086. [Google Scholar] [CrossRef]
- Jiang, Y.; Tian, S.; Xu, Z.; Gao, L.; Xiao, L.; Chen, S.; Xu, K.; Chang, J.; Luo, Z.; Shi, Z. Decoupling environmental impact from economic growth to achieve Sustainable Development Goals in China. J. Environ. Manag. 2022, 312, 114978. [Google Scholar] [CrossRef] [PubMed]
Disclaimer/Publisher’s Note: The statements, opinions and data contained in all publications are solely those of the individual author(s) and contributor(s) and not of MDPI and/or the editor(s). MDPI and/or the editor(s) disclaim responsibility for any injury to people or property resulting from any ideas, methods, instructions or products referred to in the content. |
© 2024 by the authors. Licensee MDPI, Basel, Switzerland. This article is an open access article distributed under the terms and conditions of the Creative Commons Attribution (CC BY) license (https://creativecommons.org/licenses/by/4.0/).

