Article

Effects of Soil Nutrient Restoration Aging and Vegetation Recovery in Open Dumps of Cold and Arid Regions in Xinjiang, China

1
Collaborative Innovation Center of Green Mining and Ecological Restoration for Xinjiang Mineral Resources, Xinjiang University, Urumqi 830046, China
2
Xinjiang Zhongtai New Energy Co., Ltd., Urumqi 830023, China
3
Xinjiang Shengxiong Energy Co., Ltd., Turpan 838100, China
*
Authors to whom correspondence should be addressed.
Land 2024, 13(10), 1690; https://doi.org/10.3390/land13101690
Submission received: 7 September 2024 / Revised: 11 October 2024 / Accepted: 14 October 2024 / Published: 16 October 2024

Abstract

:
Open-pit coal mining inevitably damages the soil and vegetation in mining areas. Currently, the restoration of cold and arid open-pit mines in Xinjiang, China, is still in the initial exploratory stage, especially the changes in soil nutrients in spoil dumps over time. Dynamic remote sensing monitoring of vegetation in mining areas and their correlation are relatively rare. Using the Heishan Open Pit in Xinjiang, China, as a case, soil samples were collected during different discharge periods to analyze the changes in soil nutrients and uncover the restoration mechanisms. Based on four Landsat images from 2018 to 2023, the remote sensing ecological index (RSEI) and fractional vegetation cover (FVC) were obtained to evaluate the effect of mine restoration. Additionally, the correlation between vegetation changes and soil nutrients was analyzed. The results indicated that (i) the contents of nitrogen (N), phosphorus (P), potassium (K), and organic matter (OM) in the soil increased with the duration of the restoration period. (ii) When the restoration time of the dump exceeds 5 years, N, P, K, and OM content is higher than that of the original surface-covered vegetation area. (iii) Notably, under the same restoration aging, the soil in the artificial mine restoration demonstration base had significantly higher contents of these nutrients compared to the soil naturally restored in the dump. (iv) Over the past five years, the RSEI and FVC in the Heishan Open Pit showed an overall upward trend. The slope remediation and mine restoration project significantly increased the RSEI and FVC values in the mining area. (v) Air humidity and surface temperature were identified as key natural factors affecting the RSEI and FVC in cold and arid open pit. The correlation coefficients between soil nutrient content and vegetation coverage were higher than 0.78, indicating a close and complementary relationship between the two. The above results can clarify the time–effect relationship between natural recovery and artificial restoration of spoil dumps in cold and arid mining areas in Xinjiang, further promoting the research and practice of mine restoration technology in cold and arid open pits.

1. Introduction

Global resource consumption is growing rapidly with the increasing pace of industrialization and urbanization [1]. The demand for mineral resources intensifies, driving extensive mining activities worldwide [2]. However, the exploitation of these resources often comes at a significant environmental cost. The process of extracting minerals can lead to the destruction of local eco-environments, causing irreversible damage to ecosystems and posing potential threats to human health [3]. This is particularly pronounced in developing countries, where economic benefits frequently take precedence over environmental and social considerations [4]. As a result, there are significant imbalances between the socio-economic gains and the ecological impacts of mining activities. Long-term and large-scale mining operations are known to threaten the eco-environment in several ways [5]. Soil erosion, groundwater depletion, and biodiversity reduction are some of the most prominent consequences of extensive mining [6,7,8]. The disruption of the soil structure and the removal of vegetation cover expose the soil to erosion, leading to loss of fertile topsoil and degradation of land [9]. Groundwater resources, essential for both ecosystems and human consumption, are often depleted or contaminated due to mining processes. Additionally, mining activities can lead to a significant reduction in biodiversity, as habitats are destroyed and species are displaced or eradicated [10].
To effectively monitor and evaluate the specific impact of mining activities on the environment, a variety of methods have been adopted. Among these, remote sensing and field investigations have emerged as the primary techniques [11,12]. Remote sensing technology offers substantial advantages due to its ability to collect data efficiently, maintain strong objectivity, cover wide observation ranges, and offer high cost-efficiency [13]. Traditional field surveys often lack the comprehensive scope and efficiency that remote sensing provides. Several studies have demonstrated the utility of these methods. Yang et al. investigated and determined the organic carbon data of 300 sampling points in the arid mining area. The prediction model of soil organic carbon density in the Random Forest model was established by using remote sensing images to reveal the influence mechanism of soil organic carbon density [14]. Ecological quality and ecological changes were evaluated in Anqing City during 1999–2019. Multi-temporal Landsat images were used to extract humidity, vegetation, heat, and dryness. Then, the RSEI was calculated by principal component analysis [11]. These studies highlighted the potential of combining remote sensing with field data to monitor environmental changes effectively.
However, the eco-environment of mining areas is a complex system influenced by numerous factors. Monitoring the change in a single factor provides an incomplete picture [15]. Therefore, comprehensive environmental monitoring in mining areas involves assessing multiple aspects, including soil physical and chemical properties, soil nutrients, ecological landscapes, and reclamation effects [16,17,18]. This multiface approach ensures a more holistic understanding of the environmental impacts of mining. Despite the advantages of remote sensing, detailed studies on the potential links between mining activities and vegetation changes, especially at local scales, remain scarce [19]. This gap is particularly significant in cold and arid regions, which accounted for about 90% of such areas globally and were home to approximately 38% of the world’s population [20]. Over the past three decades, mineral resource exploitation in these regions has continued to rise. However, low temperatures and short growing seasons limited natural vegetation recovery, while dry conditions exacerbated water shortages, making restoration efforts slower. The scarcity of water resources necessitated artificial irrigation or efficient water management technologies. Additionally, mining disrupts the fragile soil structure in these areas, requiring special soil improvement measures to enhance fertility and prevent erosion. The ecosystems in such regions were inherently vulnerable, with limited capacity to recover from external disturbances, so restoration must prioritize ecological balance and avoid introducing unsuitable species [21]. The impact of mining activities on land degradation in these regions has often been overlooked in extensive research. Most existing studies focus on changes in vegetation indices but neglect the potential impacts of mining activities on vegetation phenology [22].
To address these issues, this paper examined the Tokesun Black Mountain Coal Mine in Xinjiang as a case study. Using Landsat remote sensing image data from four periods between 2018 and 2023, the study conducted a dynamic analysis of the remote sensing ecological index (RSEI) and fractional vegetation cover (FVC) in mining areas of arid and semi-arid regions. By combining these remote sensing results with soil sampling data, the study provided a comprehensive evaluation of the mine restoration efforts and existing problems in the mine area. The aim was to (i) offer a robust scientific basis for the subsequent management and mine restoration in arid and semi-arid regions, (ii) highlight the importance of integrating multiple monitoring methods to understand the complex interactions between mining activities and ecological changes, (iii) guide future efforts in managing and restoring mining-affected environments, particularly in vulnerable cold and arid regions, and (iv) achieve the coordinated development of coal resource development and eco-environmental protection and restoration.

2. Materials and Methods
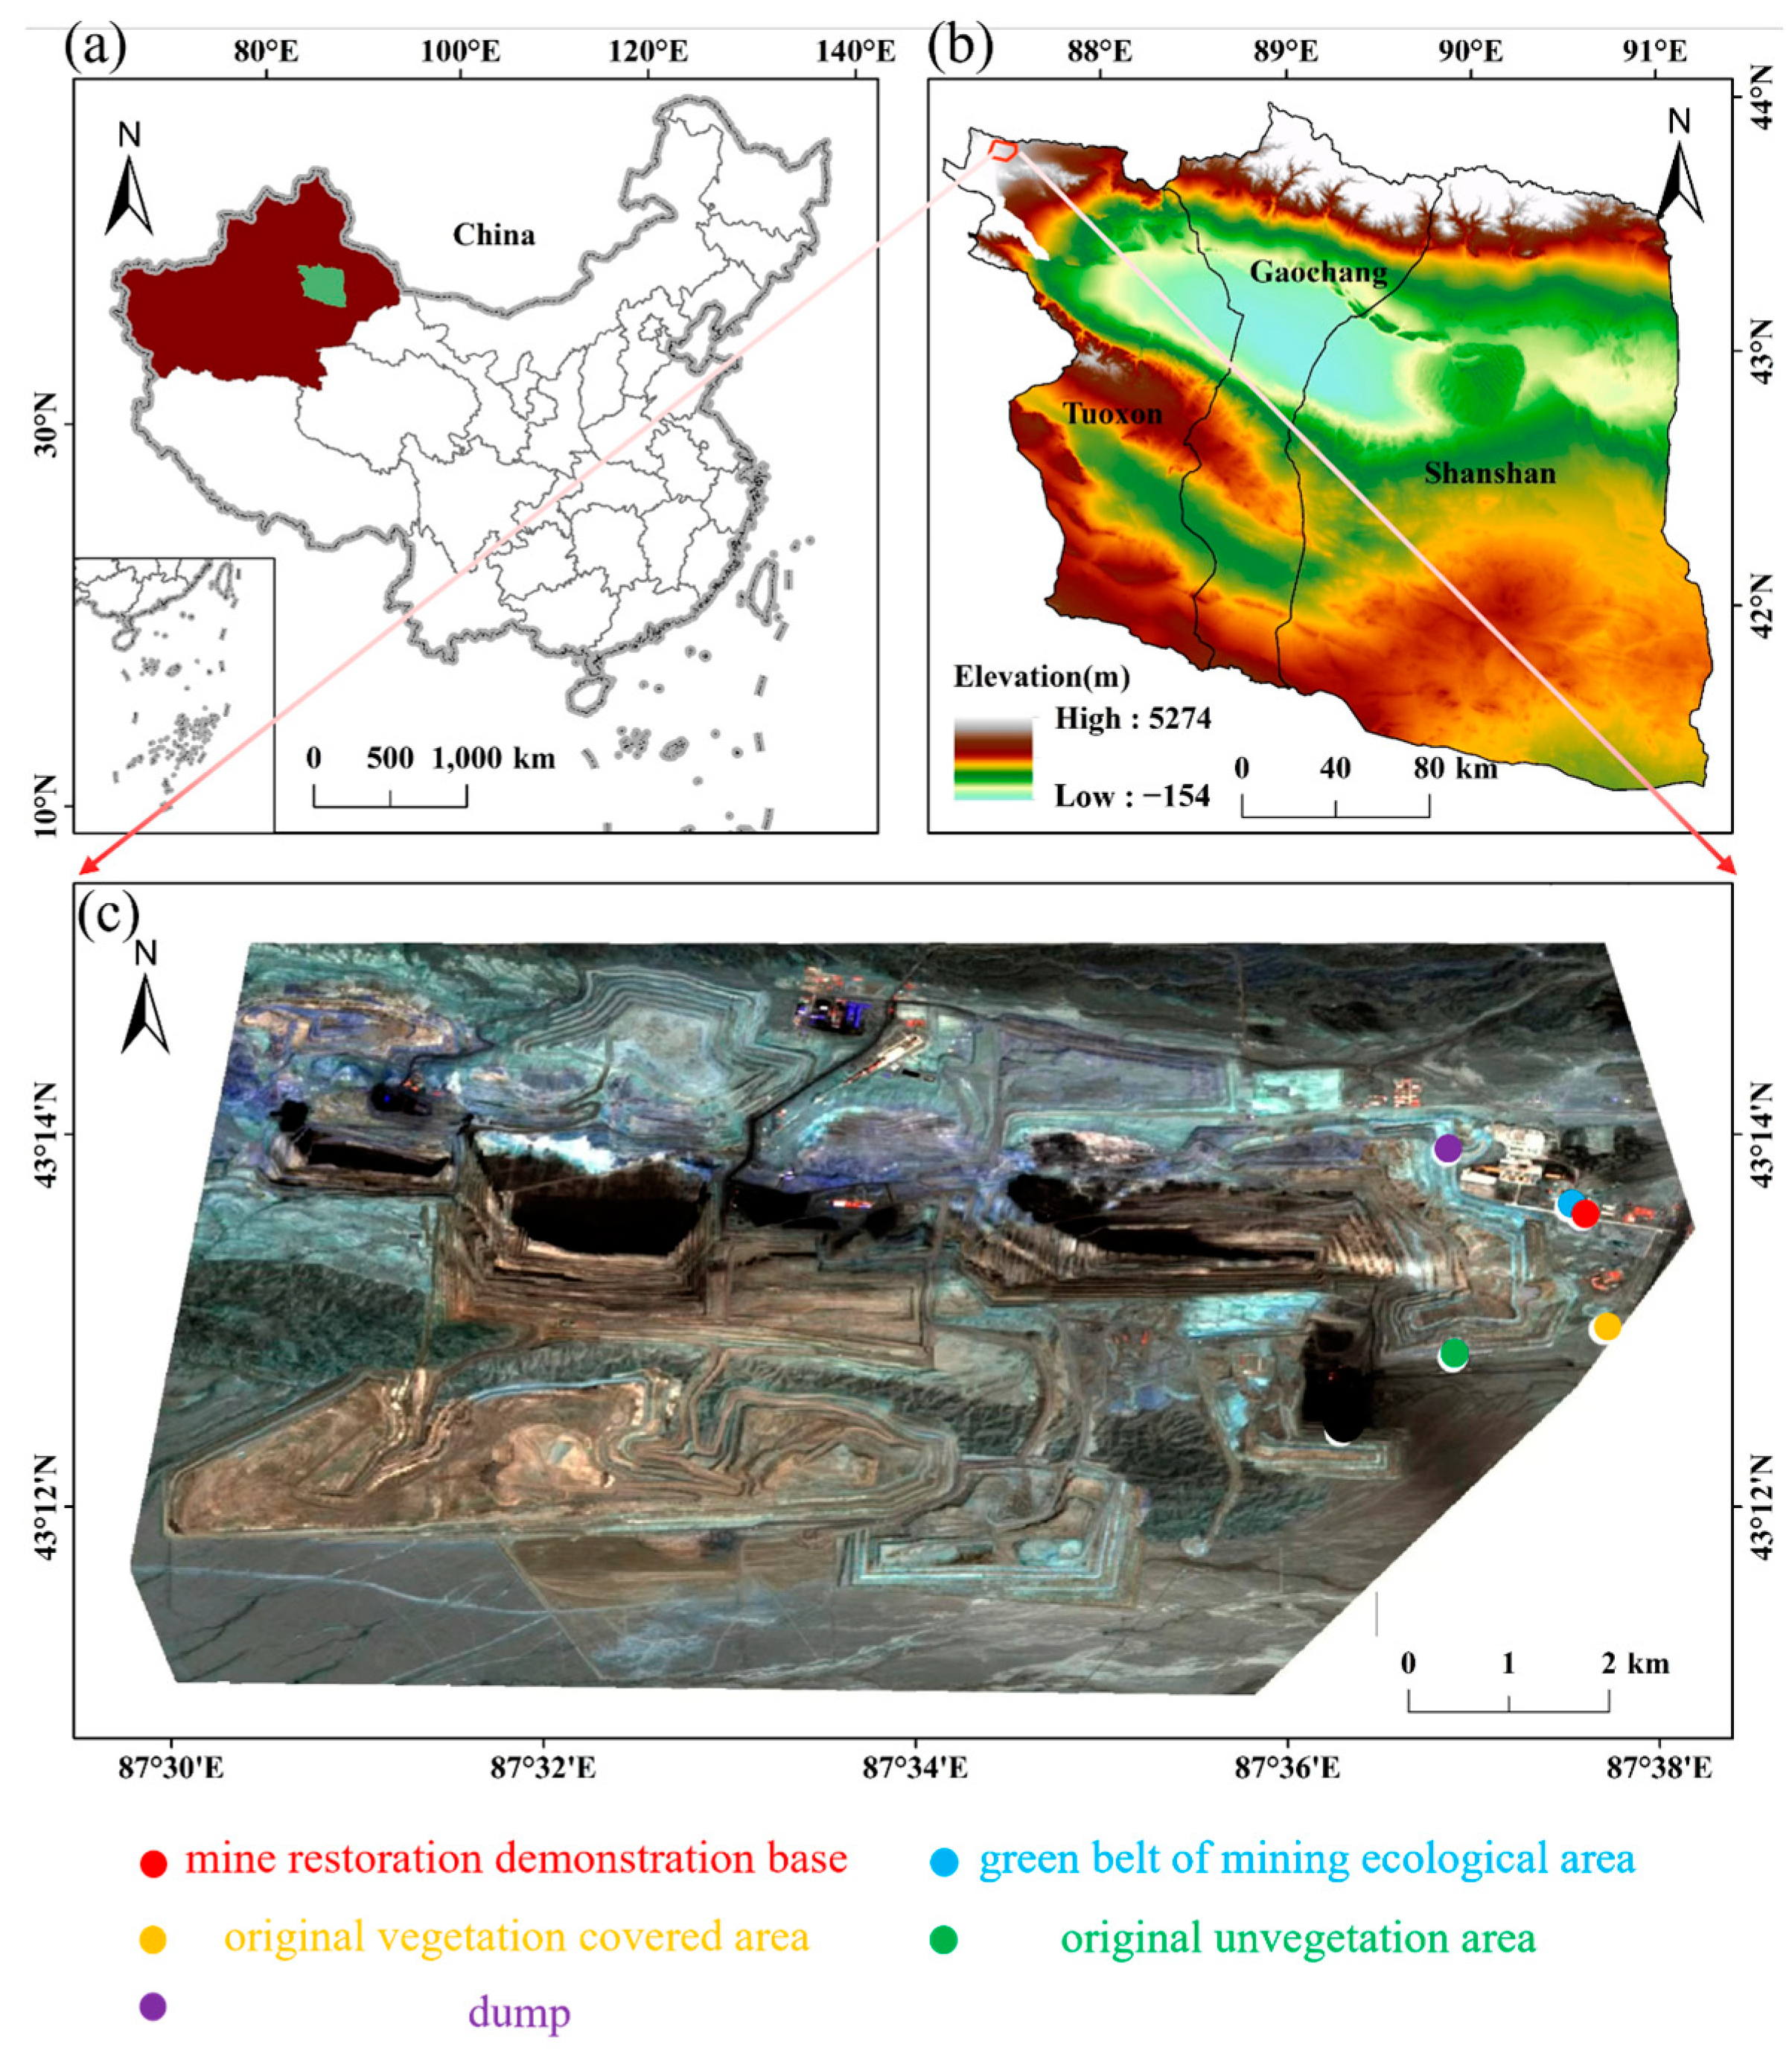
2.1. Study Area

The central geographic coordinates of the study area are 87°35′42″ E, 43°13′20″ N. The mining area is about 65 km north of Tokesun County, China (Figure 1). The mining area experiences a continental arid and cold climate, characterized by minimal snowfall in winter. The terrain’s vertical distribution significantly influences temperature variations, resulting in cold winters and cool summers, with hot days and freezing nights. The annual average temperature is 15.3 °C. The daily maximum temperature reaches 28 °C, while the daily minimum can drop to −28.5 °C. The average annual precipitation is only 187 mm. The longest observed continuous arid spell lasted 350 days, from 28 September 1979 to 11 September 1980. The longest continuous precipitation lasted only one day, occurring on 8 June 2002, with the maximum daily precipitation recorded at 15 mm. The area is particularly windy in spring, with maximum wind speeds reaching 13 m/s. The prevailing winds are from the northwest and southeast.
The mining area is situated in a mountain valley, commonly known as Tonggou, located in the middle part of the central Tianshan Mountains. It is bordered to the north by the Yoka Pit Aidai Mountain and to the south by Doomsday Lock Mountain and Black Mountain. The terrain is more open to the east and west, with elevations decreasing from north to south and from west to east. The lowest elevation in the area is 2450 m, while the highest reaches 3023 m, with a terrain gradient of 3–5° and up to 25° in some local areas. The gullies in the region are not well developed and remain arid year-round, with temporary torrents occurring only during rainstorms. The lowest elevation of 2365 m represents the lowest erosion base level of the mining area.
Key and sub-key areas for mine geological environment protection and land reclamation have been identified in the mining area in 2018–2020. The soil covering and leveling of the dump site have been carried out, and part of the greening work has been completed. In the sub-key areas like living areas and industrial sites, environmental protection measures have been carried out, such as the construction of sewage treatment ponds and the installation of garbage bins. Subsequently, a detailed work plan for mine restoration was formulated from 2020 to 2022. The warning signs and wire fences were inspected and monitored, the stability of the slope of the excavation site was monitored, and the treatment of domestic refuse and the discharge of sewage were monitored. Finally, the mine road was cleared and kept clean, and greening observation, soil covering, regularization, soil loosening, and greening work were carried out in different areas from 2022 to 2023. A total of 847.5 hectares of gully backfills and covered wind-blown sand were completed. Ninety-seven hectares of regular area were constructed, 1608 hectares of loose soil area were constructed, and 1625 hectares of artificial grass seed were sown in the green area (some areas were not completed due to the influence of construction). Roads were still in use in the sub-key areas like industrial sites and mining; thus, mine restoration has not been carried out. However, greening maintenance has been carried out around the administrative welfare area, outsourcing site, and landfill area. In the general area of mine environmental protection and management, the original terrain and landform were maintained, and any production activities were strictly prohibited.

2.2. Sampling and Analysis

To study the spatial distribution of soil characteristics, the grid method was adopted for soil sampling at five points within the study area, as shown in Figure 1 and Figure 2. The specific coordinates of the sampling points are shown below: the original non-vegetation area (87°37′42″ E, 43°12′56″ N), original vegetation-covered area (87°37′41″ E, 43°12′56″ N), dump (87°36′53″ E, 43°13′54″ N), green belt of the mining ecological area (87°37′30″ E, 43°12′36″ N), and mine restoration demonstration base (87°37′34″ E, 43°13′33″ N). The sampling time was 1 December of the corresponding year.
The sampling points were in the green belt, mine restoration demonstration base, dump, original vegetation-covered area, and original non-vegetation-covered area of the ecological zone. Based on varying repair times and methods, the area was divided into different sampling zones. The systematic sampling method was employed, with equidistant sampling points established in each zone to collect soil samples at three depths: 0–10 cm, 10–20 cm, and 20–30 cm. During the sampling process, detailed records were kept of the sampling point locations, environmental conditions, land use modes, repair methods, and repair times. The collected soil samples were then sent to the laboratory for chemical, physical, and biological property analysis [23].
All soil samples obtained in the field were analyzed in the laboratory for correlation studies. Soil organic matter (SOM) content was determined using the potassium dichromate oxidation-volume method. Total nitrogen (TN) content was measured using the Kjeldahl method, total phosphorus content using the acid-soluble molybdenum-antimony resistance colorimetric method, and total potassium content using HF digestion flame photometry [24].

2.3. Data Source and Calculation Method of the RSEI

The RSEI is a combination of land surface humidity (LSM), normalized differential building and bare soil index (NDBSI), and surface temperature (LST).
LSM is directly related to satellite-generated brightness, greenness, and humidity and can be used for ecological mapping and monitoring. LSM can be used for the fringe cap component of the ecological vulnerability index. In this study, the humidity parameter is expressed as surface humidity, generated by the reflectance of Landsat TM and OLI images, as follows using Equations (1) and (2).
L S M O L I = k O 1 B B l u e + k O 2 B G r e e n + k O 3 B Re d + k O 4 B N I R k O 5 B N S W I R 1 k O 6 B N S W I R 2
L S M T M = k T 1 B B l u e + k T 2 B G r e e n + k T 3 B Re d + k T 4 B N I R k T 5 B N S W I R 1 k T 6 B N S W I R 2
where BBlue, BGreen, BRed, BNIR, BSWIR1, and BSWIR2 are the surface reflectance values of blue, green, red, near-infrared, and short-wave infrared bands of Landsat TM/ETM+ and OLI images, respectively.
Normalized Difference Vegetation Index (NDVI) is often the best measure of global greenness. It is directly related to the state of vegetation, whether it is healthy or stressed vegetation. Equation (3) can be easily measured by combining red and infrared bands.
N D V I = B N I R B Re d B N I R + B Re d
where BNIR and BRed refer to the reflectance of the near-infrared and red bands. The value exists between −1 and +1. A value close to +1 means dense or healthy vegetation, close to 0 means poor land, and close to −1 means no vegetation or water/ice/snow.
NDBSI is generated from different band combinations of satellite images using the soil index (SI) and building index (IBI), as follows using Equations (4)–(6) [13].
S I = B S W I R I + B Re d B B l u e + B N I R B S W I R I + B Re d + B B l u e + B N I R
I B I = 2 B S W I R I B S W I R I + B N I R B N I R B N I R + B Re d + B G r e e n B G r e e n + B S W I R I 2 B S W I R I B S W I R I + B N I R + B N I R B N I R + B Re d
N D B S I = I B I + S I 2
where BBlue, BGreen, BRed, BNIR, and BSWIR1 are the reflectance values of Landsat blue, green, red, near-infrared, and short-wave infrared bands.
LST refers to heat, which can be easily determined from any satellite data of the tropics. Since Landsat data were used in this study, the thermal bands of Landsat 5 and 7 TM/ETM + sensors were used in 2010 and 2015, respectively, and the thermal bands of Landsat 8 OLI sensors were used in 2020. The data used in this paper were obtained from the official website of the United States Geological Survey (USGS) (earthexplorer.usgs.gov). Finally, it is generated using Equations (7)–(9) [13]:
L λ = g a i n D N + B i a s
T b = K 2 ln K 1 L λ + 1
L S T = T b 1 + λ T b P ln ε
where Lλ is tropical. The gain is the thermal infrared gain value. Offset is the offset value, which is the brightness value produced by the satellites as well as the constant of their tropics. All values can be found in the metadata (MTL) file of the satellite data and are tropical wavelengths (microns) and emissivity, respectively. The emissivity can be generated using the following Equation (10):
ε = m P + n
where m is the soil radiance coefficient (0.004) and n is the vegetation radiance coefficient (0.986). P is the proportion of vegetation, which can be obtained using the following Equation (11):
P = N D V I N D V I m i n N D V I m a x N D V I m i n 2
To derive the RSEI from the above four parameters, all factors need to be normalized to remove different dimension and range values. The four factors are normalized to homogenization and dimensionless on a scale of 0 to 1, as follows using Equation (12):
X i = x i min x i max x i min x i
where Xi is the standardized value of factor I. xi is the initial value of factor I.

2.4. Data Source and Calculation Method of the FVC

Landsat TM/ETM+/OLI/TIRES images from July 2018, July 2020, July 2022, and July 2023 provided by the United States Geological Survey (USGS) were used. Before the analysis, all radiation, atmospheric, and geometric errors were removed in ArcGIS and projected in WGS-1984-UTM region −39 N with 30 m resolution. The data pre-processing steps are carried out by ENVI 5.3, including radiometric calibration, atmospheric correction, geometric correction, mosaic, and clipping. The FVC was calculated using the band computing tool, as shown in the following Equation (13):
γ = D i r D r δ i r δ r D r D g δ r δ g
F V C = γ γ m a x
where Dir, Dr, and Dg refer to the reflectance of near-infrared, red, and green bands in Equation (13) respectively; δ i r , δ r , δ g , are the center wavelengths of near-infrared, red, and green bands, respectively. Equation (14) refers to the step difference index. The calculation and analysis of vegetation coverage can not only explore the temporal and spatial change characteristics of vegetation cover but also characterize the eco-environment quality of the study area.

3. Results

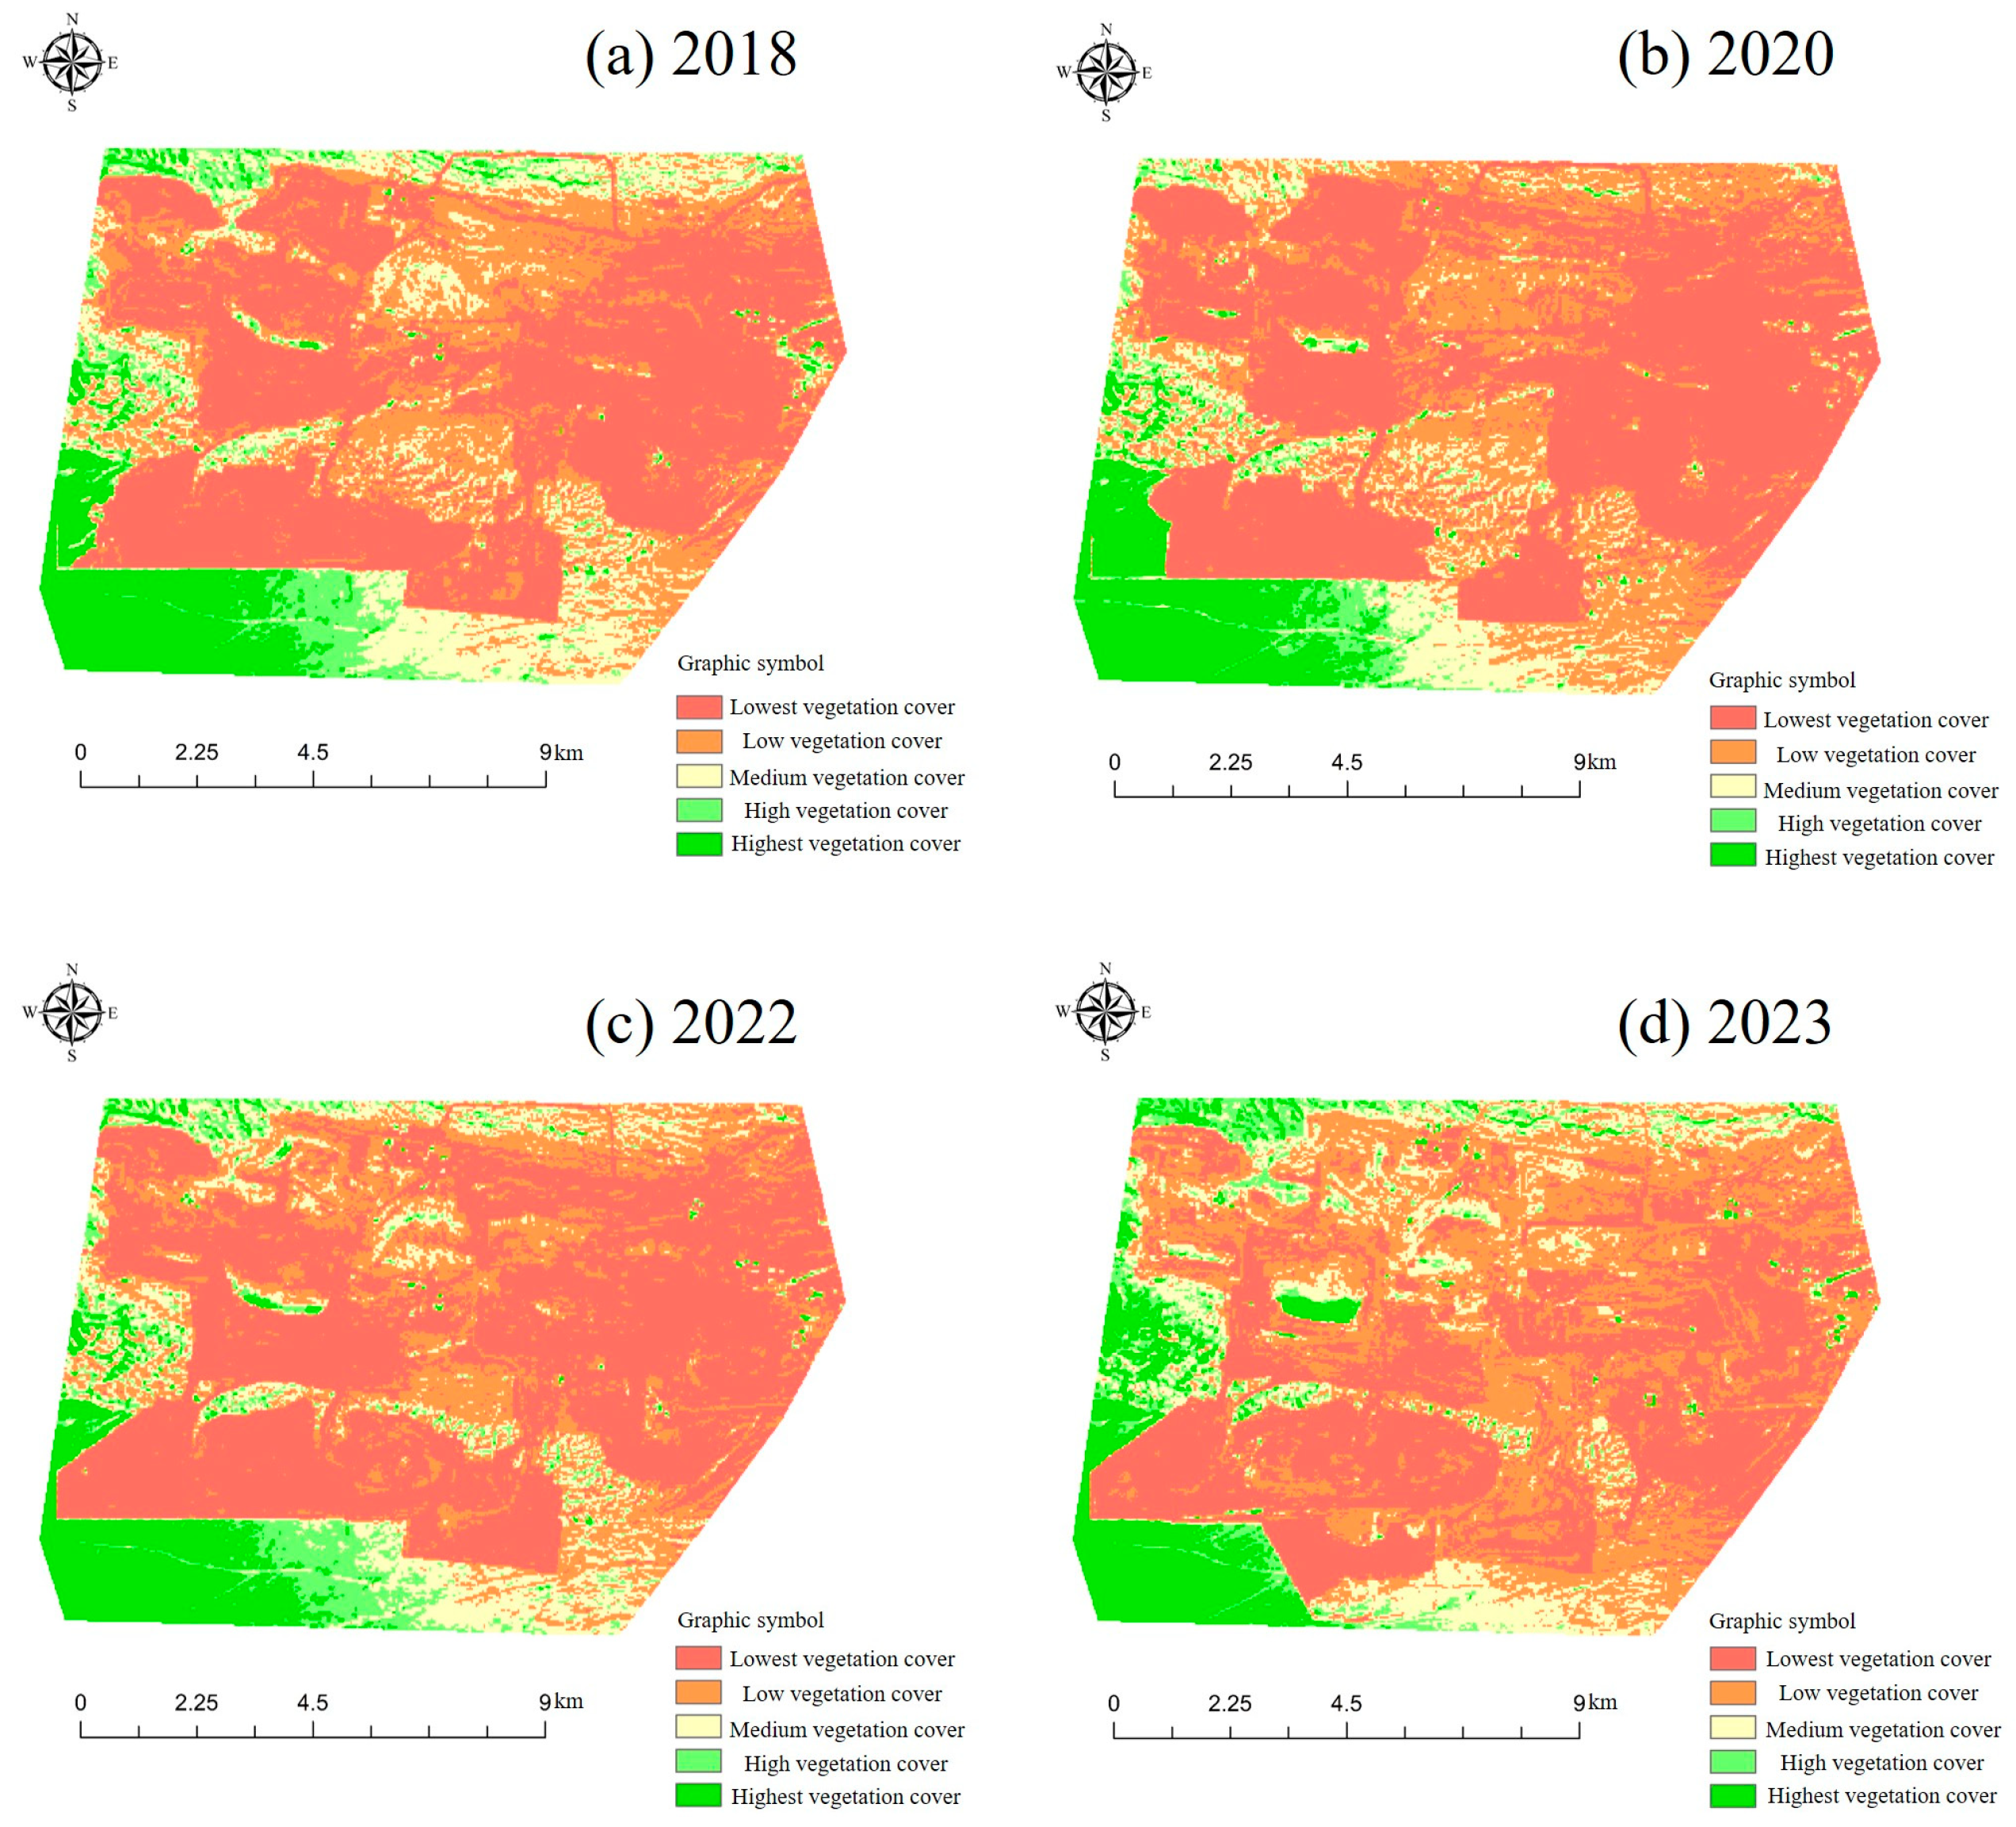
3.1. FVC Time Variation Rule

The FVC of the study area was divided into five levels: lowest vegetation cover (0–0.2), low vegetation cover (0.2–0.4), medium vegetation cover (0.4–0.6), high vegetation cover (0.6–0.8), and highest vegetation cover (0.8–1.0). The results of the area proportion of each level after statistics are shown in Figure 3 and Figure 4. The average FVC decreased from 0.292 in 2018 to 0.286 in 2020. During this period, the low vegetation cover area expanded from 16.460 to 18.407 km2. Similarly, the high vegetation cover area grew from 6.200 to 7.148 km2.
The average value decreased from 2020 to 2022, changing from 0.286 to 0.313. The lowest vegetation cover area decreased from 37.354 to 34.140 km2. The medium vegetation cover area increased from 7.875 to 10.767 km2. The highest vegetation cover area increased from 3.105 to 4.783 km2. The average value increased from 0.313 to 0.323. Compared with the situation before, the vegetation coverage had not been significantly improved from 2022 to 2023. The ecological security pattern had only maintained the status quo.

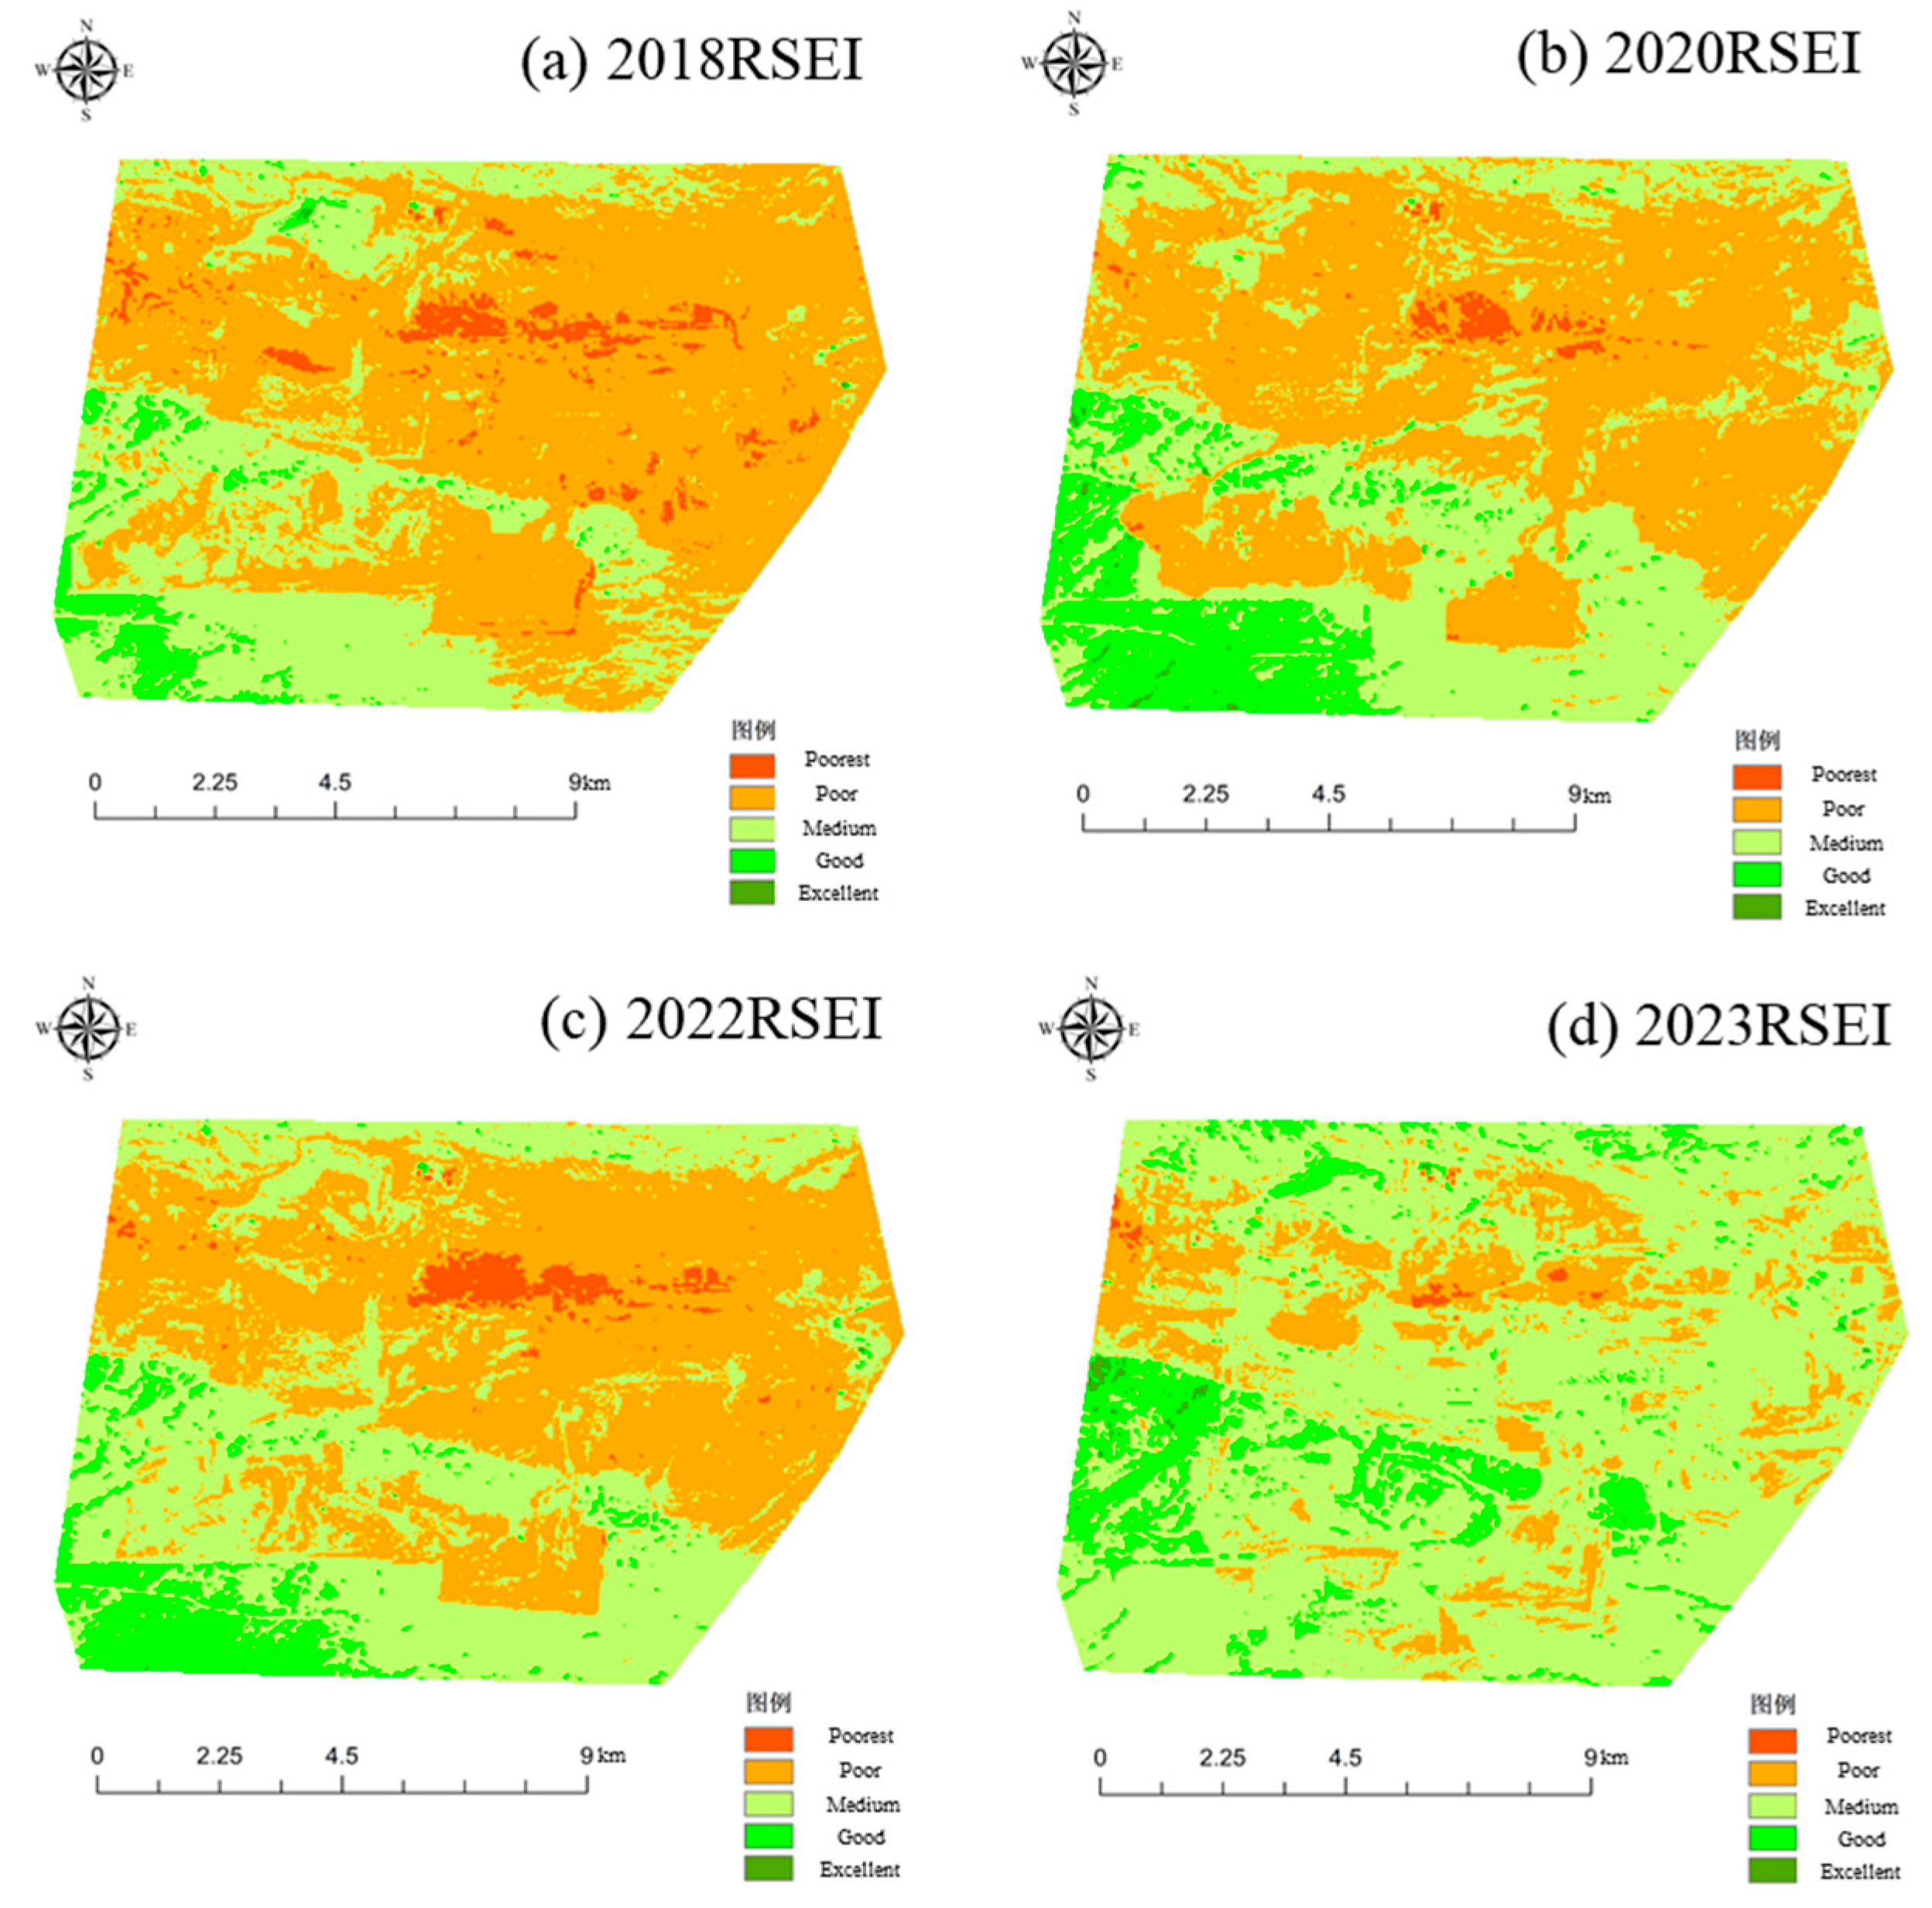
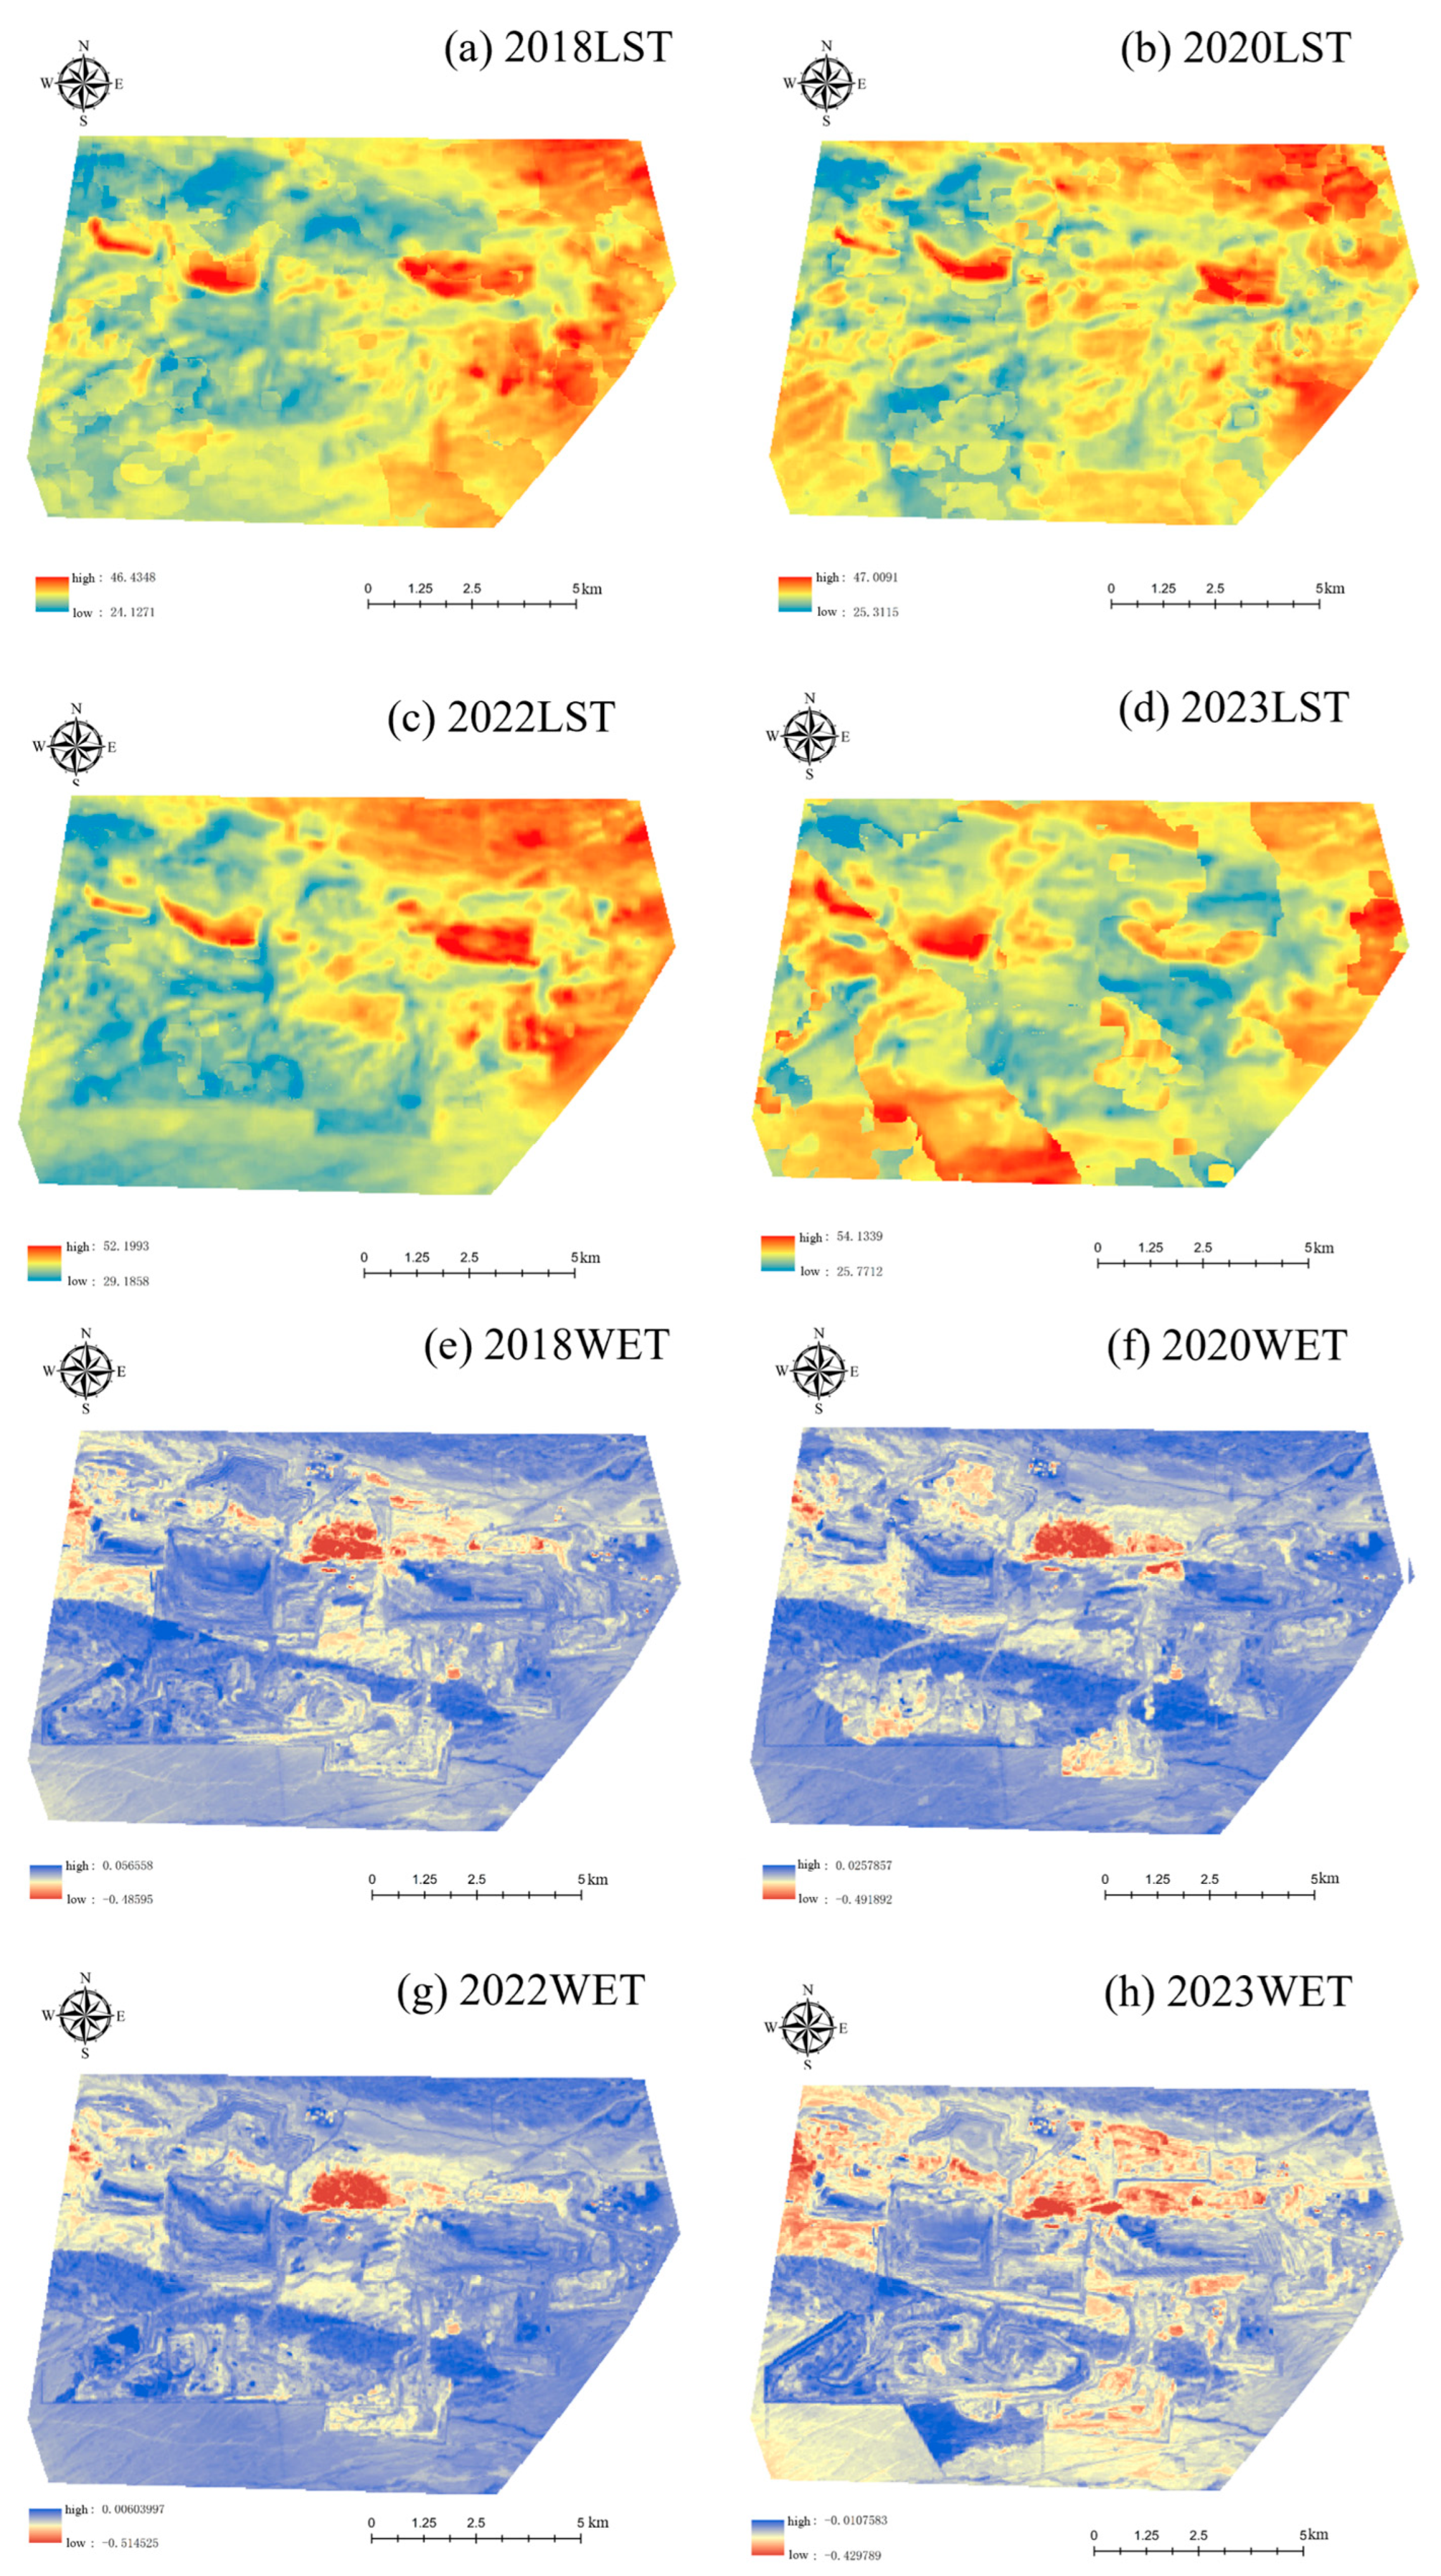
3.2. RSEI Time Variation Rule

Based on previous research results, the RSEI was divided into five grades: poorest (0–0.2), poor (0.2–0.4), medium (0.4–0.6), good (0.6–0.8), and excellent (0.8–1.0). It showed the changes in the overall ecological security pattern over time. The results of the area proportion of each grade after statistics are shown in Figure 5, Figure 6 and Figure 7. From 2020 to 2022, the average RSEI slightly decreased to 0.409. Although the areas with the poorest ratings decreased, the areas with poor and medium ratings increased. This regression could be attributed to significant changes in surface temperature (from 35.047 to 39.567 °C) and a decrease in air humidity (from −0.123 to −0.126) during this period [23]. The adverse weather in the open pit exacerbated the fragile eco-environment. However, the study area demonstrated significant mine restoration from 2022 to 2023. The average RSEI increased to 0.483. Notably, the poorest rated area nearly disappeared, and the poorly rated area shrank by more than two-thirds. Concurrently, the medium rated area increased substantially.

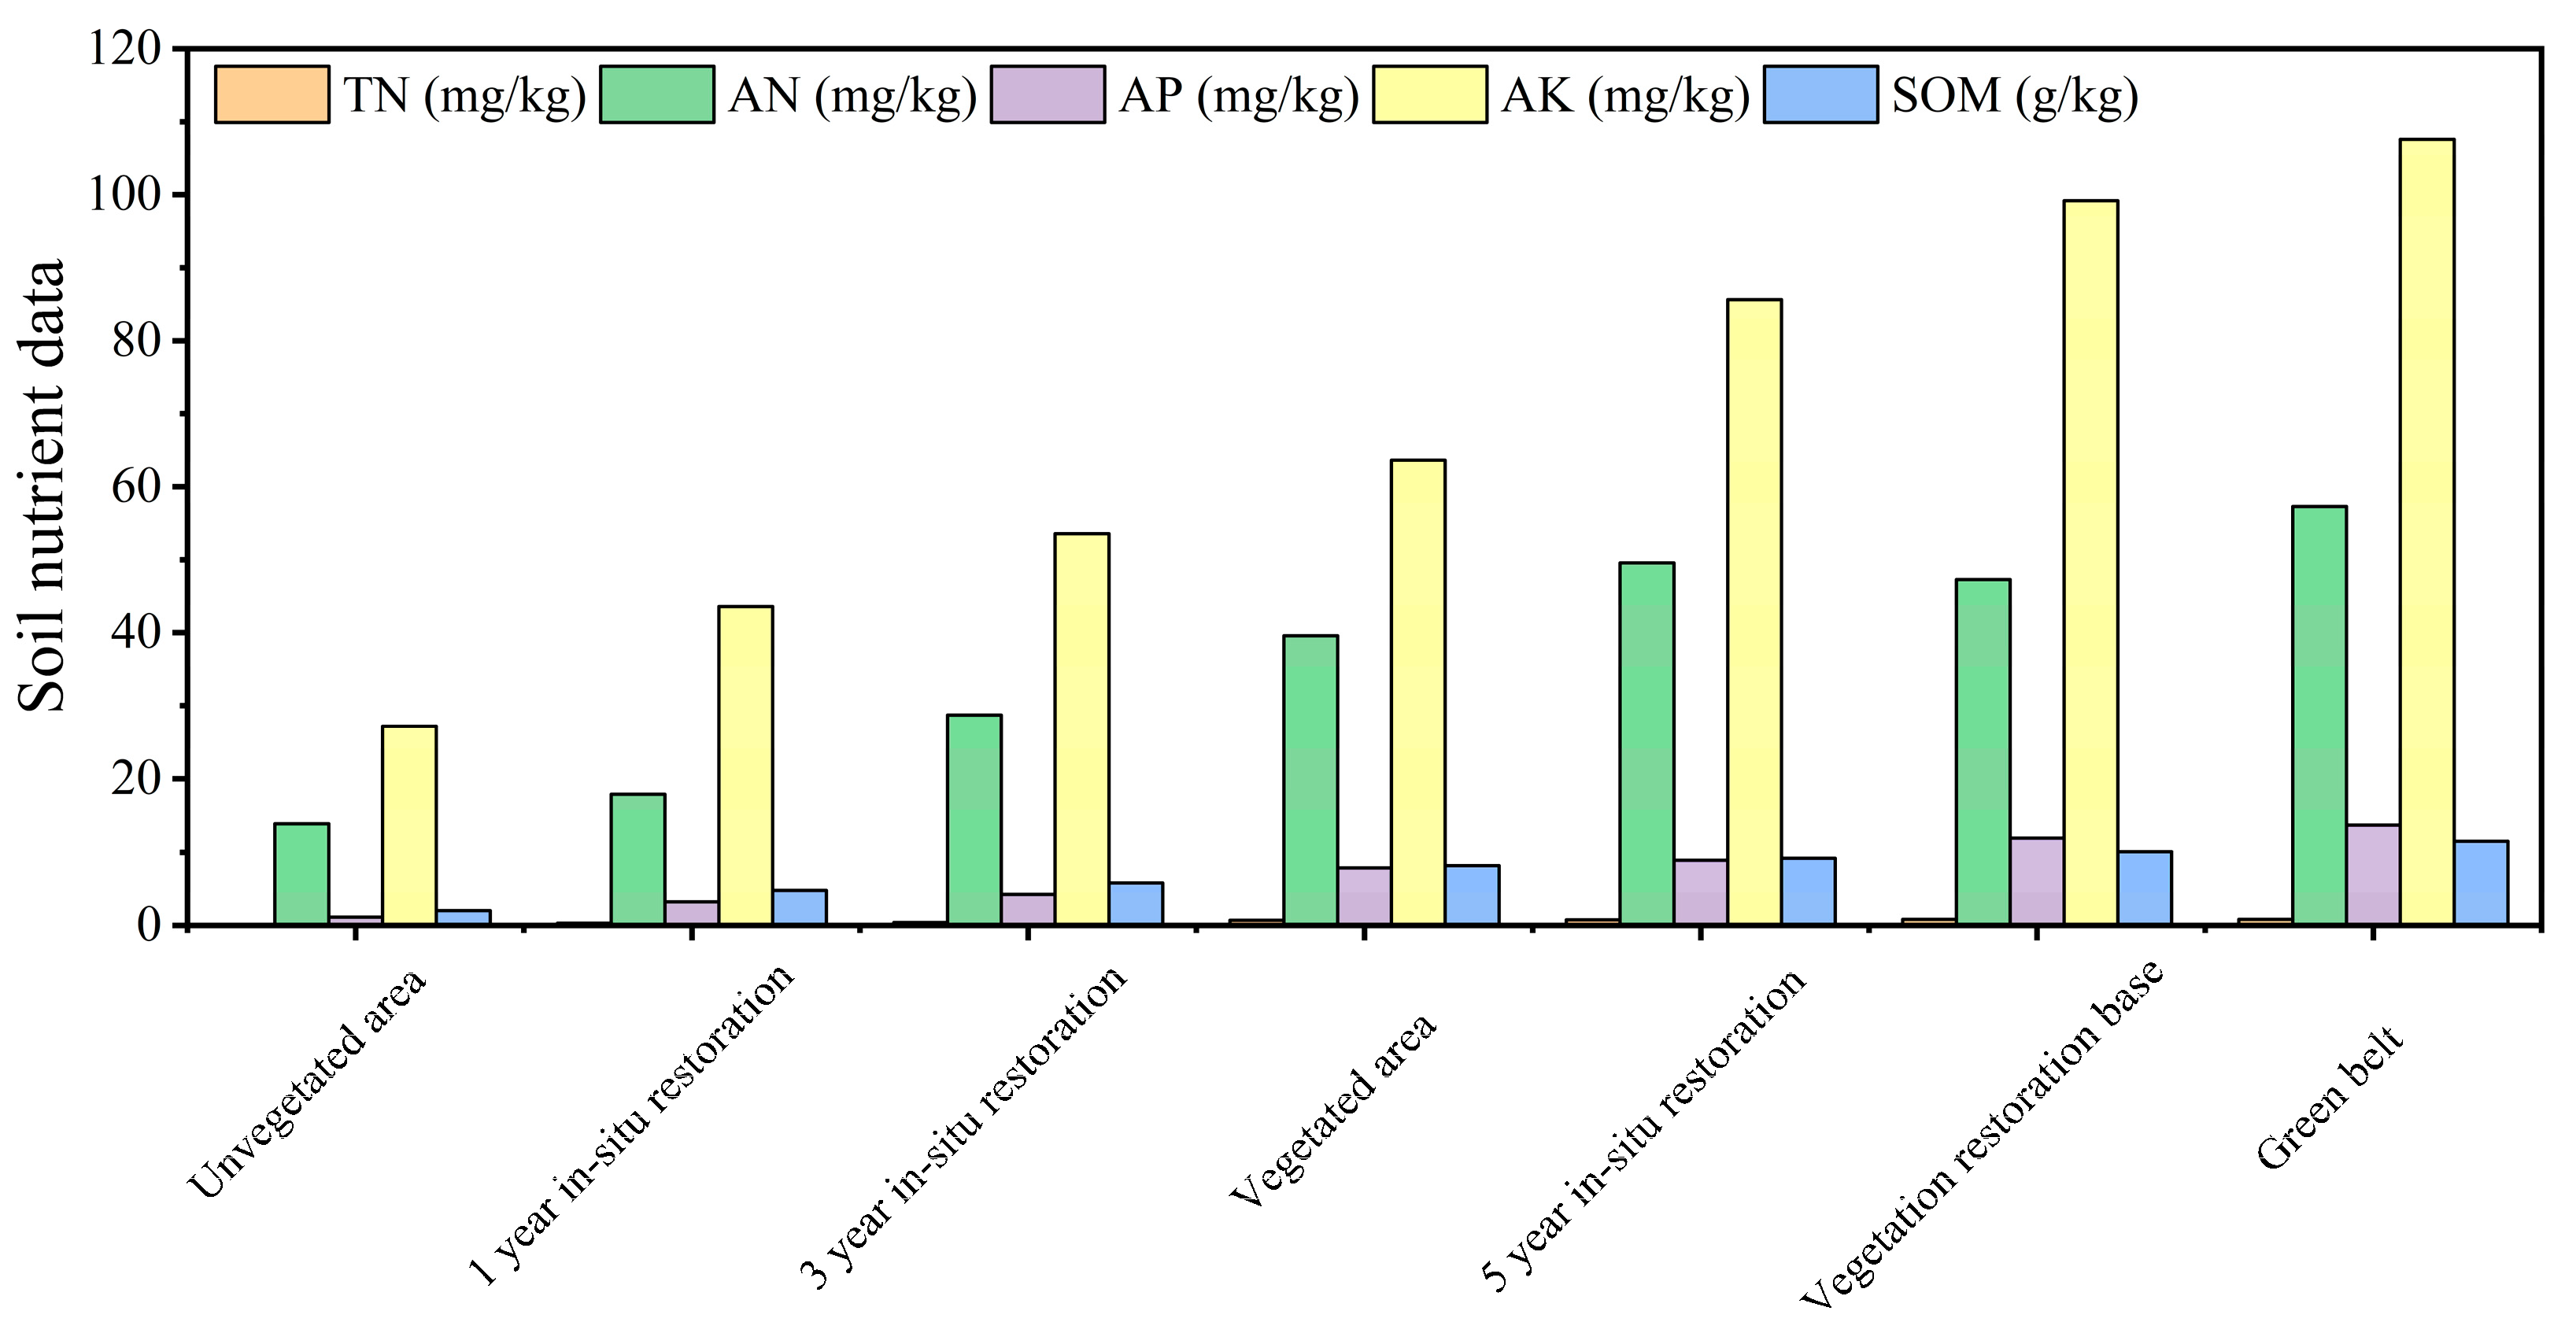
3.3. Variation in Soil Nutrient Data

The soil nutrient data before and after restoration are shown in Figure 8. In the original surface area without vegetation cover, the contents of TN, alkali-hydrolysable nitrogen (AN), available phosphorus (AP), available potassium (AK), and SOM in the soil of the dump were relatively low. The average TN content was 0.12 mg/kg, and the average AN content was 13.82 mg/kg. The average AP content was 1.13 mg/kg, the average AK content was 27.16 mg/kg, and the average SOM content was 2.04 g/kg. The contents of TN, AN, AP, AK, and SOM in the original land surface with vegetation cover were higher than those in the non-vegetation area.
The contents of TN, AN, AP, AK, and SOM increased in the natural recovery area covered with soil for 1 year. Specifically, the average TN content was 0.30 mg/kg, the average AN content was 17.87 mg/kg, the average AP content was 3.22 mg/kg, the average AK content was 43.57 mg/kg, and the average SOM content was 4.81 g/kg. Compared with the soil in the original vegetated area, after 1 year of natural recovery, the soil quality of the cover soil of the dump cannot meet the growth demand of annual vegetation. After 3 years of natural recovery, the contents of TN, AN, AP, AK, and SOM increased after 3 years of natural restoration. Compared with the natural recovery of 1 year, the contents of N, P, K, and OM in the soil after 3 years of natural recovery were significantly increased. However, compared with the soil in the original vegetated area, the soil quality after 3 years of natural recovery was still unable to meet the growth demand of annual vegetation. The contents of TN, AN, AP, AK, and SOM increased in the natural recovery area after 5 years of soil cover.
The soil indicators of the mine restoration demonstration base in the mining area (mine restoration cycle 3–4 years) have been significantly improved. Specifically, the average TN content reached 0.82 mg/kg, the average AN content was 47.29 mg/kg, the average AP content was 11.86 mg/kg, the average AK content was 99.18 mg/kg, and the average SOM content was 10.10 g/kg. Through ecology, it showed that the vegetation mine restoration method could have a positive impact on soil quality in a short time. The soil quality in the green belt of the mine ecological zone (the mine restoration cycle is 7–8 years) has been further improved.

4. Discussion

4.1. FVC Analysis

According to the above FVC data and mining area policy, Heishan Open Pit began to cover and level the dump in 2018 but only part of the restoration work was completed by 2020. Consequently, the mine restoration did not achieve significant improvement in the short term [25]. During this period from 2020 to 2022, Heishan Open Pit conducted slope restoration in the southern part of the mine and the side dump along the mine, achieving remarkable results [26]. The gradual implementation of mine restoration measures and the introduction of supportive policies have contributed to the improvement of the ecological security pattern in the region [27]. This situation indicates that the open-pit eco-environment remains relatively fragile and is at risk of deterioration [28]. It underscored the need for sustained mine restoration and improvement measures, as well as regular monitoring and assessment of mined areas to prevent periodic impoverishment [29].
The period from 2022 to 2023 highlighted the necessity for ongoing commitment to ecological management. There was a marked decrease in the lowest vegetation cover area, coupled with a significant increase in the low vegetation cover area [30]. This suggested that targeted restoration efforts had yielded positive effects. However, the lack of substantial improvement in overall vegetation coverage indicated that existing measures needed to be intensified or adapted to address the specific challenges of the mine’s fragile environment [31]. Regular monitoring and assessment were crucial to detect early signs of ecological degradation and to implement timely corrective actions [32]. By fostering collaboration among government agencies, environmental organizations, and the mining industry, it was possible to develop and enforce robust mine restoration strategies [33]. In conclusion, the eco-environment of mining areas like the one in this study was a dynamic and complex system that required continuous intervention [34,35].

4.2. RSEI Analysis

According to the above RSEI data and mining area policy, the phased mine restoration measures initiated in 2018 and the implementation of the mine geological environment protection policy have led to a marked reduction or elimination of areas with poor and poorest ratings. However, the good and excellent rated areas did not show a significant increase. This highlights the ongoing fragility of the eco-environment and the risk of further degradation. Extreme weather conditions and minimal precipitation remain the primary obstacles to mine restoration [36]. Additionally, the stable surface temperature and air humidity during this period created favorable conditions for mine restoration. These results indicate a significant improvement in the ecological security pattern of the open pit [37].
According to the changing trend in FVC, the overall vegetation coverage increased in the study area, showing a good trend in vegetation recovery. However, the excellent vegetation coverage area showed a downward trend, reflecting the complexity and long-term nature of mine restoration. This indicates that although the mine restoration had achieved good effects, it still needed to be further strengthened and sustained, especially in those areas where the improvement of vegetation coverage is not obvious [38]. From a policy perspective, it is recommended to increase investment in mine restoration, optimize restoration technologies, and ensure the scientific and effective execution of restoration projects. Establishing and improving a long-term mechanism for mine restoration is essential to consolidate and enhance restoration outcomes [39,40]. Therefore, policies should emphasize strengthening the monitoring and evaluation of the eco-environment in mining areas and addressing emerging ecological issues promptly. Moreover, it is indispensable to strengthen ecological protection and restoration efforts to improve the overall quality of the eco-environment. Publicity and education on eco-environmental protection should be strengthened to raise public awareness and participation in these efforts [41].

4.3. Soil Nutrient Data Analysis

Based on soil sampling data, the soil detection data of each study area are as follows: the green belt of mining ecological area > mine restoration demonstration base > 5 years of natural restoration of dump > original vegetation-covered area > 3 years of natural restoration of dump > 1 year of natural restoration of dump > Soil detection of the original non-vegetation area of surface. The contents of N, P, K, and OM in soil increased year by year with the increase in the repair time of the dump. N, P, K, and OM in the soil were higher than those in the original vegetation area when the repair time of the dump was 5 years high [42]. The greening time of the green belt in the mine ecological zone is the longest (7–8 years), and the content of N, P, K, and OM in the soil is the highest, followed by the mine restoration demonstration base (3–4 years). During the same restoration time, the N, P, K, and OM contents of the mine restoration demonstration base were significantly higher than those of natural restoration in the dump [43,44,45].

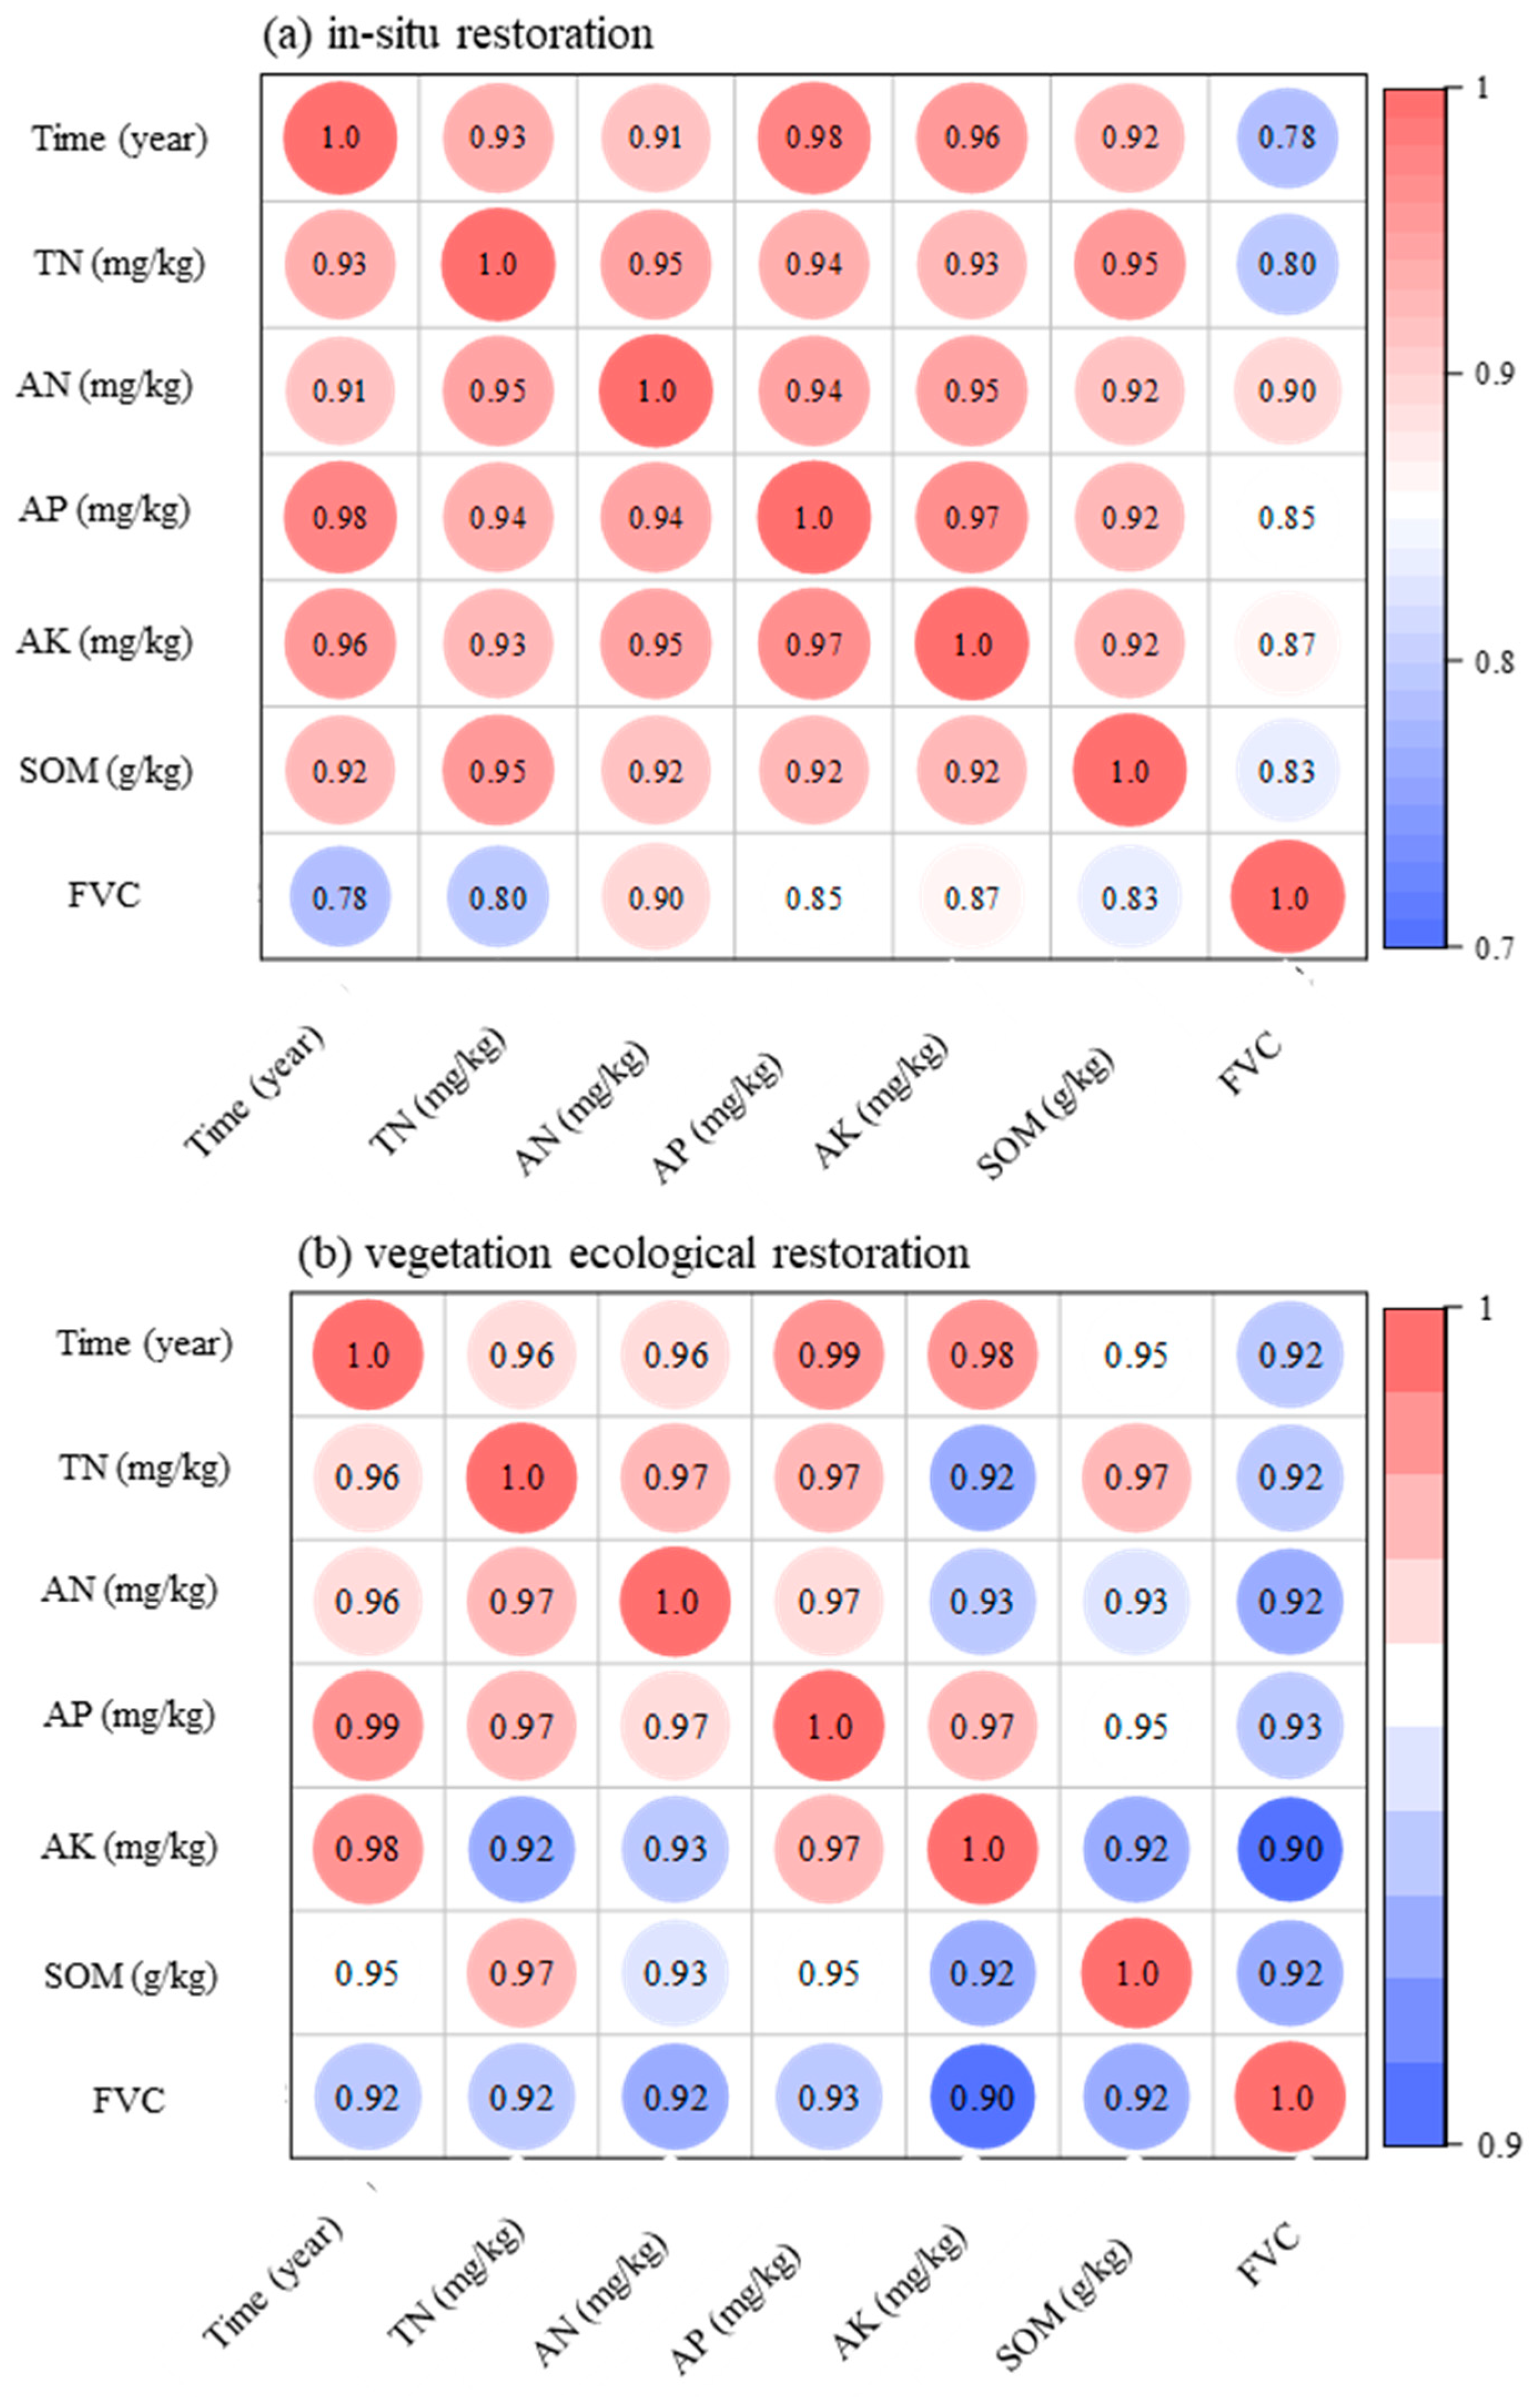
4.4. Correlation Analysis of Soil Nutrient Data and Restoration Methods

The correlation between soil nutrient content and vegetation coverage under in situ restoration and vegetation mine restoration conditions is shown in Figure 9. The results showed that the correlation coefficients of TN, AN, AP, AK, and SOM in in situ restoration soil and vegetation coverage ranged from 0.78 to 0.9, indicating the close relationship between vegetation and soil. The vegetation coverage was improved with the mine restoration in the mining area. The residual roots and leaves of vegetation were decomposed to add organic matter and humus to the soil, thus improving the soil fertility [46]. This elevation in turn provided the necessary nutrients for the vegetation, which promoted its further growth and formed a positive ecological cycle. This cycle not only improved soil quality but also promoted mine restoration in mining areas [47]. However, the correlation coefficients of mine vegetation in the ecological demonstration base were all greater than 0.9. Because mine restoration methods paid more attention to the overall improvement of the soil ecosystem and comprehensively improved soil fertility by promoting the activities of soil microorganisms and increasing SOM [48]. Although remediation measures have had a positive impact on soil quality, soil remediation is a long-term and complex process. In practical application, it was necessary to select appropriate remediation methods and technologies according to the specific conditions of soil and remediation objectives and to continuously monitor and evaluate the remediation effect [49]. Moreover, it was also necessary to strengthen soil protection, reduce soil pollution, and fundamentally maintain soil health and ecosystem stability. In summary, through the comparison and analysis of the data, it could be seen that soil remediation measures played an important role in improving soil quality [50].

5. Conclusions

5.1. Data Summary

Field soil sampling and remote sensing monitoring are essential for assessing surface soil and vegetation status, reflecting mine restoration outcomes. This paper analyzes soil sampling data and remote sensing images from 2018 to 2023 to examine trends in the RSEI and FVC, as well as the effects and driving factors of restoration in cold, arid mining areas. The main findings are as follows:
(1) The RSEI and FVC in the Heishan Open Pit showed an overall upward trend over five years, with significant improvements in 2020 due to slope remediation and restoration projects. Air humidity and surface temperature were key factors influencing the RSEI and FVC.
(2) In the same restoration period, the soil nutrient contents in vegetation mine restoration sites were significantly higher than in naturally restored dump soils.
(3) The correlation coefficients between soil nutrient content and vegetation coverage were higher than 0.78, indicating a close and complementary relationship.

5.2. Deficiency and Prospect

Despite its contributions, this study has several limitations:
(1) The eco-environment of the cold and arid mining area is fragile, with high temperatures, little precipitation, and intense evaporation in summer. The poor and scarce soil in the mining area affects the growth of vegetation.
(2) The selection and allocation of native plants has high technical requirements, and most of the vegetation in fragile habitats cannot adapt to them, requiring manual intervention to germinate.
(3) The sample size of the study may not be adequately representative of the entire region. The ecological restoration methods used in cold and dry mining areas may not be suitable for other types of mining areas.
Therefore, adjustment and improvement measures should be taken in regard to the following aspects:
(1) Future research should explore more effective regreening techniques, such as using drought-resistant species, soil amendments, and optimizing planting times to increase vegetation survival rates and reduce recovery time.
(2) Future studies should refine protocols for selecting native plants, including seed priming and stress-resistant varieties, to improve adaptability and reduce manual intervention.
(3) A larger and more diverse sample size is needed to ensure findings are representative of other mining regions, allowing for tailored restoration approaches across different environments.

Author Contributions

Conceptualization, Z.W. and W.G.; data curation, W.Z. (Weidong Zhu) and H.G.; software, Y.Z.; validation, C.S.; writing—original draft preparation, J.G.; writing—review and editing, M.L. and T.Z.; visualization, H.T.; supervision, W.Z. (Wanli Zhu); methodology, G.L. and Y.K. All authors have read and agreed to the published version of the manuscript.

Funding

This work was funded by the Key Research and Development Project in Turpan, Xinjiang, China (2023007), Basic Research Funds for Higher Education Institutions of Xinjiang Education Department (XJEDU2024J036), Tianshan Talent Training Program (2023TSYCCX0081), Xinjiang Tianchi Talents (Young Doctor).

Institutional Review Board Statement

Not applicable.

Informed Consent Statement

Informed consent was obtained from all subjects involved in the study.

Data Availability Statement

The data presented in this study are available on request from the corresponding author.

Conflicts of Interest

Author Zhongming Wu is employed by Xinjiang Zhongtai New Energy Co., Ltd., Authors Weidong Zhu, Haijun Guo, Yong Zhang, Chaoji Shen, Jing Guo, Ming Liu, Tuanwei Zhao, Hu Teng, Wanli Zhu and Yongfu Kang are employed by Xinjiang Shengxiong Energy Co., Ltd. The authors declare no conflictss of interest.

References

  1. Dao, N.B.; Chu, L.K.; Shahbaz, M.; Tran, T.H. Natural resources-environmental technology-ecological footprint nexus, Does natural resources rents diversification make a difference. J. Environ. Manag. 2024, 359, 123036. [Google Scholar] [CrossRef] [PubMed]
  2. Dong, Z.; Bian, Z.; Jin, W.; Guo, X.; Zhang, Y.; Liu, X.; Wang, C.; Guan, D. An integrated approach to prioritizing ecological restoration of abandoned mine lands based on cost-benefit analysis. Sci Total Environ. 2024, 924, 171579. [Google Scholar] [CrossRef] [PubMed]
  3. Feng, Z.; Cui, Y.; Zhang, H.; Gao, Y. Assessment of human consumption of ecosystem services in China from 2000 to 2014 based on an ecosystem service footprint model. Ecol. Indic. 2018, 94, 468–481. [Google Scholar] [CrossRef]
  4. Heydari, M.; Osanloo, M. Untangling the complex web of environmental, social, and economic impacts in deep and large-scale open-pit mining projects using a dynamic modeling framework. Resour. Policy 2024, 90, 104690. [Google Scholar] [CrossRef]
  5. Hopmans, J.W.; Qureshi, A.S.; Kisekka, I.; Munns, R.; Grattan, S.R.; Rengasamy, P.; Ben-Gal, A.; Assouline, S.; Javaux, M.; Minhas, P.S.; et al. Critical knowledge gaps and research priorities in global soil salinity. Adv. Agron. 2021, 169, 1–191. [Google Scholar]
  6. Feng, H.; Zhou, J.; Zhou, A.; Bai, G.; Li, Z.; Chen, H.; Su, D.; Han, X. Grassland ecological restoration based on the relationship between vegetation and its below-ground habitat analysis in steppe coal mine area. Sci. Total Environ. 2021, 778, 146221. [Google Scholar] [CrossRef]
  7. Habel, M.; Nowak, B.; Szadek, P. Evaluating indicators of hydrologic alteration to demonstrate the impact of open-pit lignite mining on the flow regimes of small and medium-sized rivers. Ecol. Indic. 2023, 157, 111295. [Google Scholar] [CrossRef]
  8. Habumugisha, T.; Zhang, Z.; Uwizewe, C.; Yan, C.; Ndayishimiye, J.C.; Rehman, A.; Zhang, X. Toxicological review of micro- and nano-plastics in aquatic environments: Risks to ecosystems, food web dynamics and human health. Ecotoxicol. Environ. Saf. 2024, 278, 116426. [Google Scholar] [CrossRef]
  9. Carabassa, V.; Ortiz, O.; Alcañiz, J.M. RESTOQUARRY: Indicators for self-evaluation of ecological restoration in open-pit mines. Ecol. Indic. 2019, 102, 437–445. [Google Scholar] [CrossRef]
  10. Chen, J.; Mo, L.; Zhang, Z.; Nan, J.; Xu, D.; Chao, L.; Zhang, X.; Bao, Y. Evaluation of the ecological restoration of a coal mine dump by exploring the characteristics of microbial communities. Appl. Soil Ecol. 2020, 147, 103430. [Google Scholar] [CrossRef]
  11. Niu, X.; Li, Y. Remote Sensing Evaluation of Ecological Environment of Anqing City Based on Remote Sensing Ecological Index. Int. Arch. Photogramm. Remote Sens. Spat. Inf. Sci. 2020, XLIII-B3-2020, 733–737. [Google Scholar] [CrossRef]
  12. Roy, R.; Wang, J.; Mostofa, M.G.; Fornara, D.; Sikdar, A.; Sarker, T.; Wang, X.; Jahan, M.S. Fine-tuning of soil water and nutrient fertilizer levels for the ecological restoration of coal-mined spoils using Elaeagnus angustifolia. J. Environ. Manag. 2020, 270, 110855. [Google Scholar] [CrossRef] [PubMed]
  13. Wang, H.; Zhou, W.; Guan, Y.; Wang, J.; Ma, R. Monitoring the ecological restoration effect of land reclamation in open-pit coal mining areas: An exploration of a fusion method based on ZhuHai-1 and Landsat 8 data. Sci. Total Environ. 2023, 904, 166324. [Google Scholar] [CrossRef]
  14. Wang, Y.; Qin, K.; Zhang, Z.; He, Q.; Cohen, J. Mapping open-pit mining area in complex mining and mixed land cover zone using Landsat imagery. Int. J. Appl. Earth Obs. Geoinf. 2024, 129, 103782. [Google Scholar] [CrossRef]
  15. Wu, X.; Xing, C.; Ju, Q.; Su, S.; Zhang, X.; Zhu, T. Research progress in mining ecological restoration technology. J. Ind. Saf. 2024, 1, 100004. [Google Scholar] [CrossRef]
  16. Xu, Y.; Guo, L.; Li, J.; Zhang, C.; Ran, W.; Hu, J.; Mao, H. Automatically identifying the vegetation destruction and restoration of various open-pit mines utilizing remotely sensed images: Auto-VDR. J. Clean. Prod. 2023, 414, 137490. [Google Scholar] [CrossRef]
  17. Zhang, B.; Fang, H.; Wu, S.; Li, C.; Wang, Y.; Siddique, K.H.M. Soil erosion prediction and spatiotemporal heterogeneity in driving effects of precipitation and vegetation on the northern slope of Tianshan Mountain. J. Clean. Prod. 2024, 459, 142561. [Google Scholar] [CrossRef]
  18. Yang, X.; Bai, X.; Yao, W.; Li, P.; Hu, J.; Kang, L. Spatioemporal dynamics and driving forces of soil organic carbon changes in an arid coal mining area of China investigated based on remote sensing techniques. Ecol. Indic. 2024, 158, 111453. [Google Scholar] [CrossRef]
  19. Espitia-Perez, L.; Arteaga-Pertuz, M.; Soto, J.S.; Espitia-Perez, P.; Salcedo-Arteaga, S.; Pastor-Sierra, K.; Galeano-Paez, C.; Brango, H.; da Silva, J.; Henriques, J.A.P. Geospatial analysis of residential proximity to open-pit coal mining areas in relation to micronuclei frequency, particulate matter concentration, and elemental enrichment factors. Chemosphere 2018, 206, 203–216. [Google Scholar] [CrossRef]
  20. Zhou, Y. Natural resources and green economic growth: A pathway to innovation and digital transformation in the mining industry. Resour. Policy 2024, 90, 104667. [Google Scholar] [CrossRef]
  21. Zhu, X.; Li, P.; Wang, B.; Zhao, S.; Zhang, T.; Yao, Q. Construction of landscape eco-geological risk assessment framework in coal mining area using multi-source remote sensing data. Ecol. Inform. 2024, 81, 102635. [Google Scholar] [CrossRef]
  22. Zou, C.; Wu, S.; Yang, Z.; Pan, S.; Wang, G.; Jiang, X.; Guan, M.; Yu, C.; Yu, Z.; Shen, Y. Progress, challenge and significance of building a carbon industry system in the context of carbon neutrality strategy. Pet. Explor. Dev. 2023, 50, 210–228. [Google Scholar] [CrossRef]
  23. Xu, H.; Xu, F.; Lin, T.; Xu, Q.; Yu, P.; Wang, C.; Aili, A.; Zhao, X.; Zhao, W.; Zhang, P.; et al. A systematic review and comprehensive analysis on ecological restoration of mining areas in the arid region of China: Challenge, capability and reconsideration. Ecol. Indic. 2023, 154, 110630. [Google Scholar] [CrossRef]
  24. Wang, Y.; Shen, Z.; Zhang, Z. Phosphorus Speciation and Nutrient Stoichiometry in the Soil-Plant System During Primary Ecological Restoration of Copper Mine Tailings. Pedosphere 2018, 28, 530–541. [Google Scholar] [CrossRef]
  25. Trechera, P.; Moreno, T.; Córdoba, P.; Moreno, N.; Zhuang, X.; Li, B.; Li, J.; Shangguan, Y.; Dominguez, A.O.; Kelly, F.; et al. Comprehensive evaluation of potential coal mine dust emissions in an open-pit coal mine in Northwest China. Int. J. Coal Geol. 2021, 235, 103677. [Google Scholar] [CrossRef]
  26. Leyton-Flor, S.A.; Sangha, K. The socio-ecological impacts of mining on the well-being of Indigenous Australians: A systematic review. Extr. Ind. Soc. 2024, 17, 101429. [Google Scholar] [CrossRef]
  27. Cao, Y.; Ai, Z.; Dang, X.; Hou, M.; Liu, H.; Li, Q.; Yao, Y.; Deng, Y.; Zhu, S.; Xiao, L. Effects of different reclamation measures on soil quality restoration in open-pit mines: A meta-analysis based on the Chinese Loess Plateau. Ecol. Eng. 2024, 203, 107257. [Google Scholar] [CrossRef]
  28. Wulandari, D.; Nufus, M.; Faridah, E.; Maulana, A.F.; Tawaraya, K. Native arbuscular mycorrhizal fungi and Nauclea orientalis for potential reclamation of tropical coal mining areas. Environ. Adv. 2024, 15, 100462. [Google Scholar] [CrossRef]
  29. Yao, Y.; Li, S.; Bai, R. Creep characteristics and discharge optimization of overlying river inner dump: A case study of Yuanbaoshan open-pit coal mine in China. Heliyon 2024, 10, e26046. [Google Scholar] [CrossRef]
  30. Wang, Z.; Luo, K.; Zhao, Y.; Lechner, A.M.; Wu, J.; Zhu, Q.; Sha, W.; Wang, Y. Modelling regional ecological security pattern and restoration priorities after long-term intensive open-pit coal mining. Sci. Total Environ. 2022, 835, 155491. [Google Scholar] [CrossRef]
  31. Wang, H.; Liu, H.; Yang, T.; Lv, G.; Li, W.; Chen, Y.; Wu, D. Mechanisms underlying the succession of plant rhizosphere microbial community structure and function in an alpine open-pit coal mining disturbance zone. J. Environ. Manag. 2023, 325 Pt A, 116571. [Google Scholar] [CrossRef]
  32. Zuo, Y.-W.; Li, W.-Q.; Zeng, Y.-L.; Xia, C.-Y.; Zhang, H.; Zhang, Z.; Zhang, X.; Deng, H.-P. Changes in the soil microenvironment during ecological restoration of forest parks in megacities. Ecol. Indic. 2024, 166, 112261. [Google Scholar] [CrossRef]
  33. Zhang, Y.; Shang, K. Evaluation of mine ecological environment based on fuzzy hierarchical analysis and grey relational degree. Environ. Res. 2024, 257, 119370. [Google Scholar] [CrossRef] [PubMed]
  34. Kujala, K.; Postila, H.; Heiderscheidt, E.; Maljanen, M.; Tiirola, M. Year-round activity of microbial communities in cold-climate peatlands treating mining-affected waters. Soil Biol. Biochem. 2024, 189, 109258. [Google Scholar] [CrossRef]
  35. Franco-Rozo, M.C.; Blanco-Torres, A.; Gómez-Valencia, B.; Etter, A. Biodiversity responses to landscape transformations caused by open-pit coal mining: An assessment on bats and dung beetles in a Colombian tropical dry forest. Environ. Sustain. Indic. 2024, 21, 100335. [Google Scholar] [CrossRef]
  36. Santana-Martinez, J.C.; Aguirre-Monroy, A.M.; MacKenzie, M.D.; Lanoil, B.D. The impact of reclamation and vegetation removal on compositional and functional attributes of soil microbial communities in the Athabasca Oil Sands Region. Appl. Soil Ecol. 2024, 198, 105368. [Google Scholar] [CrossRef]
  37. Zhou, G.; Xu, Y.; Wang, Y.; Zheng, L.; Zhang, Y.; Li, L.; Sun, B.; Li, S.; Zhu, Y. Study on MICP dust suppression technology in open pit coal mine: Preparation and mechanism of microbial dust suppression material. J. Environ. Manag. 2023, 343, 118181. [Google Scholar] [CrossRef]
  38. Huang, S.; Xia, J.; Wang, G.; Lei, J. The impact of flood regime on river floodplain vegetation coverage: Insights from a 30-year Landsat record. J. Hydrol. 2023, 626, 130355. [Google Scholar] [CrossRef]
  39. Ma, R.; Zhang, J.; Shen, X.; Liu, B.; Lu, X.; Jiang, M. Impacts of climate change on fractional vegetation coverage of temperate grasslands in China from 1982 to 2015. J. Environ. Manag. 2024, 350, 119694. [Google Scholar] [CrossRef]
  40. Xiao, W.; Deng, X.; He, T.; Guo, J. Using POI and time series Landsat data to identify and rebuilt surface mining, vegetation disturbance and land reclamation process based on Google Earth Engine. J. Environ. Manag. 2023, 327, 116920. [Google Scholar] [CrossRef]
  41. Zhang, X.; Song, J.; Wang, Y.; Sun, H.; Li, Q. Threshold effects of vegetation coverage on runoff and soil loss in the Loess Plateau of China: A meta-analysis. Geoderma 2022, 412, 115720. [Google Scholar] [CrossRef]
  42. Zocche, J.J.; Sehn, L.M.; Pillon, J.G.; Schneider, C.H.; Olivo, E.F.; Raupp-Pereira, F. Technosols in coal mining areas: Viability of combined use of agro-industry waste and synthetic gypsum in the restoration of areas degraded. Clean. Eng. Technol. 2023, 13, 100618. [Google Scholar] [CrossRef]
  43. Palmer, M.J.; Jamieson, H.E.; Radkova, A.B.; Maitland, K.; Oliver, J.; Falck, H.; Richardson, M. Mineralogical, geospatial, and statistical methods combined to estimate geochemical background of arsenic in soils for an area impacted by legacy mining pollution. Sci. Total Environ. 2021, 776, 145926. [Google Scholar] [CrossRef] [PubMed]
  44. Wang, H.; Gui, D.; Liu, Q.; Feng, X.; Qu, J.; Zhao, J.; Wang, G.; Wei, G. Vegetation coverage precisely extracting and driving factors analysis in drylands. Ecol. Inform. 2024, 79, 102409. [Google Scholar] [CrossRef]
  45. Bai, X.; Zhao, W.; Luo, W.; An, N. Effect of climate change on the seasonal variation in photosynthetic and non-photosynthetic vegetation coverage in desert areas, Northwest China. Catena 2024, 239, 107954. [Google Scholar] [CrossRef]
  46. Morash, J.; Pamuru, S.T.; Lea-Cox, J.D.; Ristvey, A.G.; Davis, A.P.; Aydilek, A.H. Using organic amendments in disturbed soil to enhance soil organic matter, nutrient content and turfgrass establishment. Sci. Total Environ. 2024, 945, 174033. [Google Scholar] [CrossRef]
  47. Pan, L.; Shi, D.; Jiang, G.; Xu, Y. Impacts of different management measures on soil nutrients and stoichiometric characteristics for sloping farmland under erosive environments in the Three Gorges Reservoir Area, China. Soil Tillage Res. 2024, 244, 106173. [Google Scholar] [CrossRef]
  48. Shukla, A.K.; Behera, S.K.; Basumatary, A.; Sarangthem, I.; Mishra, R.; Dutta, S.; Sikaniya, Y.; Sikarwar, A.; Shukla, V.; Datta, S.P. PCA and fuzzy clustering-based delineation of soil nutrient (S, B, Zn, Mn, Fe, and Cu) management zones of sub-tropical Northeastern India for precision nutrient management. J. Environ. Manag. 2024, 365, 121511. [Google Scholar] [CrossRef]
  49. Wang, Y.; Wang, Y.; Li, J.; Cai, Y.; Hu, M.; Lin, W.; Wu, Z. Effects of continuous monoculture on rhizosphere soil nutrients, growth, physiological characteristics, hormone metabolome of Casuarina equisetifolia and their interaction analysis. Heliyon 2024, 10, e26078. [Google Scholar] [CrossRef]
  50. Liu, S.; Chen, X.; Xia, X.; Jin, Y.; Wang, G.; Jia, H.; Huang, D. Electronic sensing combined with machine learning models for predicting soil nutrient content. Comput. Electron. Agric. 2024, 221, 108947. [Google Scholar] [CrossRef]
Figure 1. (a) The province map of the study area location; (b) the city map of study area location; (c) distribution map of specific terrain and sampling points of the mining area.
Land 13 01690 g001
Figure 2. (a) Drone aerial view of mining area; (b) mine dump; (c) dump section view; (d) vegetated area.
Land 13 01690 g002
Figure 3. The FVC distribution map of the study area in (a) 2018, (b) 2020, (c) 2022 and (d) 2023.
Land 13 01690 g003
Figure 4. FVC percentage of the study area.
Land 13 01690 g004
Figure 5. The distribution map of the RSEI in the study area.
Land 13 01690 g005
Figure 6. RSEI percentage of the study area.
Land 13 01690 g006
Figure 7. The distribution map of LST and WET by the RSEI in the study area.
Land 13 01690 g007
Figure 8. Soil nutrient data map at different sampling sites.
Land 13 01690 g008
Figure 9. Correlation analysis of soil nutrient content and vegetation coverage by (a) in situ restoration and (b) vegetation mine restoration.
Land 13 01690 g009
Disclaimer/Publisher’s Note: The statements, opinions and data contained in all publications are solely those of the individual author(s) and contributor(s) and not of MDPI and/or the editor(s). MDPI and/or the editor(s) disclaim responsibility for any injury to people or property resulting from any ideas, methods, instructions or products referred to in the content.

