Article

Mutual Causality Between Urban Transport Superiority Degree and Urban Land Use Efficiency: Insights from County Cities in Gansu Province Under the Belt and Road Initiative

1
College of Forestry, Gansu Agricultural University, Lanzhou 730070, China
2
College of Resources and Environment, Gansu Agricultural University, Lanzhou 730070, China
3
College of Mathematics and Physics, Gansu Agricultural University, Lanzhou 730070, China
*
Author to whom correspondence should be addressed.
Land 2024, 13(11), 1787; https://doi.org/10.3390/land13111787
Submission received: 3 September 2024 / Revised: 18 October 2024 / Accepted: 28 October 2024 / Published: 30 October 2024

Abstract

:
Exploring the coupled coordination and interaction between urban transport superiority degree (UTSD) and urban land use efficiency (ULUE) is the key to promoting efficient land use in cities and coordinated development. This paper adopts the improved UTSD model, super-efficiency slack-based measure–undesirable output model, coupling coordination degree model (CCDM), panel Granger causality test, random forest model, and the mixed geographically and temporally weighted regression model to reveal the spatial and temporal evolution and coupling characteristics of UTSD and ULUE in Gansu from 2005 to 2020 and to validate and explore the interaction mechanism between UTSD and ULUE. The results show that (1), from 2005 to 2020, the average UTSD in Gansu increased from 0.56 to 1.01 and the Belt and Road Initiative accelerated the construction of the transportation network in Gansu. The average ULUE increased from 0.52 to 0.62; the spatial distribution of ULUE was high in the west and north and low in the east and south. (2) From 2005 to 2020, the average CCDM of UTSD and ULUE in Gansu increased from slightly unbalanced (0.37) to slightly balanced (0.52). A spatially high UTSD and high ULUE agglomeration area can be found along the transportation arteries. (3) The UTSD and ULUE were mutually causal, with the degree of transportation arterial influence degree being the strongest driver of ULUE among the components of UTSD (30.41% contribution) and tax revenue being the strongest driver of UTSD among the components of ULUE (15.10% contribution). Overall, the connotation of ULUE puts forward the demand for improving the transportation infrastructure and, at the same time, provides the guarantee for UTSD upgrading, which in turn affects the ULUE. In the future, the Xinan region of Gansu should prioritize planning and construction of a transportation network. The results of this study can provide a scientific basis for the construction of transportation networks and the efficient use of urban land in Gansu and other regions.

1. Introduction

Transportation networks break down geographical barriers, enhance exchange and communication among different regions, and greatly expand the space for human development [1]. The opening of the ancient Silk Road and the New Road both had a profound impact on the world [2]. In modern times, waterway transportation has led to a “T” shape in the focus of China’s territorial development (along the Yangtze River and the coastline). Cities such as Shijiazhuang, Zhengzhou, and Zhuzhou have flourished as land transportation hubs due to the construction of railways. It can be seen that transportation infrastructure is an important part of regional advantages and an important force in shaping regional development patterns [3,4]. The urban transport superiority degree (UTSD) was proposed by Professor Jin Fengjun and other professors in 2008 and has since been widely used by scholars. The UTSD refers to the relative superiority of a city in the regional transport network. It includes the city’s comprehensive advantages over other cities in terms of transport accessibility, transport cost, infrastructure level, service efficiency, and transport hub status [5]. We have adopted the latest methodology to assess UTSD in terms of “quantity” (the scale of transport infrastructure), “quality” (the capability characteristics of transport infrastructure), and “situation” (the advantageous status of a single individual city in the region as a whole). The UTSD can fully reflect the supporting ability and guarantee levels of transport infrastructure in regard to regional development [6,7].
Land supports human life, and, since the Industrial Revolution, urban land has become the most concentrated area in terms of human production and life, with human demand for urban land resources increasing drastically [8]. The rapid expansion of urban land has become a key concern for scholars, and the ideal coefficient of urban expansion (urban land–growth rate/urban population–growth rate) proposed by the United Nations Commission on Sustainable Development is 1.12, while the coefficient of China’s urban expansion over the past 40 years has been as high as 2.19 [9,10]. Therefore, exploring the input and output of urban land use and measuring the urban land use efficiency (ULUE) have become the key scientific issues that can help people improve land use and achieve the maximum output with the most reasonable input [11]. The ULUE refers to the effects and outcomes of the arrangement of the quantity, distribution, and use of urban land on the ratio of inputs to outputs of the city’s economic, social, and cultural activities, as well as on the urban environment [12]. Efficient land use is defined as land development and utilization activities that no longer have the potential to enhance anyone’s welfare without worsening the situation of others [13]. At the level of ULUE measurements, data envelopment analysis (DEA), stochastic frontier analysis, and Malmquiest production function have become the most widely used methods by scholars [14,15,16]. In recent years, with the promotion of the construction of ecological civilization, researchers have gradually put the economic benefits, social effects, and ecological effects of land use in parallel. They have paid more attention to some unexpected outputs, such as wastewater, exhaust gas, and soil pollution, caused by urban land use. The super-efficiency slack-based measure–undesirable output (S-SBM-U) model developed based on the DEA model better solves the problem of slack variables of undesirable outputs and input–outputs, and it is used widely in ULUE measurements at various spatial scales [17,18].
Transportation infrastructure building has long been considered an important means of promoting regional development [19,20]. There are many “airport cities” and “high-speed rail cities” that have formed around airports and high-speed rail stations, and, even along ordinary roads, it is easier to form a concentration of settlements [21,22]. Macroscale studies have shown that high-level transportation networks (airports, high-speed rail, highways, etc.) have significant spatial and temporal compression and scale effects, increasing the non-local connectivity of urban units and facilitating the exchange of factors between cities [23,24]. For example, the positive effect of high-speed rail on the expansion of urban construction land is significant and contributes to the improvement of ULUE; the promotion effect is more significant in central and western China [25,26]; the coordination between highway accessibility and ULUE is higher in core cities and lower in other regions [27]; airport construction contributes positively to ULUE after having dense routes and forming aviation complexes [28]. However, the effects of high-speed rail and highways have been suggested to spill over into areas along the lines. They are a powerful driver of urban land expansion, which can reduce the overall ULUE value [25,29]. Airports have an extremely limited impact on ULUE because they are located far from urban areas [30]. Microscale studies have shown that each additional mile of state highway leads to a 468-acre increase in building land [31]; bus rapid transit and subways promote urban decentralization and building land-expansion decentralization [32]. For regions with well-developed transportation infrastructures, the construction of new additional transportation networks does not have a significant impact on the economic benefits of land use but may lead to other undesirable outcomes, such as air pollution [33]. Some studies have shown that transportation networks led to a 14.8% increase in PM10 emissions from construction land, along with an increase in other pollutant emissions, so the use of more transportation infrastructures does not guarantee improvement [34,35]. In summary, the change in transport infrastructure construction and UTSD affects the amount, distribution, and state of use of urban construction land, so it will lead to the change in ULUE [36]. At the same time, in regard to urban land use and road network construction, whether it is in the development of new cities or the transformation of old cities, the improvement of traffic advantages is an important concern as it allows for all kinds of resources to be used more efficiently [21]. However,, economic scale is not the same as economic efficiency, and whether the increase in UTSD can effectively contribute to the rise in ULUE needs to be studied in depth in different regions. Overall, existing studies mostly focus on explaining the spatiotemporal relationship between a particular mode of transport and ULUE, neglecting the fact that all types of transport operate as a system as a whole in regional space [22,37], which may lead to over-amplification or distortion of the impact of that mode of transport on ULUE and is the reason for the large differences in the results of existing studies [31]. In addition, studies have focused on elucidating the impact of UTSD on the ULUE, with theoretical inferences suggesting that urban land use prompts the need for UTSD upgrading, but there is insufficient exploration of the intrinsic mechanism of action between UTSD and ULUE [38].
The Belt and Road Initiative aims to reconnect the land Silk Road and build the Silk Road Economic Belt, which will help diversify China’s territorial development priorities [39]. Currently, Gansu is the key region for constructing the land-based Silk Road Economic Belt [40]. Therefore, exploring the spatiotemporal relationship and interaction between UTSD and ULUE in Gansu under the Belt and Road Initiative is an extension and enrichment of the theoretical system of transportation and land use which can help accelerate the flow of regional resources; promote industrial agglomeration and optimization; enhance the efficient use of all kinds of resources, including land; and promote inter-regional connectivity and synergistic development. This study examines the counties in Gansu as the research unit and constructs a comprehensive urban transport superiority degree (UTSD) evaluation system that includes three aspects of quality, quantity, and situation, introducing a ULUE evaluation system that considers undesirable outputs and slack variables (Figure 1) [41]. We used multiple spatial analysis models to identify the level of coupled coordinated development and spatial clustering characteristics between UTSD and ULUE [42]. After confirming the smoothness of the data, the panel Granger causality test (PGCT) was conducted to explore the possible causal relationship between the UTSD and ULUE [43]. Based on this, a random forest (RF) model is used to explore the intrinsic relationship and mechanism of the role of UTSD and ULUE [44]. Combined with the mixed geographically and temporally weighted regression (MGTWR) model to analyze the spatial heterogeneity of the interaction between UTSD and ULUE [45], the interaction mechanism between the construction of UTSD and ULUE is revealed. Specific research objectives include (1) revealing the changing trends and spatial distribution characteristics of the UTSD and ULUE in Gansu from 2005 to 2020; (2) exploring the level of coupled and coordinated spatial agglomeration characteristics and their evolution with respect to UTSD and ULUE in the context of the Belt and Road Initiative; (3) verifying the causal relationship between UTSD and ULUE and further explaining the interaction and mechanism of the relationship between UTSD and ULUE. This study helps to explore the interaction between UTSD and ULUE and provides a reference for the construction of the Belt and Road Initiative and the efficient and intensive use of urban land.

2. Materials and Methods
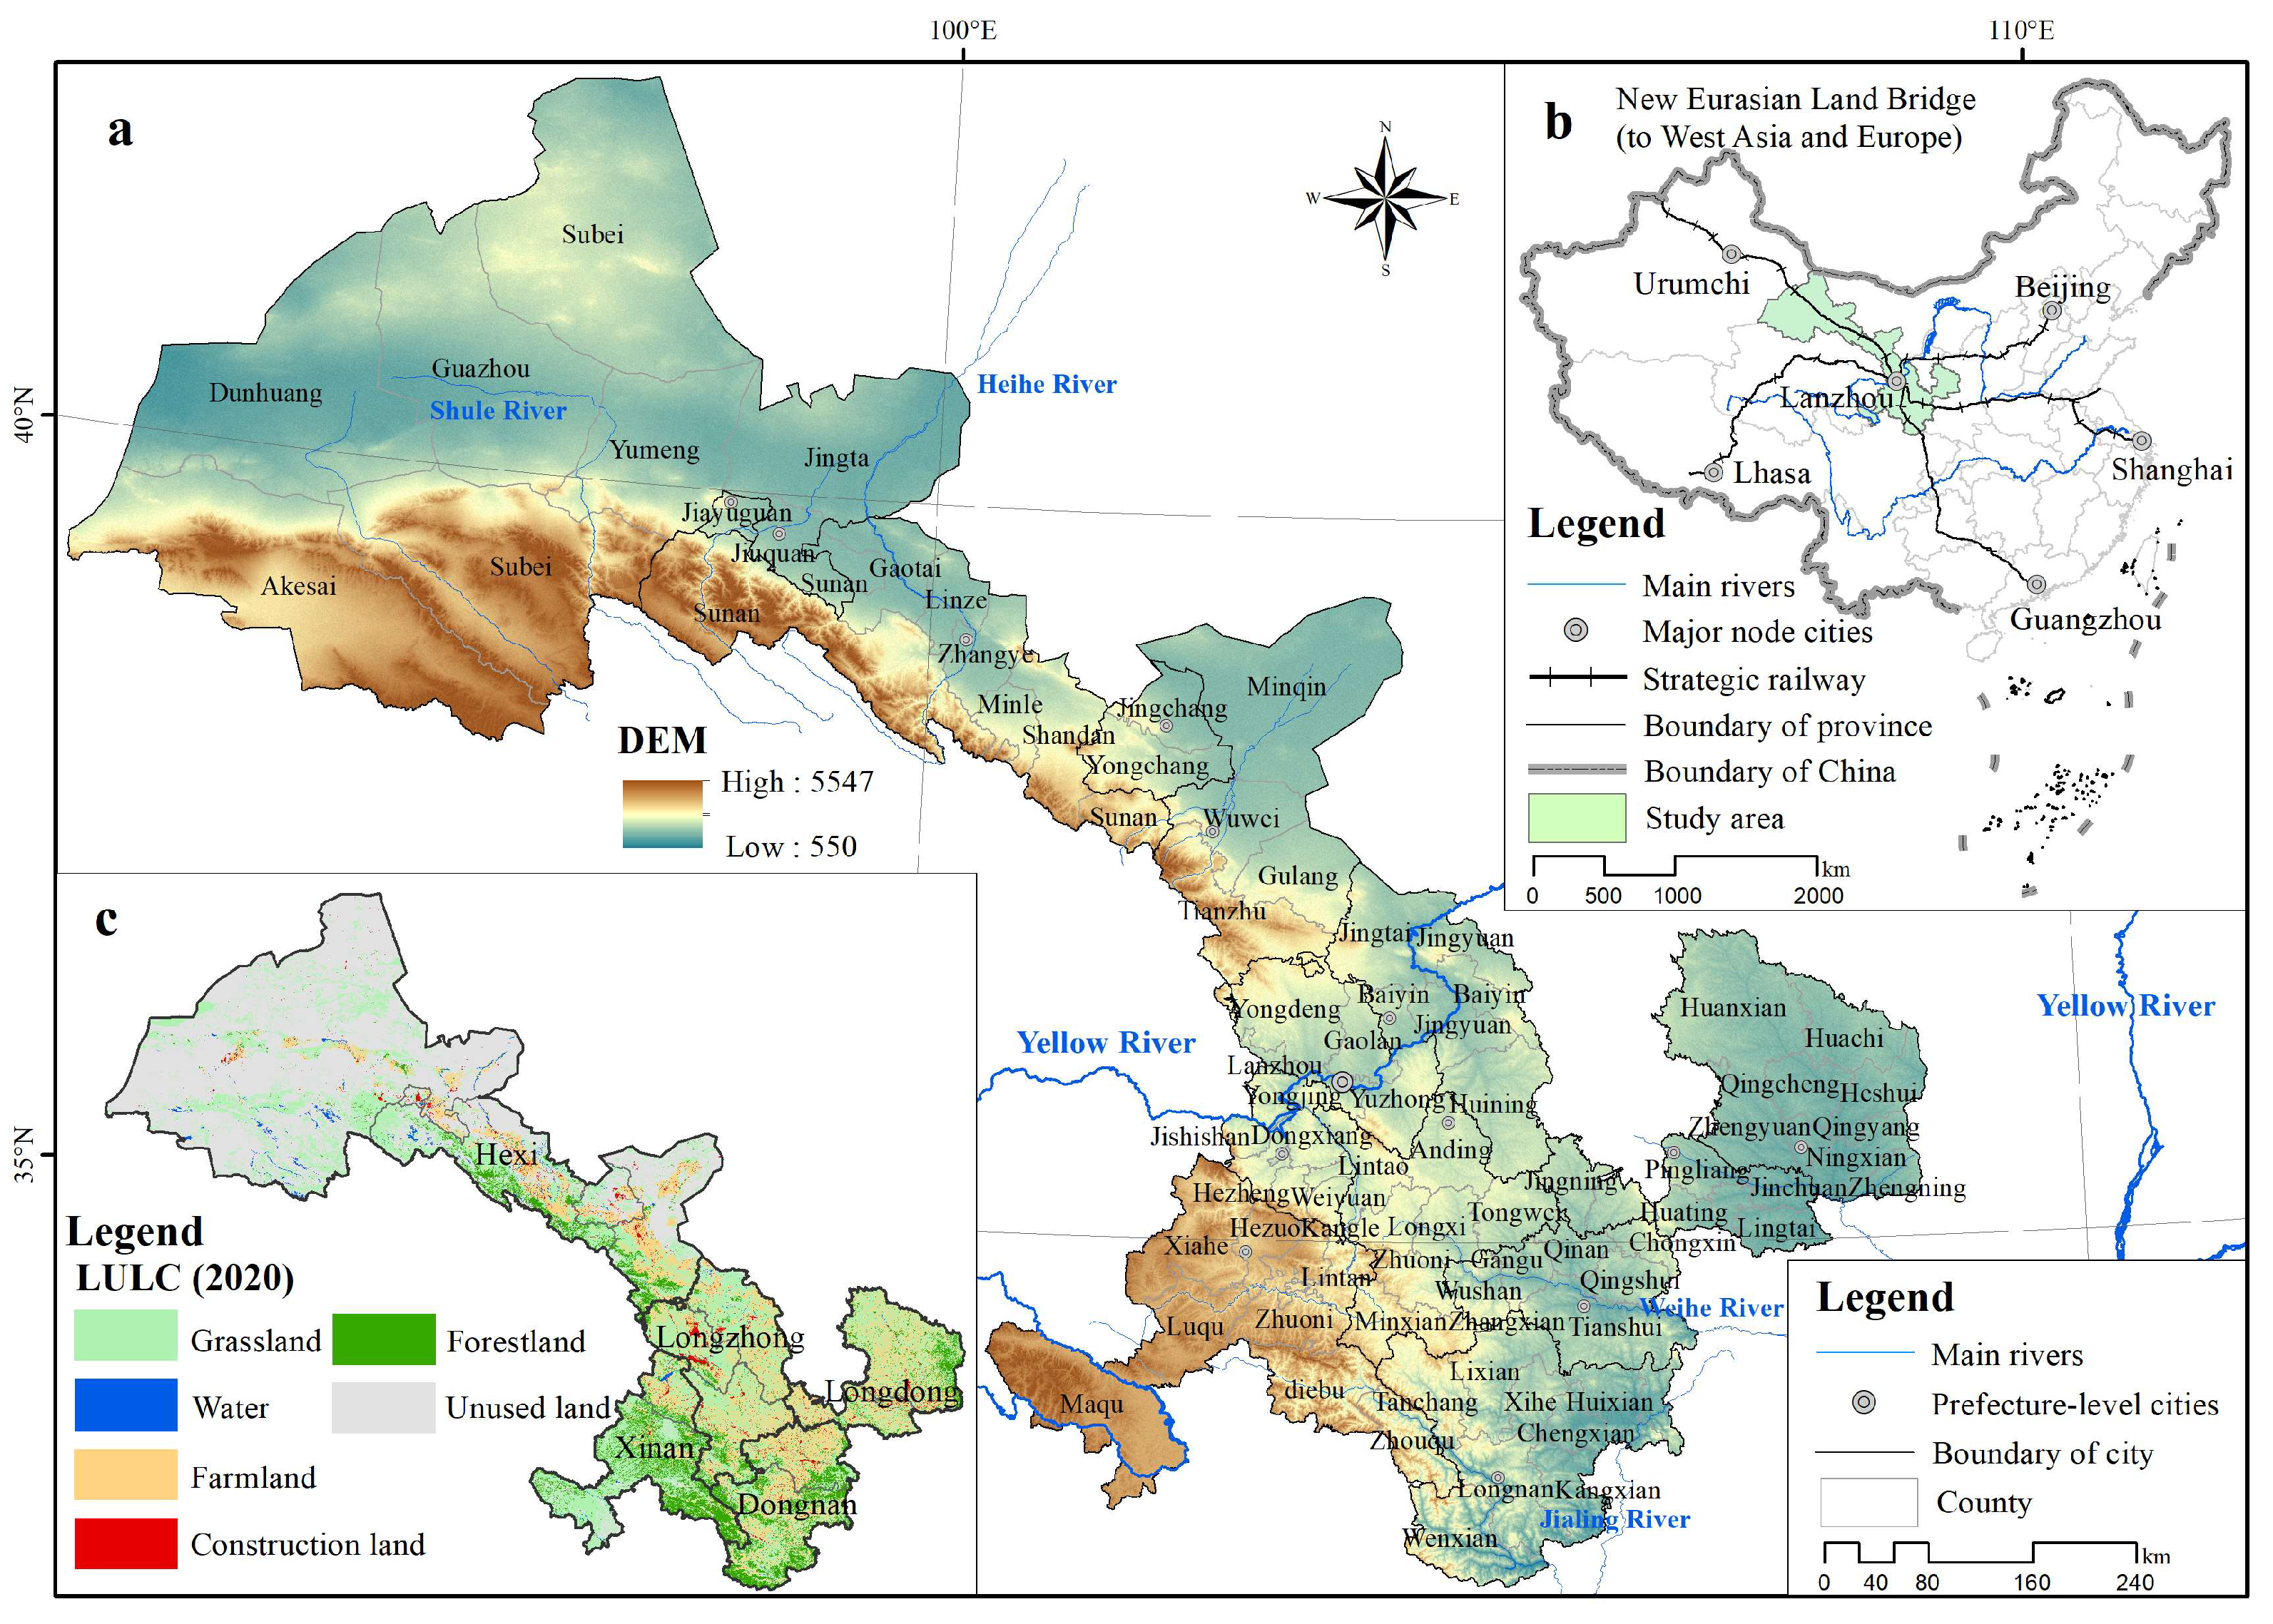
2.1. Study Area

Gansu Province (32°11′–42°57′ N, 92°13′–108°46′ E) is located in northwestern China. The terrain slopes from southwest to northeast and is bordered by the Qinghai–Tibet Plateau in the west and the Loess Plateau and Inner Mongolia Plateau in the east. Gansu Province lies at the junction of three plateaus, with a long and narrow terrain. Since ancient times, it has been a transport corridor connecting the central plains with the western regions (Figure 2a). At present, the New Asia–Europe Continental Bridge (Longhai–Lanxin Railway) runs across the east and west, which is China’s land transportation hub connecting West Asia and Europe. It is also an important transportation hub linking North, East, and South China with Northwest China and Qinghai–Tibet (Figure 2b). Gansu Province is an important energy and industrial base in China, and industry and the service industry are the pillar industries. The economic growth rate since the 21st century has become high, and, in 2020, the second and third industries accounted for more than 85 percent of the total economy, with the expansion of construction land as a carrier of the second and third industries being rapid. Gansu comprises 14 cities and prefectures and 86 county-level divisions, covering an area of 455,900 km2 (Figure 2a) [46]. This study takes counties as the research scale, but because Gansu contains more districts and counties, in order to describe and display the differences among different regions, subregional statistics are added after the county research results. Gansu Province is divided into five regions: Hexi, Longzhong, Xinan, Longdong, and Dongnan (based on the geographical division of Gansu Province, see Figure 2 for specific divisions). The Hexi region in western Gansu is deep in the interior of the continent (Figure 2c), with perennial drought and little rainfall, and the land cover is dominated by the Gobi Desert and other unused land, covering an area of more than 170,000 km2. The famous cities of Wuwei, Zhangye, and Jiuquan are all oases nurtured by the snowy waters of the Qilian Mountains. Although eastern Gansu receives more precipitation than the west, the terrain is predominantly mountainous and the plateau and cities are located in mountain valleys [47]. In general, Gansu has limited resources for construction land. Therefore, it is of rich theoretical and practical significance to explore the spatiotemporal relationship between transportation network construction and ULUE and their interactive effects in Gansu under the background of the Belt and Road.

2.2. Data Sources

This study contains three main types of data: geographic environmental data, transportation network data, and socioeconomic data [13,21,42,48]. All data sources and descriptions are listed in Table 1.

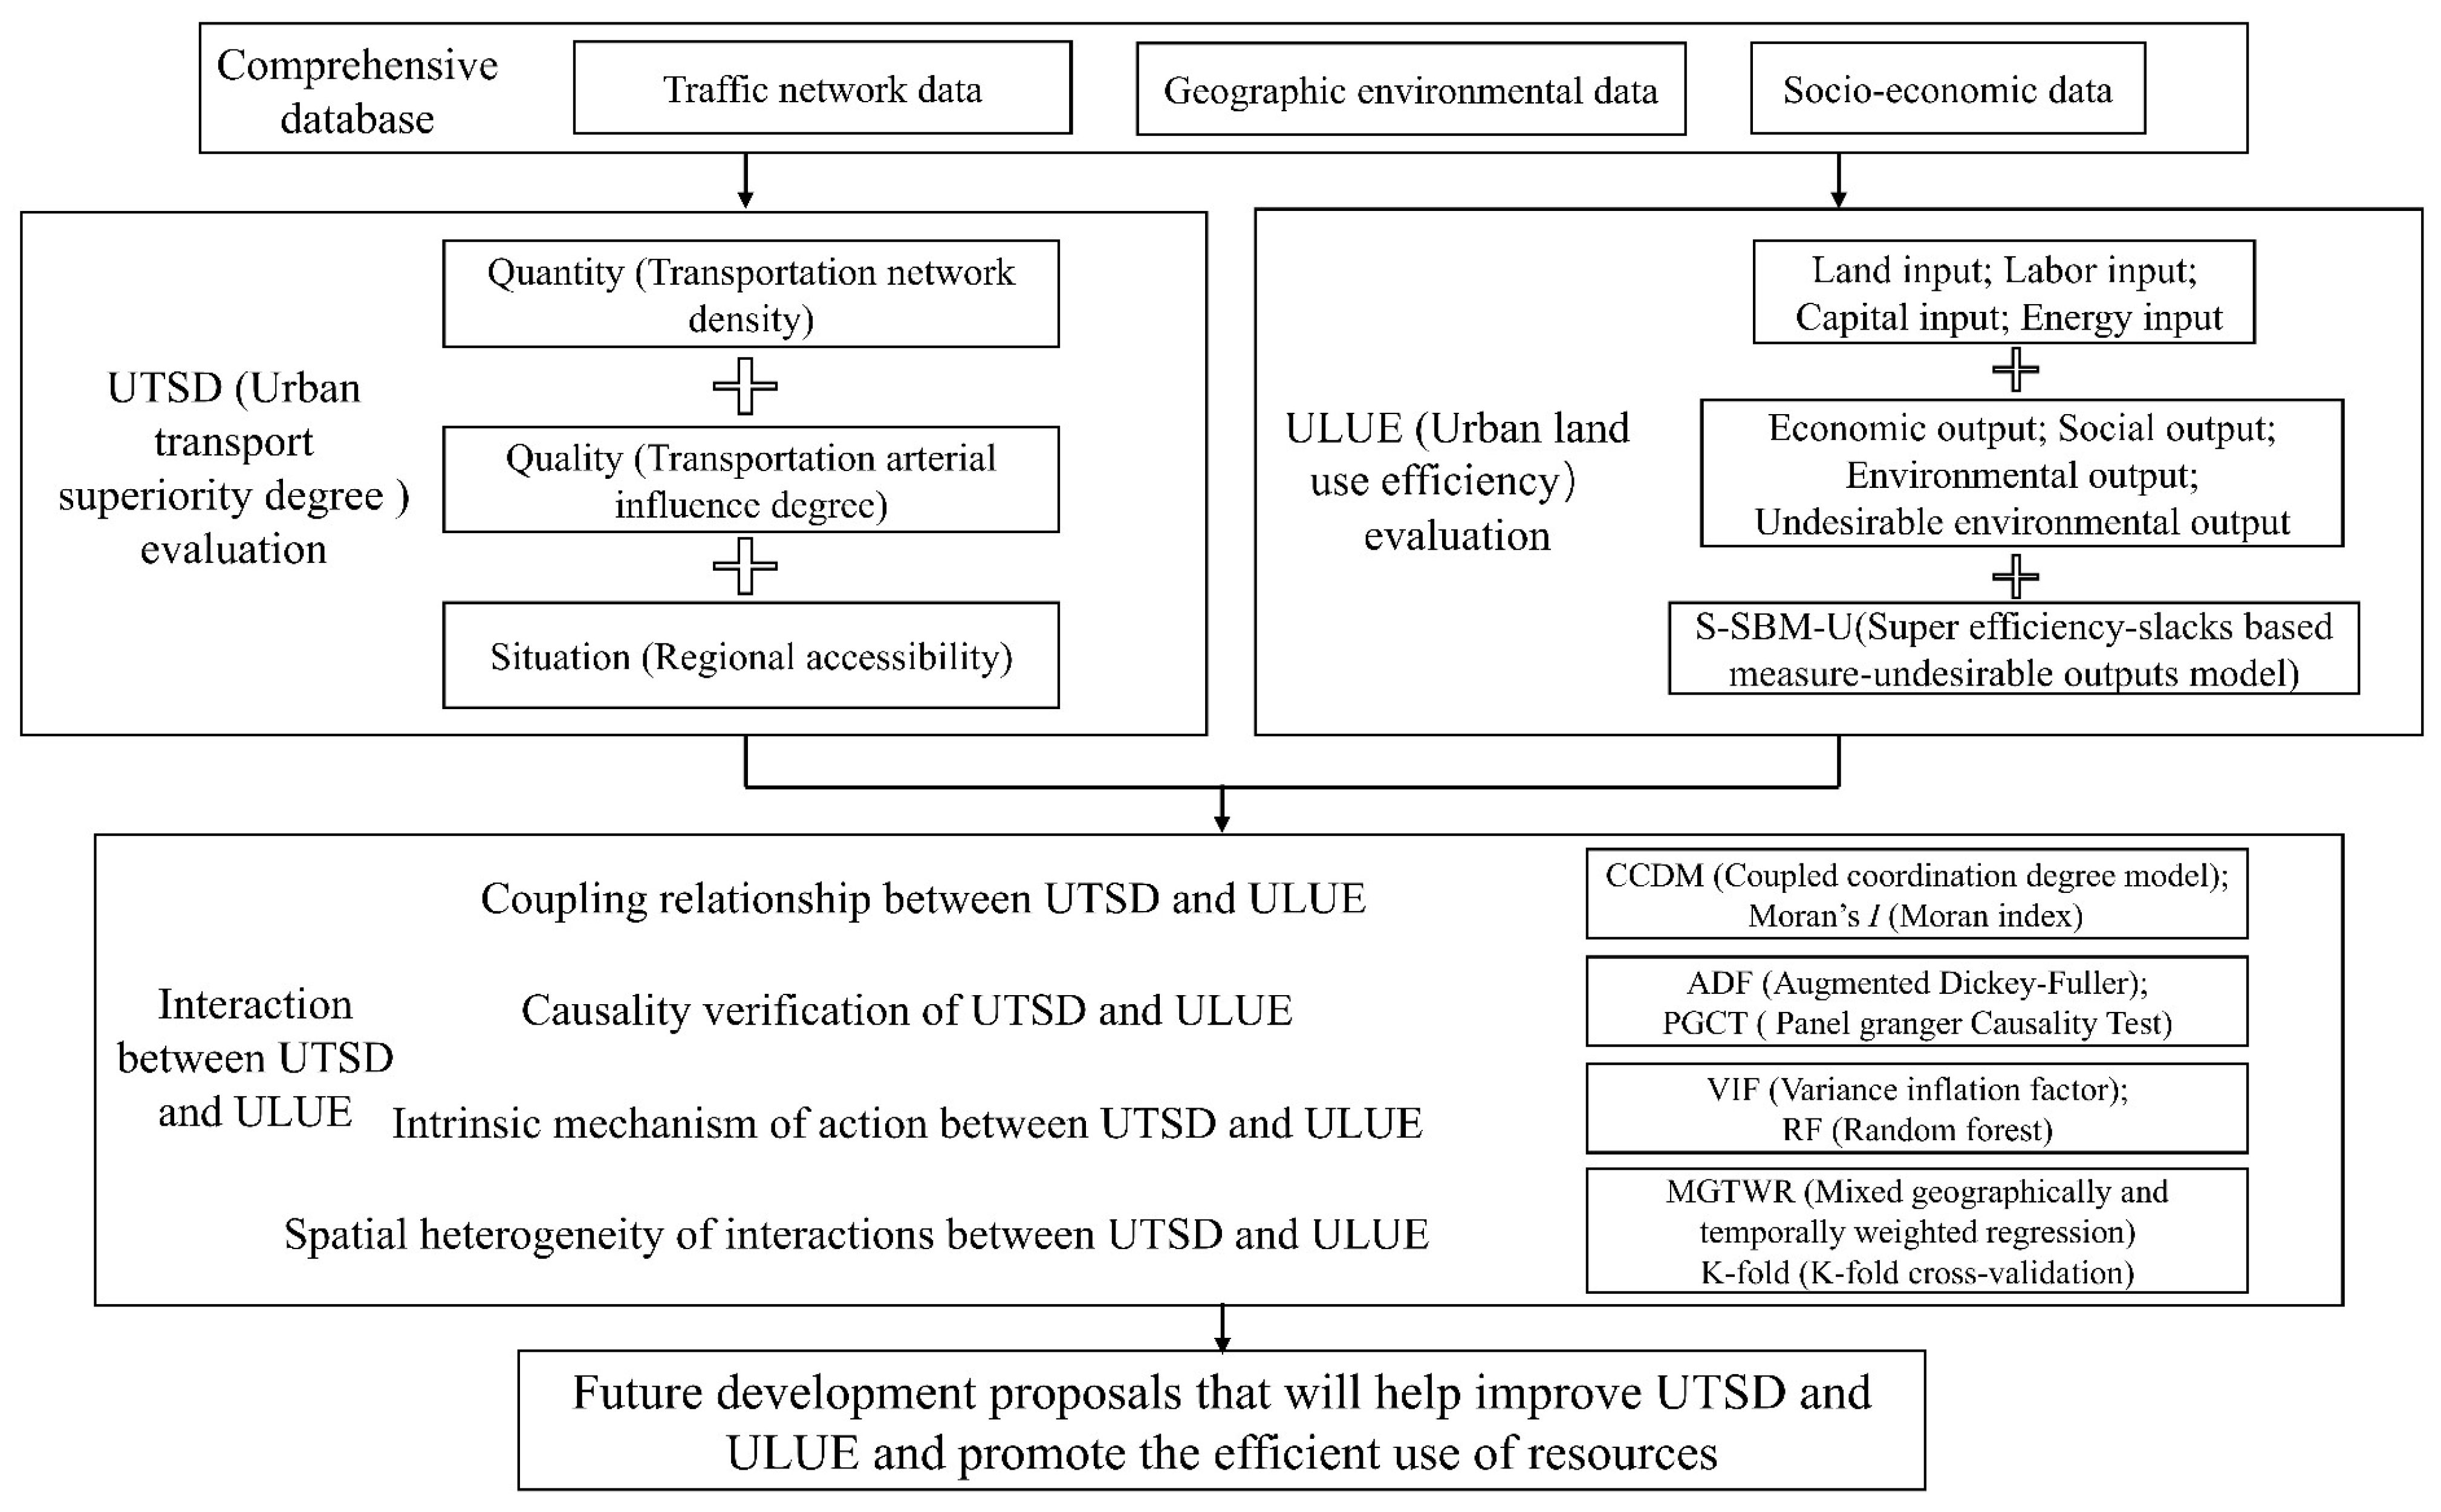
2.3. Research Methods

2.3.1. Construction of the UTSD Model

In this paper, to establish an evaluation system for UTSD, the ideas of “quantity”, “quality”, and “situation” [6,7], are combined to reflect how transportation affects land use in terms of point, line, and area radiation [4,38]. The “quality”, “quantity”, and “situation” are quantified and then dimensionless processed; finally, the entropy weight method is used to calculate the weight of each aspect [49], which comprehensively constitutes the calculation model of the UTSD (Table 2).

2.3.2. ULUE Evaluation Model and Indicators Selection

The S-SBM-U model is a super-efficient SBM model with undesirable outputs that is a variant of the DEA model derived from efficiency evaluation [10]. Compared with traditional efficiency evaluation models, the S-SBM-U model is characterized by a non-radial metric and a non-angle metric that consider the actual amount of slack in each input and output while avoiding the bias of being either input- or output-oriented. The model can effectively deal with undesirable outputs, which is particularly important for efficiency evaluations that include environmental considerations, because it can consider all types of outputs simultaneously [16]. The S-SBM-U model is as follows:
ρ * = min 1 1 m i = 1 m s i x i 0 / 1 + 1 s 1 + s 2 r = 1 s 1 s r g y r 0 g + r = 1 s 2 s r b y r 0 b
s . t . x 0 = X λ + s
y 0 g = Y g λ s g
y 0 b = Y b λ + s b
s 0 , s g 0 , s b 0 , λ 0
In Equations (5)–(9), ρ * denotes the efficiency value of each evaluation unit; X, Y g , and Y b are the inputs, desired outputs, and non-desired outputs for each year of each prefecture-level city, respectively; s , s g , and s b are the inputs, desired outputs, and non-desired outputs of the slack variable, respectively; subscript 0 is the decision-making unit to be sought; and λ is the weight variable. When s , s g , and s b are zero, ρ * = 1; when any of the three is not zero, ρ *   < 1, and there is room for improvement in regard to inputs and outputs.
In the selection of ULUE evaluation indexes, referring to previous studies, the differences among the input indexes are small and the difference mainly lies in output indexes. This study first explicitly includes undesirable outputs and, at the same time, puts the economic effect, social benefit, and environmental benefit of the outputs side by side for the evaluation of ULUE [8,14,15,17,41,42]. Table 3 lists the specific index system.

2.3.3. Coupling Coordination Degree Model (CCDM)

The CCDM quantifies the intensity of interactions between systems and assesses the level of harmony in their synergistic development, serving as a crucial indicator for evaluating the sustainable development of a region [48,54]. The specific CCDM utilized used is as follows:
C C D M = C × T
C = U 1 × U 2 / U 1 + U 2 2 2 1 k
T = α × U 1 + β × U 2
In Equations (10)–(12), C C D M on behalf of the degree of coupling and coordination of the degree of transportation advantages and urban land use efficiency, the value is between [0, 1]; a larger value represents a higher degree of coupling and coordination. C represents the degree of coupling, U 1 is the degree of transportation advantages, U 2 denotes the efficiency of the urban land use, k represents the number of indicators of the comprehensive evaluation (which is 2 in this paper), T is the comprehensive coordination index, and α  a n d β represent the weights of the evaluation indexes, which are 0.5 in this paper [48].

2.3.4. Moran Index and LISA Agglomeration

The Moran index and LISA agglomeration are the tools for assessing the autocorrelation of spatial data based on the same spatial weight matrix [10]. The Moran index provides a global perspective, reflecting the overall level of spatial autocorrelation between UTSD and ULUE across the study area, whereas the LISA agglomeration focuses on the local level and can identify and localize spatial hotspots and coldspots of UTSD and ULUE agglomeration, as well as other types of spatial agglomeration patterns [11]. The equations for the Moran index and LISA agglomeration are as follows:
I = i = 1 n j = 1 n W i j ( x i x ¯ ) ( y i y ¯ ) S 2 i = 1 n j = 1 n W i j
L I S A i = Z i j = 1 n W i j Z j
In Equations (13) and (14), I quantified the spatial autocorrelation levels of UTSD and ULUE at a global scale. n = 86 represents the total number of cities. W i j is the spatial weight. x i and y i are the regional UTSD and ULUE, respectively, and x ¯ and y ¯ denote the Gansu average UTSD and ULUE distributions.

2.3.5. Panel Granger Causality Test (PGCT)

The PGCT determines if one set of variables in a series of time series data predicts the future values of another set of variables. In the PGCT, if the past values of variable X are more effective in predicting the future values of variable Y than the past values of Y alone, then X has a causal influence on Y according to Granger’s definition [43]. This paper uses the PGCT to test for a possible causal relationship between UTSD and ULUE, as follows:
Y 2 t = i = 1 q α i Y 1 t i + j = 1 q β j Y 2 t j + μ 1 t
Y 1 t = i = 1 s γ i Y 1 t i + j = 1 s δ j Y 2 t j + μ 2 t
In Equations (15) and (16), α i , β j , γ i , a n d   δ j are coefficients; q and s are lag coefficients, which are set at 2; and μ 1 t   a n d   μ 2 t are the white noise, which are assumed to be uncorrelated.
When conducting a PGCT causal analysis, it is important to discuss the potential effects of external variables and residual terms on the model. We used a random effects model to control for the effect of external variables on the test results prior to Granger testing. In our analyses, we applied the augmented dickey fuller (ADF) test to avoid the effects of the residual terms [55]. Performing smoothness and co-integration tests prior to the PGCT is very important for reasons that are mainly related to the accuracy and reliability of statistical and econometric models. Non-smooth time series may lead to misleading statistical inference, and a statistical analysis using these series may afford pseudo-regression [43]. In this study, the ADF test was used to exclude possible problems as follows:
x t = α + β t + δ x t 1 + t = 1 m β i x t i + ε t
In Equation (17), t is the time variable, α is the constant term, β t   a n d   β i are the trend terms, ε t is the residual term, i is the lag order, and m is the maximum lag order. The PGCT can be performed when the series is smooth.

2.3.6. Random Forest (RF)

RF accomplishes the task by constructing multiple decision trees and synthesizing their predictions to improve the accuracy and robustness of the overall model [56]. If there is a causal relationship between UTSD and ULUE, a random forest is used to measure the extent to which the qualities, quantities, and potentials that make up UTSD contribute to ULUE and the extent to which the indicators that make up ULUE contribute to UTSD. In this paper, the OOB replacement method in RF is chosen [44] and the quantification helps us to better understand the intrinsic mechanism of UTSD and ULUE.
V j = r = 1 n E r j E r
f ^ x s x s = E x c ( f ^ x s , x c )
In Equations (18) and (19), V j is the importance of feature variable j , n is the number of decision trees, E r j is the misclassification rate before replacement, and E r is the misclassification rate after replacement. f ^ x s x s denotes the predicted value of the model at each pair of values of x s , x s is the feature variable to be plotted in the bias dependence plot, and x c is the other feature variable used in the RF.
Before assessing the contribution levels, the variance inflation factor (VIF) was first used to rule out the problem [47] of possible multicollinearity interference between the independent variables as follows:
V I F i = 1 1 R i 2
In Equation (20), R i 2 is the coefficient of determination (R-squared) obtained by fitting the i-th independent variable as the dependent variable to the other independent variables.

2.3.7. Mixed Geographically and Temporally Weighted Regression (MGTWR) Model

The MGTWR model is a recent development in geographically weighted regression (GWR) [57]. This model allows the regression coefficients to vary spatially to accommodate the localized characteristics of the data at different scales by introducing adaptive kernel functions for location and scale dimensions in the regression analysis. The central idea of the model is that the relationships between spatial entities vary with location, and this variation is influenced by the spatial scale. The MGTWR model reflects the strength and variance of the influence of the different regional drivers through the regression coefficients of that factor [58]. In this paper, we use the MGTWR to analyze the spatial heterogeneity of the interaction between UTSD and ULUE as follows:
y i = β 0 i + i = 1 p β j i x j i + ϵ i
In Equation (21), y i represents the observed value of the dependent variable for spatial unit i . β 0 i is the intercept term specific to spatial unit i . β j i denotes the regression coefficient of the j -th independent variable x j i for spatial unit i . i is the error term.
After the MGTWR model was fitted, we evaluated the MGTWR model performance using K-fold cross-validation [59]. We used one portion as the validation set and the rest as the training set. This process is repeated K times, each time choosing a different portion as the validation set and the rest as the training set. In this way, each portion of data is used as a validation set once throughout the process and the other K 1 times as a training set. In each iteration, the mean square error (MSE) is used as a performance metric on the validation set.
M S E = 1 n i = 1 n y i y ^ i 2
E a v g = 1 K i = 1 K E i
In Equations (22) and (23), y i is the actual value, y ^ i is the predicted value of the model, and n is the number of samples in the validation set. E a v g is the overall performance of the MGTWR model under K-fold cross-verification. E i is the ith-verified performance indicator (MSE). K is set to 10.

3. Results

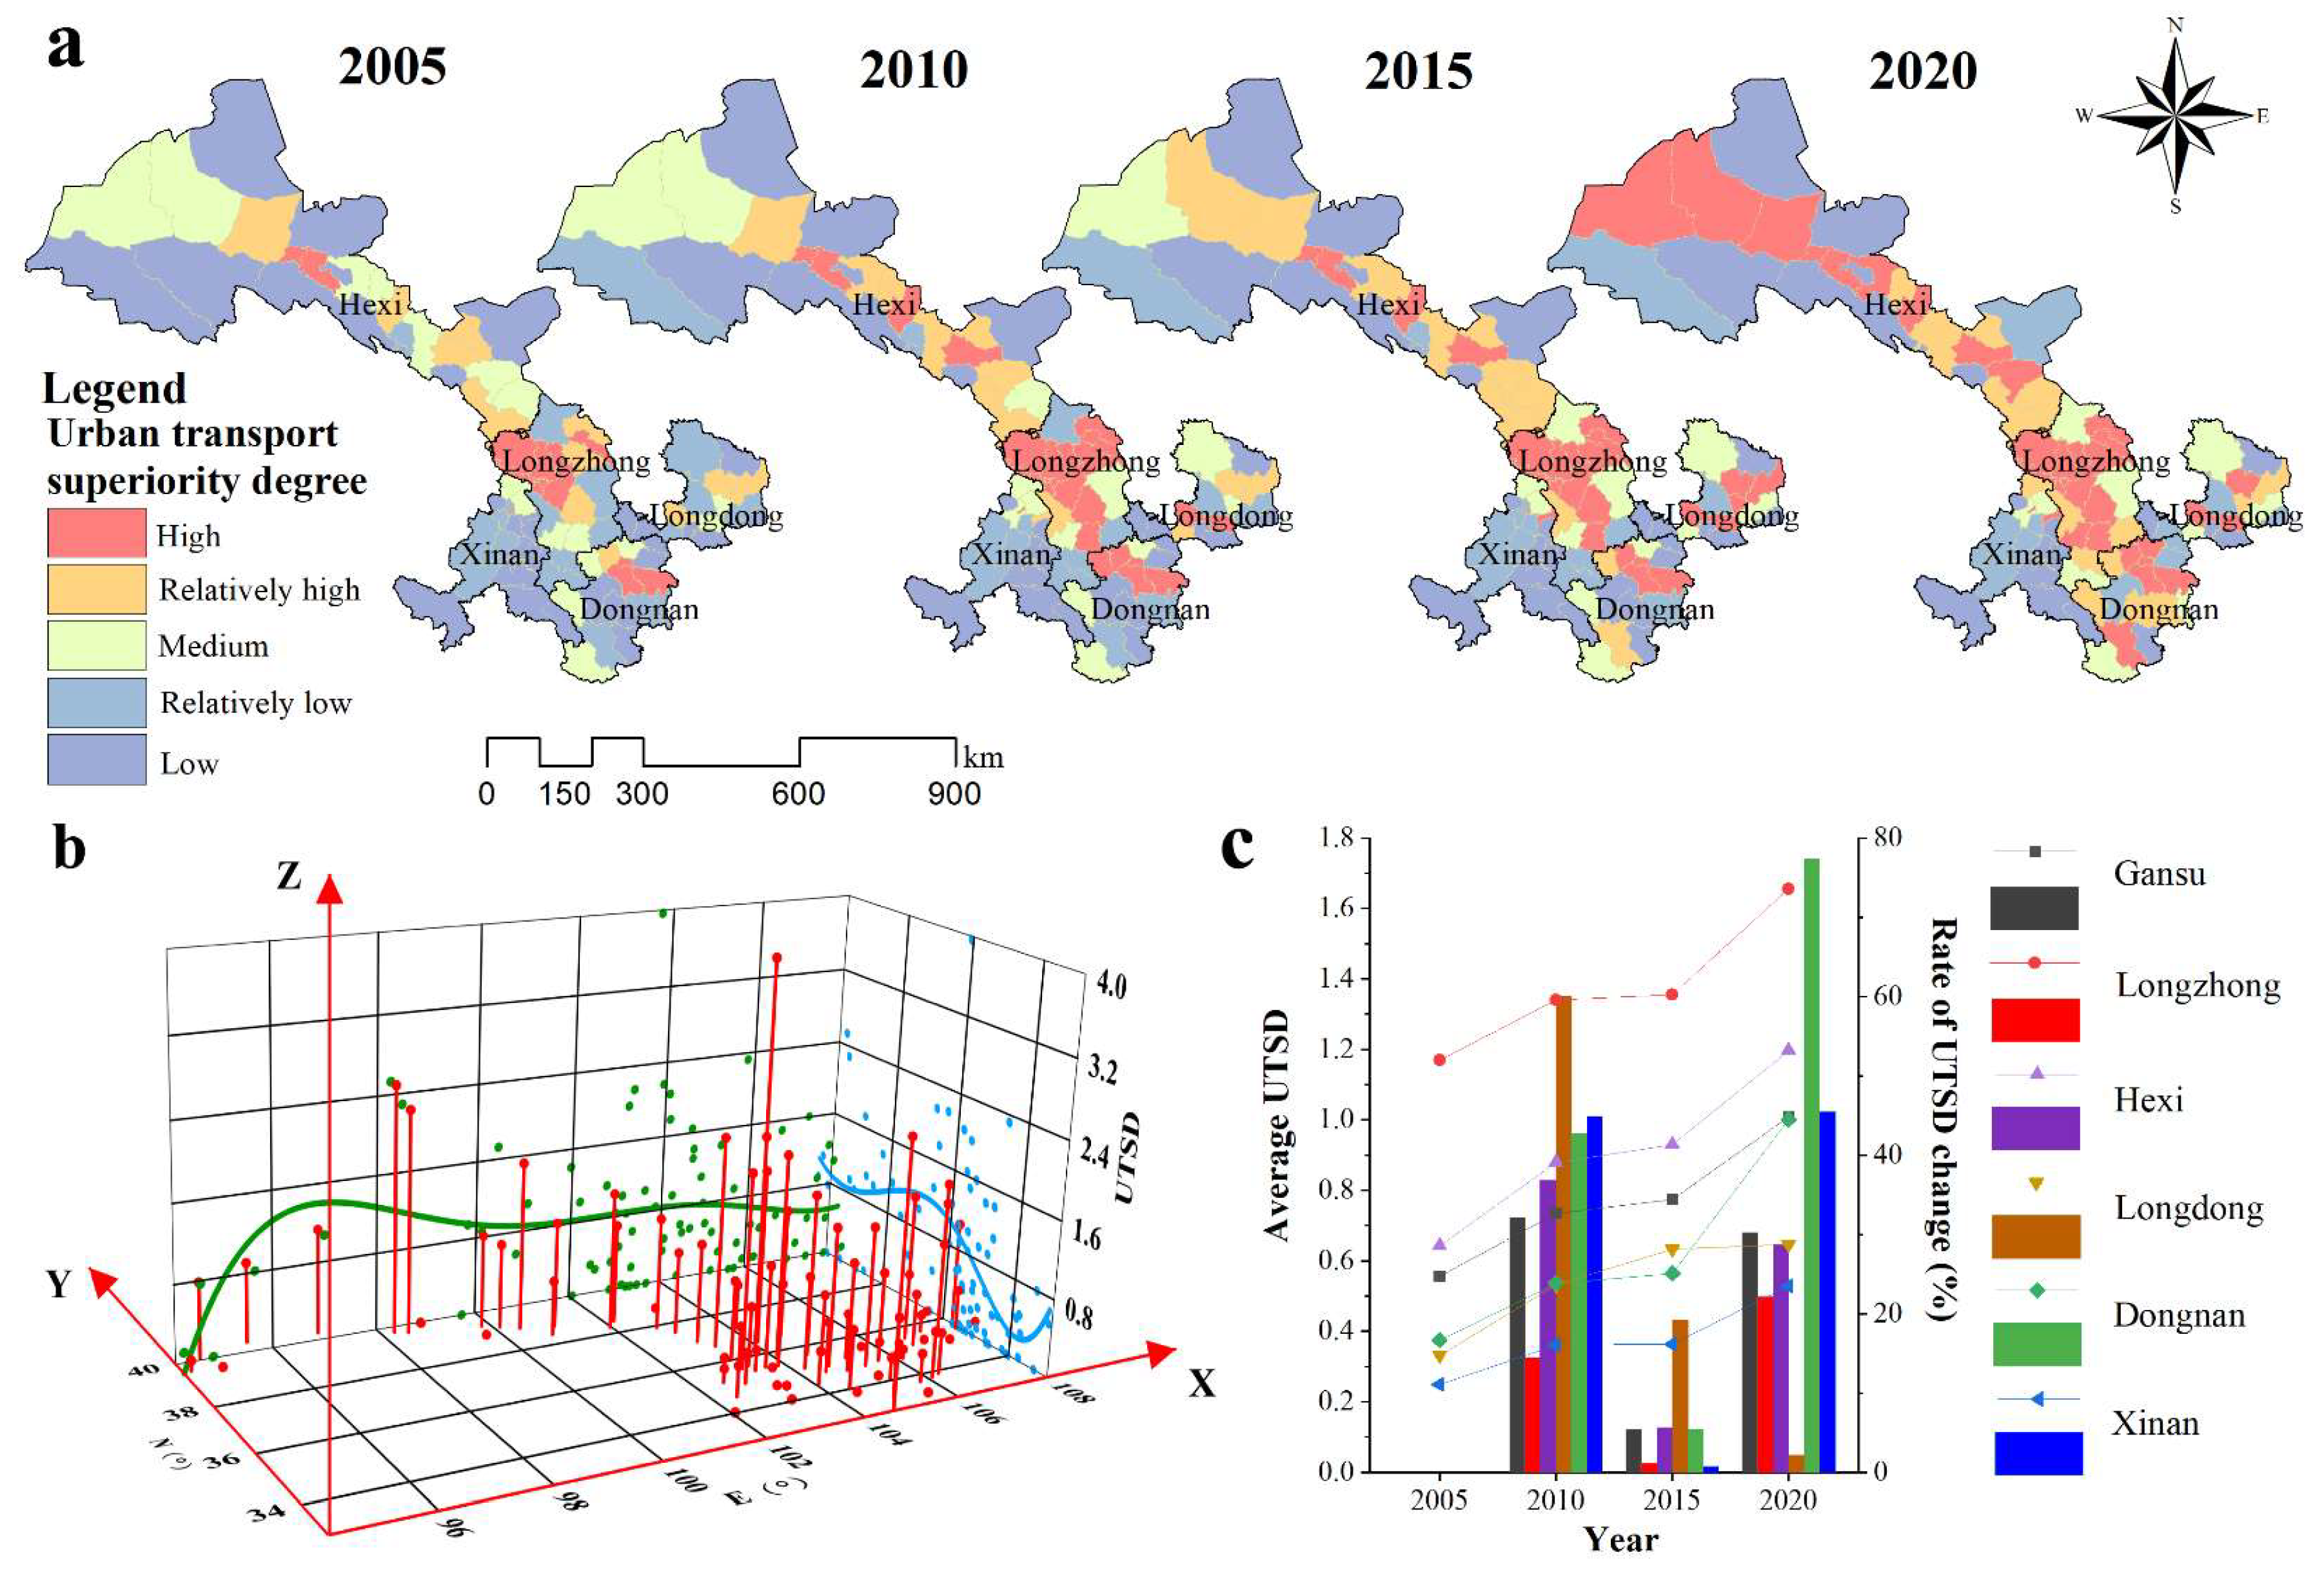
3.1. Spatiotemporal Variation of UTSD and ULUE

3.1.1. Spatiotemporal Variation of UTSD

From 2005 to 2020, the average value of the UTSD of each county unit in Gansu increased from 0.56 to 1.01 (Figure 3c) and the UTSD value increased by 0.45, with a growth rate of 80.36%. We used the natural break point method to divide the UTSD values of 86 districts and counties in Gansu Province in 2000 into five categories and then classified the data of each subsequent period according to the unified standard, which is conducive to reflecting the spatiotemporal evolution of UTSD. The proportion of units with relatively high UTSD values increased from 24.69% to 60.79% and the proportion of units with low UTSD values decreased from 32.10% to 18.52%. After 2015 (UTSD = 0.77), the UTSD value increased rapidly. By 2020, the units with a higher UTSD value realized the east–west connection of the province and a traffic corridor took shape (Figure 3a).
From a spatial point of view, the spatial heterogeneity of the UTSD is significant, showing high distribution characteristics in the west and midland and low distribution characteristics in the east and south (Figure 3b). In 2005, the units with high UTSD values were distributed in Lanzhou in the center, in Tianshui in the east, and in the Jiayuguan area in the west, with the UTSD of the city of Lanzhou spreading outward at a faster rate. By 2020, the UTSD of each unit and adjacent units in Lanzhou was at a high level, affording spatial agglomeration with higher UTSD; the UTSD of each unit in Gannan was at a low level, forming a spatial agglomeration with a low UTSD value. From a subregional perspective (Figure 3c), the Longzhong region had the highest average UTSD value and the southwest region had the lowest average UTSD value. The Longzhong and Hexi regions had higher UTSD values than the provincial average and rapid growth, while the Longdong and Gannan regions had lower UTSD values and slow growth.

3.1.2. Spatiotemporal Variation of ULUE

From 2005 to 2020, the ULUE of county-level units in Gansu showed a trend in first increasing and then decreasing their levels of ULUE (Figure 4c), with the average ULUE value first increasing from 0.52 (in 2005) to 0.65 (in 2015) and then decreasing to 0.62 (in 2020). The ULUE value increased by 0.10, showing a 19.23% growth rate. We used the natural break point method to divide the ULUE values of 86 districts and counties in Gansu Province in 2000 into five categories and then classified the data of each subsequent period according to the unified standard, which is conducive to reflecting the spatiotemporal evolution of ULUE. The proportion of units with relatively high ULUE values increased from 33.72% to 54.65%, while the proportion of units with low ULUE values decreased from 39.53% to 20.93% (Figure 4a).
Overall, ULUE showed high-distribution patterns in the west and north and low-distribution patterns in the east and south (Figure 3b). In 2005, the cities in Lanzhou had higher ULUE, the cities in Dingxi had a lower ULUE, and the cities in other regions had different ULUEs, with a fragmented distribution pattern. By 2020, Lanzhou and Jiuquan formed agglomerations with high ULUE values and Gannan formed an agglomeration with a low ULUE value. From the subregional perspective (Figure 4c), the average ULUE value in Hexi was the highest and maintained a growth trend and the average ULUE value in the southwest region was minimal and decreased by approximately 30% between 2015 and 2020. By 2020, there were no low-level ULUE cities in Hexi and the average ULUE value was high. The average ULUE values of the cities in the Xinan region were at a low level and the ULUE values of the cities in the Dongnan region fluctuated at a medium level.

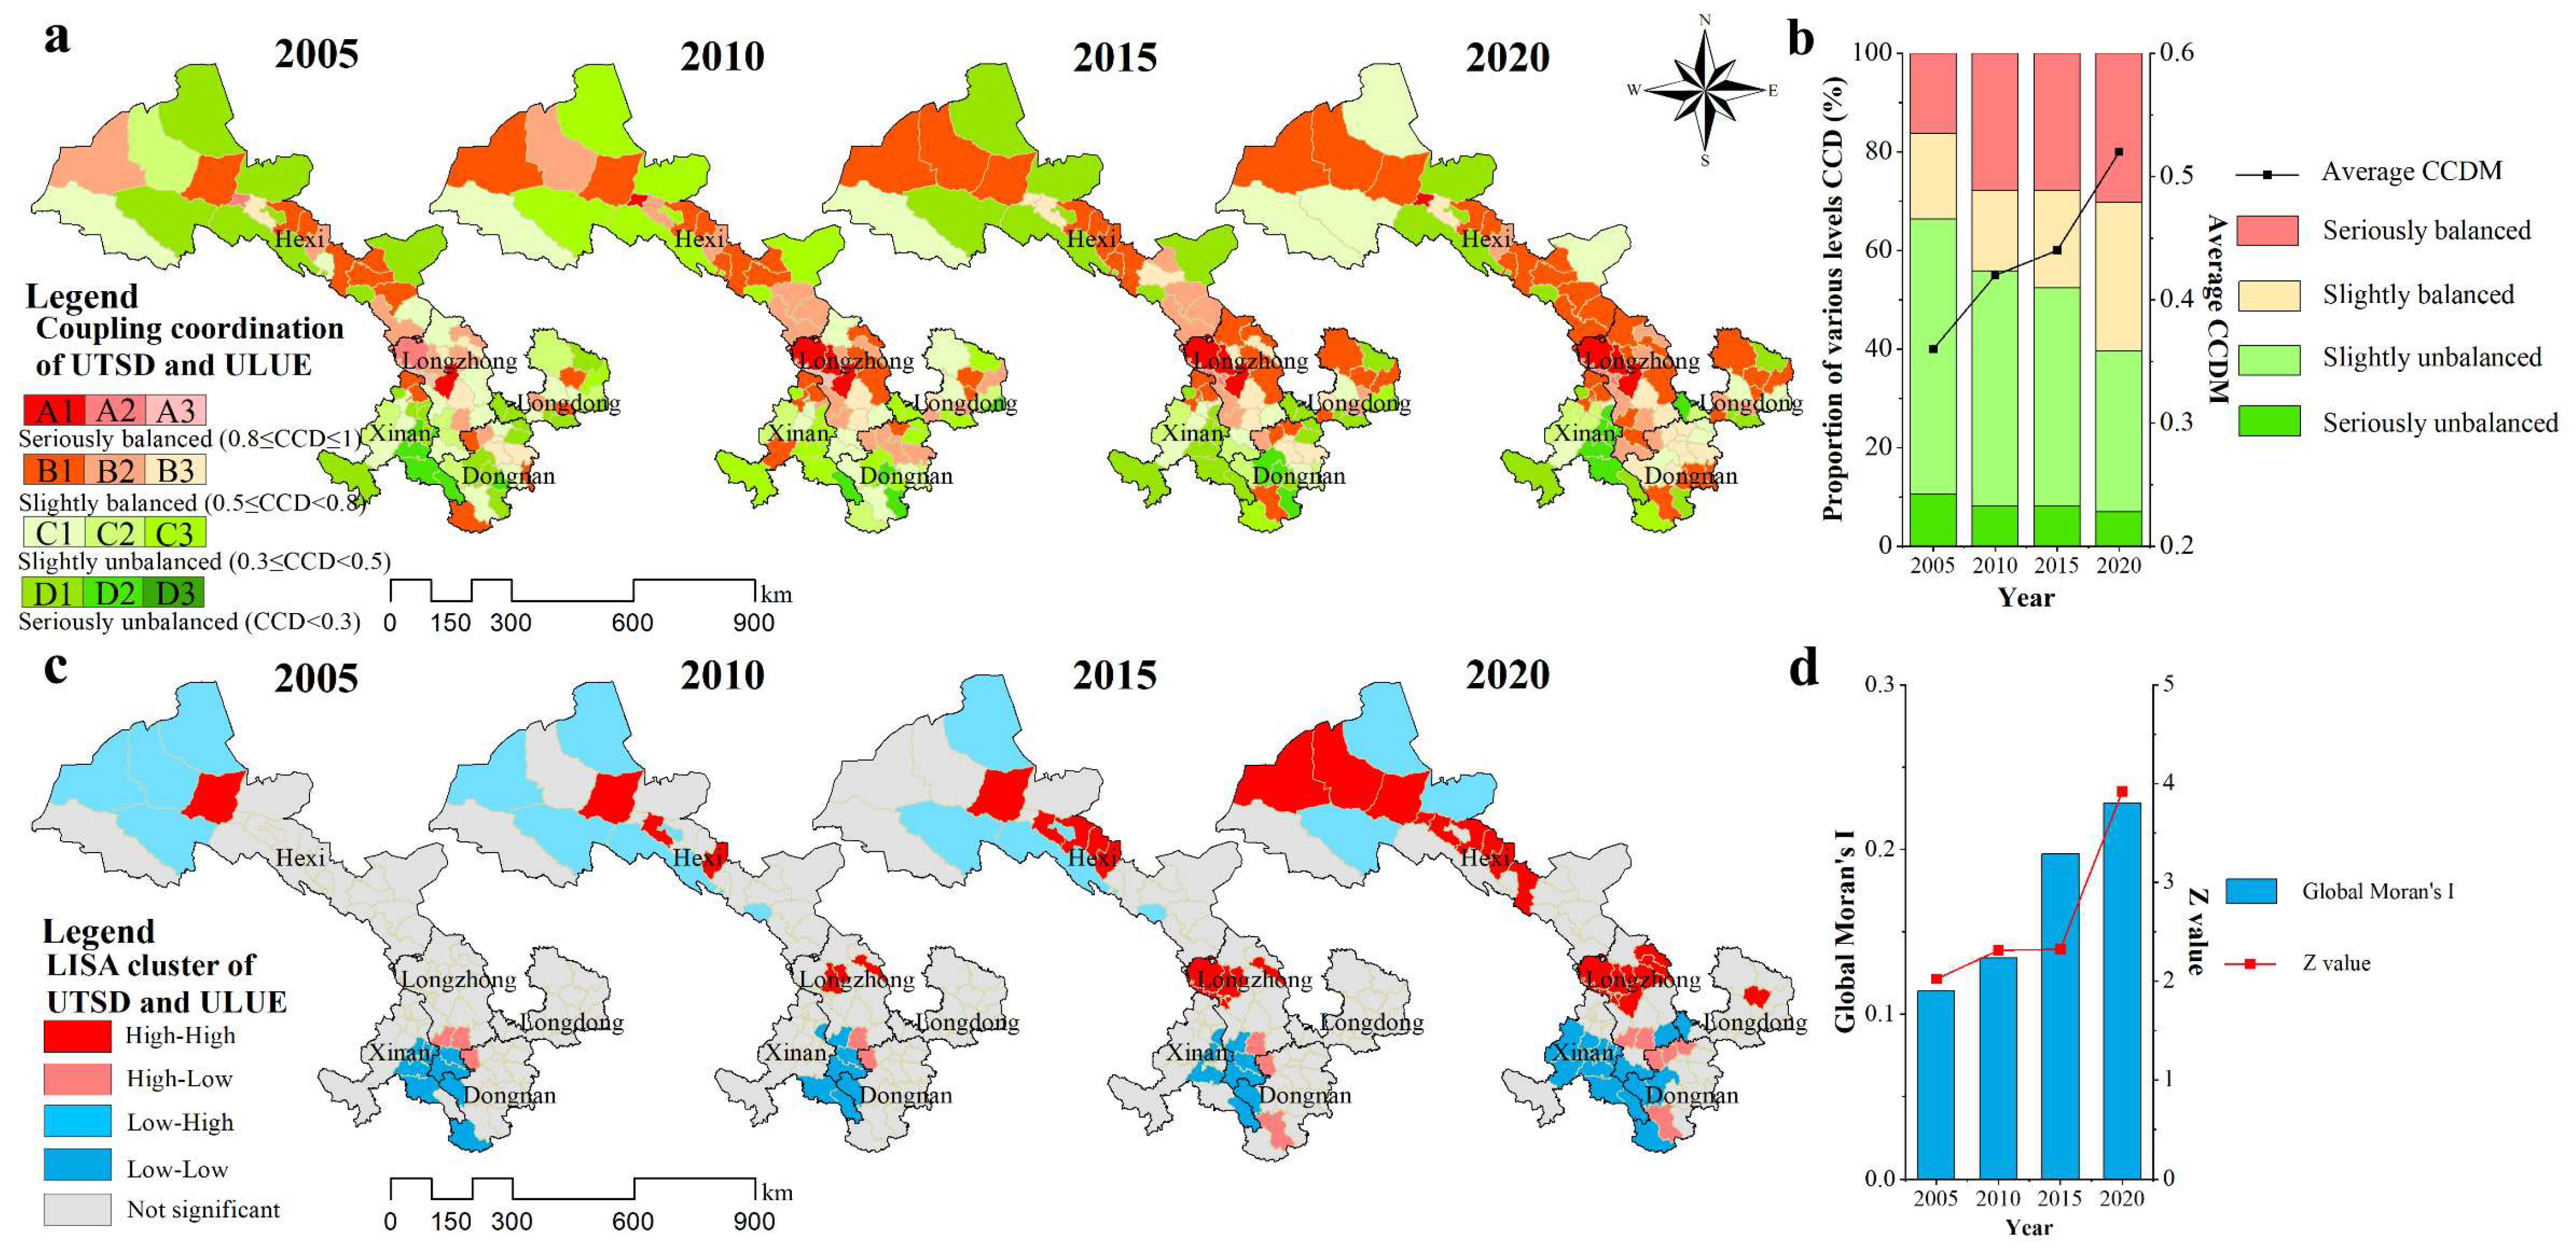
3.2. Spatiotemporal Relationship Between UTSD and ULUE

3.2.1. Coupled Relationship and Evolution of UTSD and ULUE

From 2005 to 2020, the average CCDM of the UTSD and ULUE of county-level cities in Gansu maintained an increasing trend (Figure 5b), increasing from slightly unbalanced (0.37) to slightly balanced (0.52). The proportions of unbalanced cities decreased from 60.47% to 33.72%. Analyzing coordination characteristics, the predominant pattern observed was UTSD lagging behind ULUE (63.96%). The proportion of cities in the UTSD and ULUE synchronized development type increased from 23.26% to 31.40%. Overall, the CCDM between the UTSD and ULUE developed in a better direction, but the situation of UTSD being lower than ULUE did not change.
Spatially, the CCDM shows a high distribution in the west-central part of the country and a low distribution in the southeast (Figure 5a). In 2005, the main type of CCDM in the Longdong, Dongnan, and Xinan regions was a seriously unbalanced, significantly lagged UTSD type. The CCDM posture of the Longzhong and Hexi regions was more chaotic than the other regions, but the overall level was slightly higher. By 2020, the type of CCDM in the Longzhong and Hexi regions was dominated by the slightly balanced, significantly lagged ULUE type. Lanzhou cities achieved highly coupled and coordinated synchronized development. The CCDM of the Longdong and Dongnan regions increased, and the CCDM of the Gannan units was the lowest, with the seriously unbalanced, synchronized development type being the main type of CCDM.

3.2.2. Spatial Agglomeration Changes in UTSD and ULUE

The spatial autocorrelation analysis showed that there was a positive spatial effect between UTSD and ULUE, indicating a spatially clustered distribution, and there was a tendency for the positive effect and clustering characteristics to be enhanced (Figure 5d). In 2005, the relationship between UTSD and ULUE was mainly not significant, and a small number of low–low clusters and low–high clusters were located in the southern and western parts of Gansu, respectively (Figure 5c). In 2010, the relationship was still insignificant and the high–high clusters gradually appeared in the central and western parts in Gansu. By 2020, UTSD and ULUE mainly showed three types of relationships: high–high agglomeration, low–low agglomeration, and insignificant relationships. High–high agglomeration was observed in Hexi and Longzhong. Low–low agglomeration was observed in Gannan. The Longdong and Dongnan regions mainly showed insignificant relationships.

3.3. Interactive Relationship Between UTSD and ULUE

3.3.1. Panel Granger Causality Hypothesis Test of UTSD and ULUE

The smoothness of the panel data is a prerequisite for the PGCT, and the data of the involved time series must be tested for smoothness before the PGCT can be performed. The test results show that the ADF statistics of UTSD and ULUE data are smaller than the critical values at each critical level and the data are smooth (Table 4).
The results of the PGCT show that the p-value corresponding to the hypothesis that ULUE as not the Granger cause of UTSD is 0.0333, which is less than 0.05, leading to rejection of the original hypothesis. Similarly, the p-value corresponding to the hypothesis that the UTSD as not the Granger cause of ULUE is 0.0014, also less than 0.05, resulting in rejection of the original hypothesis (Table 5). Overall, UTSD and ULUE are mutually Granger causative of each other, and they significantly interact and influence each other. Specifically, changing UTSD causes the ULUE to change; at the same time, changing ULUE causes UTSD to change.

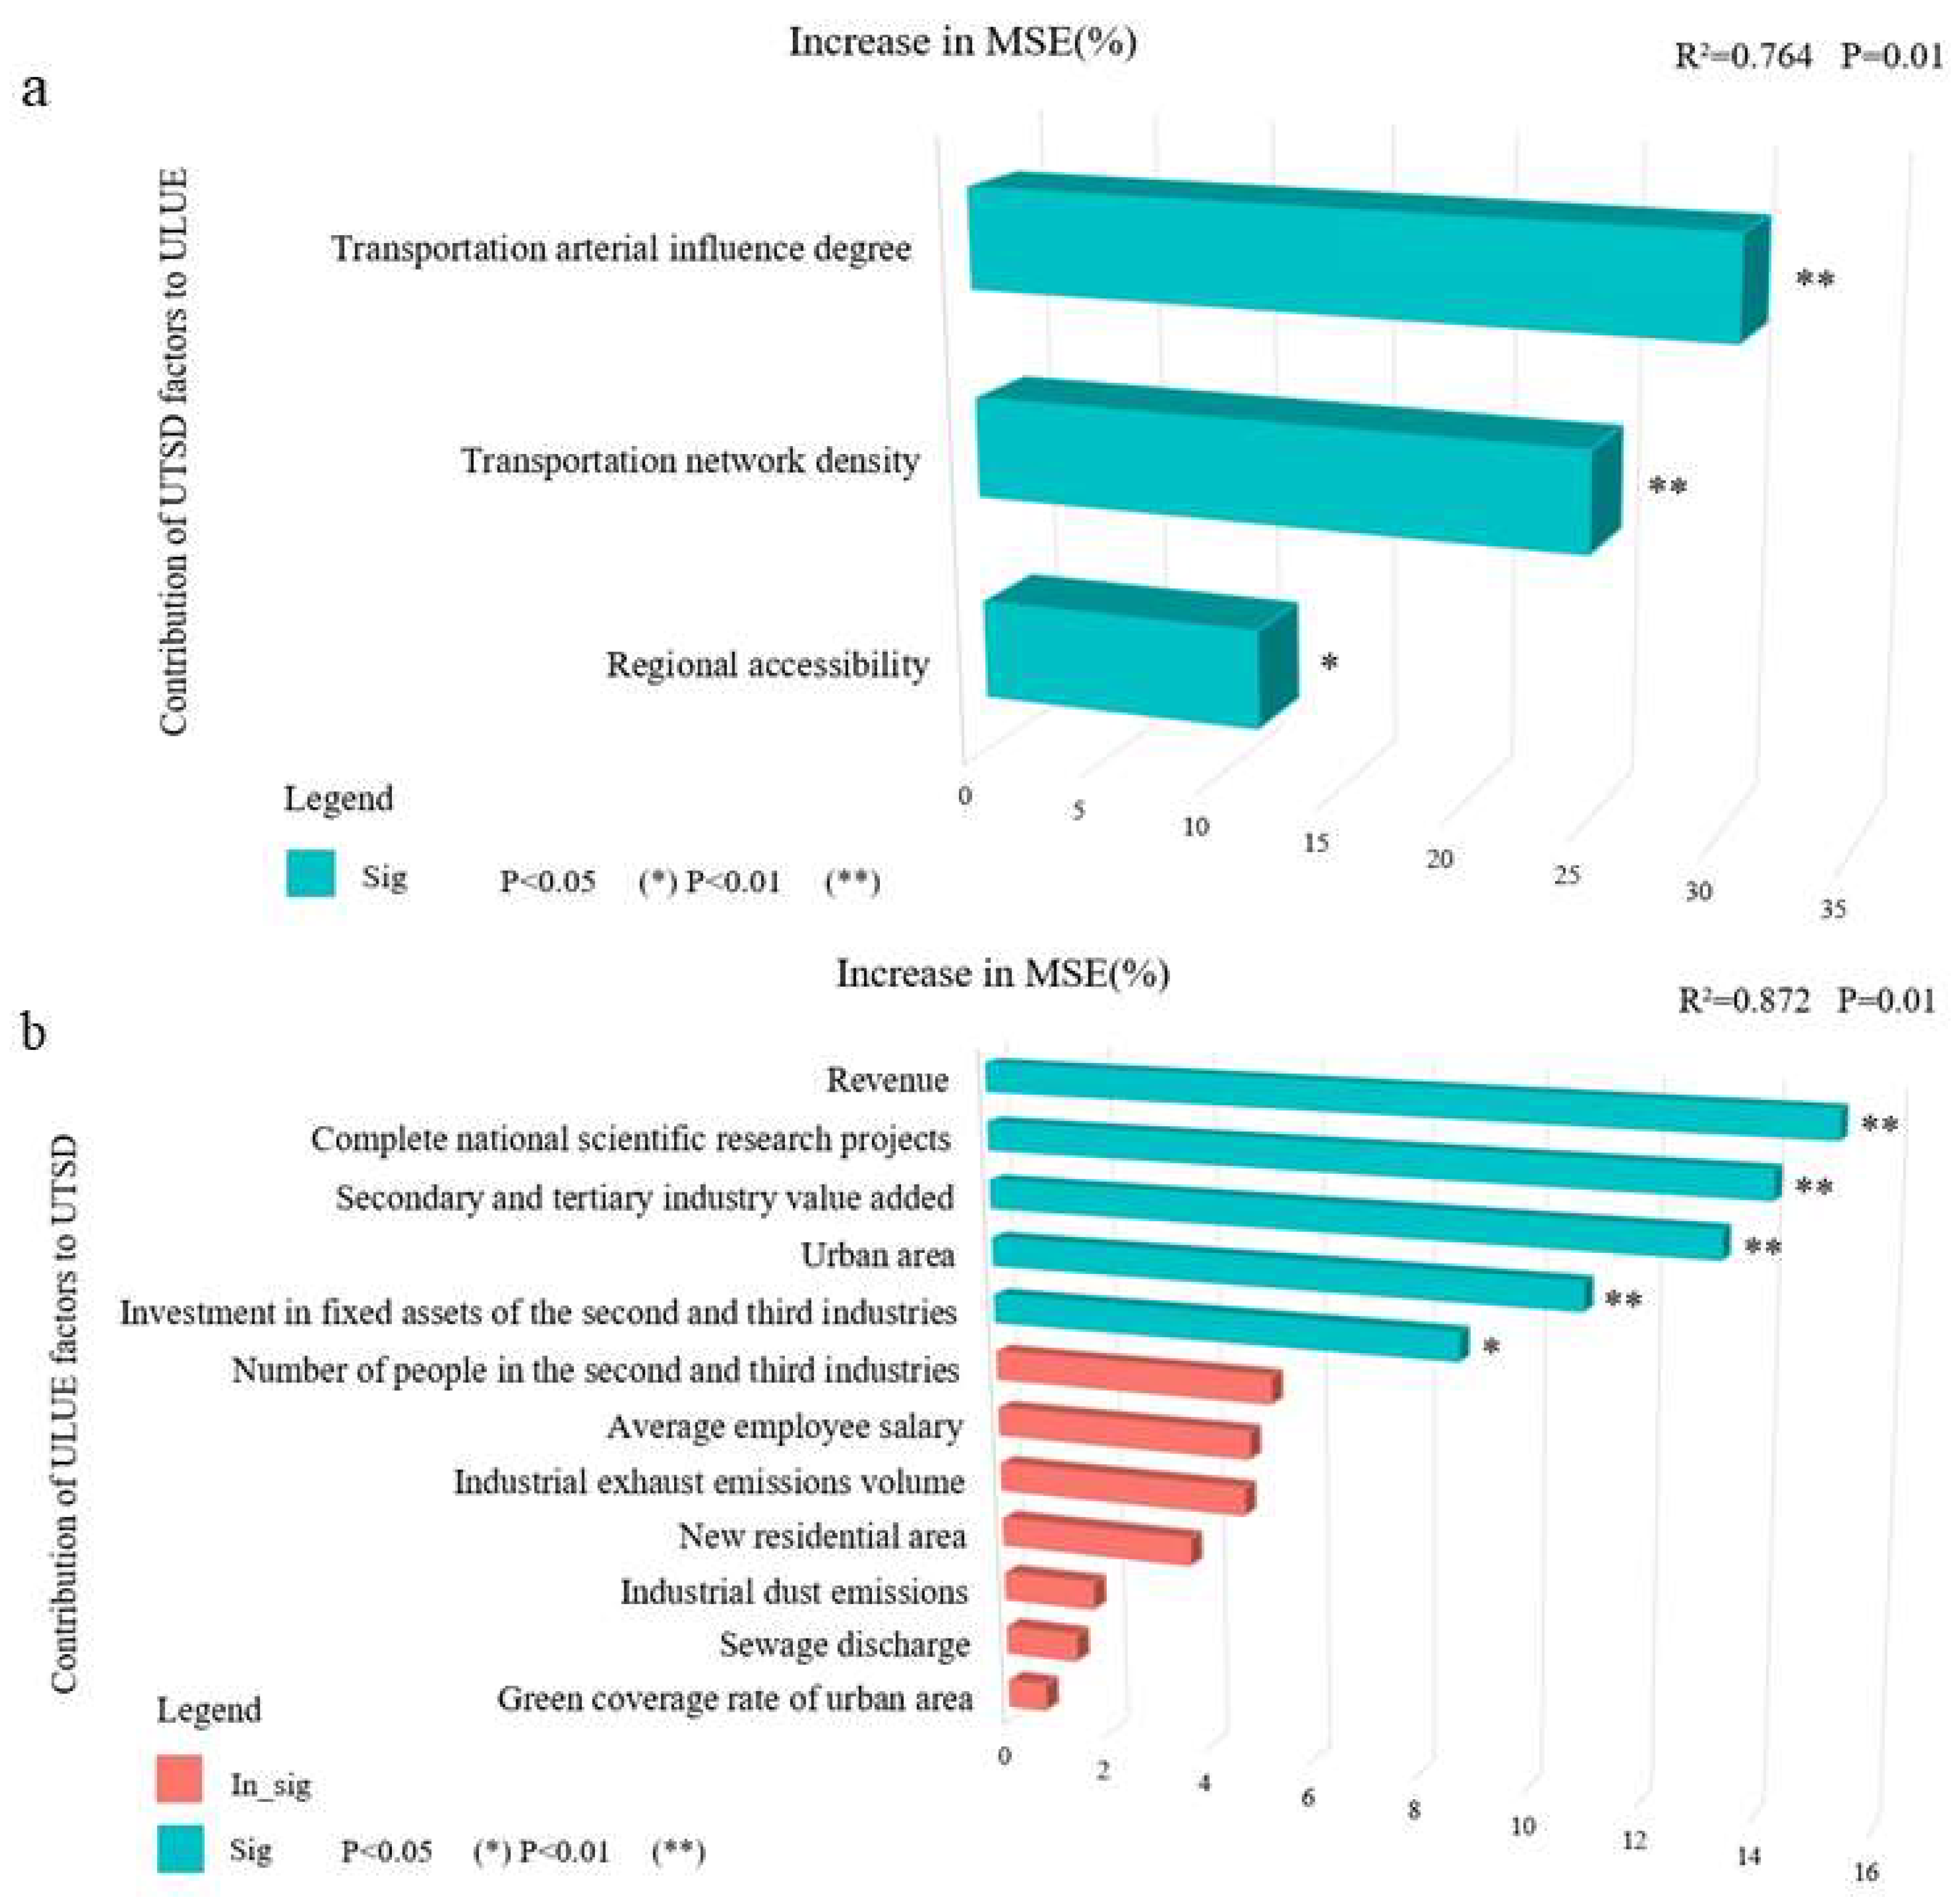
3.3.2. Measure the Contribution of UTSD and ULUE Interactions

According to the PGCT, UTSD and ULUE are mutually causal. To further understand the intrinsic mechanism of the interaction between UTSD and ULUE, we used the RF to quantify the extent to which the quality, quantity, and situation that constitute UTSD contribute to ULUE and to quantify the extent to which the factors that constitute ULUE contribute to UTSD. Before the calculation, it is first necessary to eliminate the possible covariance problem of the independent variables. We performed VIF tests on 17 factors simultaneously. According to the VIF test, the VIF values for electricity consumption and water consumption is greater than 10 and must be removed (Table 6).
Changes in UTSD lead to changes in ULUE, and RF results showed that transportation arterial influence degree (quality), transportation network density (quantity), and regional accessibility (situation) all contribute significantly to ULUE, with contributions of 30.41%, 24.98%, and 11.72%, respectively (Figure 6a). The data suggest that transportation arterials have the greatest impact on ULUE. Changes in ULUE lead to changes in UTSD, and the results show that tax revenue is the most important influence on UTSD, with a contribution of 15.10% (Figure 6b). Other major contributors to UTSD were the complete national scientific research projects, the secondary and tertiary industry value being added, urban area, and investment in fixed assets of the second and third industries with contributions of 14.06%, 13.23%, 10.90% and 8.72%, respectively. The RF model explained 0.872 and 0.764 of the interaction effects of UTSD and ULUE, respectively, indicating its ability to effectively capture data features and patterns with high accuracy.

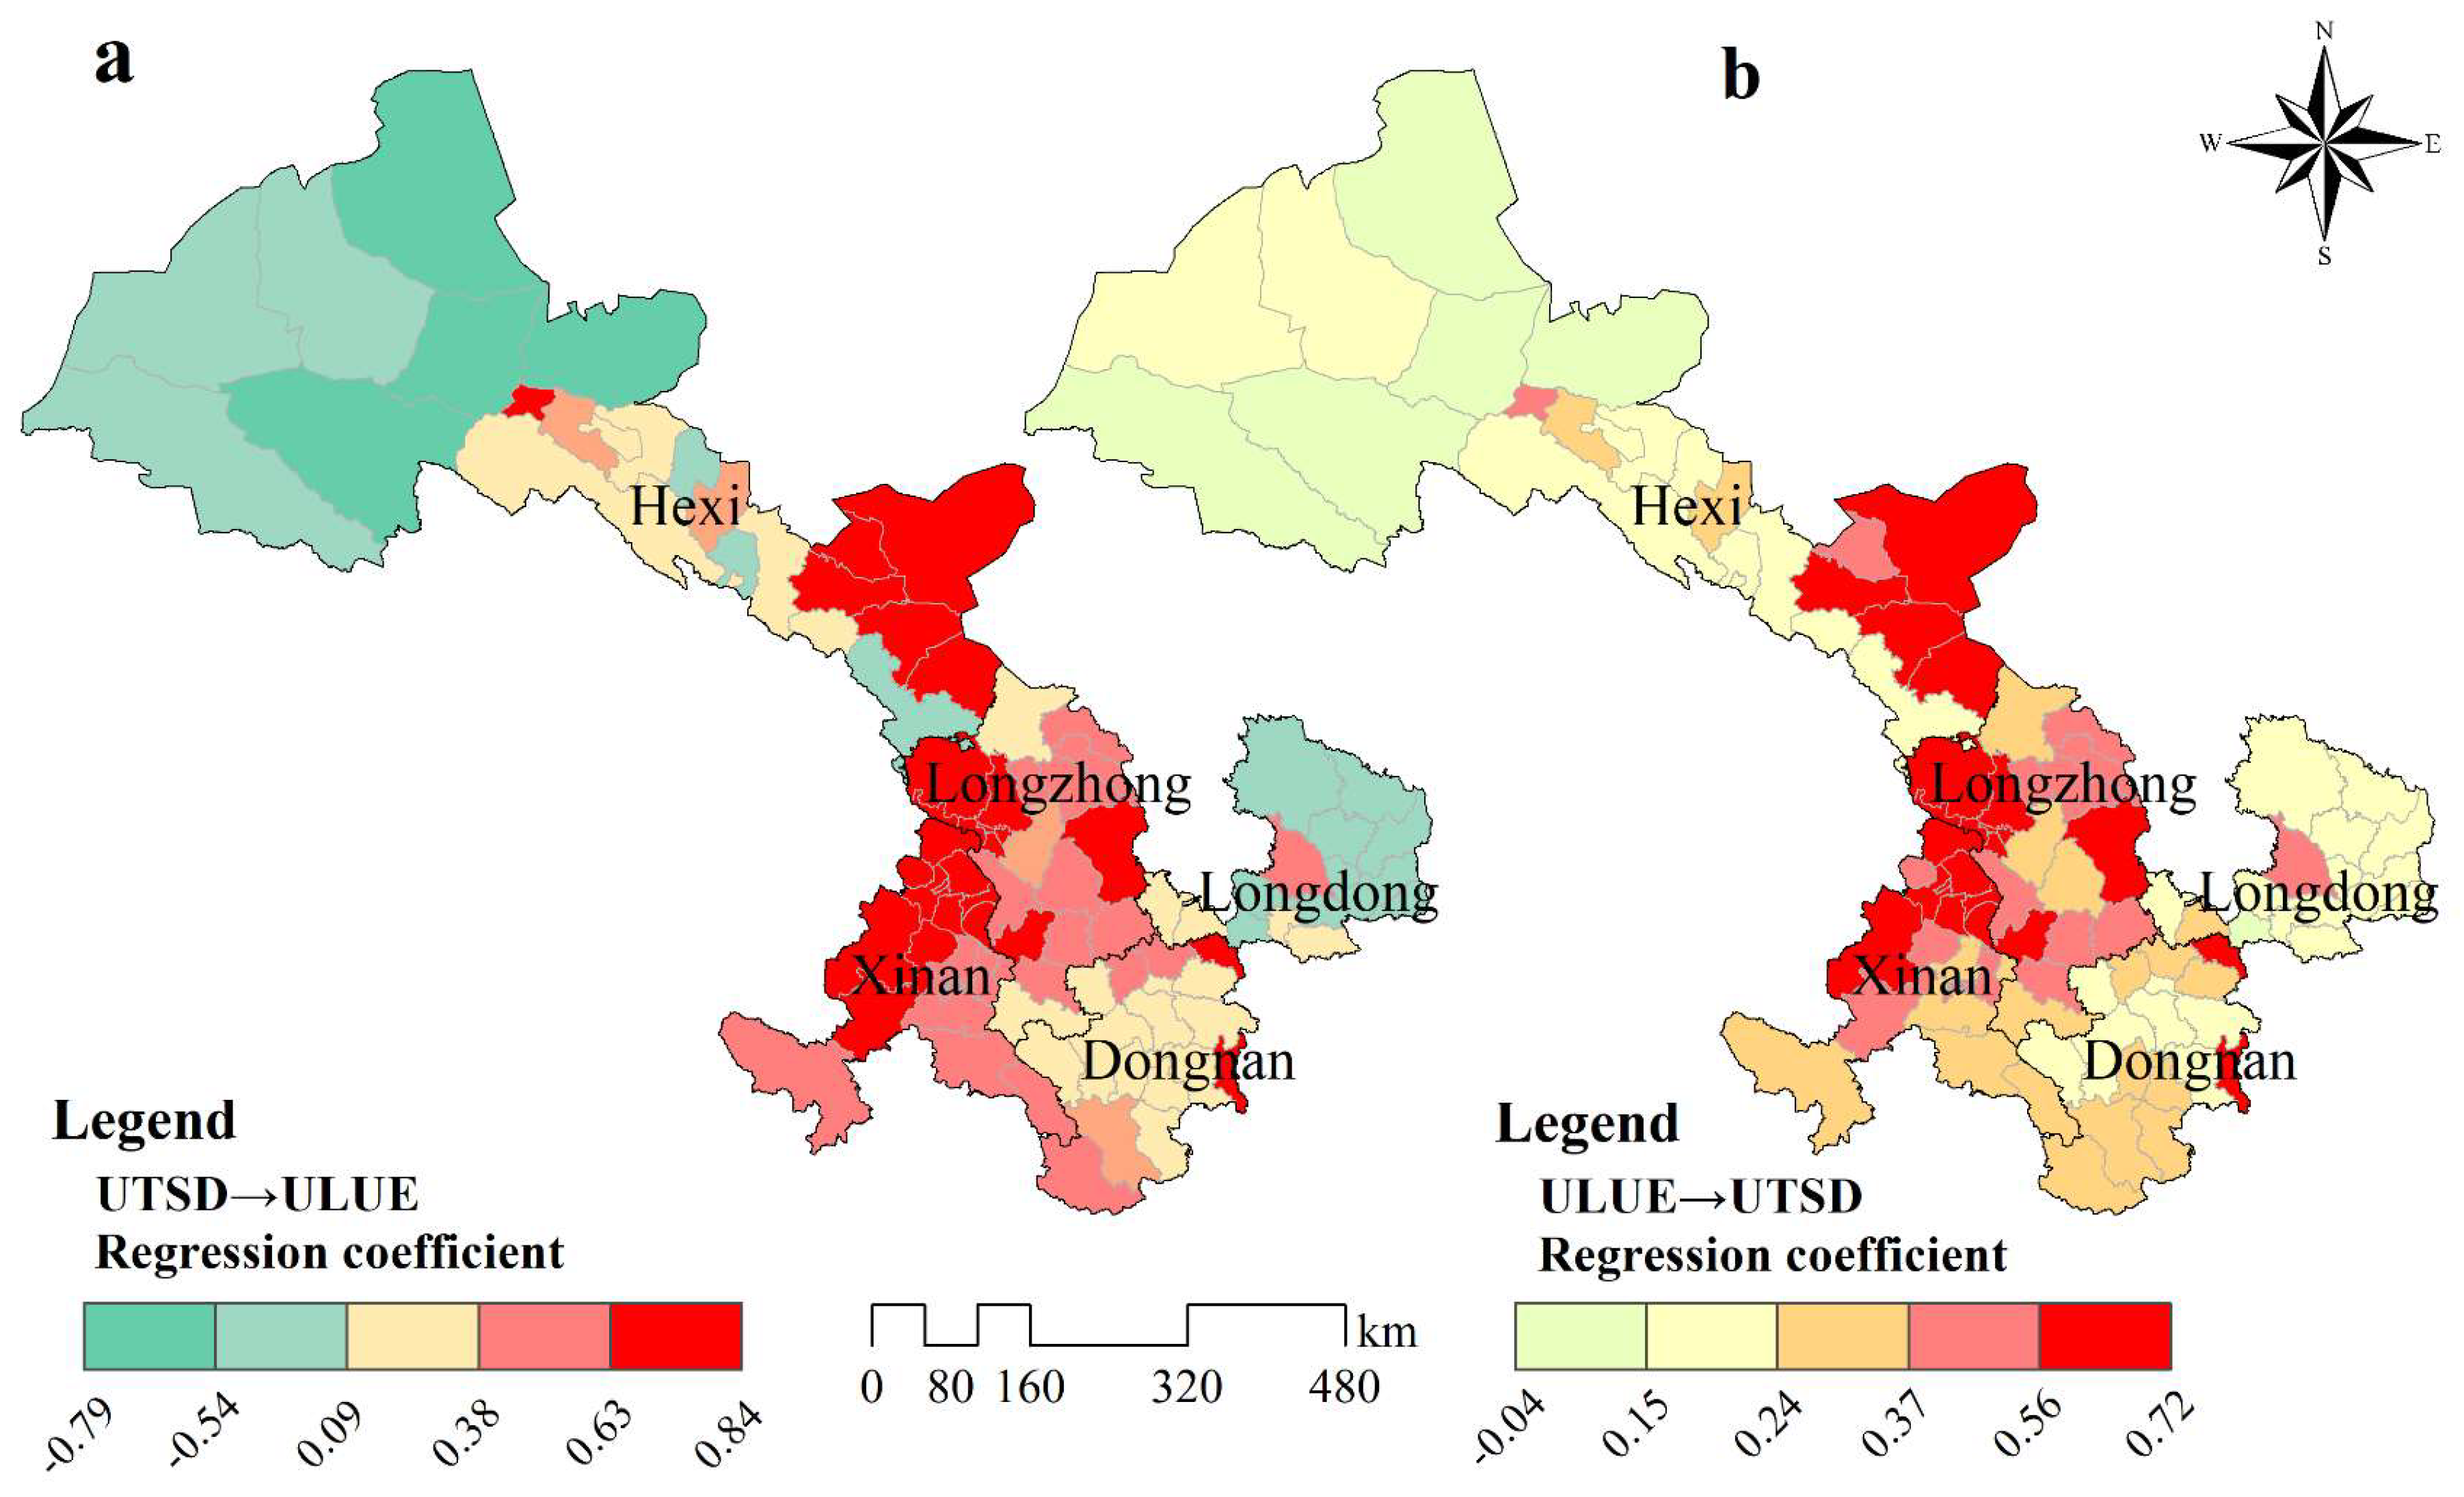
3.3.3. Spatial Heterogeneity of UTSD and ULUE Interactions

The PGCT showed that UTSD and ULUE were mutually Granger causal; therefore, UTSD and ULUE were used as the independent and dependent variables, respectively. Conversely, ULUE and UTSD were used as the independent and dependent variables, respectively, to fit the MGTWR model and analyze the spatial heterogeneity of the interactions between the two (Table 7). In general, the closer E a v g is to 0, the better. Our test results show that E a v g is around 0.1, indicating that MGTWR has good stability in the fitting process and predictive ability for new data. The results show that the effects of UTSD on ULUE exhibited positive and negative bi-directionality. The effect of ULUE on UTSD was positive (Figure 7). In terms of spatial distribution, the effect of UTSD on ULUE had a strong positive effect in the Longzhong, Xinan, and the east of Hexi regions and a negative effect in the Longdong and the west of Hexi regions. The contribution of ULUE to UTSD was particularly significant in the Longzhong, Xinan, and eastern Hexi. The positive interaction between UTSD and ULUE is weaker in the Dongnan, Longdong, and central Hexi regions. Overall, with the city of Lanzhou as the core, the UTSD and ULUE of the neighboring cities showed strong mutual reinforcement, and multiple interactions between UTSD and ULUE were noted in other regions.

4. Discussion

4.1. Spatiotemporal Pattern Evolution of UTSD and ULUE

Gansu is an important corridor in the Belt and Road Initiative for China in regard to strengthening ties with Central Asia and Europe, and it is the core area of the Silk Road Economic Belt [54]. This study shows that UTSD continued to increase from 2005 to 2020 (Figure 3c), and the growth rate increased after 2015. It shows that the introduction and promotion of the Belt and Road Initiative in 2013 accelerated the construction of transportation infrastructure in Gansu [8]. The analysis of the growth pattern of UTSD shows that the UTSD growth radiates outwards, with cities, such as Lanzhou and Tianshui, initially forming transportation corridors (Figure 3a). This growth pattern is similar to that of other regions in China in which the road network of core cities first expands to the periphery and then transportation corridors are gradually formed between important cities [60]. The difference is that the transportation network in the eastern provinces of China is developed in a checkerboard shape and the high-value units of Gansu UTSD form a strip shape [50]. China’s transportation infrastructure development has long implemented a “vertical and horizontal” plan, linking north–south and east–west with trunk lines. Lanzhou, the hub of the trunk lines, is located in the Longzhong region, which has the highest UTSD value in Gansu. In contrast, the Xinan region, which has no trunk lines, has the lowest UTSD value, suggesting that trunk line transport significantly impacts regional UTSD [48,60].
ULUE reflects whether land resources are used reasonably and effectively in the urban planning layout and the extent to which the economic, social, and environmental values of land resources are realized [61,62]. This study calculates the ULUE using the county as the unit and considers most of the ULUE in the counties and districts of the Dingxi region to be at a low level (Figure 4a), whereas the ULUE in Dingxi was previously considered to be at a high level in the study based on prefecture-level cities [10]. This is due to the fact that the main urban area of Dingxi is small and the construction land is widely distributed in each county, so the conclusion will be biased if we think that the realization of each benefit depends only on the main urban area [63]. It can be seen that this study can more accurately assess and demonstrate the spatial heterogeneity of ULUE by using the county as the unit, which is also conducive to targeting and refining policy formulation in practice [54,64]. The average ULUE (0.59) of Gansu measured in this study was similar to that of Guanzhong urban agglomeration (0.58), which is also an important part of the Silk Road Economic Belt and includes the Tianshui area in this study; however, the average ULUE value of Gansu is lower than that of the central plain urban agglomeration (0.74) [16]. This study found that Gansu ULUE in 2020 declined relative to 2015. Combined with the analysis of statistical yearbook data, the area of urban land and transport and other construction land increased by 51.55% from 2015 to 2020, of which the area of transport and industrial and mining land increased by 79.07%. Additionally, the value added of the second and third industries increased by 33.98% from 2015 to 2020, which shows that the expansion of construction land far exceeds the economic growth rate, and there is a problem of rough use of construction land [65]. At the same time, the decline of ULUE is closely related to the environmental protection policy and the relationship between land supply and demand. Gansu, as an ecologically fragile province, environmental protection restricts part of the land development and utilization [47]. The local government may have accelerated the land disposal for the need of financial revenue, but it failed to bring the corresponding economic benefit growth [66]. Analyzing the spatial heterogeneity of ULUE, the highest ULUE value (0.71) was observed for the Hexi region (Figure 3), and this result is consistent with that of the Yellow River Basin urban agglomeration study [67]. In the Hexi region, where precipitation is scarce and land cover is dominated by the Gobi Desert, limited land is available for construction land expansion and the constraints of natural conditions force the economic and intensive use of urban construction land [68]. The southern part of Gansu has better environmental conditions, a large scale of construction land, and a lower ULUE value [67,69]. In general, the spatial pattern of ULUE is formed by multiple factors, including the economic rationality of human society and the natural environment’s limited carrying capacity [70].

4.2. Coupling Relationship Between UTSD and ULUE

The CCDM of UTSD and ULUE in Gansu generally showed an increasing trend from 2005 to 2020, and the average CCDM growth situation was very similar to that of UTSD (Figure 3c and Figure 5b). The relatively rapid growth of lagging factors in the evolution of CCDM can disrupt old coupling equilibria [42,54]. The level of UTSD in Gansu lagged behind that of ULUE; therefore, the coupling between the two tended to be balanced after the rapid growth of UTSD. The districts and counties in Gansu with high-CCDM cities are concentrated in the core cities and along the transportation arteries (Figure 5a). However, the coupling relationship between the two varies in different regions; for example, the study of the Shandong Peninsula found that the coupling relationship is mainly characterized by a lag in ULUE [27]. This is mainly caused by the difference in the level of transportation development between the two regions, and the development of UTSD in Gansu Province is significantly unbalanced; for example, in the southwest region by 2020, most districts and counties were in the state of having no railways and no access to high-speed rail, and the level of UTSD was low [68].
The results of bivariate spatial autocorrelation indicate a positive spatial relationship between UTSD and ULUE, revealing a clustered spatial distribution (Figure 5d). This result supports the argument that UTSD is synergistic with ULUE [4,27]. In 2005, UTSD and ULUE were low and the agglomeration characteristics were not obvious. By 2020, with the growth of UTSD and ULUE, high UTSD and ULUE agglomerations formed in the Hexi region and Longdong, showing a significant positive coordination (Figure 5a). It is worth noting that the Xinan region manifests a clear low level of spatial coordination, i.e., low UTSD-low ULUE cluster areas, which are generally characterized by low levels of economic development, weak transport infrastructure, and sloppy land use practices [69,71].

4.3. Interaction Mechanisms of UTSD and ULUE

Most of the existing studies have explored the effects of transportation network construction on land use, while very few studies have focused on the effects of land use on transportation network construction [4,21]. This study quantitatively evaluates the construction of transportation networks and urban land use and applies a model to confirm that they are causally related (Table 5). On this basis, this paper quantifies the contribution of the constituents of UTSD to ULUE; quantifies the contribution of the constituents of ULUE to UTSD; and reveals the intrinsic principle of the interaction between UTSD and ULUE (Figure 6). It also combines the spatial heterogeneity of the interaction between UTSD and ULUE to study the interaction mechanism of the two (Figure 7). This study supplements existing research achievements and has realized an in depth discussion from theoretical inference to data verification and from coordination evaluation to the interaction mechanism [72].
City-based studies concluded that the impact of transportation network construction on land use was that the construction of high-grade transportation networks, such as high-speed railways, expressways, and airports, led to land development around the stations and increased the intensity of land use, thus affecting ULUE [26,28]. This is consistent with the findings of this study indicating that transportation arterials are the most important driving element (30.41%) of ULUE (Figure 6a). Transportation arterials not only increase the area of construction land but also require a large amount of capital, manpower and other resources. All of these factors are important constituent indicators for ULUE evaluation, so transportation arterials can have a significant impact on ULUE [39]. Transportation network density is one of the key drivers of ULUE (24.98%). The enhanced function of urban transportation hubs could promote the upgrading of urban industrial structures, enhancing ULUE [53,73]. Some studies also believe that high-speed rail might make cities peripheral, with urban expressway systems hollowing out markets and accelerating the expansion of built-up land, leading to a decline in ULUE [32,74]. In conclusion, all of the above studies reflect that transportation networks have a significant impact on ULUE. The results of this study are presented as a synthesis of the above studies, and the effect of the transportation network construction on ULUE is spatially bi-directional in a positive and negative manner in Gansu (Figure 7a). The positive interaction between UTSD and ULUE and the overflowing effect of formation are presented in the core city of Lanzhou and the surrounding cities (Figure 5c) [27]. The growth of UTSD in the Longdong and western Hexi regions negatively affects ULUE. Combined with the fact that regional accessibility has a significantly lower impact on ULUE (11.72%) than the other two (Figure 6a), this suggests that Lanzhou has a weaker economic impact as a core city [75]. The common characteristics of the Longdong and western Hexi regions are far from those of the core cities. The lack of a core city makes it challenging to allocate resources efficiently, and an increase in UTSD may lead to the duplication of certain infrastructural settings across units rather than efficient utilization [76,77]. Overall, the spatial heterogeneity of the effect of UTSD on ULUE is evident, and transportation arterials have the greatest impact on ULUE.
Existing studies on the relationship between land use and transportation accessibility show that commercial and residential agglomerations prioritize improving transportation accessibility, followed by industrial agglomerations. Public service provision areas are also the key areas for transportation network construction [78]. This study found that tax revenue is the most important driver of UTSD (15.10%) (Figure 6b). The construction of transportation infrastructure requires tax revenue as a guarantee, and industrial and commercial areas are the most important source of tax revenue, while industrial and commercial activities cannot be separated from the support of transportation facilities [79]. Therefore, industrial and commercial areas have both the ability and willingness to increase UTSD and are areas with higher UTSD [80]. Secondary and tertiary value added is a quantification of economic activity in business and industry and is an equally important driver of UTSD (13.23%). This study found that the number of completed national research projects is an important driver for UTSD (14.06%). The number of completed national research projects is an important reflection of the region’s research capacity. Strong scientific research capacity can promote the innovation and development of transportation technology [81]; high-tech industries require higher efficiency in the movement of people and materials, which leads to a higher demand for efficient and convenient transportation networks [82]; and the transformation of the results of scientific research projects can contribute to the economic and social development of the region, including the improvement of transportation infrastructures [83]. Existing studies show that, the larger the urban area, the more the agglomeration effect can be formed to attract investment and provide public services, meaning that demand for transportation facilities can be more easily satisfied [80,84,85]. This is consistent with our findings that urban area is an important driver of UTSD (10.90%). The amount of investment in secondary and tertiary fixed assets is the amount of investment used to acquire and construct fixed assets. The transportation network, as an important fixed asset and infrastructure in the region, is usually an important element of this investment [20,86]. Therefore, the fixed investment in secondary and tertiary industries has a significant impact on UTSD (8.72%). In general, the connotation of ULUE prompts the demand for improving the transportation infrastructure and, at the same time, provides a guarantee for UTSD upgrading [78,87]. Therefore, ULUE has a stimulative effect on UTSD. Longzhong and the surrounding areas are the most densely populated commercial, industrial, and technology areas in Gansu [88]. Therefore, this region has the highest UTSD in the province (Figure 3). This region has a strong ability to deploy and efficiently utilize all types of resources [85], and a high UTSD with high ULUE agglomeration is usually formed in the core area (Figure 5c). The area radiated by this core is positively driven by ULUE to UTSD, so the contribution of ULUE to UTSD is particularly significant in Longzhong and neighboring areas (Figure 7b).

4.4. Policy Recommendations and Shortcomings of This Study

4.4.1. Policy Recommendations

The results of the coupling and coordination study of UTSD and ULUE found that the overall trend in UTSD lagging behind ULUE in Gansu did not change by 2020 (Figure 5a). Therefore, the transportation network needs to be continuously constructed and improved. At the same time, taking into account the decline in ULUE seen from 2015 to 2020, the investment in transportation infrastructure will need to be biased; additionally, the Xinan region formed a low UTSD and low ULUE agglomeration (Figure 5c). The interactions between UTSD and ULUE in this region were all positively facilitated (Figure 7). Therefore, in the future, the Xinan region of Gansu should prioritize transportation network planning and construction, especially the planning and construction of transportation arteries. Through the investment in transportation infrastructure construction, not only can the UTSD of the region be improved but the improvement of the various production inputs in regard to utilization efficiency and ULUE can be promoted. In the Longdon and Hexi regions, an increase in UTSD may cause a decrease in ULUE. Efforts should first be made to cultivate regional core cities to match and optimize existing input resources and form a positive interaction between UTSD and ULUE. The Longzhong region, as the core region of Gansu Province, needs to continue to expand its influence and the positive spillover effects of UTSD and ULUE to the southeastern part of Gansu, realizing the ability of greater regional economic radiation and efficient resource utilization. In summary, the areas where UTSD and ULUE mutually promote each other should be prioritized for transportation network construction, mainly including Xinan and Longzhong areas. The areas where the increase in UTSD will reduce ULUE should be carefully planned for transportation infrastructure construction, particularly the Longdong region and the western part of Hexi region.

4.4.2. Deficiency and Prospect

This study takes the county-level city as the basic unit, and the advantage is that the research results can correspond to each administrative unit individually, which helps in the formulation and implementation of the development plan. Regarding the spatial scales of geographic research, the research results may differ across scales [56]. Owing to limited data availability, the study period is 2005–2020, and it may be possible to better grasp the evolution and interaction between UTSD and ULUE if longer time series data are studied [89]. Transportation is essentially one of the media through which communication is realized, and inter-regional communication is achieved through various means, including information, energy, and material flows [89]. Currently, the spatial flow capture technology is gradually maturing. If the capture and recording of spatial flow can be realized, this can more objectively reflect the actual situation of inter-regional exchanges and connections. Moreover, its impact on ULUE is worthy of in depth exploration in the future [90]. The natural environment plays an important role in influencing transportation network construction and land use processes [91]. How to incorporate environmental factors better into a study is an issue that should be of great concern in future research. This paper proves that UTSD and ULUE are mutually causal, but the influence path of the two needs to be further discussed. The structural equation model can be used to further study the relationship between variables in the future [92].

5. Conclusions

This paper established a comprehensive data base containing transportation network data, geographic environmental data, and socioeconomic data, utilizing the county area of Gansu as the research unit. Furthermore, this study used the improved UTSD algorithm, S-SBM-U, CCDM, Moran’s I, ADF, PGCT VIF, RF and MGTWR to reveal the spatial and temporal evolution and coupling relationship between UTSD and ULUE in Gansu during 2005–2020 and verified and explored the mechanism of the interaction between UTSD and ULUE. The main conclusions are as follows: from 2005 to 2020, the average UTSD in Gansu increased from 0.56 to 1.01 and the Belt and Road Initiative accelerated the construction of the transportation network in Gansu. By 2020, higher UTSD units connected the province from east to west and the transportation corridor had been initially completed. The average ULUE increased from 0.52 to 0.62, with the growth trend first increasing and then decreasing. The spatial distribution of ULUE was high in the west and north and low in the east and south. From 2005 to 2020, the average CCDM of UTSD and ULUE in Gansu increased from slightly unbalanced (0.37) to slightly balanced (0.52) and the coordination characteristics were mainly characterized by UTSD lagging behind ULUE. There was a positive spatial effect between UTSD and ULUE, the clusters were spatially clustered, and spatially high-UTSD and high-ULUE clustered areas existed along the transportation arteries. UTSD and ULUE were mutually causal, with the degree of transportation arterial influence degree being the strongest driver of ULUE among the components of UTSD (30.41% contribution) and tax revenue being the strongest driver of UTSD among the components of ULUE (15.10% contribution). UTSD positively and negatively drove ULUE in both directions and ULUE positively drove UTSD. The spatial heterogeneity of UTSD and ULUE interactions was obvious, and core cities played a key role in resource allocation and efficient utilization. Overall, the connotation of ULUE prompted the demand for improving the transportation infrastructure and, at the same time, provided a guarantee in regard to UTSD upgrading, which in turn affected the ULUE. The future transportation network must be continuously constructed and improved, and, at the same time, the investment in transportation infrastructure will need to be biased. The Xinan region of Gansu should prioritize the planning and construction of the transportation network, which would help improve UTSD and ULUE and promote the efficient use of all types of resources. In the Longdong and Hexi regions, efforts should first be made to cultivate regional core cities to match and optimize existing input resources and form a positive interaction between UTSD and ULUE. The Longzhong region needs to continue to expand its influence and seek to expand the positive spillover effects of UTSD and ULUE to the southeastern part of Gansu, realizing the ability of greater regional economic radiation and efficient resource utilization. Future research will discuss the interaction between UTSD and ULUE at different scales while also examing how environmental factors can be more fully integrated into research. These are issues that merit further study.

Author Contributions

Conceptualization, J.L. and N.P.; methodology, J.L. and Y.Y.; software, J.L. and X.M.; validation, J.L., Y.Y. and Z.C.; formal analysis, J.L. and G.L.; investigation, G.X. and G.L.; resources, G.L. and N.P.; data curation, Z.C.; writing—original draft preparation, J.L.; writing—review and editing, N.P.; visualization, J.Y.; supervision, G.L.; project administration, G.L.; funding acquisition, G.L., N.P. and X.M., J.L. and N.P. designed research; J.L., X.M. and G.L. performed research; Y.Y. and Z.C. provided methodology and software; J.L. and N.P. wrote the original draft; J.Y. and G.X. for review and editing; G.L. and N.P. provided funding acquisition and project administration. All authors have read and agreed to the published version of the manuscript.

Funding

This work was supported by the National Natural Science Foundation of China (32360438); Gansu Agricultural University Scientific Research Start-up Project, China (GAU-KYQD-2022-50); Gansu Leading Talent Program (GSBJLJ-2023-09); Finance Special Project of Gansu Province (GSCZZ 20160909); Soft Science Specialization in Gansu Province—Open Call Category (23JRZA449).

Data Availability Statement

The original contributions presented in the study are included in the article, further inquiries can be directed to the corresponding author.

Acknowledgments

We sincerely thank the individuals and organizations that participated in the survey and facilitated the study.

Conflicts of Interest

The authors declare no conflicts of interest.

References

  1. Mahmoudi, R.; Shetab-Boushehri, S.-N.; Hejazi, S.R.; Emrouznejad, A. Determining the relative importance of sustainability evaluation criteria of urban transportation network. Sustain. Cities Soc. 2019, 47, 101493. [Google Scholar] [CrossRef]
  2. Blaydes, L.; Paik, C. Trade and Political Fragmentation on the Silk Roads: The Economic Effects of Historical Exchange between China and the Muslim East. Am. J. Political Sci. 2021, 65, 115–132. [Google Scholar] [CrossRef]
  3. Rodrigue, J.-P.; Comtois, C.; Slack, B. The Geography of Transport Systems, 3rd ed.; Routledge: London, UK, 2013. [Google Scholar]
  4. Kasraian, D.; Maat, K.; Stead, D.; Van Wee, B. Long-term impacts of transport infrastructure networks on land-use change: An international review of empirical studies. Transp. Rev. 2016, 36, 772–792. [Google Scholar] [CrossRef]
  5. Jin, F.; Wang, C.; Li, X. Discrimination method and its application analysis of regional transport superiority. Acta Geogr. Sin. 2008, 63, 787–798. [Google Scholar] [CrossRef]
  6. Jin, F.; Wang, C.; Li, X.; Wang, J. China’s regional transport dominance: Density, proximity, and accessibility. J. Geogr. Sci. 2010, 20, 295–309. [Google Scholar] [CrossRef]
  7. Zheng, S.; Dai, H.; Wang, G.; Miao, L.; Zhang, W. Application of Transportation Superiority in Beijing-Tianjin-Hebei Region Based on High-Resolution Satellite Remote Sensing Data. In Proceedings of the 2021 IEEE International Geoscience and Remote Sensing Symposium IGARSS, Brussels, Belgium, 11–16 July 2021; pp. 6964–6967. [Google Scholar] [CrossRef]
  8. Zhu, X.; Zhang, P.; Wei, Y.; Li, Y.; Zhao, H. Measuring the efficiency and driving factors of urban land use based on the DEA method and the PLS-SEM model—A case study of 35 large and medium-sized cities in China. Sustain. Cities Soc. 2019, 50, 101646. [Google Scholar] [CrossRef]
  9. Estoque, R.C.; Ooba, M.; Togawa, T.; Hijioka, Y.; Murayama, Y. Monitoring global land-use efficiency in the context of the UN 2030 Agenda for Sustainable Development. Habitat Int. 2021, 115, 102403. [Google Scholar] [CrossRef]
  10. Xue, D.; Yue, L.; Ahmad, F.; Draz, M.U.; Chandio, A.A.; Ahmad, M.; Amin, W. Empirical investigation of urban land use efficiency and influencing factors of the Yellow River basin Chinese cities. Land Use Policy 2022, 117, 106117. [Google Scholar] [CrossRef]
  11. Jiao, L.; Xu, Z.; Xu, G.; Zhao, R.; Liu, J.; Wang, W. Assessment of urban land use efficiency in China: A perspective of scaling law. Habitat Int. 2020, 99, 102172. [Google Scholar] [CrossRef]
  12. Liu, J.; Hou, X.; Wang, Z.; Shen, Y. Study the effect of industrial structure optimization on urban land-use efficiency in China. Land Use Policy 2021, 105, 105390. [Google Scholar] [CrossRef]
  13. He, S.; Yu, S.; Li, G.; Zhang, J. Exploring the influence of urban form on land-use efficiency from a spatiotemporal heterogeneity perspective: Evidence from 336 Chinese cities. Land Use Policy 2020, 95, 104576. [Google Scholar] [CrossRef]
  14. Dong, Y.; Jin, G.; Deng, X. Dynamic interactive effects of urban land-use efficiency, industrial transformation, and carbon emissions. J. Clean. Prod. 2020, 270, 122547. [Google Scholar] [CrossRef]
  15. Liu, S.; Xiao, W.; Li, L.; Ye, Y.; Song, X. Urban land use efficiency and improvement potential in China: A stochastic frontier analysis. Land Use Policy 2020, 99, 105046. [Google Scholar] [CrossRef]
  16. Yu, J.; Zhou, K.; Yang, S. Land use efficiency and influencing factors of urban agglomerations in China. Land Use Policy 2019, 88, 104143. [Google Scholar] [CrossRef]
  17. Wu, Q.; Cao, Y.; Fang, X.; Wang, J.; Li, G. A systematic coupling analysis framework and multi-stage interaction mechanism between urban land use efficiency and ecological carrying capacity. Sci. Total Environ. 2022, 853, 158444. [Google Scholar] [CrossRef]
  18. Kuang, B.; Lu, X.; Zhou, M.; Chen, D. Provincial cultivated land use efficiency in China: Empirical analysis based on the SBM-DEA model with carbon emissions considered. Technol. Forecast. Soc. Change 2020, 151, 119874. [Google Scholar] [CrossRef]
  19. Pradhan, R.P.; Arvin, M.B.; Nair, M. Urbanization, transportation infrastructure, ICT, and economic growth: A temporal causal analysis. Cities 2021, 115, 103213. [Google Scholar] [CrossRef]
  20. Banerjee, A.; Duflo, E.; Qian, N. On the road: Access to transportation infrastructure and economic growth in China. J. Dev. Econ. 2020, 145, 102442. [Google Scholar] [CrossRef]
  21. Lu, X.; Wang, M.; Tang, Y. The Spatial Changes of Transportation Infrastructure and Its Threshold Effects on Urban Land Use Efficiency: Evidence from China. Land 2021, 10, 346. [Google Scholar] [CrossRef]
  22. Zhao, G.; Zheng, X.; Yuan, Z.; Zhang, L. Spatial and Temporal Characteristics of Road Networks and Urban Expansion. Land 2017, 6, 30. [Google Scholar] [CrossRef]
  23. Liu, Z.; Zeng, S.; Jin, Z.; Shi, J.J. Transport infrastructure and industrial agglomeration: Evidence from manufacturing industries in China. Transp. Policy 2022, 121, 100–112. [Google Scholar] [CrossRef]
  24. Jiao, J.; Wang, J.; Zhang, F.; Jin, F.; Liu, W. Roles of accessibility, connectivity and spatial interdependence in realizing the economic impact of high-speed rail: Evidence from China. Transp. Policy 2020, 91, 1–15. [Google Scholar] [CrossRef]
  25. Long, F.; Zheng, L.; Song, Z. High-speed rail and urban expansion: An empirical study using a time series of nighttime light satellite data in China. J. Transp. Geogr. 2018, 72, 106–118. [Google Scholar] [CrossRef]
  26. Qiao, W.; Huang, X. Change in Urban Land Use Efficiency in China: Does the High-Speed Rail Make a Difference? Int. J. Environ. Res. Public Health 2021, 18, 10043. [Google Scholar] [CrossRef] [PubMed]
  27. Cui, X.; Fang, C.; Wang, Z.; Bao, C. Spatial relationship of high-speed transportation construction and land-use efficiency and its mechanism: Case study of Shandong Peninsula urban agglomeration. J. Geogr. Sci. 2019, 29, 549–562. [Google Scholar] [CrossRef]
  28. Wang, D.; Gong, Z.; Yang, Z. Design of industrial clusters and optimization of land use in an airport economic zone. Land Use Policy 2018, 77, 288–297. [Google Scholar] [CrossRef]
  29. Gingerich, K.; Maoh, H. The role of airport proximity on warehouse location and associated truck trips: Evidence from Toronto, Ontario. J. Transp. Geogr. 2019, 74, 97–109. [Google Scholar] [CrossRef]
  30. Kamruzzaman, M.; Aston, L.; Baker, D.; Braun, B.; Shatu, F. Changes in land use typology of global airports: An empirical investigation with implications for the aerotropolis concept. J. Transp. Geogr. 2021, 97, 103217. [Google Scholar] [CrossRef]
  31. Mothorpe, C.; Hanson, A.; Schnier, K. The impact of interstate highways on land use conversion. Ann. Reg. Sci. 2013, 51, 833–870. [Google Scholar] [CrossRef]
  32. Gonzalez-Navarro, M.; Turner, M.A. Subways and urban growth: Evidence from earth. J. Urban Econ. 2018, 108, 85–106. [Google Scholar] [CrossRef]
  33. Condeço-Melhorado, A.; Tillema, T.; De Jong, T.; Koopal, R. Distributive effects of new highway infrastructure in the Netherlands: The role of network effects and spatial spillovers. J. Transp. Geogr. 2014, 34, 96–105. [Google Scholar] [CrossRef]
  34. Zhai, M.; Wolff, H. Air pollution and urban road transport: Evidence from the world’s largest low-emission zone in London. Environ. Econ. Policy Stud. 2021, 23, 721–748. [Google Scholar] [CrossRef]
  35. Wang, X.; Duan, Z.; Wu, L.; Yang, D. Estimation of carbon dioxide emission in highway construction: A case study in southwest region of China. J. Clean. Prod. 2015, 103, 705–714. [Google Scholar] [CrossRef]
  36. Maparu, T.S.; Mazumder, T.N. Transport infrastructure, economic development and urbanization in India (1990–2011): Is there any causal relationship? Transp. Res. Part A Policy Pract. 2017, 100, 319–336. [Google Scholar] [CrossRef]
  37. Cao, S.; Xu, H.; Xu, Y.; Wang, X.; Zheng, Y.; Li, Y. Assessment of the integrated benefits of highway infrastructure and analysis of the spatiotemporal variation: Evidence from 29 provinces in China. Socio-Econ. Plan. Sci. 2023, 90, 101740. [Google Scholar] [CrossRef]
  38. Ren, Y.; Tian, Y.; Xiao, X. Spatial effects of transportation infrastructure on the development of urban agglomeration integration: Evidence from the Yangtze River Economic Belt. J. Transp. Geogr. 2022, 104, 103431. [Google Scholar] [CrossRef]
  39. Zhao, S.; Yan, Y.; Han, J. Industrial Land Change in Chinese Silk Road Cities and Its Influence on Environments. Land 2021, 10, 806. [Google Scholar] [CrossRef]
  40. Mayer, M.; Zhang, X. Theorizing China-world integration: Sociospatial reconfigurations and the modern silk roads. Rev. Int. Political Econ. 2021, 28, 974–1003. [Google Scholar] [CrossRef]
  41. Jiang, H. Spatial–temporal differences of industrial land use efficiency and its influencing factors for China’s central region: Analyzed by SBM model. Environ. Technol. Innov. 2021, 22, 101489. [Google Scholar] [CrossRef]
  42. Xiao, Y.; Zhong, J.-L.; Zhang, Q.-F.; Xiang, X.; Huang, H. Exploring the coupling coordination and key factors between urbanization and land use efficiency in ecologically sensitive areas: A case study of the Loess Plateau, China. Sustain. Cities Soc. 2022, 86, 104148. [Google Scholar] [CrossRef]
  43. Liu, H.; Cui, W.; Zhang, M. Exploring the causal relationship between urbanization and air pollution: Evidence from China. Sustain. Cities Soc. 2022, 80, 103783. [Google Scholar] [CrossRef]
  44. Zhou, L.; Wu, T.; Pu, L.; Meadows, M.; Jiang, G.; Zhang, J.; Xie, X. Spatially heterogeneous relationships of PM2.5 concentrations with natural and land use factors in the Niger River Watershed, West Africa. J. Clean. Prod. 2023, 394, 136406. [Google Scholar] [CrossRef]
  45. Wang, Y.; Niu, Y.; Li, M.; Yu, Q.; Chen, W. Spatial structure and carbon emission of urban agglomerations: Spatiotemporal characteristics and driving forces. Sustain. Cities Soc. 2022, 78, 103600. [Google Scholar] [CrossRef]
  46. Guo, Z.; Xie, Y.; Guo, H.; Zhang, X.; Wang, H.; Bie, Q.; Xi, G.; Ma, C. Do the ecosystems of Gansu Province in Western China’s crucial ecological security barrier remain vulnerable? Evidence from remote sensing based on geospatial analysis. J. Clean. Prod. 2023, 402, 136740. [Google Scholar] [CrossRef]
  47. Yin, Z.; Feng, Q.; Zhu, R.; Wang, L.; Chen, Z.; Fang, C.; Lu, R. Analysis and prediction of the impact of land use/cover change on ecosystem services value in Gansu province, China. Ecol. Indic. 2023, 154, 110868. [Google Scholar] [CrossRef]
  48. Chen, W.; Bian, J.; Liang, J.; Pan, S.; Zeng, Y. Traffic accessibility and the coupling degree of ecosystem services supply and demand in the middle reaches of the Yangtze River urban agglomeration, China. J. Geogr. Sci. 2022, 32, 1471–1492. [Google Scholar] [CrossRef]
  49. Li, Y. Regional environmental efficiency in China: An empirical analysis based on entropy weight method and non-parametric models. J. Clean. Prod. 2020, 276, 124147. [Google Scholar] [CrossRef]
  50. Hu, H.; Wang, J.; Jin, F.; Ding, N. Evolution of regional transport dominance in China 1910–2012. J. Geogr. Sci. 2015, 25, 723–738. [Google Scholar] [CrossRef]
  51. Weiss, D.J.; Nelson, A.; Gibson, H.S.; Temperley, W.; Peedell, S.; Lieber, A.; Hancher, M.; Poyart, E.; Belchior, S.; Fullman, N.; et al. A global map of travel time to cities to assess inequalities in accessibility in 2015. Nature 2018, 553, 333–336. [Google Scholar] [CrossRef]
  52. Qin, X.; Qian, Y.; Zeng, J.; Wei, X. Accessibility and Economic Connections between Cities of the New Western Land–Sea Corridor in China—Enlightenments to the Passageway Strategy of Gansu Province. Sustainability 2022, 14, 4445. [Google Scholar] [CrossRef]
  53. Li, C.; Gao, X.; He, B.-J.; Wu, J.; Wu, K. Coupling Coordination Relationships between Urban-industrial Land Use Efficiency and Accessibility of Highway Networks: Evidence from Beijing-Tianjin-Hebei Urban Agglomeration, China. Sustainability 2019, 11, 1446. [Google Scholar] [CrossRef]
  54. Yang, Y.; Hu, N. The spatial and temporal evolution of coordinated ecological and socioeconomic development in the provinces along the Silk Road Economic Belt in China. Sustain. Cities Soc. 2019, 47, 101466. [Google Scholar] [CrossRef]
  55. Wood, S.N. A simple test for random effects in regression models. Biometrika 2013, 100, 1005–1010. [Google Scholar] [CrossRef]
  56. Li, J.; Li, G.; Liang, Y.; Yuan, J.; Xu, G.; Yang, C. Spatiotemporal differentiation of the ecosystem service value and its coupling relationship with urbanization: A case study of the Lanzhou-Xining urban agglomeration. Ecol. Indic. 2024, 160, 111932. [Google Scholar] [CrossRef]
  57. Liu, N.; Zou, B.; Li, S.; Zhang, H.; Qin, K. Prediction of PM2.5 concentrations at unsampled points using multiscale geographically and temporally weighted regression. Environ. Pollut. 2021, 284, 117116. [Google Scholar] [CrossRef]
  58. Xiao, F.; Wang, J.; Xiong, M.; Mo, H. Does spatiotemporal heterogeneity matter? Air transport and the rise of high-tech industry in China. Appl. Geogr. 2024, 162, 103148. [Google Scholar] [CrossRef]
  59. Zhang, X.; Liu, C.A. Model averaging prediction by K-fold cross-validation. J. Econom. 2023, 235, 280–301. [Google Scholar] [CrossRef]
  60. Jin, F.; Chen, Z. Evolution of transportation in China since reform and opening up: Patterns and principles. J. Geogr. Sci. 2019, 29, 1731–1757. [Google Scholar] [CrossRef]
  61. Leng, A.; Wang, K.; Bai, J.; Gu, N.; Feng, R. Analyzing sustainable development in Chinese cities: A focus on land use efficiency in production-living-ecological aspects. J. Clean. Prod. 2024, 448, 141461. [Google Scholar] [CrossRef]
  62. Wang, W.; Hu, Y.; Wang, J.; Niu, S. Urban construction land allocation efficiency of urban agglomerations in China based on a stochastic frontier production function approach. J. Clean. Prod. 2024, 434, 139965. [Google Scholar] [CrossRef]
  63. Jiang, Y.; Liu, X.; Yang, L.; Hu, T.; Pan, H.; Luo, H.; Han, W.; Xiao, S. Moving towards sustainable development in China’s rural counties: Ecological efficiency evaluation based on DEA-Malmquist-Tobit model. J. Clean. Prod. 2024, 442, 141093. [Google Scholar] [CrossRef]
  64. Lan, Z.; Zhi-bin, Z.; Ya-xiong, M.; Jiang-hong, D. Spatio-temporal dynamic evaluation of land use benefit and its coupling coordination in Gansu Province. IOP Conf. Ser. Earth Environ. Sci. 2020, 619, 012013. [Google Scholar] [CrossRef]
  65. Ma, L.; Chen, M.; Fang, F.; Che, X. Research on the spatiotemporal variation of rural-urban transformation and its driving mechanisms in underdeveloped regions: Gansu Province in western China as an example. Sustain. Cities Soc. 2019, 50, 101675. [Google Scholar] [CrossRef]
  66. Fan, X.; Qiu, S.; Sun, Y. Land finance dependence and urban land marketization in China: The perspective of strategic choice of local governments on land transfer. Land Use Policy 2020, 99, 105023. [Google Scholar] [CrossRef]
  67. Wu, H.; Fang, S.; Zhang, C.; Hu, S.; Nan, D.; Yang, Y. Exploring the impact of urban form on urban land use efficiency under low-carbon emission constraints: A case study in China’s Yellow River Basin. J. Environ. Manag. 2022, 311, 114866. [Google Scholar] [CrossRef]
  68. Ma, Y.; Zhang, P.; Zhao, K.; Zhou, Y.; Zhao, S. A Dynamic Performance and Differentiation Management Policy for Urban Construction Land Use Change in Gansu, China. Land 2022, 11, 942. [Google Scholar] [CrossRef]
  69. Wang, J.; Liu, H.; Liu, P.; Chang, G. An evaluation of the spatial rationality of provincial territory: A case study of Gansu Province. Environ. Sci. Pollut. Res. 2022, 30, 18268–18284. [Google Scholar] [CrossRef]
  70. Guo, X.; Chen, Y.; Jia, Z.; Li, Y.; Zhang, L.; Qiao, Z.; Hao, Y. Spatial and temporal inequity of urban land use efficiency in China: A perspective of dynamic expansion. Environ. Impact Assess. Rev. 2024, 104, 107357. [Google Scholar] [CrossRef]
  71. Zhang, P.; Li, W.; Zhao, K.; Zhao, S. Spatial Pattern and Driving Mechanism of Urban–Rural Income Gap in Gansu Province of China. Land 2021, 10, 1002. [Google Scholar] [CrossRef]
  72. Sun, Y.J.; Qiao, W.X.; Zhang, Y.S.; Yang, Y. GIS-Based Urban Land Use and Traffic Coordination Evaluation System. Appl. Mech. Mater. 2015, 738–739, 204–208. [Google Scholar] [CrossRef]
  73. Lu, X.; Shi, Z.; Li, J.; Dong, J.; Song, M.; Hou, J. Research on the Impact of Factor Flow on Urban Land Use Efficiency from the Perspective of Urbanization. Land 2022, 11, 389. [Google Scholar] [CrossRef]
  74. Jia, S.; Zhou, C.; Qin, C. No difference in effect of high-speed rail on regional economic growth based on match effect perspective? Transp. Res. Part A Policy Pract. 2017, 106, 144–157. [Google Scholar] [CrossRef]
  75. Wang, F.; Liu, Z.; Xue, P.; Dang, A. High-speed railway development and its impact on urban economy and population: A case study of nine provinces along the Yellow River, China. Sustain. Cities Soc. 2022, 87, 104172. [Google Scholar] [CrossRef]
  76. Wolff, M. Understanding the role of centralization processes for cities—Evidence from a spatial perspective of urban Europe 1990–2010. Cities 2018, 75, 20–29. [Google Scholar] [CrossRef]
  77. Paiho, S.; Mäki, E.; Wessberg, N.; Paavola, M.; Tuominen, P.; Antikainen, M.; Heikkilä, J.; Rozado, C.A.; Jung, N. Towards circular cities—Conceptualizing core aspects. Sustain. Cities Soc. 2020, 59, 102143. [Google Scholar] [CrossRef]
  78. Wang, Z.; Han, Q.; De Vries, B. Land Use/Land Cover and Accessibility: Implications of the Correlations for Land Use and Transport Planning. Appl. Spat. Anal. Policy 2019, 12, 923–940. [Google Scholar] [CrossRef]
  79. Langer, S.; Korzhenevych, A. The effect of industrial and commercial land consumption on municipal tax revenue: Evidence from Bavaria. Land Use Policy 2018, 77, 279–287. [Google Scholar] [CrossRef]
  80. Liu, L.; Zhang, M. High-speed rail impacts on travel times, accessibility, and economic productivity: A benchmarking analysis in city-cluster regions of China. J. Transp. Geogr. 2018, 73, 25–40. [Google Scholar] [CrossRef]
  81. Hu, W.; Shu, X.; Huang, B. Sustainability innovations in transportation infrastructure: An overview of the special volume on sustainable road paving. J. Clean. Prod. 2019, 235, 369–377. [Google Scholar] [CrossRef]
  82. Zandiatashbar, A.; Hamidi, S.; Foster, N. High-tech business location, transportation accessibility, and implications for sustainability: Evaluating the differences between high-tech specializations using empirical evidence from U.S. booming regions. Sustain. Cities Soc. 2019, 50, 101648. [Google Scholar] [CrossRef]
  83. Dawson, P. Establishing a high tech company in a global competitive market: A sociomaterial process perspective. Ind. Mark. Manag. 2020, 86, 233–243. [Google Scholar] [CrossRef]
  84. Luo, H.; Qian, Y.; Zeng, J.; Wei, X.; Guang, X. An Empirical Analysis of Logistics Corridors and Regional Economic Spatial Patterns from the Perspective of Compressive Transportation between Urban Agglomerations. Land 2022, 11, 726. [Google Scholar] [CrossRef]
  85. Yu, B.; Zhou, X. Urban administrative hierarchy and urban land use efficiency: Evidence from Chinese cities. Int. Rev. Econ. Financ. 2023, 88, 178–195. [Google Scholar] [CrossRef]
  86. Sarri, P.; Tzouras, P.G.; Tsigdinos, S.; Kaparias, I.; Kepaptsoglou, K. Incorporating Land Use and Transport Interaction Models to Evaluate Active Mobility Measures and Interventions in Urban Areas: A case study in Southampton, UK. Sustain. Cities Soc. 2024, 105, 105330. [Google Scholar] [CrossRef]
  87. Yin, J.; Li, S.; Zhou, L.; Jiang, L.; Ma, W. Spatial heterogeneity of the economic growth pattern and influencing factors in formerly destitute areas of China. J. Geogr. Sci. 2022, 32, 829–852. [Google Scholar] [CrossRef]
  88. Ma, L.; Chen, M.; Che, X.; Fang, F. Research on Population-Land-Industry Relationship Pattern in Underdeveloped Regions: Gansu Province of Western China as an Example. Sustainability 2019, 11, 2434. [Google Scholar] [CrossRef]
  89. Feyrer, J. Trade and Income—Exploiting Time Series in Geography. Am. Econ. J. Appl. Econ. 2019, 11, 1–35. [Google Scholar] [CrossRef]
  90. Bates, J.; Lin, Y.-W.; Goodale, P. Data journeys: Capturing the socio-material constitution of data objects and flows. Big Data Soc. 2016, 3, 205395171665450. [Google Scholar] [CrossRef]
  91. Li, X.; Fu, J.; Jiang, D.; Lin, G.; Cao, C. Land use optimization in Ningbo City with a coupled GA and PLUS model. J. Clean. Prod. 2022, 375, 134004. [Google Scholar] [CrossRef]
  92. Hair, J.F., Jr.; Sarstedt, M. Factors versus composites: Guidelines for choosing the right structural equation modeling method. Proj. Manag. J. 2019, 50, 619–624. [Google Scholar] [CrossRef]
Figure 1. Specific technological roadmap.
Land 13 01787 g001
Figure 2. Study area. (a) Spatial geography overview and administrative divisions of county-level cities in Gansu. Overview of county-level cities in Gansu in terms of administrative divisions and spatial geography. (b) Location of Gansu in China and the strategic importance of Gansu as a transportation corridor. (c) General spatial distribution pattern of land use in Gansu in 2020. To facilitate the analysis and comparison of research results, Gansu was divided into five regions: Hexi: Jiuquan, Jiayuguan, Zhangye, Jingchang, and Wuwei; Longzhong: Lanzhou, Baiyin, and Dingxi; Xinan: Linxia and Gannan; Dongnan: Tianshui and Longnan; and Longdong: Pingliang and Qingyang.
Land 13 01787 g002
Figure 3. (a) Evolution of UTSD in county-level cities in Gansu from 2005 to 2020. (UTSD > 1.29, high; 1.29 ≥ UTSD > 0.75, relatively high; 0.75 ≥ UTSD > 0.43, medium; 0.43 ≥ UTSD > 0.08, relatively low; UTSD ≥ 0.08, low). (b) Average spatial distribution situation of UTSD by county-level cities from 2005 to 2020. The green dots and lines represent the UTSD projection on the X-axis and the change fitting curve (east-west variation), respectively. The blue dots and lines represent the UTSD projection on the Y-axis and the change fitting curve (north-south change), respectively. (c) Subregional statistics regarding UTSD and rates of change.
Land 13 01787 g003
Figure 4. (a) Evolution of ULUE in county-level cities in Gansu from 2005 to 2020. (ULUE > 0.77, high; 0.77 ≥ UTSD > 0.55, relatively high; 0.55 ≥ UTSD > 0.42, medium; 0.42 ≥ UTSD > 0.28, relatively low; UTSD ≥ 0.28, low). (b) Average spatial distribution situation of ULUE by county-level cities from 2005 to 2020. The green dots and lines represent the ULUE projection on the X-axis and the change fitting curve (east-west variation), respectively. The blue dots and lines represent the ULUE projection on the Y-axis and the change fitting curve (north-south change), respectively. (c) Subregional statistics regarding ULUE and rates of change.
Land 13 01787 g004
Figure 5. (a) Spatiotemporal coupling and evolution between UTSD and ULUE in county-level cities from 2005 to 2020. (types ‘A’, ‘B’, ‘C’ and ‘D’ denote seriously balanced, slightly balanced, slightly unbalanced, and seriously unbalanced; types ‘1’, ‘2’ and ‘3’ denote UTSD significantly lagged, synchronous development and ULUE significantly lagged). (b) Average CCDM in Gansu and the percentage of each CCDM city. (c) Spatial–temporal distribution of LISA clustering for UTSD and ULUE in Gansu (UTSD–ULUE). (d) Bivariate global Moran index of UTSD and ULUE.
Land 13 01787 g005
Figure 6. (a) Measure the contribution of UTSD indicators to ULUE. (b) Measure the contribution of ULUE indicators to UTSD.
Land 13 01787 g006
Figure 7. Spatial heterogeneity of UTSD and ULUE interactions. (a) Spatial characteristics of the UTSD driving effect on ULUE. (b) Spatial characteristics of the ULUE driving effect on UTSD.
Land 13 01787 g007
Table 1. Data sources and descriptions used in this study.
Data TypeData NameData SourceDescription
Geographic environmental dataResidential pointGansu Basic Geographic Information Center (https://www.webmap.cn/store.do?method=store&storeId=105; accessed on 10 March 2024)Spatial latitude, longitude and elevation of settlements.
Administrative unit boundariesSpatial location and area of each administrative region.
River systemResource and Environment Science and Data Center (http://www.resdc.cn; accessed on 10 March 2024)Spatial distribution of rivers.
ElevationDigital elevation model (DEM) raster data.
Transportation network dataRailway networkChina Railway Corporation (http://wap.china-railway.com.cn; accessed on 15 March 2024)Distribution of ordinary and high-speed railways in operation in Gansu, 2005, 2010, 2015 and 2020.
Highway networkNational Platform for Common Geospatial Information Services (https://www.tianditu.gov.cn/; accessed on 15 March 2024)Distribution of operational highways, national highways, provincial highways, county highway and township road in Gansu, 2005, 2010, 2015, and 2020.
AirportCivil Aviation Administration of China (www.caac.gov.cn; accessed on 20 March 2024)Airports and air routes in operation in Gansu, 2005, 2010, 2015, and 2020.
Traffic hub cityMinistry of Transport (www.mot.gov.cn; accessed on 20 March 2024)According to the Ministry of Transportation, Lanzhou is the only comprehensive transportation hub and center city in Gansu.
Socioeconomic dataUrban landResource and Environment Science and Data Center (http://www.resdc.cn; accessed on 10 March 2024)LULC raster data were used to calculate the built-up area of each district and county in Gansu for the years 2005, 2010, 2015, and 2020.
Population densityOpen Spatial Demographic Data and Research (https://www.worldpop.org; accessed on 10 March 2024)Population density raster data for 2005, 2010, 2015, and 2020 were publicly available data.
Economic productionGansu Provincial Bureau of Statistics (https://tjj.gansu.gov.cn/; accessed on 10 March 2024)Economic production data were collected from the Gansu Provincial Statistical Yearbook (2006–2021), specifically including input data, output data, and pollutant discharge data in production activities.
Table 2. Model construction and indicator selection for the evaluation of UTSD.
Criterion LayerIndicator LayerSignificanceQuantitative MethodsDescriptionWeight
Urban transport superiority degree (UTSD)QuantityTransportation network densityTransportation network density is the operational length of the network of transportation facilities per unit of land area and is a quantification of the size of the transportation network, reflecting the (short-distance) transportation capacity within each county unit [27]. D i = L i / S i . (1)In Equation (1), D i is the transportation network density value of the study unit i ,   L i is the operational length of roadway facilities in the study unit i , and S i is the land area of the study unit i .0.281
QualityTransportation arterial influence degreeArterial transport is primarily responsible for (long-distance) transport between county units, and the degree of impact of arterial transport reflects the connectivity between units within the larger region. Existing evaluation methods score arterial transportation facilities in terms of their distance to administrative centers. This ignores the actual distribution of population and the scoring method is inevitably subjective [7,50]. In this paper, the weighted average proximity of population raster data and traffic arteries is used to quantify the impact of traffic arteries. This reflects, to some extent, the coupled relationship between the infrastructure layout of traffic arteries and population distribution and helps to understand the impact of traffic arteries more objectively [48,51]. N i = k = 1 n ω j × P i k × D i k j / k = 1 n P i k . (2)In Equation (2), N i represents the impact degree of trunk traffic in county area i ; j includes 6 types of high-speed railway, ordinary railway, airport, highway, national road and provincial road; ω j is the weight of class j traffic facilities, which is taken as 1/6 in this paper. P i k is the population number of population grid cell k in county region i ;   D i k j is the nearest distance of population grid cell k in county i with respect to traffic facilities j ;   n is the number of grids in county i (for high-speed railway, ordinary railway, and airports, the closest distance to the station is used. For other modes, the closest distance to the entrance/exit is used). The closer the distance is, the smaller the value of the population-weighted average traffic proximity and the greater the potential of traffic facilities to produce benefits [20].0.392
SituationRegional accessibilityRegional accessibility is measured by the minimum travel time for each county unit to reach the provincial center city by all modes of land transportation. It reflects the extent to which the unit is radiated by the core city [38]. Land transportation modes are chosen for calculation because there are no navigable rivers in Gansu, air transportation is too costly and has a small capacity, and all types of land transportation are the most dominant modes of travel and transportation (Qin et al., 2022) [52]. C o s t i q = L i q / V q ,   (3)
T i = j = 1 n C o s t i j / N .   (4)
In Equations (3) and (4), T i is the accessibility value of the study unit i ,   L i q denotes the length of the road network of the road type q in the study unit i ,   V q is the average travel speed on the road type q ,   C o s t i q is the average time cost for the road type q in the study unit i , and N is the number of road types. The average speeds on high-speed railroads, railroads, highways, national highways, and provincial highways were set at 250, 120, 100, 80, and 60 km/h, respectively [53].0.327
Table 3. Urban land use efficiency evaluation index system.
Pointer TypeCriterion LayerIndex LayerUnit
Input indexLand investmentConstruction land areakm2
Labor inputNumber of people in the second and third industries10,000 people
Capital investmentInvestment in fixed assets of the second and third industriesMillion Yuan
Energy inputElectricity consumptionMillion kW h
Water consumptionMillion m3
Desirable outputEconomic outputSecondary and tertiary industry value addedMillion Yuan
Tax revenueMillion Yuan
Average employee salaryYuan
Social outputNew residential area10,000 m2
Complete national scientific research projectsNumber
Environmental outputGreen coverage rate of building area%
Undesirable outputEnvironment Undesirable outputSewage discharge10,000 Tons
Industrial exhaust emissions volume10,000 Tons
Industrial dust emissions10,000 Tons
Table 4. Results of the ADF smoothness test.
Time-Series DataADF Statisticsp-ValueThreshold Value
1%5%10%
UTSD−8.79110.0000−3.4505−2.8703−2.5715
ULUE−7.86510.0000−3.4505−2.8703−2.5715
Table 5. Results of the panel Granger causality test.
Null HypothesisLagsF-StatisticsProbEstimate
ULUE does not the Granger cause of UTSD13.43950.0333Rejection
UTSD does not the Granger cause of ULUE16.70180.0014Rejection
Table 6. VIF values for each variable.
Influence FactorsVIF ValueInfluence FactorsVIF ValueInfluence FactorsVIF Value
Transportation network density4.79Electricity consumption15.19Complete national scientific research projects4.43
Transportation arterial influence degree4.13Water consumption13.02Green coverage rate of urban area1.02
Regional accessibility2.61Secondary and tertiary industry value added7.92Sewage discharge1.67
Urban area2.58Tax revenue5.64Industrial exhaust emissions volume3.85
Number of people in the second and third industries3.25Average employee salary1.23Industrial dust emissions2.26
Investment in fixed assets of the second and third industries6.72New residential area2.38
Table 7. Results of the MGTWR model and K-fold model.
Independent VariableBandwidthAICcSigmaSpatiotemporal Distance RatioR2R2 Adjusted E a v g
UTSD0.03865.08540.16620.48310.97730.97690.0830
ULUE0.10336.03340.23290.26870.87500.87440.1229
Disclaimer/Publisher’s Note: The statements, opinions and data contained in all publications are solely those of the individual author(s) and contributor(s) and not of MDPI and/or the editor(s). MDPI and/or the editor(s) disclaim responsibility for any injury to people or property resulting from any ideas, methods, instructions or products referred to in the content.

