Article

Multi-Scenario Simulating the Effects of Land Use Change on Ecosystem Health for Rural Ecological Management in the Zheng–Bian–Luo Rural Area, Central China

1
College of Resources and Environmental Sciences, Henan Agricultural University, Zhengzhou 450046, China
2
Department of Economic Management, North China Electric Power University, Baoding 071003, China
3
Lhasa Plateau Ecosystem Research Station, Key Laboratory of Ecosystem Network Observation and Modeling, Institute of Geographic Sciences and Natural Resources Research, Chinese Academy of Sciences, Beijing 100101, China
*
Author to whom correspondence should be addressed.
Land 2024, 13(11), 1788; https://doi.org/10.3390/land13111788
Submission received: 27 September 2024 / Revised: 25 October 2024 / Accepted: 29 October 2024 / Published: 30 October 2024
(This article belongs to the Section Land Use, Impact Assessment and Sustainability)

Abstract

:
A healthy rural ecosystem ensures a win–win situation for both economic growth and ecological conservation. However, the impact of land use changes at the rural level on ecosystem health remains unclear. This study focuses on the rural scale of Zheng–Bian–Luo, analyzing changes in land use from 2000 to 2020. Using the “Ecosystem Vigor-Organization-Resilience-Services” model, the study evaluates the spatiotemporal patterns of ecosystem health. The Patch-generating Land Use Simulation (PLUS) model was employed to simulate land use and ecosystem health in 2035 under three scenarios: Natural Development (ND), Ecological Protection (EP), and Cropland Protection (CP). The findings are as follows: (1) From 2000 to 2020, the area of cultivated land in Zheng–Bian–Luo rural areas decreased, and the area of forest land first decreased and then increased. (2) During the study period, ecosystem health improved as ecosystem vigor, organization, and services increased. Low-value areas of ecosystem health showed a shrinking trend, most notably in Kaifeng. (3) By 2035, under the EP scenario, forest land increased by 76.794 km2, while it decreased under the CP and ND scenarios. Construction land showed an increasing trend in all three scenarios, with the ND scenario seeing the largest increase of 718.007 km2. (4) In 2035, ecosystem health is projected to decline under the ND scenario due to reduced forest land and increased construction land. The CP scenario showed no significant change in ecosystem health, but the southwestern rural areas of Luoyang improved. The EP scenario saw an overall increase in ecosystem health, highlighting land use optimization as beneficial. Local governments are encouraged to create ecological protection plans balancing ecological and cultivated land protection, focusing on sensitive areas such as the Songshan region and southwestern mountainous areas of Luoyang for coordinated development.

1. Introduction

Rural development plays a vital role in the national economy and the well-being of communities [1]. As economic growth has accelerated, there is a growing concern about the deterioration of the environment and its impact on living conditions in rural areas. In response, policies such as ecological civilization construction and sustainable development strategies have been issued, emphasizing the importance of green development [2]. Consequently, there is now an increased focus on environmental protection and the sustainable use of resources. The need to balance economic development with ecological protection in rural areas has become urgent. Evaluating ecosystem health is recognized as the most direct and effective method to assess the environmental conditions of a region [3]. The concept of ecosystem health has evolved over time, drawing from disciplines such as ecology, economics, and sociology. Initially, the term “health” was limited to humans and animals [4]. However, in the early 1940s, scholars were the first to establish a connection between land and health [4]. In the late 1980s, scholars like Rapport proposed the concept of ecosystem health, defining it as the state, condition, or performance of an ecosystem [5]. They proposed three indicators—vigor, organization, and resilience—as a framework for assessing ecosystem health, establishing the groundwork for future evaluations. Due to differing research interests, scholars have presented varying perspectives on the scope of ecosystem health. In 1982, Schaeffer et al. [6] compared evaluations of human and animal health and suggested that ecosystem health could be measured similarly. They considered an ecosystem to be healthy when its functions do not surpass certain thresholds. Costanza et al. [7] highlighted the interconnectedness between ecosystems and human activities, emphasizing the importance of maintaining their structural and functional integrity to provide stable and sustainable ecosystem services for humans. This integration of ecosystem services into health assessments has become a significant aspect of evaluating ecosystem health. In 2001, Fu et al. [8] developed the VOR theoretical framework, which proposed a comprehensive evaluation framework based on “Vigor-Organization-Resilience-Integration”. In 2002, Xiao et al. [9] developed eight specific indicators based on the systematic principle of the “Vitality-Organization-Resilience-Integration Model”. Subsequent research [10] has continued to expand on the study of ecosystem health, with a particular emphasis on evaluating the health of regional ecosystems in detail.
The examination of spatiotemporal characteristics related to ecosystem health frequently employs methods involving indicator species or a comprehensive index [11]. Two primary models are commonly used: the “Pressure-State-Response” (PSR) model and the “Vigor-Organization-Resilience” (VOR) model. The PSR model illustrates the causal relationships between human activities and ecosystems, focusing on three dimensions: pressure, state, and response. For example, Huo et al. [12] utilized the PSR model to establish ten evaluation indicators for assessing the ecological health of Beijing’s northwest ecological conservation area and proposed sustainable development strategies. The VOR model assesses ecosystem health through the quantitative analysis of natural ecosystems, often neglecting human factors. For example, Zhou et al. [13] applied the VOR model to evaluate the health of the Three Gorges Reservoir ecosystem between 2010 and 2020. Some studies incorporate the Integrated Valuation of Ecosystem Services and Trade-offs (InVEST) model, which integrates ecosystem services to enhance ecosystem integrity [14,15,16,17]. Given the diverse range of research fields, scholars have extended these fundamental models in various ways. For instance, Yuan et al. [18] combined the VOR model with the improved value equivalent method to analyze the ecosystem health of Guangzhou from 2000 to 2015, utilizing a “Vigor-Organization-Resilience-Contribution” framework. Li et al. [19] integrated the PSR and VOR models to construct a P-S(VOR)-R framework for assessing the ecosystem health of the Yangtze River’s riparian zones in Jiangsu Province. Research in ecosystem health includes various ecosystems, such as bays [20], watersheds [21,22,23,24], lakes [25], cities [26,27,28], wetlands [29,30,31,32], grasslands [33,34,35,36], and ecologically fragile zones [37]. These studies often utilize county-level administrative units [38,39] or more precise spatial grids for analysis [40].
The investigation into the assessment of rural ecosystem health is progressing, with the development of various research frameworks that provide substantial support for the preservation of rural ecology and the promotion of sustainable development. Brisbois et al. [41] assessed the effects of various rural land use patterns on the health of river ecosystems within the Thomas Brook watershed, an agricultural catchment area. Connell [42] established a research framework aimed at facilitating the integrated advancement of rural ecosystem health and the well-being of livelihoods. Javaid et al. [43] utilized physical and chemical parameters to evaluate wetland ecosystem health in urban and rural settings within the high-altitude Kashmir Himalayan ecoregion. Their findings indicated that changes in land use within the direct catchment area of the wetland were the primary driving factor contributing to the decline in wetland ecosystem health. Xu et al. [44] focused on the rural areas surrounding the Qinling Mountains in Shaanxi Province and developed an ecosystem evaluation system that integrates resources, the environment, society, and the economy to examine the health status and spatial heterogeneity of rural ecosystems at the county level. Xiao et al. [45] assessed ecosystem health in the mountainous regions of southwest China using the PSR framework and found that ecosystem health in numerous rural areas has shown improvement. Migration in rural areas has significantly contributed to enhancing the health of local ecosystems by alleviating the pressure associated with human activities. Peng et al. [46] utilized the normalized difference vegetation index, landscape indicators, and ecosystem resilience coefficients to evaluate ecosystem health in Lijiang City and quantitatively identified the impact of rural land use changes on ecosystem health. Liu et al. [47] developed an enhanced framework for evaluating rural ecosystem health that integrates ecological integrity with ecosystem supply and demand. Using Chongqing as a case study, this framework quantitatively elucidated the spatiotemporal heterogeneity of rural ecosystem health. The aforementioned research on rural ecosystem health contributes to our understanding of the status, changes, and influencing factors of rural ecosystems. However, due to a lack of data on rural units, most studies are still conducted at the county or town level. Different evaluation units yield diverse results in terms of ecosystem health [48]. For example, Liu et al. [49] discovered that assessments of ecosystem health at a larger scale tend to be more balanced, while assessments at a smaller scale are more sensitive to changes in clustering. This finding is based on their analysis of the dependency of ecosystem health across different scales in 11 cities along China’s East Sea coast between 1990 and 2015. Consequently, the health status of ecosystems at the rural scale still requires further investigation.
With the advancement of socio-economic development, there is a continuous evolution in land use patterns, resulting in increased strain on ecosystems. Despite the significance of understanding and predicting ecosystem health levels, limited research has been conducted in this area. Most studies have focused on forecasting future land use changes, assessing ecosystem service levels, identifying areas vulnerable to ecological risks, and providing scientific support for decision-making, ecological protection, and management. Several commonly used models for simulating and predicting land use changes [50] include Spatially Explicit Urban Theory for Land Use Simulation and Prediction (SLEUTH), Coastal Louisiana Urban and Rural Land Use and Land Cover Change Simulation Model (CLUE-S), Cellular Automata Markov Chain Model (CA-Markov), GeoSOS (Geographically Explicit Spatial Simulation System), Fourier-Transformed Land Use Simulation (FLUS), Land Use Simulation and Development (LUSD), and Patch-generating Land Use Simulation (PLUS). The CA-Markov model is easy to operate and comprehend, making it suitable for predicting land use change trends in large areas, although it overlooks the impact of spatial distribution on land use changes. The PLUS model seamlessly integrates the advantages of both Markov chain and CA models, considering both temporal and spatial factors for comprehensive land use predictions. It rectifies deficiencies in rule strategies for conversion and landscape dynamic simulations, making it suitable for long-term and multi-scenario land use predictions. For example, Yang et al. [51], Shi et al. [52], and Lou et al. [53] applied the PLUS model and equivalent factor method to assess ecosystem service values in urban areas and watersheds. Their studies aimed to predict the potential impacts of future land use changes on these services. Wang et al. [54] utilized the PLUS and InVEST models to investigate the influence of land use change on water conservation in the Min Triangle urban agglomeration. Additionally, Liu et al. [55], Li et al. [56], and Zhao et al. [57] conducted spatiotemporal evolution and multi-scenario analyses of carbon storage in the Loess Plateau, Liaoning Province, and Tibetan Plateau, employing the PLUS and InVEST models.
Extensive research has been conducted on methods and indicators for evaluating ecosystem health by both domestic and international scholars, yielding significant results. However, according to prior studies concerning ecosystem health, there remain two significant research gaps. First, while certain research efforts have concentrated on the health of rural ecosystems, the scope of these investigations is frequently limited to the county or township units [44,45,47]. The evaluation of ecosystem health within rural units still requires further exploration. Second, some studies that utilize scenario simulations for predictive analysis predominantly concentrate on the interplay between alterations in land use and the provision of ecosystem services. Ecosystem health includes integrated ecosystem organization, vigor, resilience, and services. A remarkable correlation exists between alterations in land use and rural ecosystem health, and effective land use management is crucial for maintaining the ongoing health of rural ecosystems. Therefore, multi-scenario simulations of the impacts of land use change on rural ecosystem health are both lacking and urgently needed for effective rural ecological management.
The Zheng–Bian–Luo area, situated in central China and spanning the entire Henan Province, possesses a complex terrain and stands as one of the most economically developed regions in the province. The region makes significant contributions to grain production and plays a crucial role in ensuring national food security. However, the cultivated land, wetlands, and nature reserves within the Yellow River embankment of Zheng–Bian–Luo area overlap, leading to conflicts between land use and ecological protection. Furthermore, affected by factors such as regional population growth, urbanization, and economic development, the ecological environment and land use in the Zheng–Bian–Luo villages have undergone significant changes. For instance, the rapid advancement of urbanization has resulted in the contraction of rural areas surrounding cities. The rising demand for agricultural irrigation and industrial water has contributed to a depletion of water resources. Rural areas are confronted with various challenges regarding ecosystem health, and it is crucial to clarify the effects of land use change on ecosystem health. There are notable disparities in the levels of rural economic development and ecological conditions within the region. Consequently, the selection of the Zheng–Bian–Luo rural areas is both comprehensive and representative. This study analyzes the spatiotemporal patterns of ecosystem health in the Zheng–Bian–Luo rural area from 2000 to 2020, utilizing villages as the fundamental evaluation units. By collecting and integrating data from multiple sources regarding land use, socio-economics, and other factors, the study aims to uncover the spatial differentiation characteristics and temporal evolution trends of ecosystem health in the Zheng–Bian–Luo rural area. Furthermore, it evaluates the level of ecosystem health and simulates the development of rural ecosystem health under different scenarios. The findings are expected to advance regional integration, guide rural policy-making in Henan Province, and contribute to rural revitalization.

2. Materials and Methods

2.1. Study Area

Zheng–Bian–Luo region encompasses the three cities of Zhengzhou, Luoyang, and Kaifeng. Luoyang, Zhengzhou, and Kaifeng are situated in the western, central, and eastern parts of Henan Province, respectively, including the entire province. The region, located in the middle and lower reaches of the Yellow River, comprises mountainous and hilly areas to the west and north of Luoyang and the border area between Zhengzhou and Luoyang, with predominantly flat areas elsewhere. The average annual precipitation is approximately 600 mm, which is suitable for various crops. It shares borders with Shangqiu to the east and Nanyang, Pingdingshan, Xuchang, and Zhoukou to the south. To the west, it is bordered by Sanmenxia, and across the Yellow River, it is connected to Jiyuan, Xinxiang, and Jiaozuo to the north. The region spans about 367 km from east to west and 182 km from north to south, with a total area of approximately 29,018 km2 (Figure 1).
Luoyang governs 8 districts and 7 counties, while Zhengzhou governs 6 districts, 5 cities, and 1 county. Kaifeng, on the other hand, administers 5 districts and 4 counties. According to the seventh national census, the urbanization rates in Zhengzhou, Luoyang, and Kaifeng are 78.40%, 51.83%, and 64.98%, respectively. As of the end of 2020, the total output values of the primary industry in these cities were 15.687 billion CNY, 36.362 billion CNY, and 25.413 billion CNY, respectively, solidifying the area as the core region of the Central Plains urban agglomeration. Rural development in this region is heterogeneous, with a complex ecosystem structure, making it an ideal and representative region for comprehensive study. The Yellow River flows through the Zheng–Bian–Luo region, enriching the area with abundant water resources. The rural ecosystem in the region is characterized by a rich diversity of plant life, encompassing both food crops and cash crops, as well as native vegetation. In recent years, human activities have significantly impacted rural ecosystems, resulting in several challenges. One major issue is the excessive use of water resources for agricultural production, which has led to water shortages. Additionally, the application of fertilizers and pesticides in agriculture has adversely affected local water quality. Concurrently, local governments and rural communities have increasingly recognized the importance of rural ecosystem initiatives. They have actively promoted afforestation and ecological restoration projects designed to restore ecological balance.

2.2. Data Sources and Processing
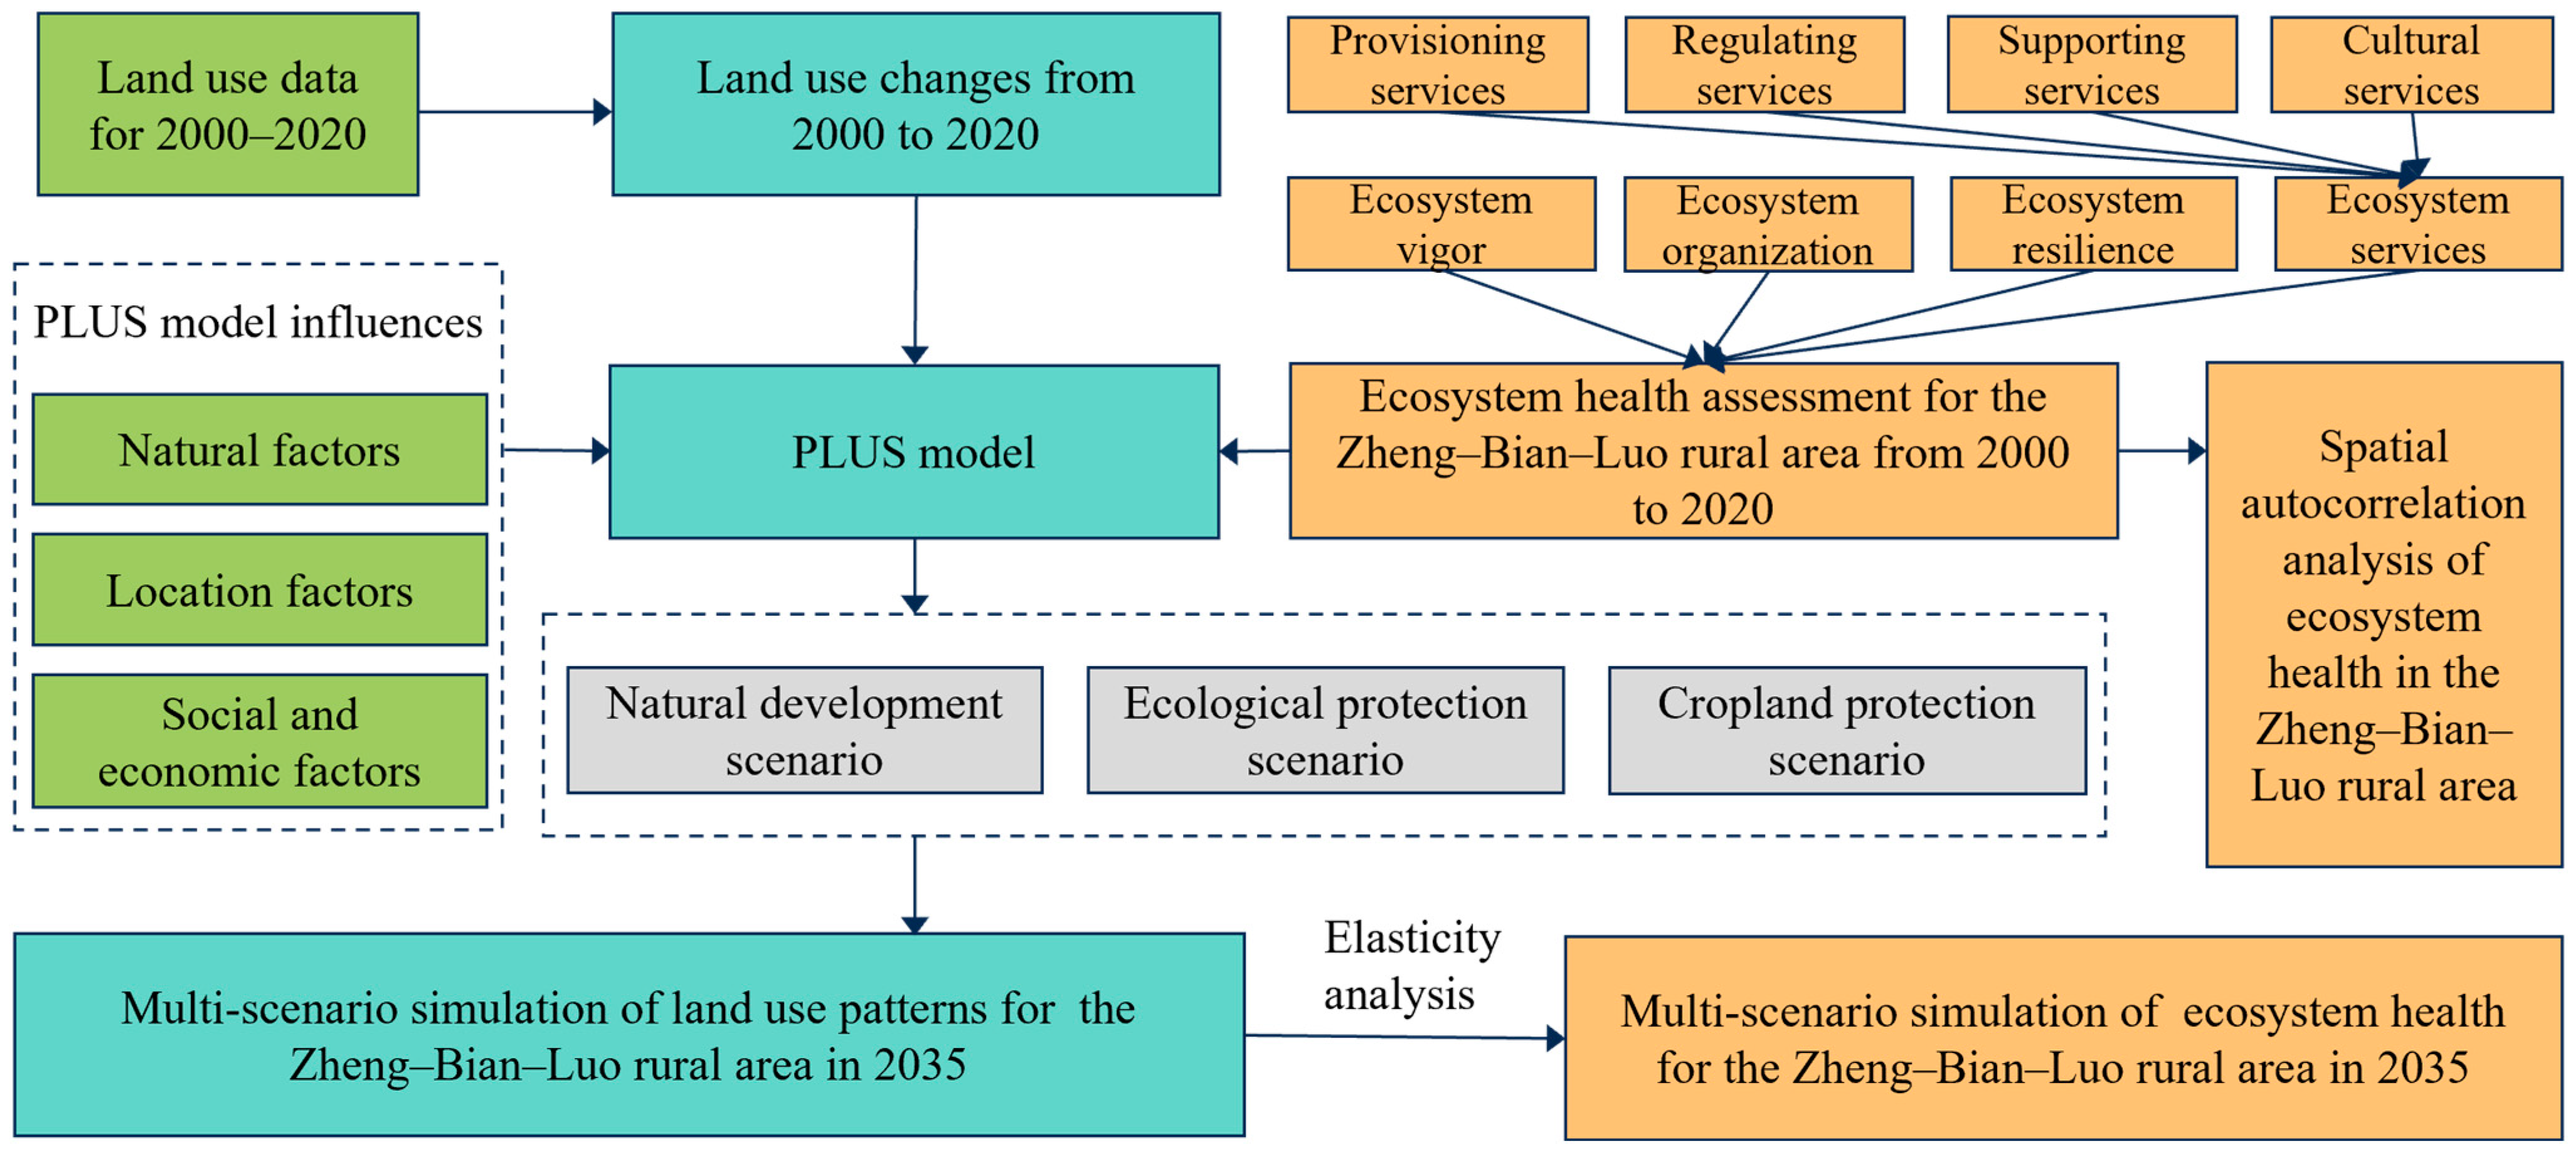
The data utilized for this study comprise Land Use/Land Cover Change (LUCC) remote sensing monitoring data with a 30 m spatial resolution in 2000, 2005, 2010, 2015, and 2020, Digital Elevation Model (DEM) data, socio-economic data including population statistics, food production data, meteorological data, Normalized Difference Vegetation Index (NDVI) data, population and GDP raster data, as well as road data. To conduct a targeted investigation on the ecosystem health of rural areas in Zhengzhou, Kaifeng, and Luoyang, we referenced the methodology described by Zhang et al. [58] and adhered to the Regulations on Statistical Area Codes and Urban–Rural Classification Codes. We retrieved the 2020 urban–rural classification codes for the administrative regions of Zhengzhou, Kaifeng, and Luoyang from the website of the National Bureau of Statistics, selecting rural areas. These regions were identified and validated in ArcGIS 10.8.1 software, outlining the corresponding rural areas of Zhengzhou, Kaifeng, and Luoyang. Additionally, using ArcGIS 10.8.1, we standardized the projection coordinate system to Krasovsky_1940_Albers, ensured a uniform pixel size, and binarized the transformation zones for PLUS data input with consistent row and column numbers. The specific sources and applications of the data are presented in Table 1.

2.3. Studying Route

The focus of this study is on the assessment and prediction of ecosystem health based on land use changes. To accomplish this, we have developed an indicator system based on the “Ecosystem Vigor-Organization-Resilience-Services” (EVORS) assessment framework. By applying this framework, we calculate the ecosystem vigor, organization, resilience, services, and overall health for the years 2000–2020. Furthermore, Geoda 1.14.0.0 software is employed to determine spatial clustering patterns. As part of our methodology, we employ the PLUS model to establish three development scenarios. Following the validation of the simulated land use situation for 2020, we proceed to simulate land use for 2035 and predict ecosystem health under the three scenarios using resilience formulas. The technical route of our analysis is presented in Figure 2.

2.4. Ecosystem Health Assessment

A healthy ecosystem primarily concerns the integrity and sustainability of the natural environment. Furthermore, it is essential for a healthy ecosystem to sustainably deliver a range of valuable ecosystem services to human society. Consequently, this study evaluates ecosystem health from four aspects: vigor, organization, resilience, and services. The geographical focus of the ecosystem health assessment is the Zheng–Bian–Luo rural area, as illustrated in Figure 1. In the assessment process, this study initially evaluated ecosystem health at a 1 km grid scale. Subsequently, the ecosystem health values were aggregated based on village units, standardized, and used to derive the relative levels of ecosystem health. The ecosystem health index formula is as follows:
E H I i = V i · O i · R i · E S I i 4
where EHi represents the ecosystem health value of the i-th ecosystem unit, Vi denotes the ecosystem vigor of the i-th ecosystem unit, Oi stands for the ecosystem organization of the i-th ecosystem unit, Ri signifies the ecosystem resilience of the i-th ecosystem unit, and ESIi refers to the ecosystem services index of the i-th ecosystem unit.
The normalized formula for assessing ecosystem health indices is presented as follows:
x s = x i x min x max x min
where xs denotes the normalized value of the ecosystem health at the village units, xi represents the ecosystem health value at the i-th village units, xmin indicates the minimum value of ecosystem health, and xmax signifies the maximum value of ecosystem health.
Ecosystem vigor characterizes the metabolic activity or primary productivity within the ecosystem. Net Primary Productivity (NPP) refers to the total quantity of organic matter that green plants accumulate via the process of photosynthesis, measured per unit of time and area. NPP represents the total energy supplied by primary producers to other elements within the ecosystem and serves as a fundamental basis for ecological functions. In this study, we adopt the NPP method to assess the ecosystem vigor of the study area, following the calculations by Zhu et al. [61]. In the assessment process, we initially evaluated NPP at a 1 km grid scale utilizing rasterized remote sensing data in conjunction with meteorological data. Subsequently, the NPP values were aggregated and standardized at the village unit level. The ecosystem vigor of the Zheng–Bian–Luo rural areas was calculated based on the standardized NPP values of these rural units.
Ecosystem organization refers to the stability of the ecosystem, which is evaluated through landscape heterogeneity and landscape connectivity at the village unit level. Landscape heterogeneity is quantified using the Shannon Evenness Index (SEI) and the Mean Patch Fractal Dimension (MPFD). Landscape connectivity is calculated by assessing the connectivity of rural landscape units and the connectivity of patches that serve important ecological functions. The specific calculation formula for landscape organization is referenced in [21]. The calculations of SEI, MPFD, and landscape connectivity at the village unit level are conducted using Fragstats 4.2 software.
Ecosystem resilience indicates the ability of the regional ecosystem structure and function to recover to their original state after natural and human disturbances. It manifests in two aspects: the first is the ability to resist external interference, which helps avoid destruction through self-regulation to maintain structural and functional stability; the second is the ecosystem’s capacity to restore its original state after experiencing significant damage. These two aspects can be quantified using the resistance coefficient and the recovery coefficient [62,63], which are closely related to the land use type. According to the results from similar areas [21], the ecosystem resilience coefficients for cultivated land, woodland, grassland, water, unused land, and construction land are 0.47, 0.85, 0.73, 0.77, 0.44, and 0.27, respectively. In the assessment process, we initially spatialized ecosystem resilience coefficients at a 1 km grid scale. Subsequently, the ecosystem resilience level of the Zheng–Bian–Luo rural areas was calculated at the village unit using the zonal statistics tools.
Based on the Millennium Ecosystem Assessment, ecosystem services are categorized into provisioning services, regulating services, supporting services, and cultural services. Taking into account the practicality of the methodology, the significance of ecosystem services, and the local physical geographical characteristics, this study identifies seven particular ecosystem services for examination (Table 2). Ecosystem services were assessed in terms of food supply, water yield, carbon storage, soil retention, water purification, habitat quality, and cultural services using the InVEST 3.10.2 model [64] and other methods. The calculation methods can be found in Table 2.
After evaluating seven ecosystem services, the ecosystem services values were aggregated and standardized at the village unit level. The method of ecosystem service standardization was the same as ecosystem health. The comprehensive level of ecosystem services in Zheng–Bian–Luo is measured using the following formula:
E S I = 1 n i = 1 n E S I i
where ESI is the ecosystem services index, n is the number of ecosystem service types (n = 7), and ESIi is the standardized value for ecosystem service type i.

2.5. Ecosystem Health Simulation Under Multiple Scenarios

2.5.1. The PLUS Model

Research results of Zhou et al. [67], Wang et al. [68], Allan et al. [69], and Liu et al. [70] indicated that alterations in land use are influenced by a confluence of various factors, including the natural environment and socio-economic conditions, and locational conditions. Taking into account the principles of accessibility, quantifiability, and regional differentiation of driving factors, and the actual conditions of the study area, and drawing on existing studies on land use simulation in Beijing [71], Fuzhou [72], the Northern Slope of Tianshan Mountain [73], and Hunan Province [74], we have identified and selected 19 driving factors of land use from three dimensions: natural factors, locational conditions, and socio-economic factors. These factors include elevation, slope, aspect, temperature, rainfall, distances to various levels of government and village settlements, as well as proximity to railways, highways, national roads, and water bodies. Additionally, population density and GDP were considered (Figure 3). Policy factors also play a significant role in influencing land use changes. However, given the challenge of quantifying these factors, they have been incorporated as scenario standards and constraints in the simulation. Land serves as the spatial foundation for human production and life, and changes in land use are influenced by national and local ecological, social, and economic policies. The Zheng–Bian–Luo rural area has made significant contributions to regional grain production and plays a crucial role in ensuring national food security, making farmland protection essential. Most of the study area is located in the middle reaches of the Yellow River. Given the policy context of ecological protection and high-quality development in the Yellow River Basin, ecological preservation is particularly vital. In summary, this paper presents three scenarios: natural development, ecological protection, and farmland protection (Table 3).

2.5.2. Accuracy Verification

The PLUS model is a novel land use simulation model that combines the traditional CA model with the land expansion analysis strategy (LEAS) and a CA model based on multi-type random patch seeds (CARS). The neighborhood weight serves as a crucial indicator for measuring the difficulty of land use expansion between different land use types [77].
Simulation accuracy is typically assessed using the Kappa coefficient and Figure of Merit (FoM) coefficient. A Kappa coefficient greater than 0.75 indicates good simulation results. The FoM coefficient quantitatively evaluates accuracy at the cellular level, with higher values indicating higher accuracy, typically ranging between 0.01 and 0.25. The formula for calculating FoM is as follows:
F O M = B A + B + C + D
where A represents the area where land use actually changed but was predicted as unchanged, leading to an error. B represents the accurately predicted area. C represents the error area caused by incorrect predictions. D represents the area where land use did not actually change, but the prediction showed a change, leading to an error.
The simulation phase parameters are set as follows: 20 decision trees, a sampling rate of 0.01, and 19 training features. These settings are applied to assess the development potential of different land use types and the impact of driving factors on land use expansion over the specified period. In the CARS module, parameters are set in conjunction with automatically generated random patches. The new patch decay threshold is set to the default value of 0.5, the patch expansion coefficient is set to 0.1, and the seed percentage is set to 0.01. The neighborhood weights are determined by calculating the expansion area ratio of each land use type based on land use data from 2005 to 2020. The cost matrix reflects the difficulty and tendency of mutual conversion between different land types, with 0 indicating no conversion allowed and 1 indicating conversion allowed, based on different scenario conversion principles and related research.
Table 4 presents a comparison between the simulated 2020 land use results and the actual 2020 land use status. The largest discrepancy in the simulated land use type was observed for cultivated land, with an error rate of only 1.053%. Conversely, water, construction land, and unused land demonstrated the highest accuracy, with simulation errors not exceeding 0.500%. The accuracy verification results revealed a Kappa coefficient of 0.777, an FoM coefficient of 0.122, and an overall simulation accuracy of 0.864. These findings indicate that the PLUS model demonstrates high accuracy in simulation and effectively predicts the 2035 land use status in the rural Zheng–Bian–Luo area.

2.5.3. Simulation of Ecosystem Health Under Multiple Scenarios

Elasticity is an indicator of the responsiveness of one variable to another variable [78,79]. Using the elasticity formula and the ecosystem health values from 2005 to 2020, along with the 2035 land use simulation data, we simulate the multi-scenario development of ecosystem health in Zheng–Bian–Luo for 2035. The specific formula is as follows:
E E T = | E H I j E H I i E H I i × 1 T × 100 % L T P |
L T P = | n = 1 n D L C A i n = 1 n L C A i × 1 T × 100 % |
where EET is the ecosystem health response elasticity to land use change, EHIi and EHIj stand the ecosystem health index in year i and year j, respectively; LTP denotes the land transition proportion, ΔLCAi refers the conversion area of land use type i, and LCAi signifies the area of land use type i.

3. Results

3.1. Land Use Changes in Zheng–Bian–Luo Rural Area

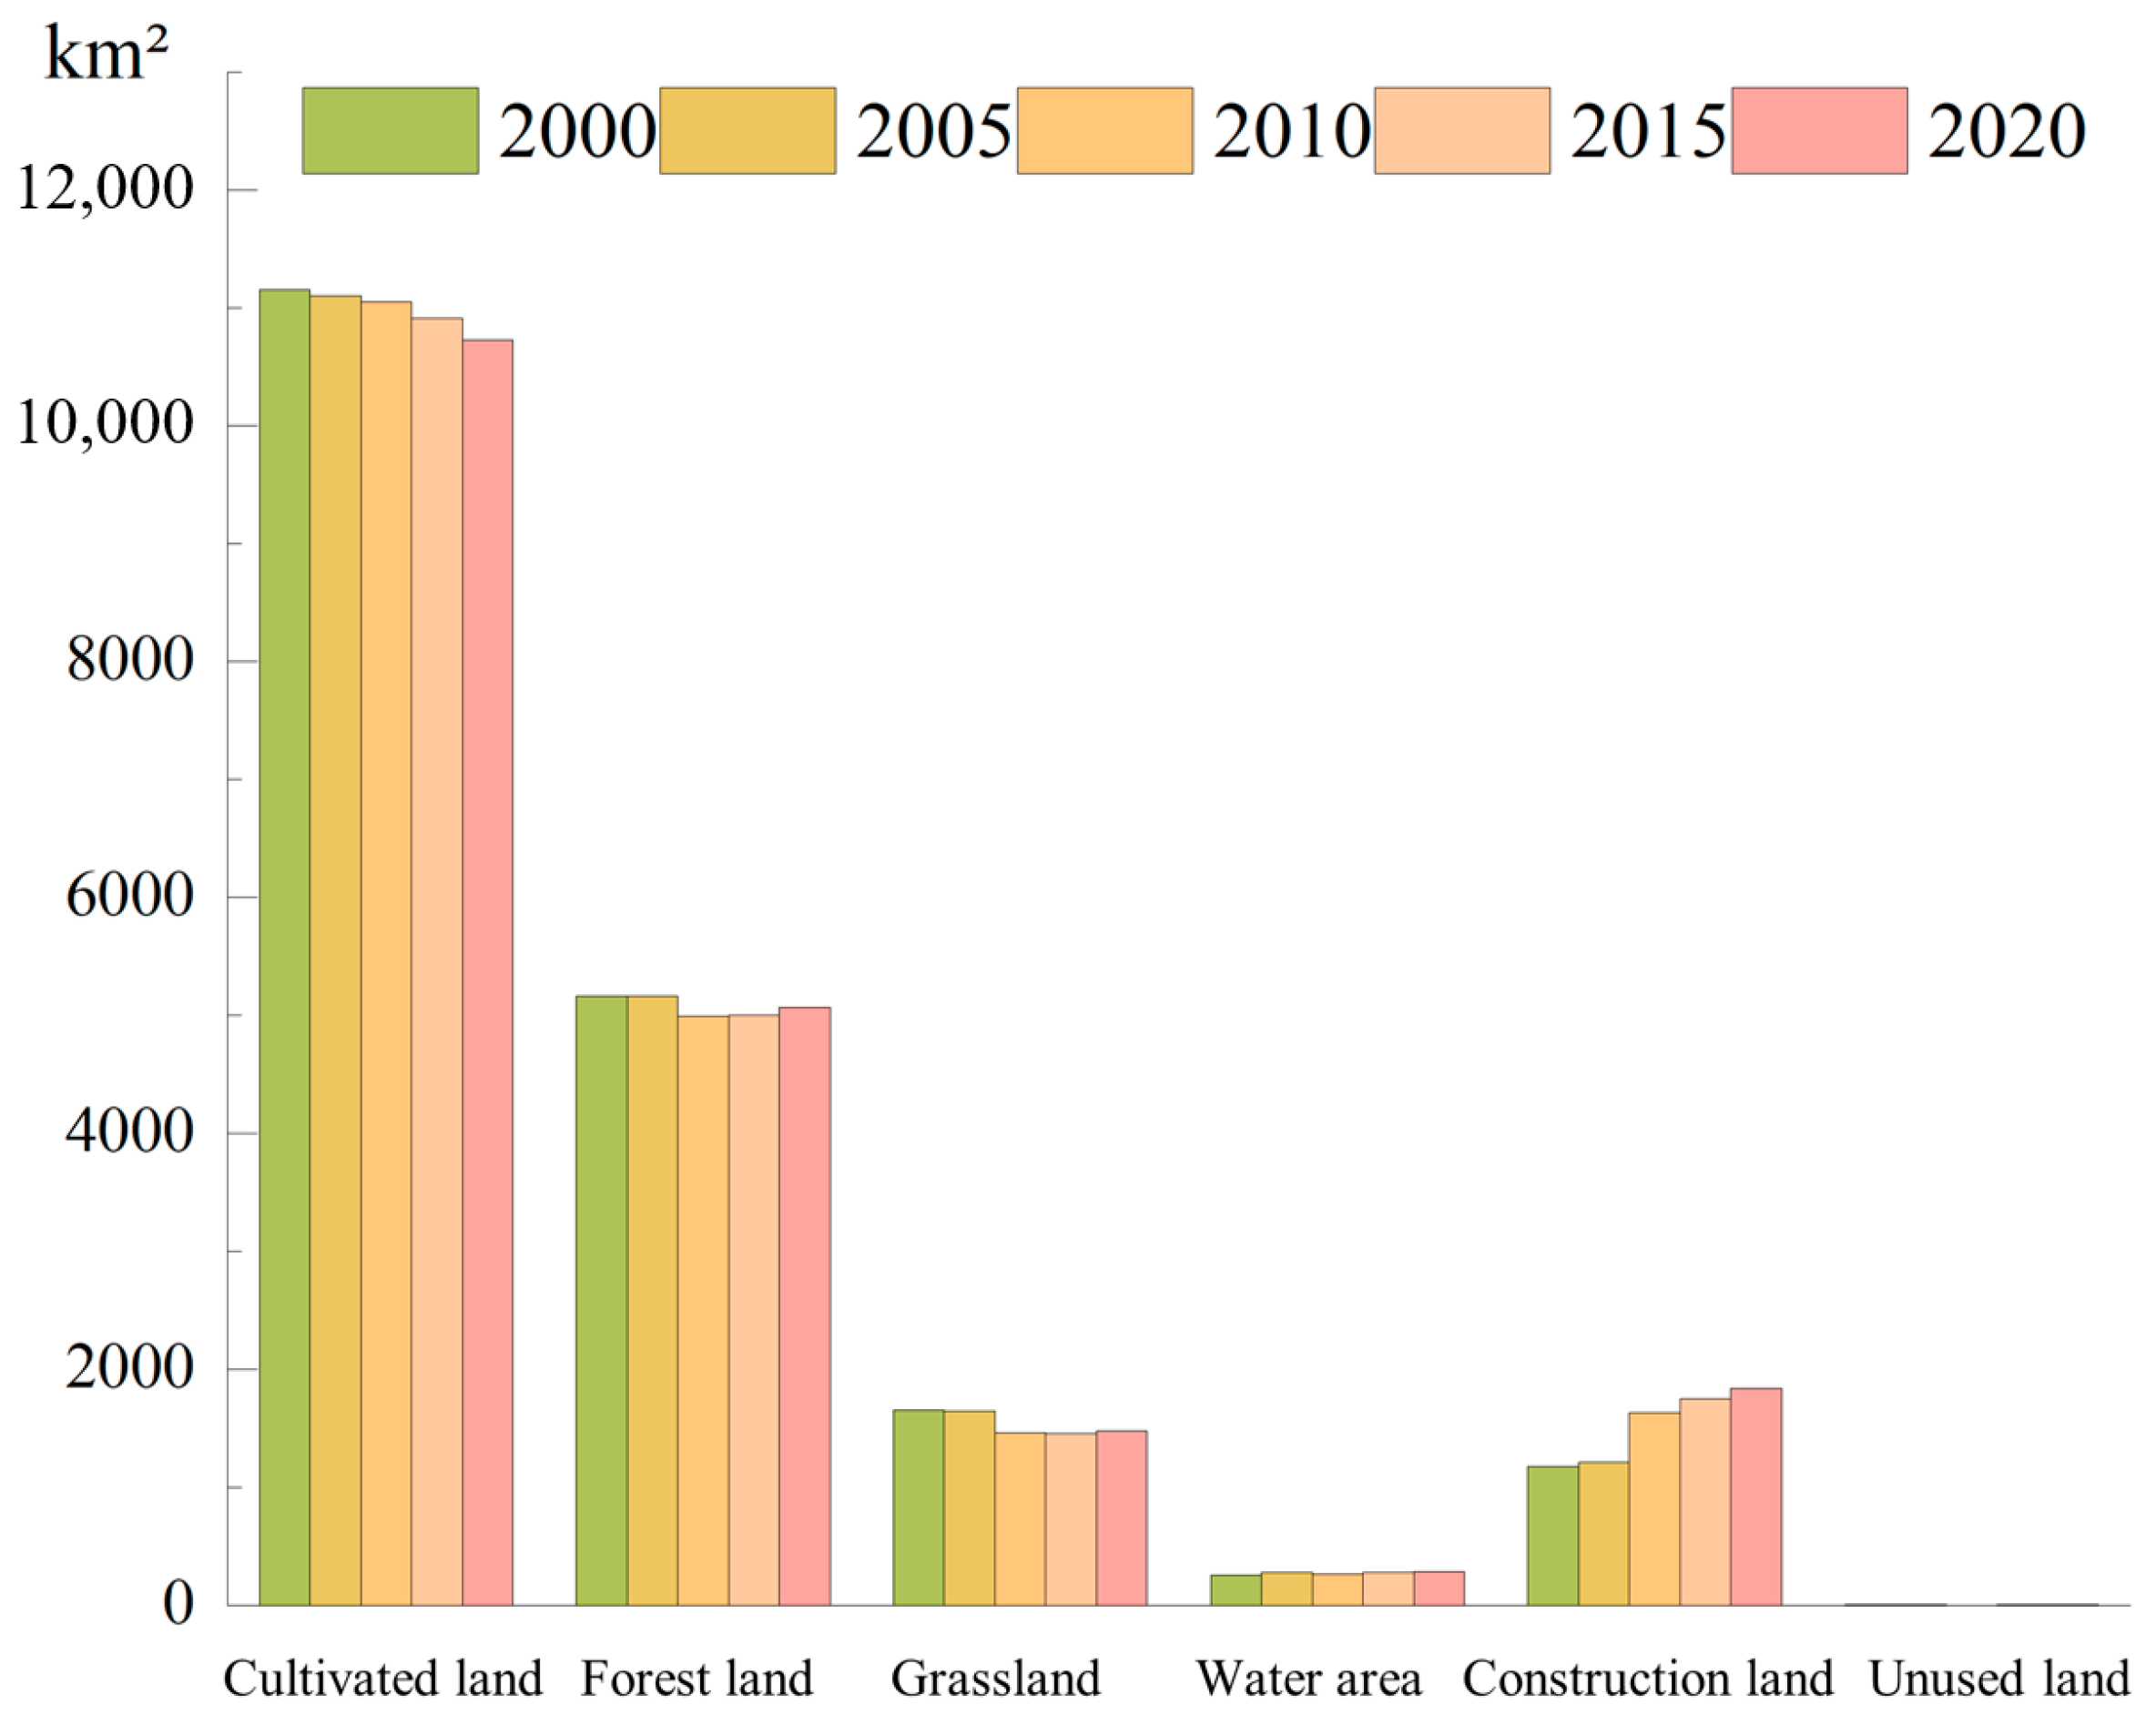
3.1.1. Land Use Area Changes

From Figure 4, the land use type area changes in the rural areas of Zheng–Bian–Luo from 2000 to 2020 demonstrate a gradual decline in cultivated land and a notable increase in construction land. Forest and grassland areas experience fluctuations but show an overall decreasing trend, while water bodies remain relatively stable. The analysis excludes the small area of unused land due to its insignificant trend. During the specified timeframe, the cultivated land area decreased by 421.11 km2, forest land decreased by 95.18 km2, grassland decreased by 172.34 km2, water bodies increased by 27.65 km2, construction land increased significantly, reaching 663.02 km2, and unused land decreased by 2.03 km2. Over four-time intervals, from 2005 to 2010, the forest area experienced the greatest reduction of 162.12 km2, which is approximately 1.75 times greater than the reduction over the entire 20-year period. Similarly, the grassland area also significantly decreased by 188.56 km2, representing approximately 1.10 times the overall reduction in grassland. In this period, construction land witnessed the most substantial increase, expanding by 415.85 km2, accounting for 62.72% of the total increment in construction land. Hence, it can be concluded that during this five-year period, the reduction in forest and grassland areas primarily facilitated the development of construction land to drive economic growth. Overall, although the cultivated land and forest land experienced some decline throughout the study period, the changes were not substantial. This result can be attributed to the robust policies implemented by the local government to safeguard cultivated and forest land. However, with continuous socio-economic development and accelerated urbanization, the central urban areas expanded rapidly, resulting in a significant surge in urban land utilization. Additionally, with the dynamic growth of tourism in Zhengzhou, Kaifeng, and Luoyang, regional tourist destinations experienced rapid expansion, leading to a considerable increase in land allocated for scenic facilities. Consequently, this amplified the demand for construction land.

3.1.2. Dynamic Characteristics of Land Use

Table 5 presents the dynamic degree of land use types in the Zheng–Bian–Luo rural area from 2000 to 2020. The most notable increase occurred in construction land, whereas unused land and grassland experienced the largest decreases. The land use types, ranked according to their change rates from highest to lowest, are as follows: construction land (2.83%) > water bodies (0.54%) > forest land (−0.09%) > cultivated land (−0.19%) > grassland (−0.52%) > unused land (−1.70%). With the exception of construction land, which consistently displayed a positive dynamic degree, and cultivated land, which consistently displayed a negative dynamic degree, indicating continuous growth and decline, respectively, the other land use types exhibited fluctuating changes. This suggests that during the study period, the area occupied by construction land consistently expanded while cultivated land consistently decreased. Forest land exhibited the smallest dynamic degree, with minimal variations of −0.02%, −0.63%, 0.02%, and 0.27%, making it the most stable land use type. During the four study periods, the most dynamic changes in land use occurred from 2005 to 2010. Forest land, grassland, water, and construction land exhibited dynamic changes of −0.63%, −2.29%, −1.21%, and 6.86%, respectively, significantly higher than other periods. Unused land showed the highest dynamics during 2010–2015, while cultivated land exhibited the highest dynamics during 2015–2020. During this period, forest land, grassland, and water bodies all exhibited positive growth, which suggests a relative balance between ecological protection and economic development.

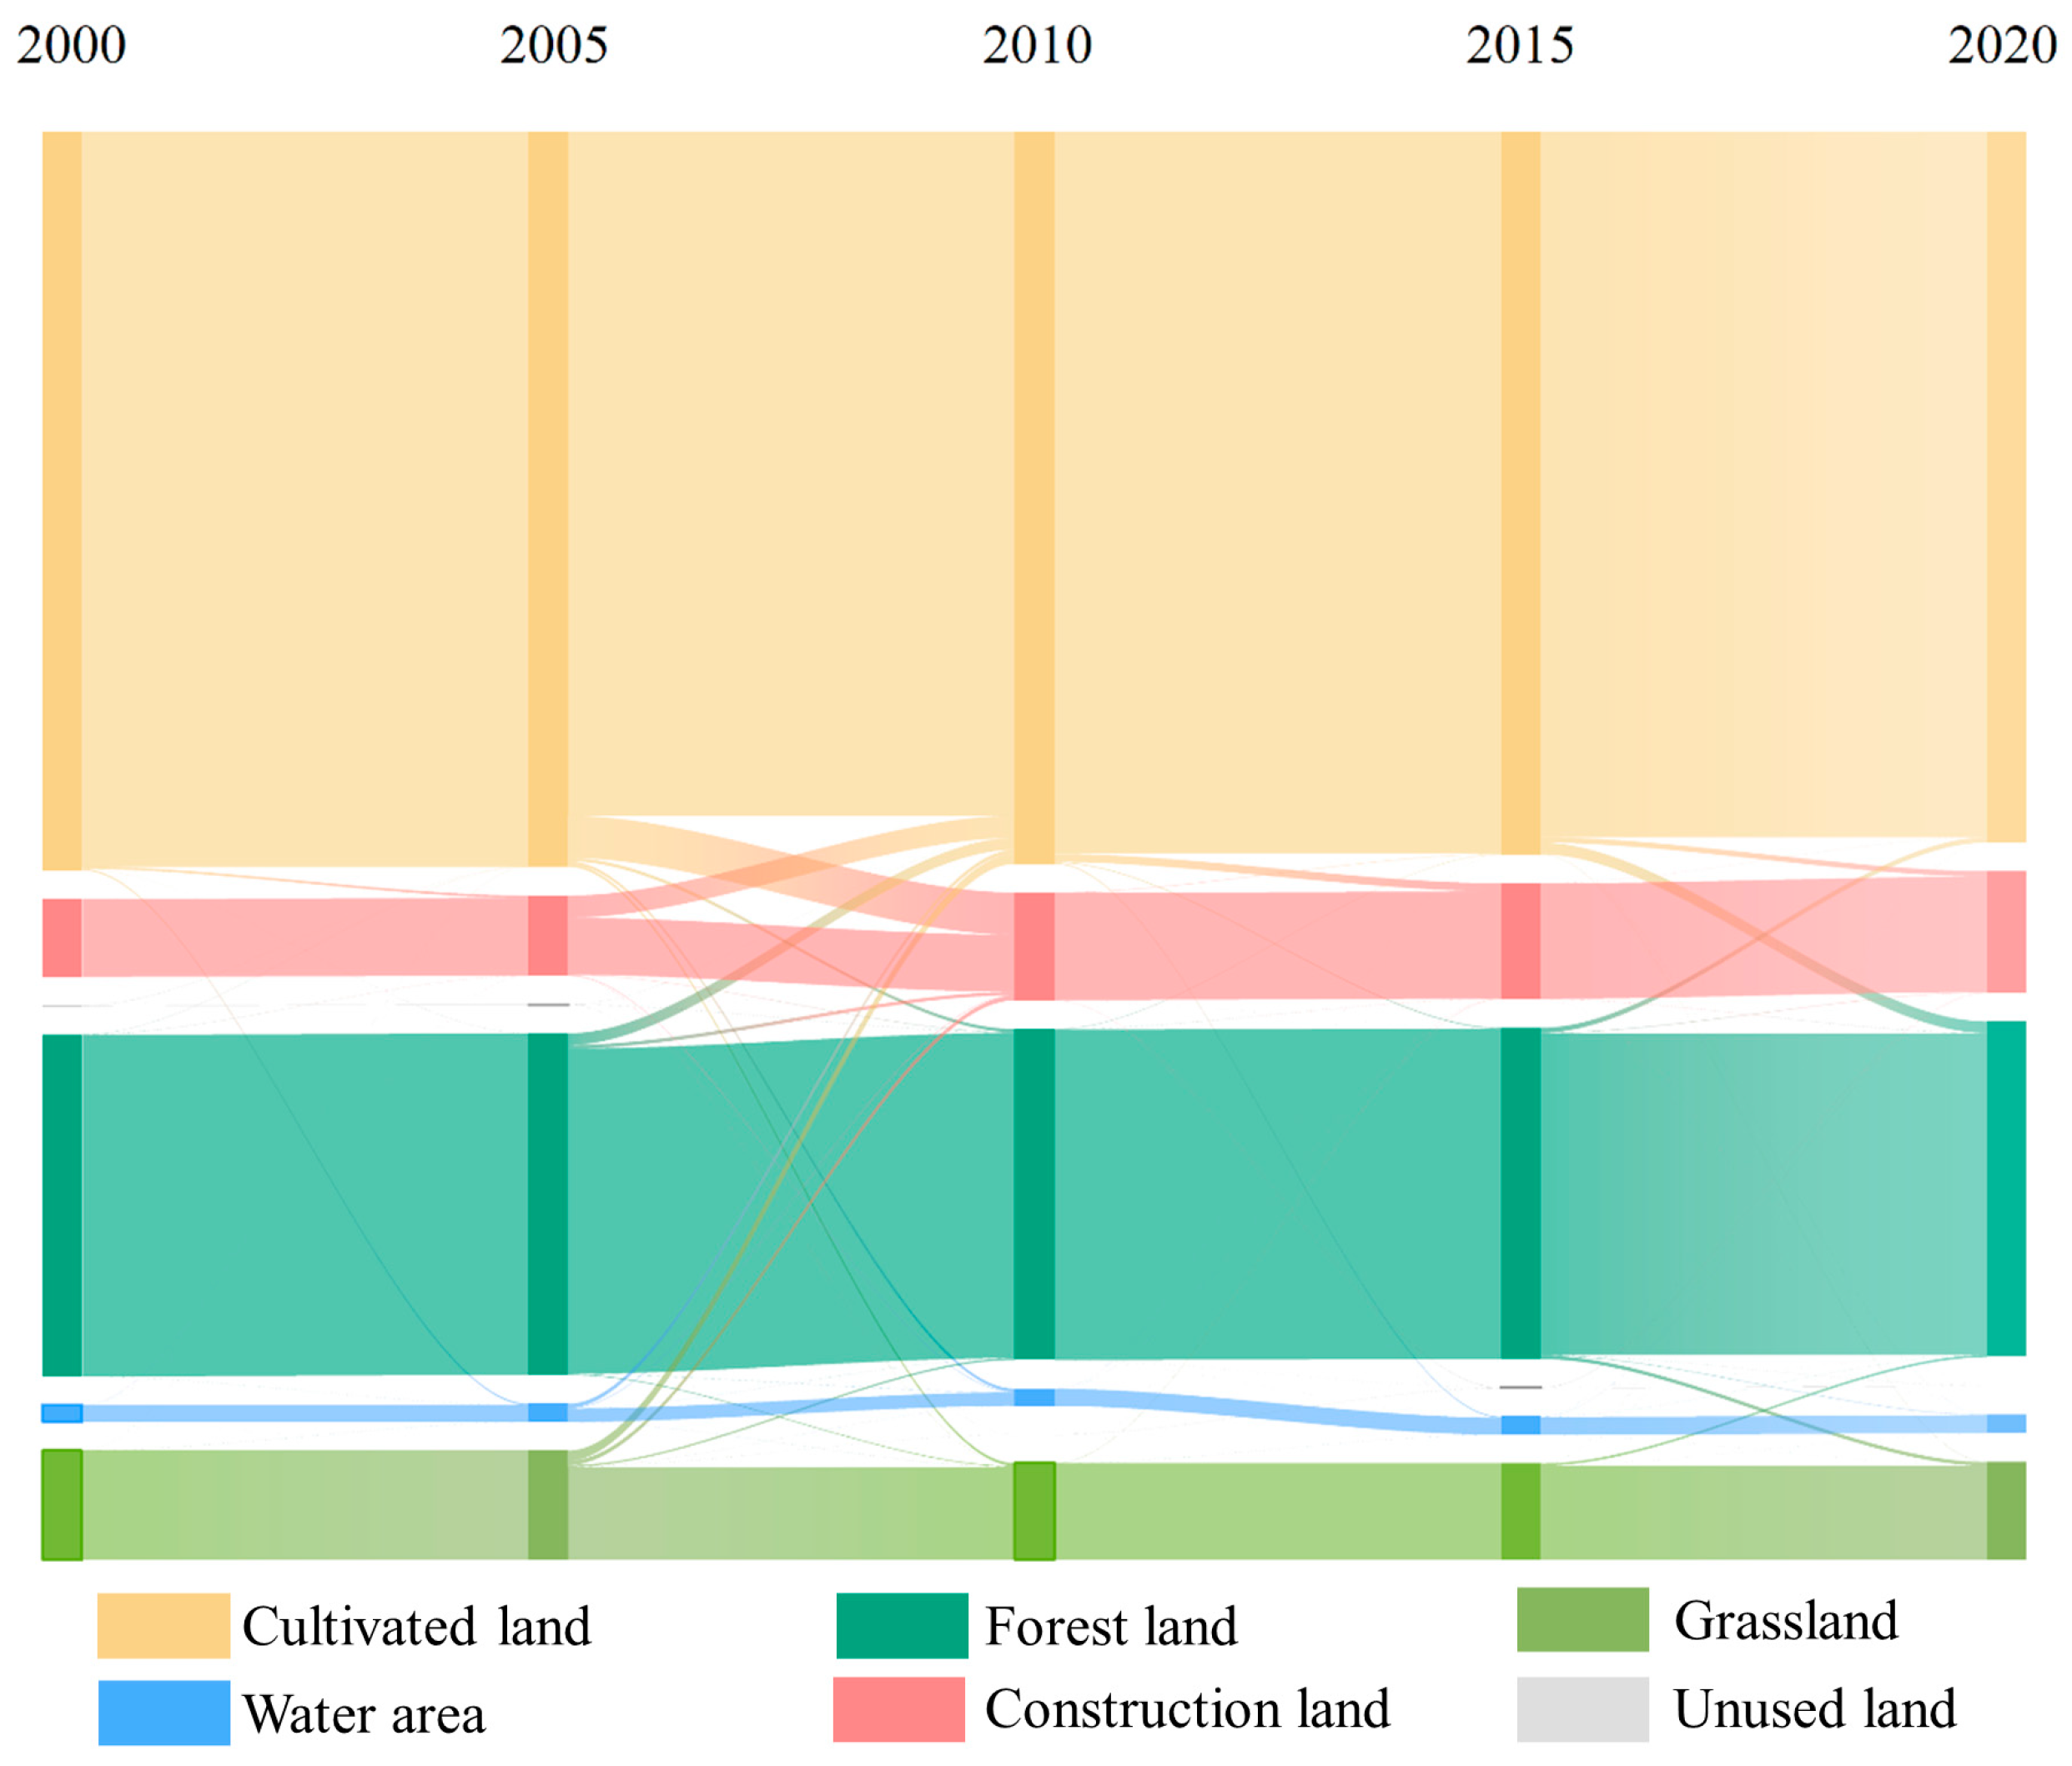
3.1.3. Land Use Transition Characteristics

From 2000 to 2020, the transition area among six types of land use in rural regions of Zheng–Bian–Luo was approximately 2293.37 km2, accounting for 11.82% of the total area. Specifically, there was minimal land use transfer from 2000 to 2005 and 2010 to 2015, with only minor conversions from cultivated land to construction land in 2000. However, significant increases in land use transfers were observed from 2005 to 2010, with the largest mutual transfers occurring between cultivated land and construction land. Forest land, grassland, and water bodies were predominantly converted to cultivated land, with smaller portions converted to construction land and some cultivated land reverting back to forest land, water bodies, and grassland. From 2015 to 2020, cultivated land was mainly converted to forest land, with a smaller proportion converting to construction land, while forest land underwent equal conversions to cultivated land and grassland (Figure 5).

3.2. Spatiotemporal Changes in Ecosystem Health in Zheng–Bian–Luo Rural Area

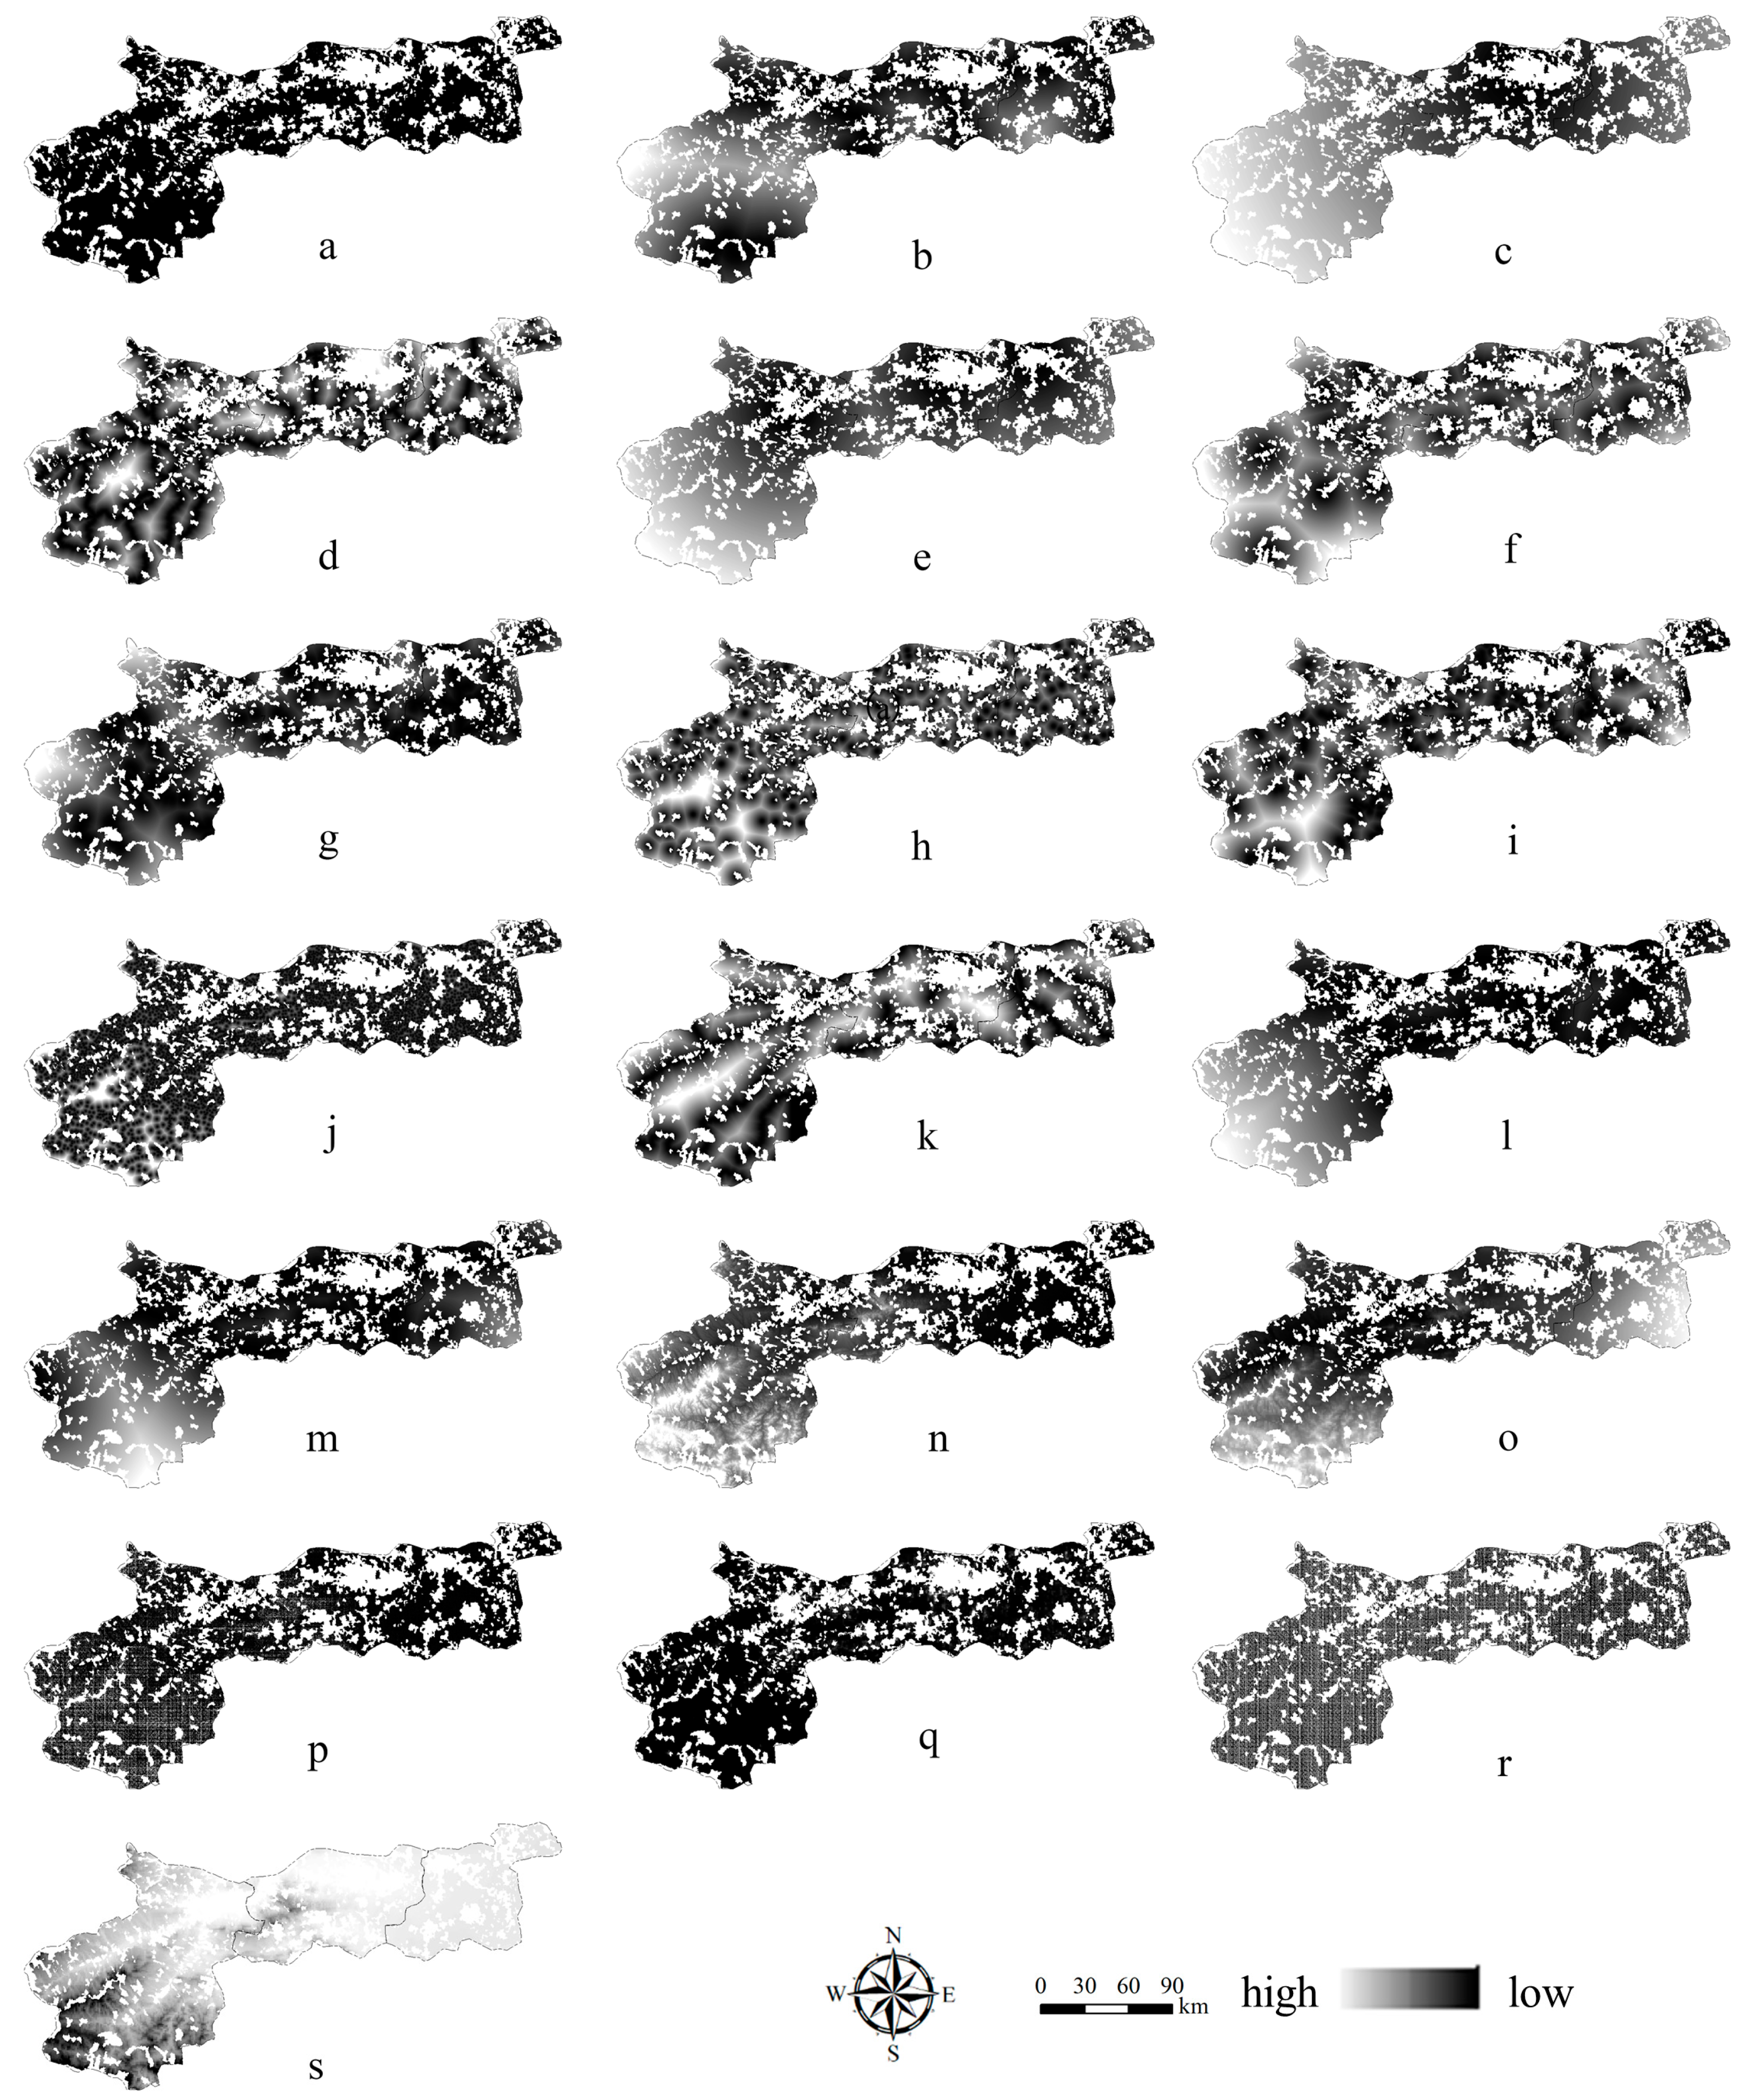
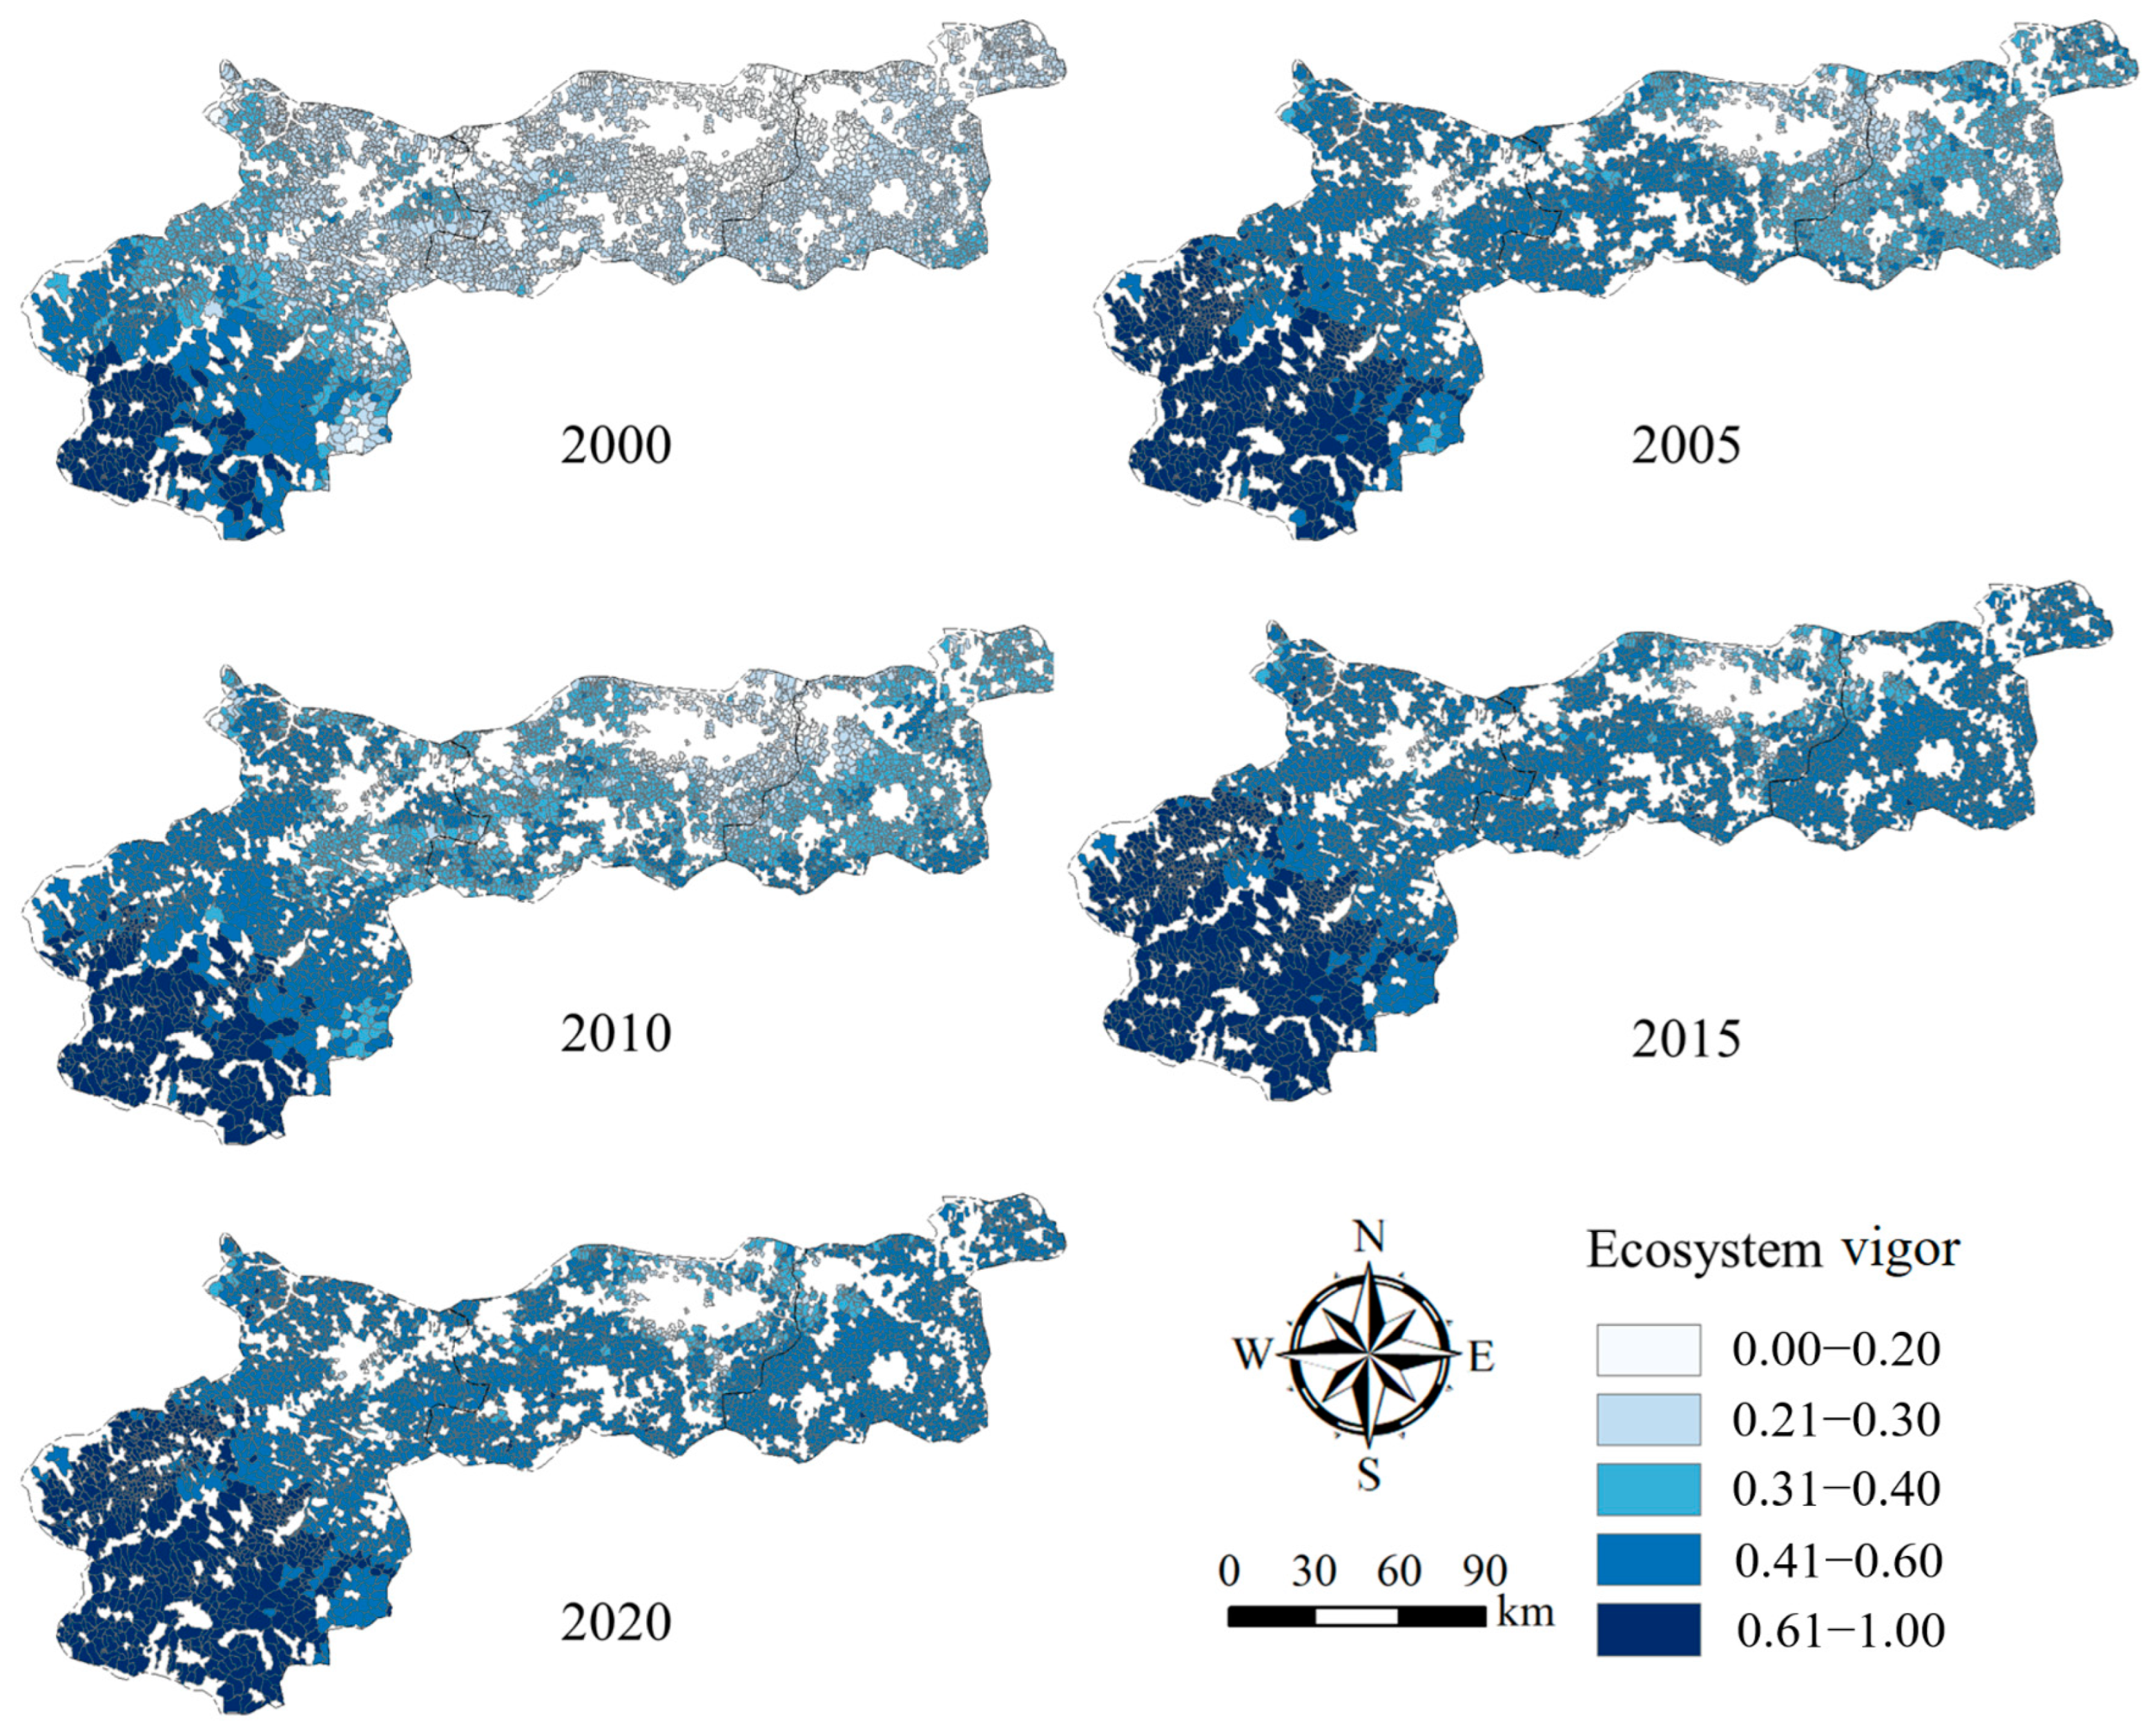
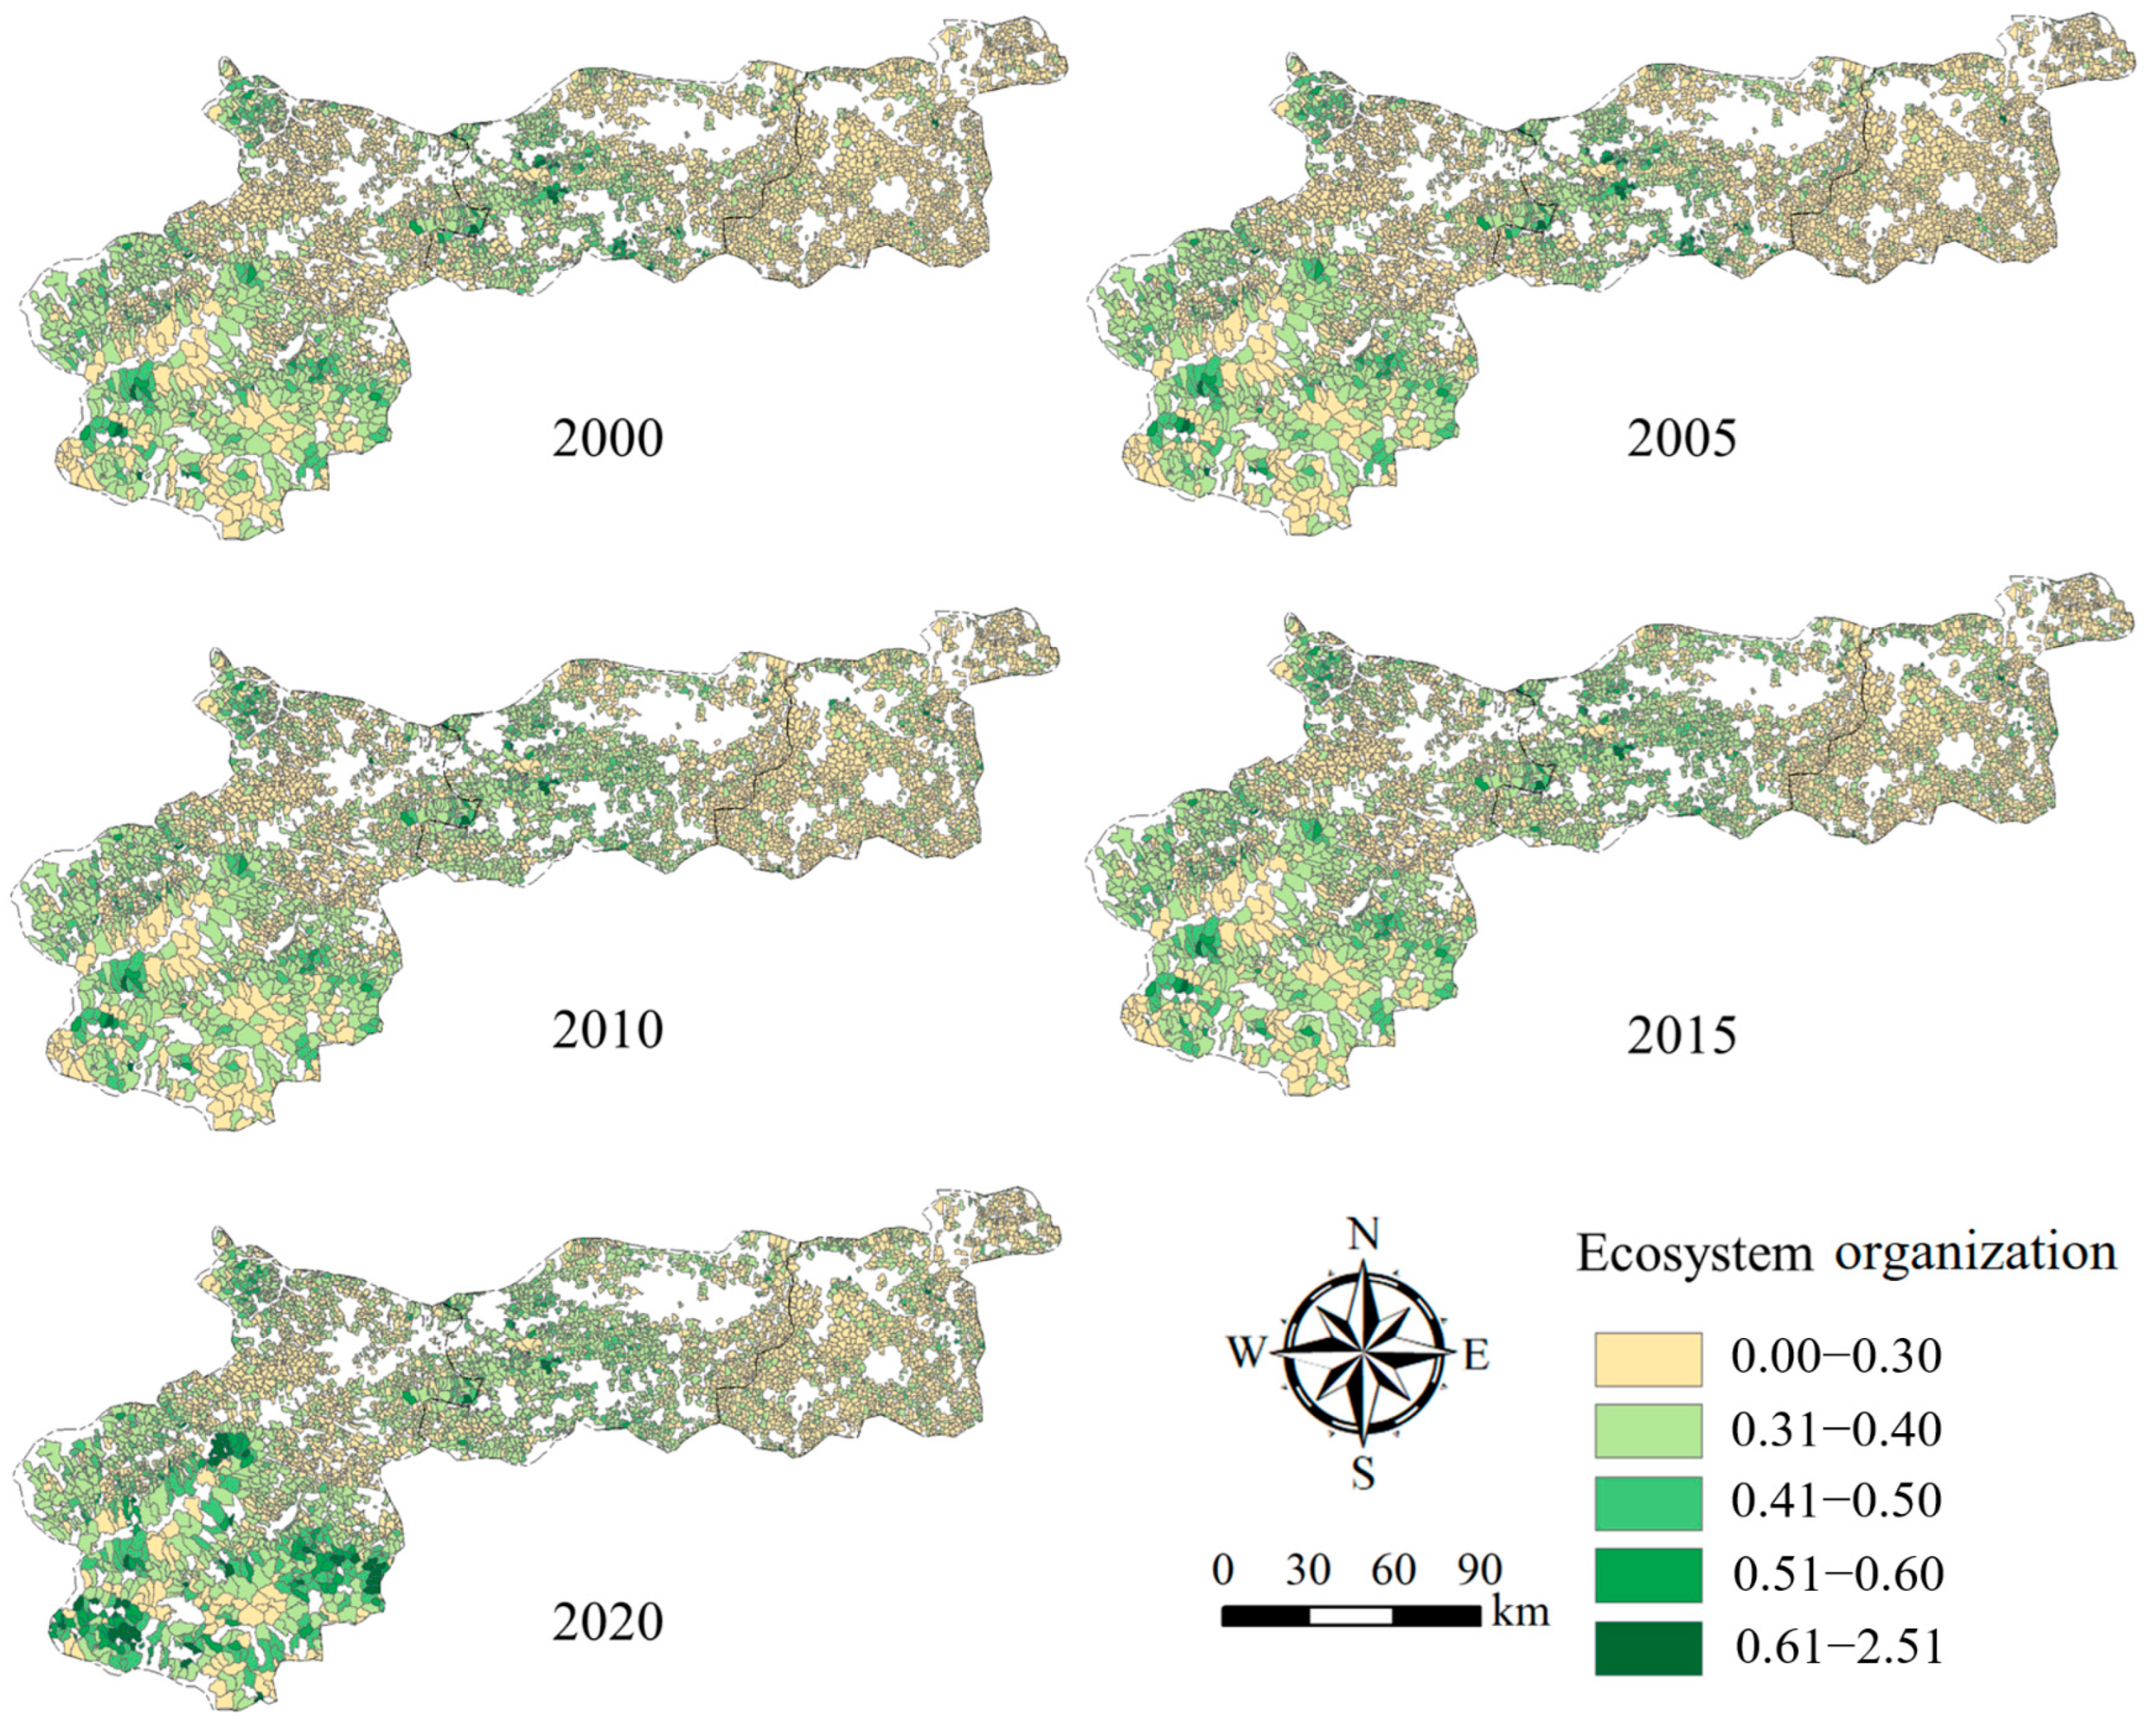
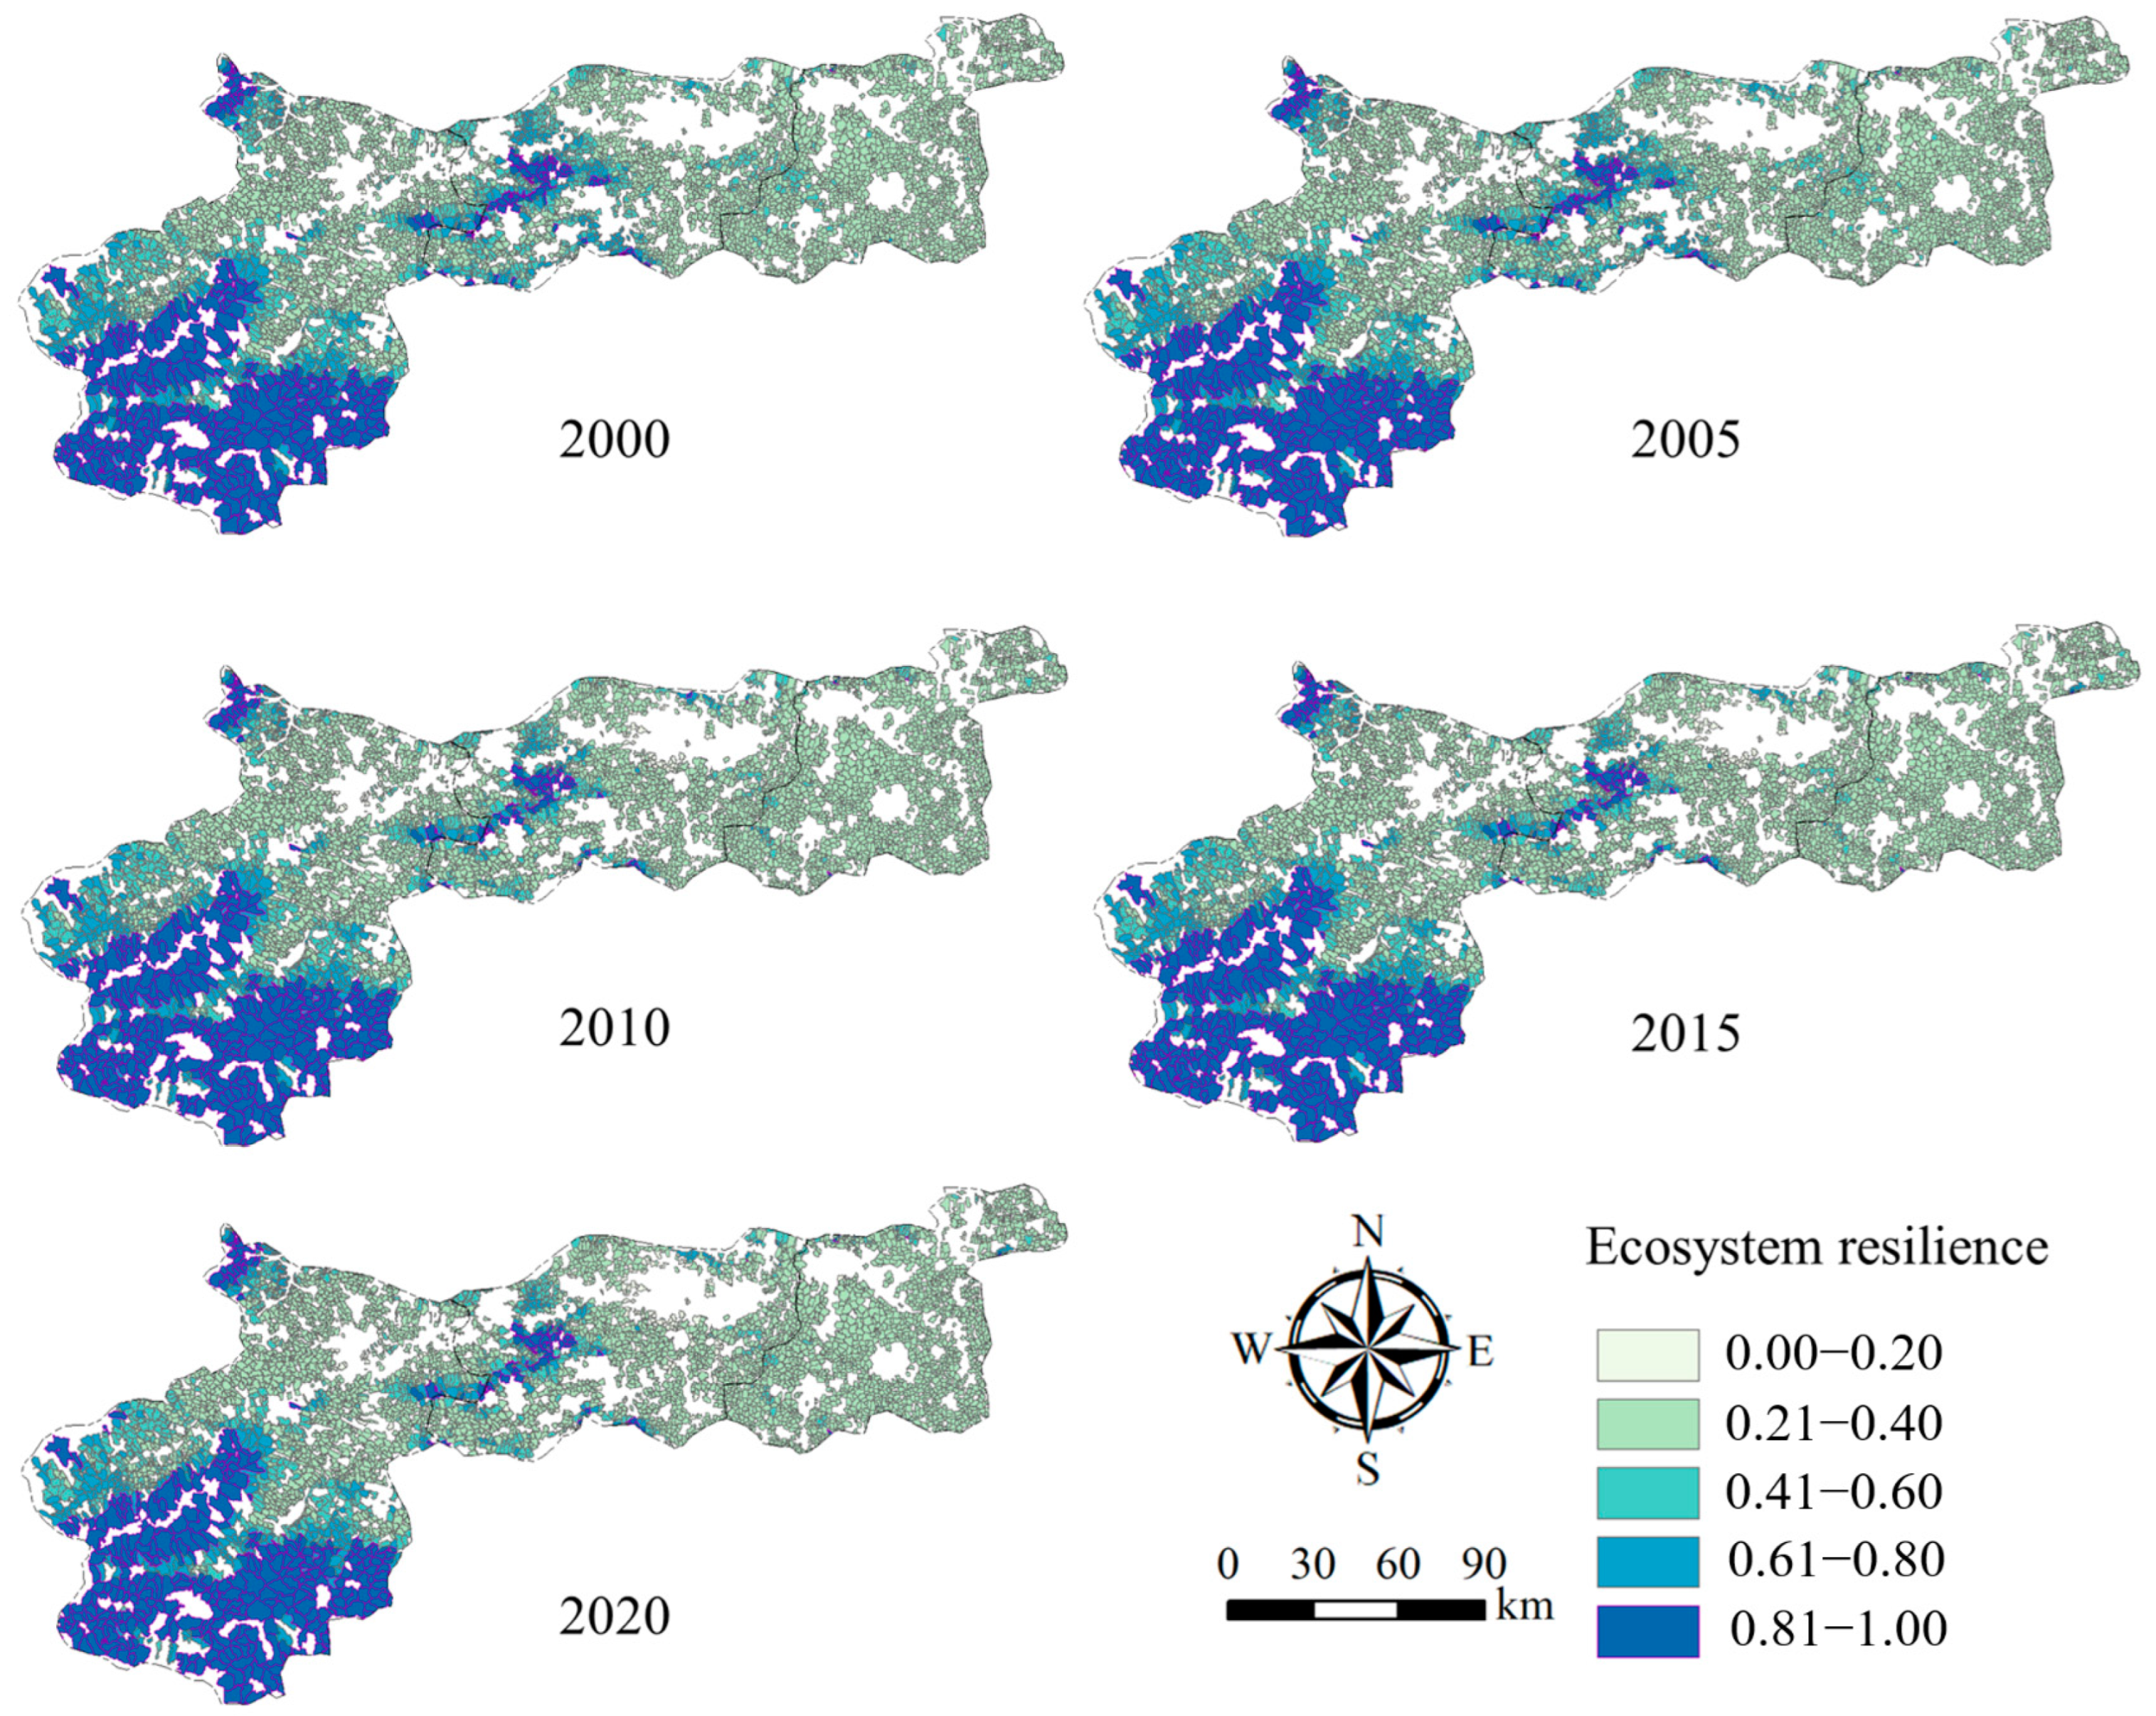
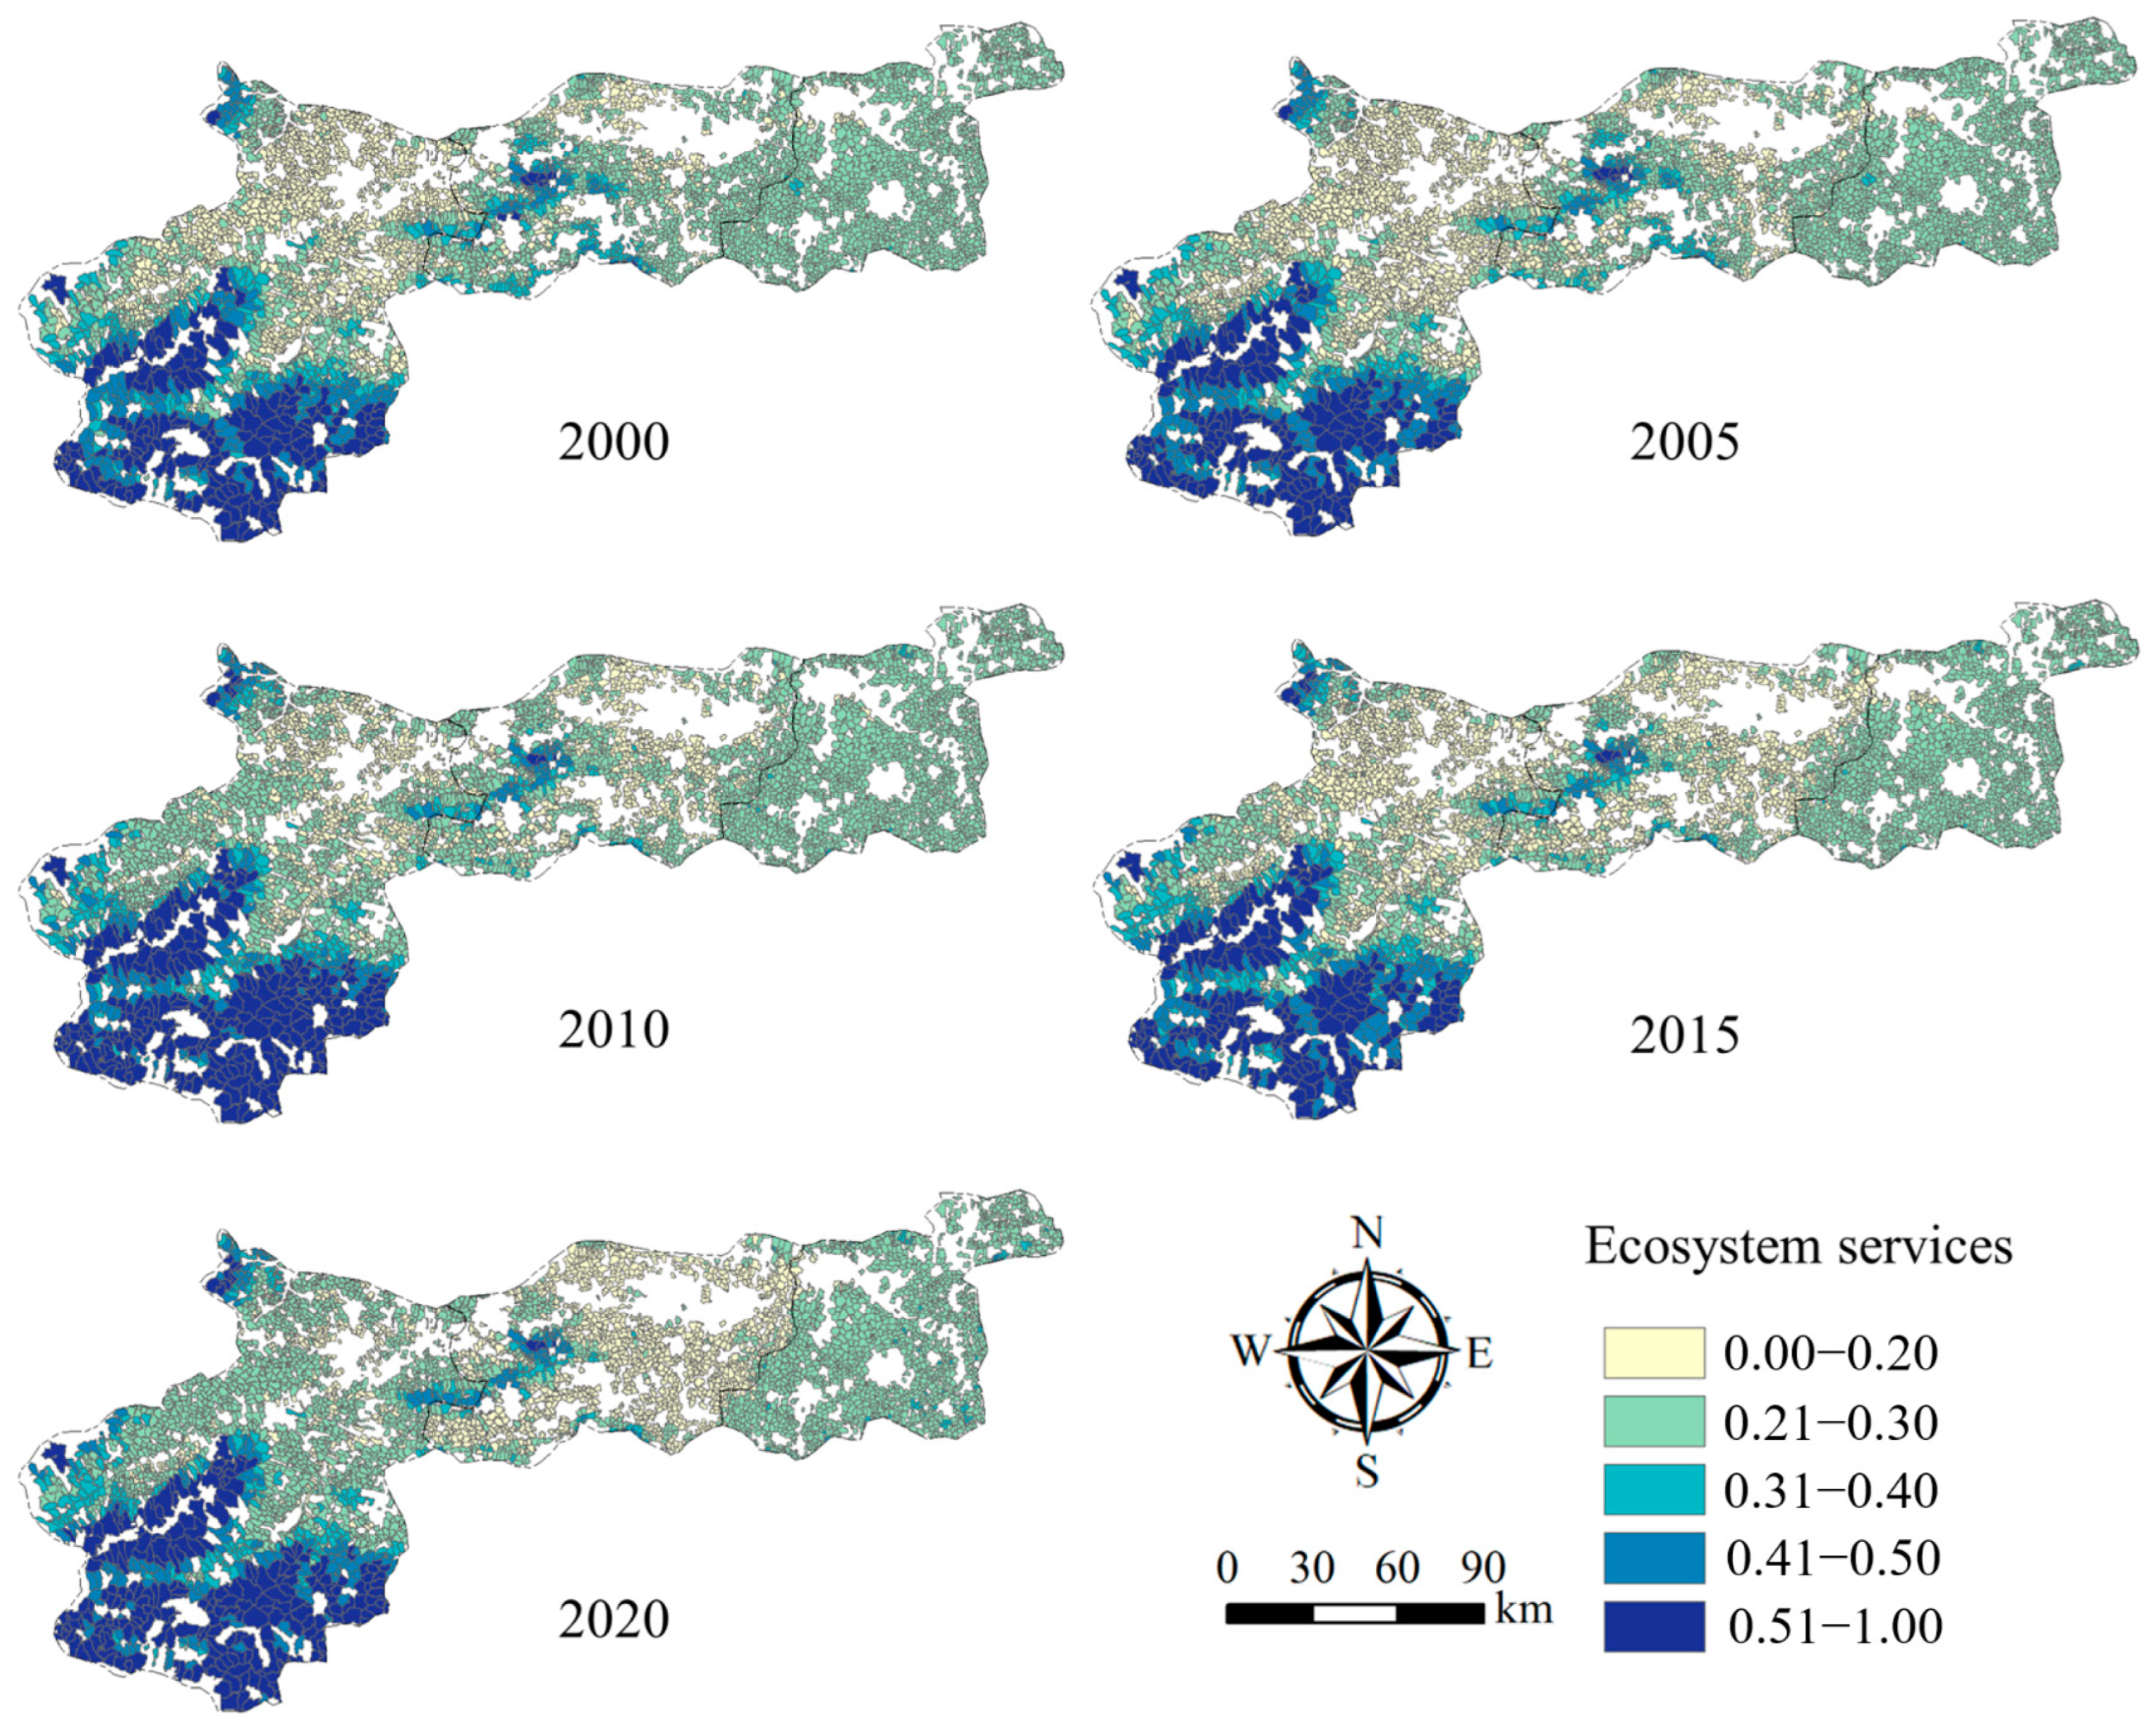
3.2.1. Ecosystem Vigor, Organization, Resilience, and Services

Temporally, the average ecosystem vigor in the Zheng–Bian–Luo rural areas experienced a significant increase from 0.29 in 2000 to 0.52 in 2020. The proportion of villages with ecosystem vigor below the average decreased from 64.35% in 2000 to 54.20% in 2020, indicating a reduction of approximately one-tenth over the duration of the study. Spatially, the high-value areas are mainly distributed in the mountainous regions of Luoyang, particularly the southwestern part, while the low-value areas are primarily located around the urban areas of Luoyang, Zhengzhou, and Kaifeng. From 2000 to 2015, there were notable spatial changes in the distribution of ecosystem vigor, with high-value areas displaying an “expansion-contraction-expansion” trend (Figure 6).
The average value of ecosystem organization in the Zheng–Bian–Luo rural areas experienced a slight increase from 0.31 in 2000 to 0.33 in 2020. The proportion of villages with ecosystem organization below the average decreased from 68.23% in 2000 to 64.70% in 2020. Spatially, the ecosystem organization level in the southwestern rural areas of Luoyang slightly increased over the twenty-year period, while other areas remained relatively stable (Figure 7). Overall, there was a decline in ecosystem resilience during the twenty-year period, with the average value decreasing from 0.42 in 2000 to 0.39 in 2020. Spatially, aside from minor changes near the Songshan Mountains close to Zhengzhou, the distribution of ecosystem resilience remained largely unchanged from 2000 to 2020 (Figure 8).
There was a slight increase in the average value of ecosystem services from 0.25 in 2000 to 0.26 in 2020 (Figure 9). Spatially, the high-value areas are primarily situated in the forested mountainous regions of Luoyang, the southern mountain forest areas of Xin’an County, and near the Songshan Mountains at the border of Zhengzhou and Luoyang. These areas exhibit notable heterogeneity and maintain a high level of consistency with the spatial pattern of ecosystem resilience.

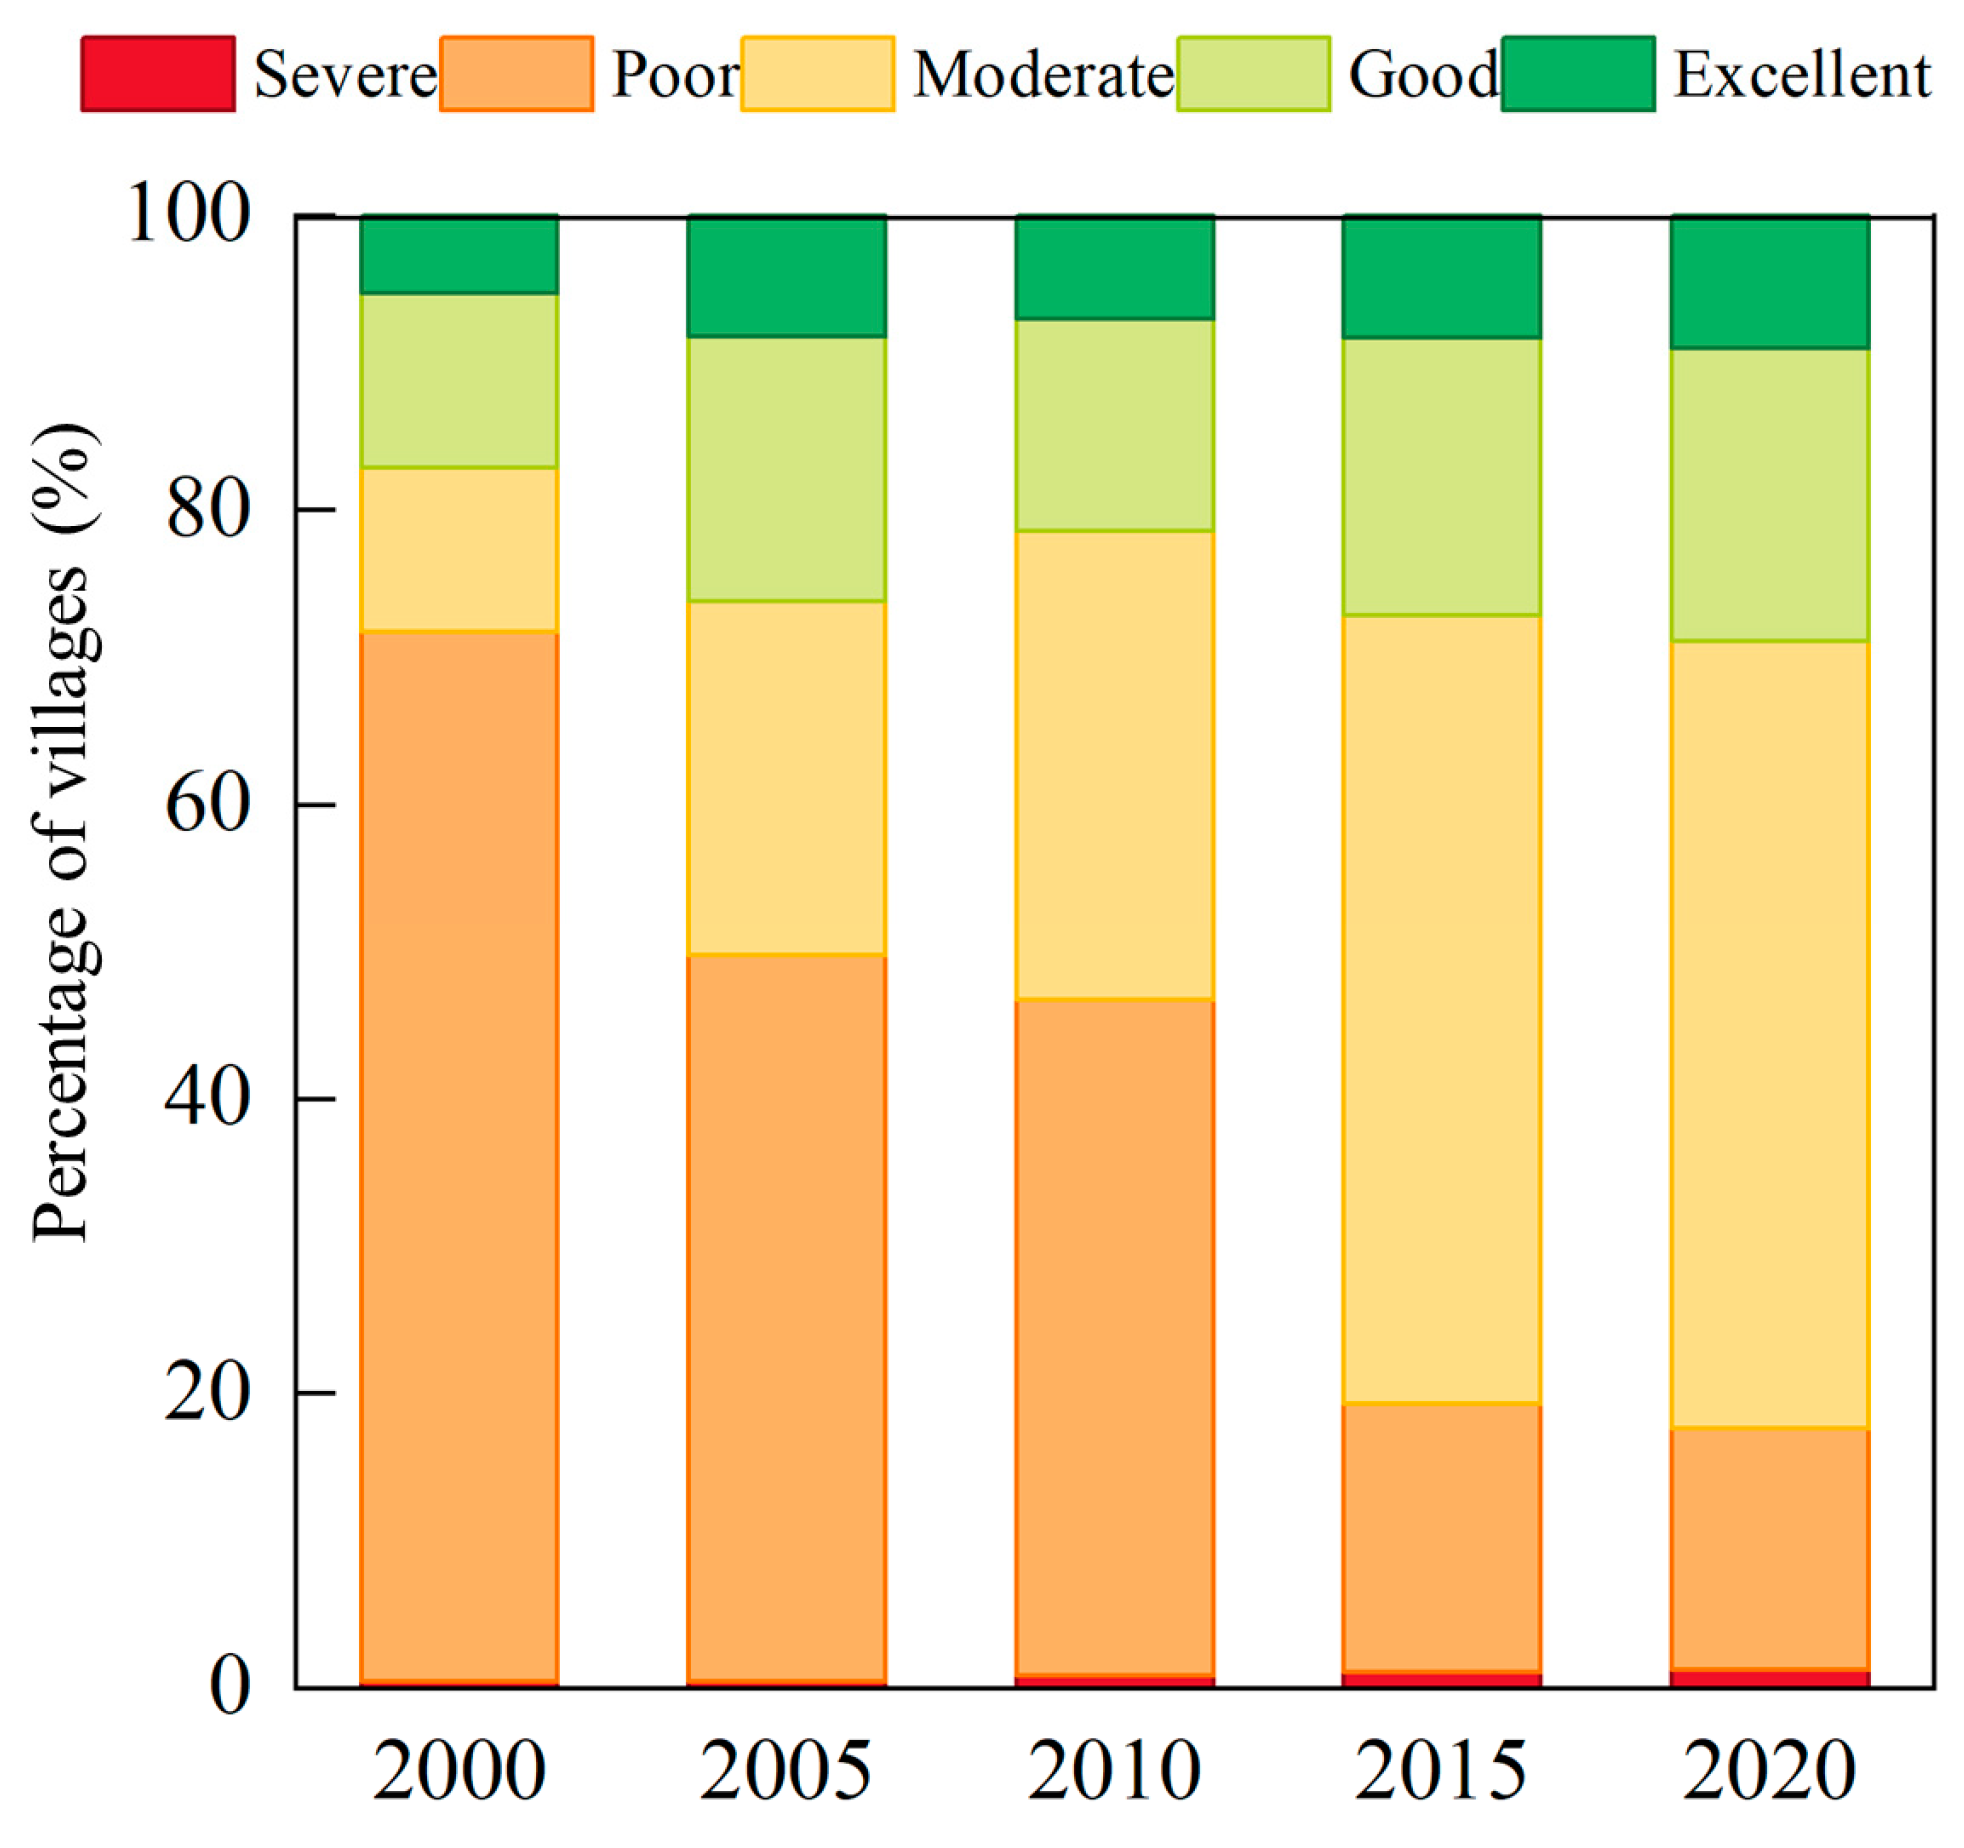
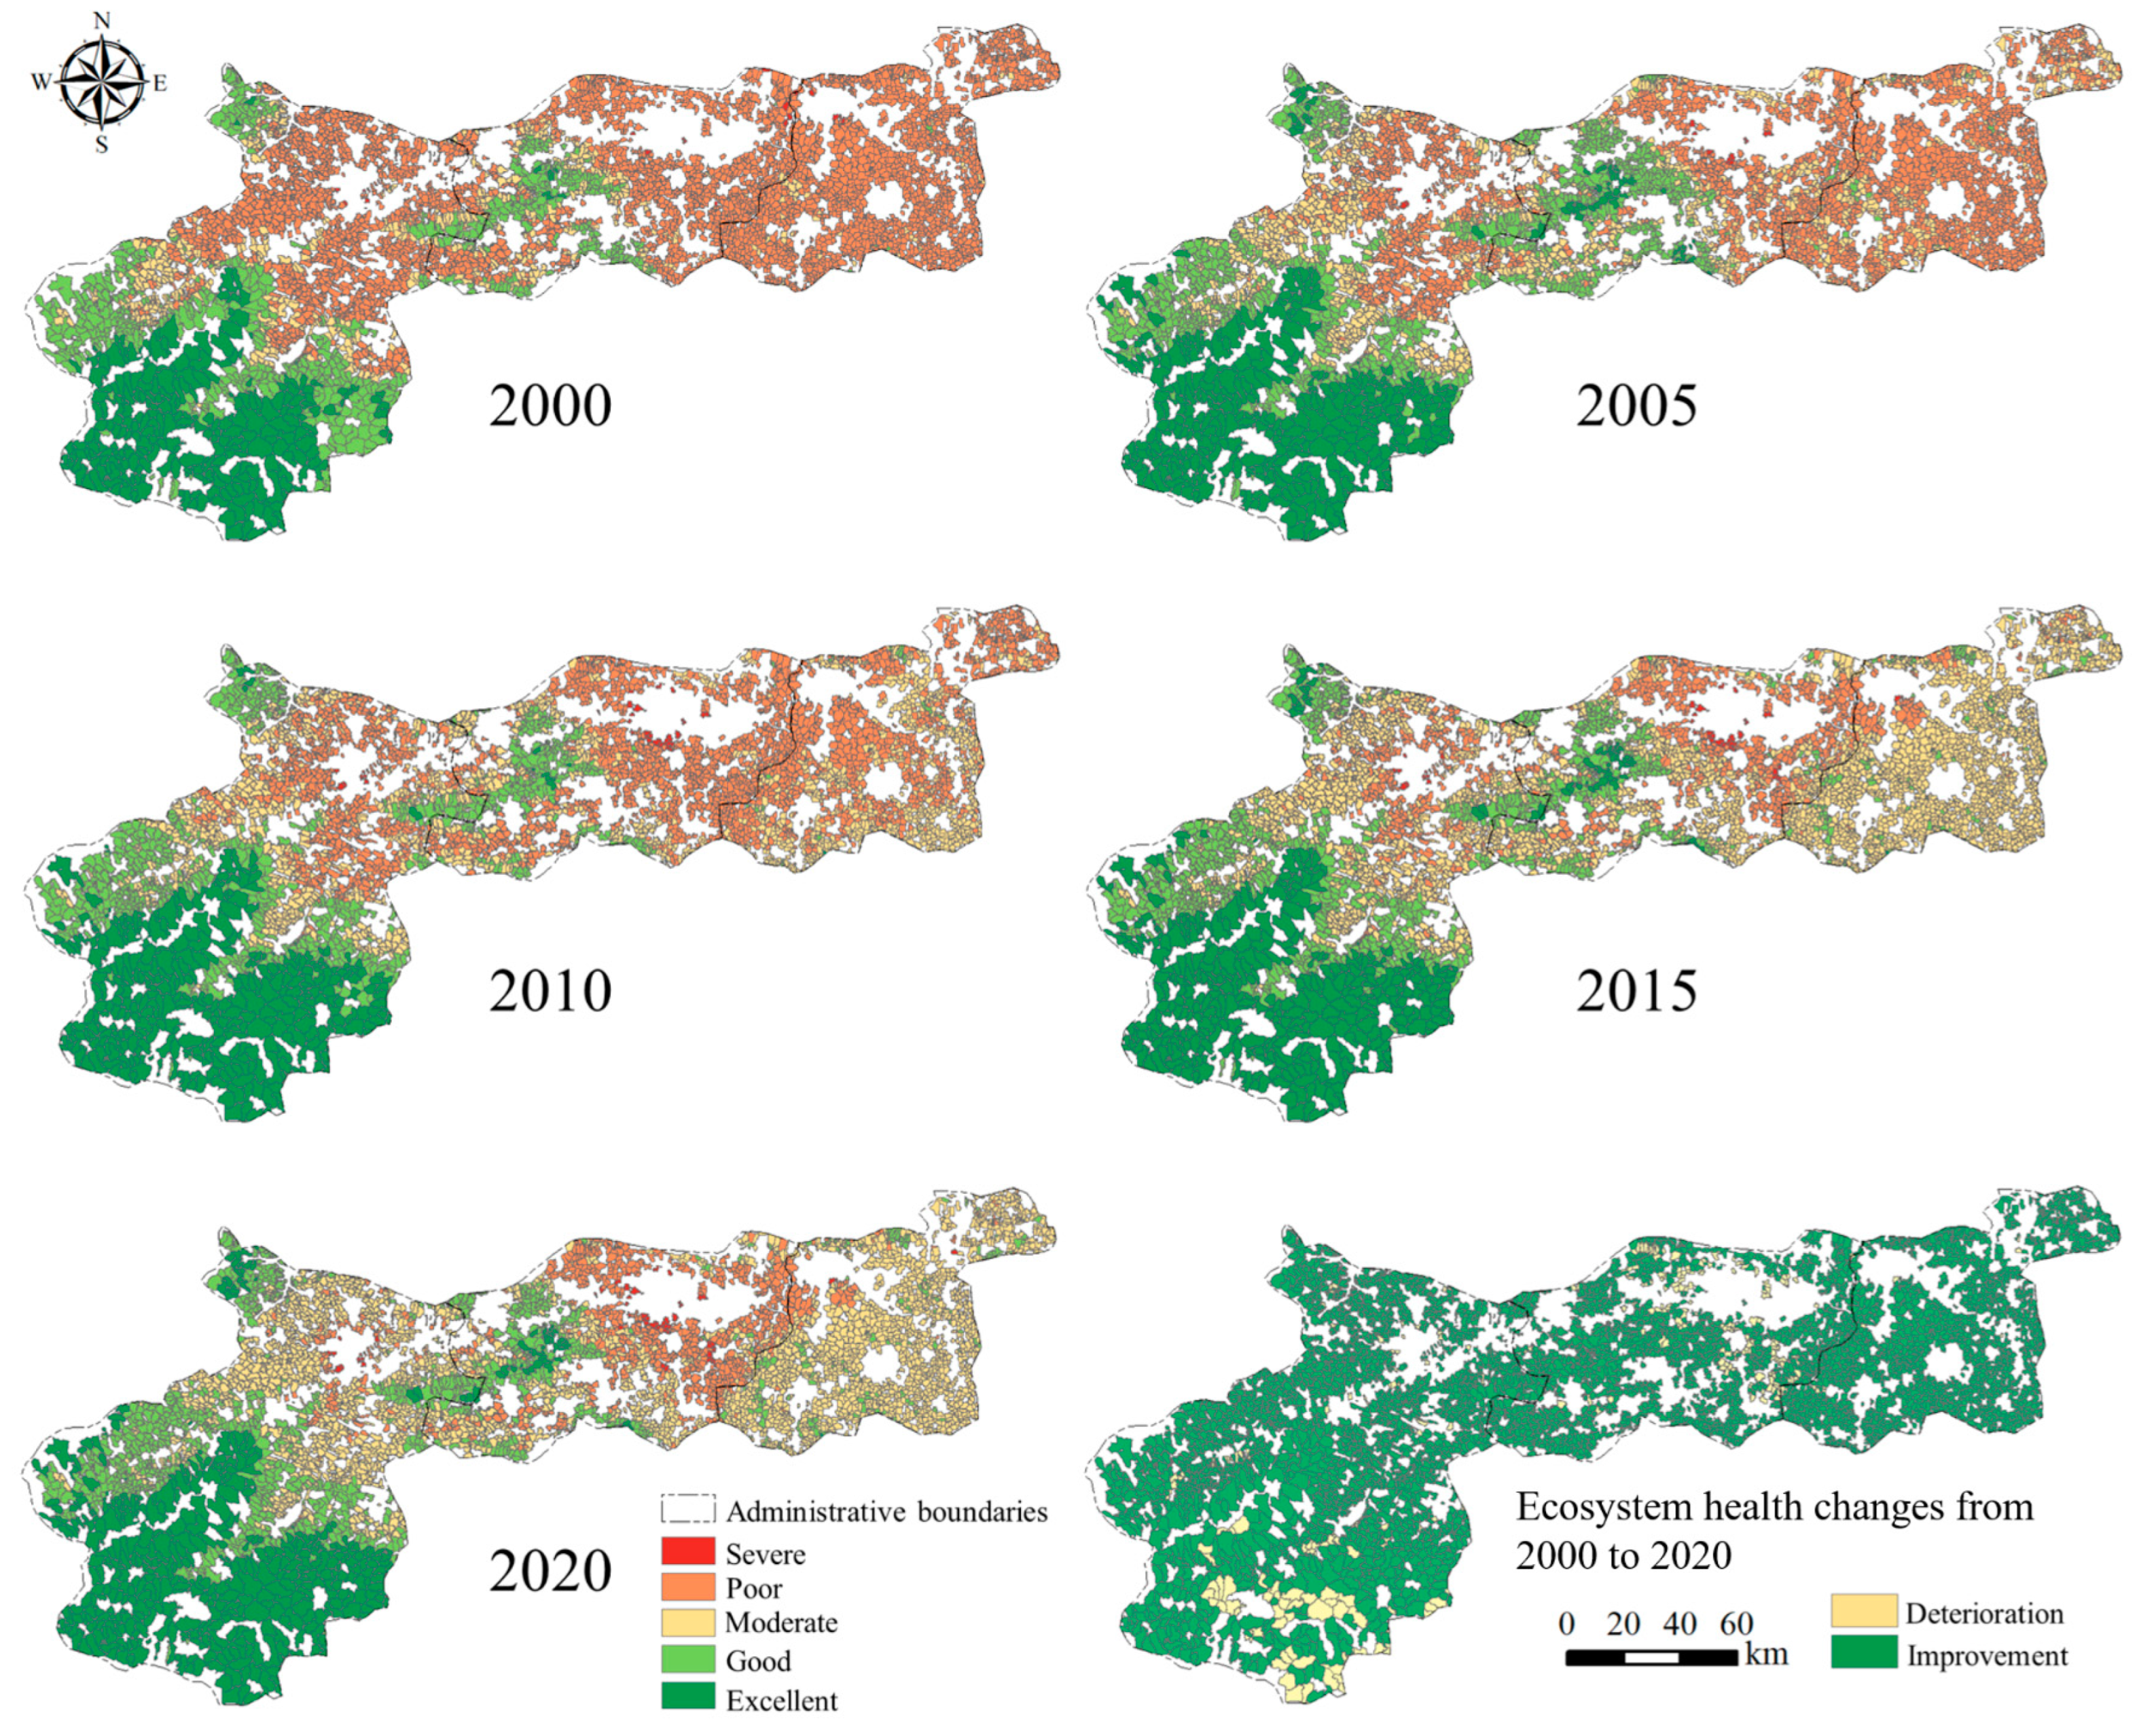
3.2.2. Spatiotemporal Dynamics of Ecosystem Health

To effectively illustrate the evolution of ecosystem health over time in the rural Zheng–Bian–Luo area, we have classified the ecosystem health index into five levels using the natural breaks method: poor (0–0.20), relatively poor (0.20–0.30), average (0.30–0.35), relatively good (0.35–0.50), and excellent (0.50–1.00).
In terms of temporal analysis, the average ecosystem health indices for 2000, 2005, 2010, 2015, and 2020 were recorded as 0.32, 0.34, 0.33, 0.35, and 0.35, respectively. These findings indicate a generally stable condition with a slight upward trend. Throughout the study period, an average of approximately 70% of villages in the Zheng–Bian–Luo rural area had ecosystem health indices below the average values. The proportions of villages with severe health levels were found to be 0.49%, 0.47%, 0.87%, 1.09%, and 1.24% for 2000, 2005, 2010, 2015, and 2020, respectively (Figure 6). These results suggest that the prevalence of severe health levels was relatively low and exhibited a decreasing trend. Furthermore, the percentages of villages with poor health levels showed a consistent decline from 71.28% in 2000 to 16.40% in 2020, with the highest proportion observed in 2000. The changes in poor health levels between 2005 and 2010 and 2015 and 2020 were relatively gradual, whereas there was a significant decrease of over 20% in health levels between 2000 and 2005 and 2010 and 2015. The proportions of villages with moderate health levels were 11.12%, 24.02%, 31.83%, 53.54%, and 53.44% for 2000, 2005, 2010, 2015, and 2020, respectively. Notably, there was a substantial increase in the percentage of villages with moderate health levels, particularly between 2010 and 2015. The proportions of villages with relatively good health levels were 11.86%, 17.97%, 14.42%, 18.79%, and 19.87%, indicating an initial increase, followed by a decrease, and ultimately another increase, with approximately one-fifth of the villages reaching this level by 2020. A similar fluctuating upward trend was observed for the proportions of villages with excellent health levels, which were 5.26%, 8.25%, 7.03%, 8.33%, and 9.04% for 2000, 2005, 2010, 2015, and 2020, respectively. Moreover, the proportion of villages with excellent health levels in 2020 was approximately 1.68 times higher than that in 2000. Lastly, the proportion of villages with above-moderate ecosystem health indices displayed a continuous upward trend, increasing from 17.12% to 28.92% (Figure 10).
In terms of overall spatial distribution, the ecosystem health levels in the Zheng–Bian–Luo rural area exhibit significant spatial heterogeneity (Figure 11). Regions with good and excellent levels of ecosystem health are concentrated in the southeastern part of Luoyang, a small area in the north, and the hilly border area between Zhengzhou and Luoyang. Specifically, these include the southern parts of Luoning County, Luanchuan County, Song County, Yiyang County, and Ruyang County in Luoyang, the northern part of Xin’an County, and the villages near the Songshan Mountains. Generally, the mountainous and hilly areas have higher health levels, while the plains have lower health levels. Areas with severe and poor ecosystem health have significantly contracted towards the urban areas of Zhengzhou, Kaifeng, and Luoyang. By 2020, the poorly rated regions were mostly in the rural areas surrounding Zhengzhou. This spatial distribution aligns with the patterns of ecosystem resilience and ecosystem services (Figure 8 and Figure 9). From 2000 to 2020, the areas where ecosystem health deteriorated (regions with a decrease in health index) were significantly smaller than the areas where it improved (regions with an increase in health index). The areas of deterioration are mainly in the southwestern mountainous regions of Luoyang.

3.3. Simulation of Ecosystem Health Under Multiple Scenarios in Zheng–Bian–Luo Rural Area

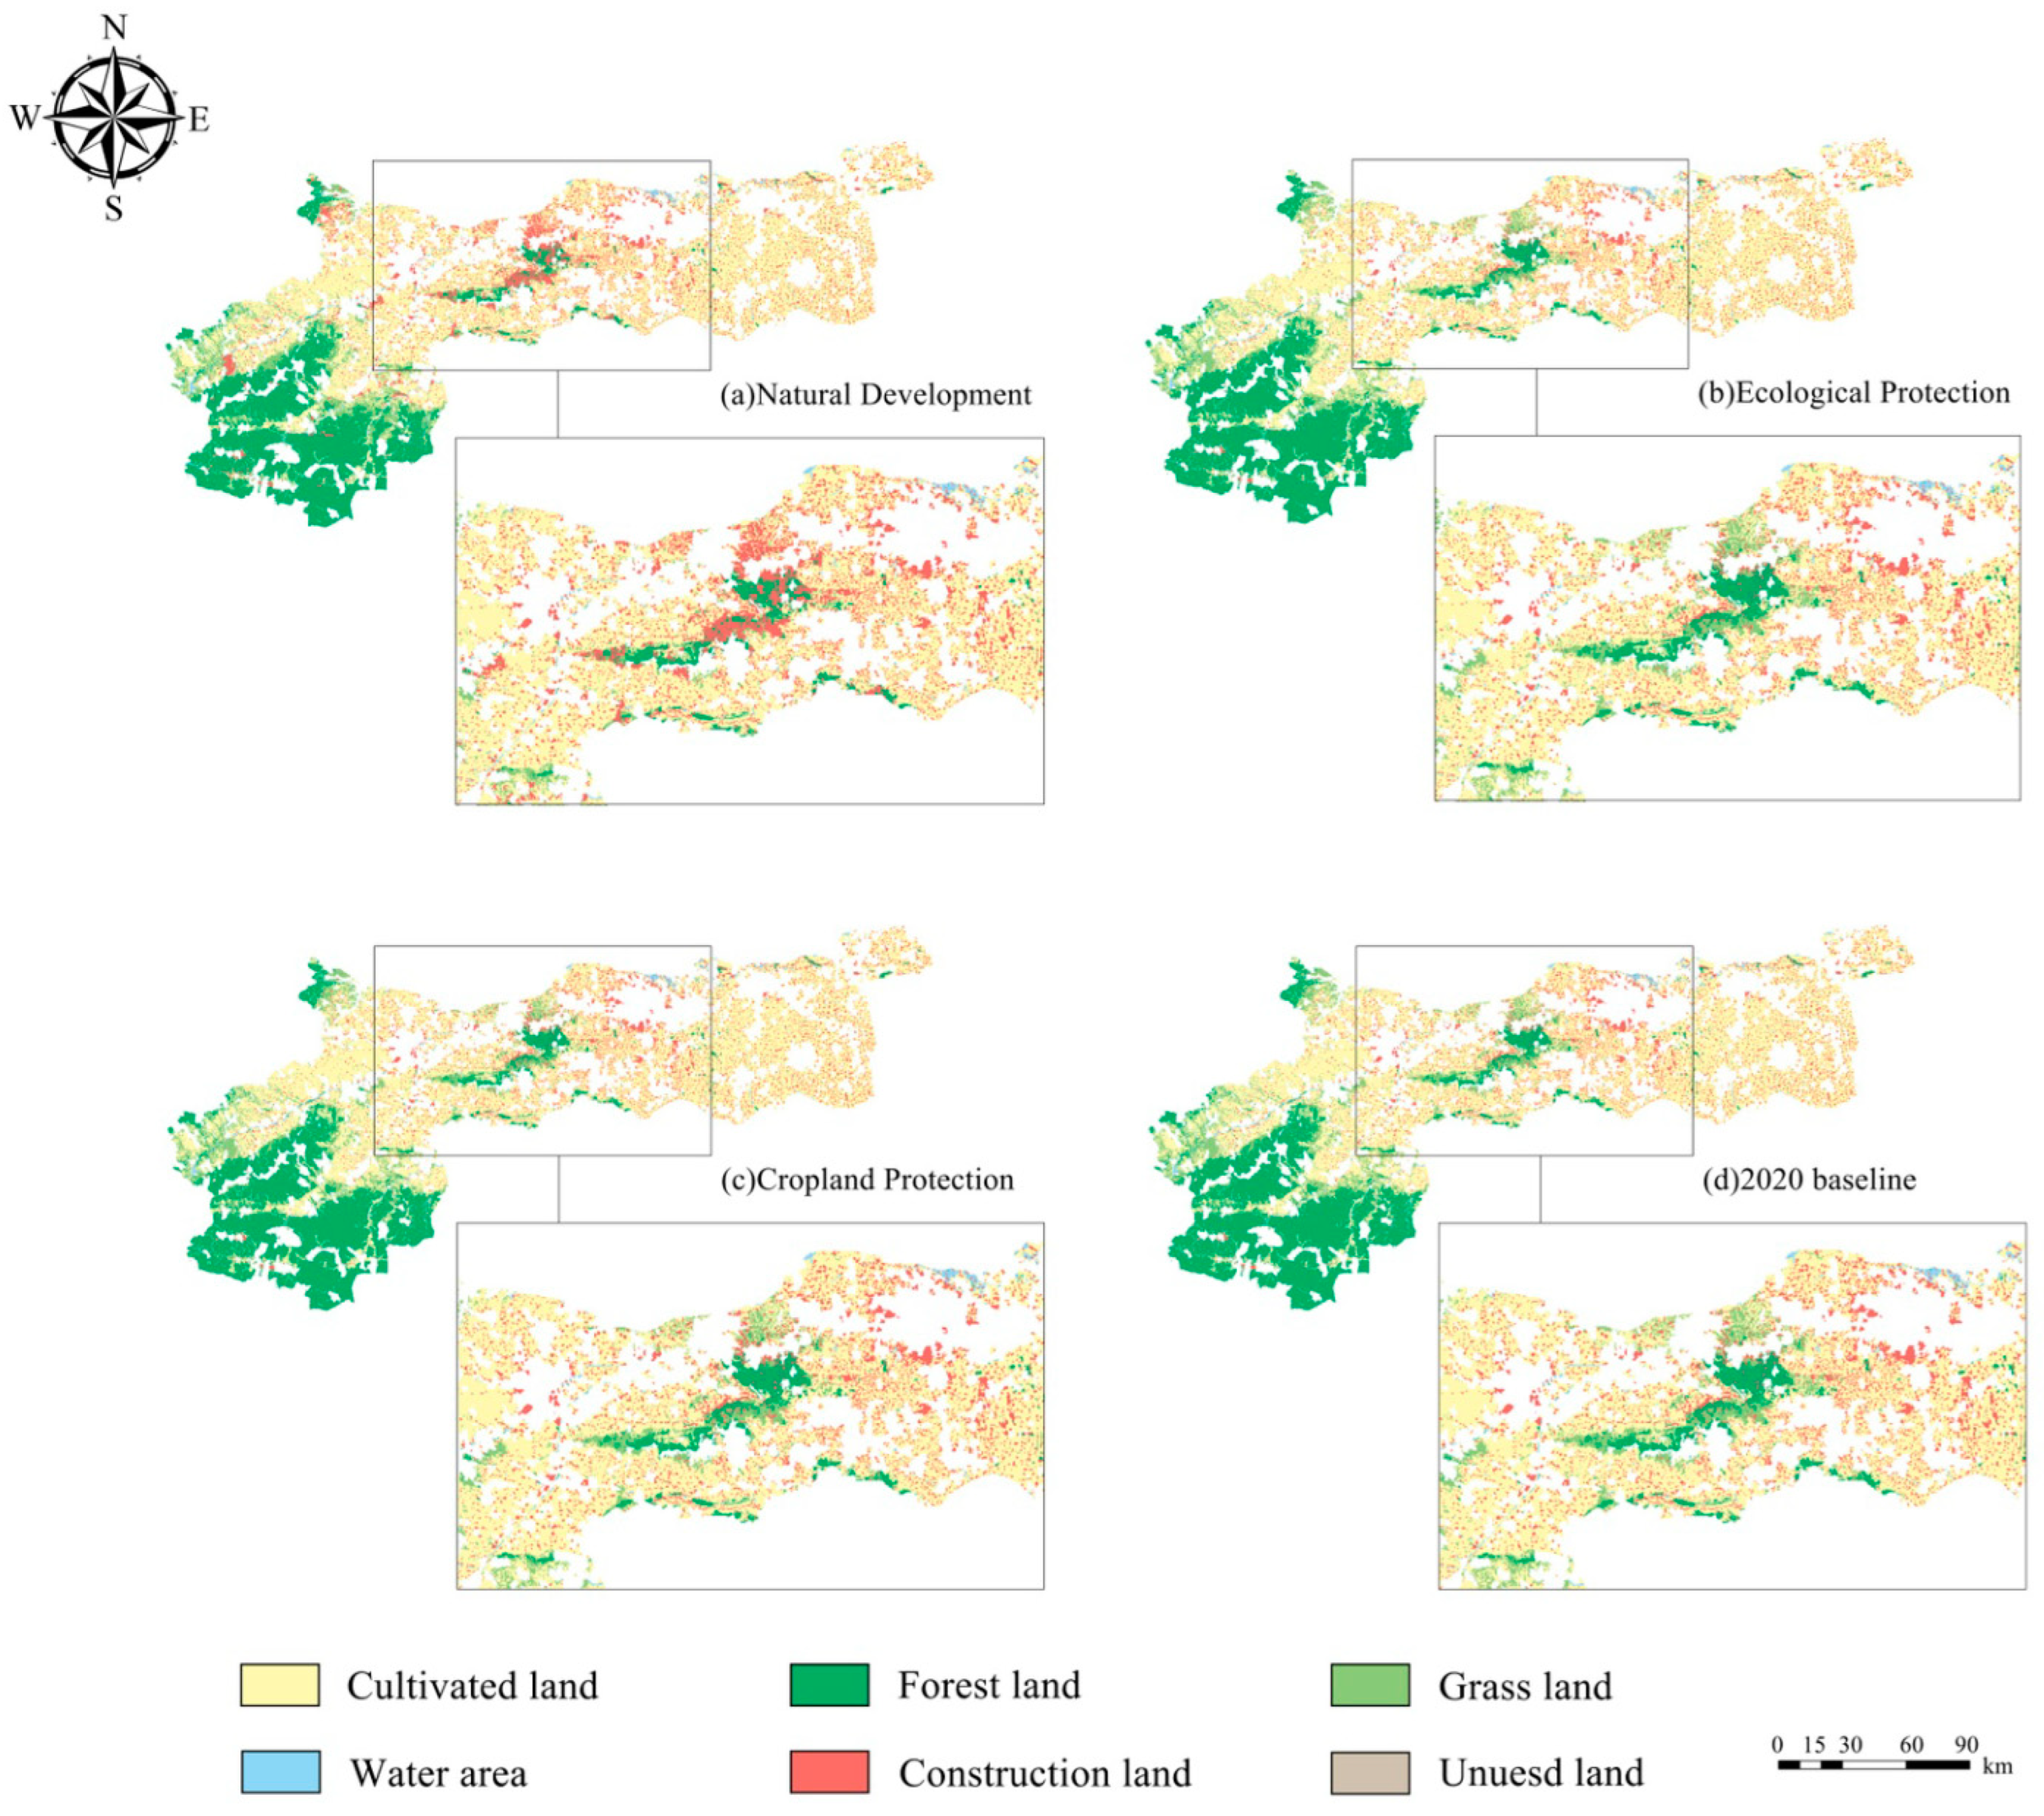
3.3.1. Multi-Scenario Land Use Simulation Analysis

Figure 12 depicts the changes in land use types projected by the PLUS model for 2035 under three different development scenarios. In the ND scenario, the expansion of construction land is particularly notable in areas surrounding the Songshan Mountains, the border between Zhengzhou and Luoyang, and the southeast urban area of Zhengzhou. Compared to 2020, the extent of cultivated land decreases under both the ND and EP scenarios, while it increases by 223.848 km2 under the CP scenario, accounting for 0.14% of the 2020 land area. Forest land increases by 76.794 km2 under the EP scenario, accounting for 0.10% of the 2020 area, but decreases under both the CP and NP scenarios. Notably, the NP scenario exhibits the largest reduction of 367.999 km2, accounting for 0.52% of the 2020 forest land area. Grassland experiences a decrease under all three scenarios, with the NP scenario showing the largest reduction of 338.855 km2, accounting for 1.99% of the 2020 grassland area. This is followed by the CP scenario, while the EP scenario demonstrates the smallest reduction. Water bodies decrease under the CP scenario and increase under the NP scenario, remaining constant under the EP scenario. Construction land increases under all three development scenarios, with the NP scenario displaying the most significant increase of 718.007 km2. The expansion of construction land under the EP scenario amounts to 63.528 km2, which is 1.89 times that under the CP scenario. Changes in unused land are minimal, with a decrease of 1.961 km2 under the NP scenario, an increase of 0.076 km2 under the EP scenario, and a decrease of 0.159 km2 under the CP scenario.

3.3.2. Ecosystem Health Prediction Under Multiple Scenarios

Compared to the ecosystem health level in 2020, it is evident that the overall ecosystem health is highest under the EP scenario, displaying an increase of 0.02. Conversely, the ecosystem health value under the ND scenario decreases compared to 2020, while the CP scenario shows no significant change. Specifically, under the ND and CP scenarios, the proportions of villages with poor ecosystem health levels are 0.70% and 0.58%, respectively, while there are no villages with poor levels under the EP scenario. Similarly, the proportions of villages with moderate health levels under the ND, EP, and CP scenarios are 83.49%, 69.34%, and 57.81%, respectively, with the ND scenario having the highest proportion of moderate health levels. In contrast, the proportions of villages with good health levels are 15.84%, 22.01%, and 41.63%, respectively. Notably, only under the EP scenario do villages possess a proportion of 8.67% at the excellent health level, whereas no villages under the ND and CP scenarios reach the excellent health level (Figure 13).
Concerning the spatial aspect, the ecosystem health in 2035 exhibits significant spatial changes compared to 2020 under all three scenarios. Besides the rural areas surrounding Zhengzhou and Luoyang urban areas, the ND scenario demonstrates a decreasing trend in ecosystem health, specifically evident in the southwestern part of Luoyang, the northern part of Xin’an County, and the Songshan region. This phenomenon indicates that economic development in the southwestern part of Luoyang under the ND scenario is accompanied by environmental degradation. On the other hand, under the EP and CP scenarios, the most noticeable changes occur in the rural areas surrounding Zhengzhou, with multiple regions transitioning from poor to moderate ecosystem health. The villages near the urban area of Luoyang exhibit similar changes to those around Zhengzhou. Under the EP scenario, high-value areas mainly reside in the mountainous regions southwest of Luoyang. However, the proportion of villages with excellent ecosystem health experiences a decrease of 0.37%. Contrarily, the high-value areas near the Songshan Mountains decrease significantly under the ND scenario but improve under the EP and CP scenarios. In comparison to the EP scenario, the CP scenario lacks any areas with excellent ecosystem health, but it compensates by expanding the area of good ecosystem health in the rural areas southwest of Luoyang. Consequently, prioritizing the combination of ecological protection with cultivated land protection scenarios is crucial (Figure 14).

4. Discussion

4.1. Spatiotemporal Changes in Rural Ecosystem Health

This study employs the EVORS model, which integrates the present condition of the ecosystem with the impact of human activities on the ecological environment [73,80,81,82]. Traditional VOR models primarily focus on the ecosystem itself, while PSR models place emphasis on subjective judgment and causal relationships when constructing models [21]. In contrast to many studies that analyze ecosystem health at the city or district level over historical periods [38,39,83], this research concentrates on land use changes and ecosystem health within rural areas, specifically at the village level. The indicators used for evaluation unit selection were chosen based on village areas to distinctly highlight the rural context and provide informed policy recommendations for subsequent actions. Urban ecosystem health has long been a prominent topic among scholars [27,83,84,85,86,87], with numerous studies identifying a negative correlation between urbanization and ecosystem health. In the Yangtze River Delta urban agglomeration in China [27] and the metropolitan area of the lower Gangetic Plain in India [87], ecosystem health has deteriorated due to the advancement of urbanization. Urbanization mainly affects ecosystem health by altering the demand for both the quantity and type of ecosystem services, driven by population growth and agglomeration [83]. According to our assessment results, the ecosystem health level of the Zheng–Bian–Luo rural areas increased from 0.32 in 2000 to 0.35 in 2020, which indicates a divergent trend when compared to the changes in the urban ecosystem health [27,87]. The improvement in ecosystem health from 2000 to 2020 is a result of the combined effects of ecosystem vigor, organization, resilience, and service levels. In addition to ecosystem resilience, ecosystem vigor, organization, and service have improved, which is closely associated with the implementation of a series of ecological protection policies and measures in the rural areas of Zheng–Bian–Luo. Since 2003, these areas have progressively enacted the “Returning Farmland to Forest Project” and the “Natural Forest Protection Project” [88]. In 2018, the government established the “Forest Henan Ecological Construction Plan” to actively advance local forestry ecological development [88]. Actually, some research efforts have concentrated on rural ecosystem health, but the scale of these studies is still limited to the county or township units [44,45,47]. This study employs villages as the fundamental unit of analysis, as this approach more accurately captures the characteristics of local ecological health. The ecological environments and socio-economic conditions of various villages differ significantly; therefore, assessments conducted at the village level are better suited to accommodate these local variations. Furthermore, village-based evaluations can offer a scientific foundation for local governments and communities, thereby assisting in the development of ecological protection policies that are more aligned with the specific realities of each locality.

4.2. Simulation of Rural Ecosystem Health

Based on the ecosystem assessment framework and the PLUS model and elasticity analysis, this study examines the policies and planning of the Zheng–Bian–Luo area in order to optimize the land use structure and spatial layout, taking into consideration natural, locational, and socio-economic factors. We predict the land use and ecosystem spatial layout of the study area for 2035 under three different scenarios. The land use simulation results for 2035 yielded a Kappa coefficient of 0.777, an FoM coefficient of 0.122, and an overall simulation accuracy of 0.864, indicating a high level of accuracy and reliable simulation results. The ecosystem health of the Zheng–Bian–Luo rural area under the three development scenarios for 2035 exhibits notable changes compared to 2020. Particularly, the area with poor ecosystem health has significantly decreased, and none of the scenarios include areas with poor ecosystem health. This may be attributed to the government’s emphasis on ecological protection and the increase in ecological awareness. Figure 14 clearly depicts that the overall ecosystem health status is better under the EP scenario, with a more pronounced improvement trend. The CP scenario also shows a considerable expansion of areas with relatively good health levels, while the ND scenario results in poorer ecosystem health. Notably, none of the scenarios indicate poor health conditions, and the areas with poor and relatively poor health near the urban centers of Zhengzhou and Luoyang have significantly diminished. The simulation results indicate that land use changes under different development scenarios have a significant impact on ecosystem health. Under the ND scenario, ecosystem health exhibits a general decline, reflecting a trend of economic development at the expense of the environment. In contrast, the CP and EP scenarios, which prioritize the protection of important cultivated lands and ecological areas, maintain ecosystem health at relatively good levels or above. Current research has not concentrated on modeling the prospective condition of rural ecosystem health. Hua et al. [73] and Li et al. [78] conducted simulations to project the future health of the ecosystem in the Tianshan North Slope Urban Agglomeration and Chongqing. Their findings indicated that, under a natural development scenario, the health of the ecosystem exhibited a declining trend. Conversely, under a scenario prioritizing ecological protection, an improvement in ecosystem health was observed. These results align with our research findings in the Zheng–Bian–Luo rural areas. Furthermore, the simulation results of Hua et al. [73] indicate that the ecosystem health of the Tianshan North Slope Urban Agglomeration is expected to improve under the farmland protection priority scenario in the future. This finding is consistent with the results of our research conducted in the Zheng–Bian–Luo area. However, the ecosystem health simulation conducted by Hua et al. [73] encompasses the entire Tianshan North Slope Urban Agglomeration without a specific emphasis on rural regions. Consequently, it is challenging to offer targeted recommendations for improving ecosystem health in rural areas.
According to the findings of our study, the overall average ecosystem health values demonstrate that the EP scenario leads to an enhancement of ecosystem health in the Zheng–Bian–Luo rural area. Although the CP scenario does not achieve excellent ecosystem health levels and shows no significant change compared to the 2020 average, it does witness an expansion of areas with relatively good ecosystem health in the southwestern rural areas of Luoyang, which offers an advantage over the EP scenario. Therefore, a combined approach integrating the EP and CP scenarios should be pursued in order to harmonize ecological protection and cropland protection in rural areas, ensuring the health and stability of rural ecosystems. As land use continues to intensify with economic development, it is crucial to focus on both cultivated land and ecological protection in order to prevent significant decline and further deterioration of the ecosystem health in villages located in the Songshan Mountains and southwestern forested areas of Luoyang. Therefore, special attention must be given to the protection of ecological and cultivated lands. In the context of sustainable development, it is crucial to strengthen efforts to protect stable and high-quality cultivated lands and to implement zoned management and planning in the rural area of Zheng–Bian–Luo.

4.3. Policy Recommendations

In order to promote sustainable development in rural areas, the government should aim to achieve a harmonious balance between ecological conservation and economic growth. Dual efforts in ecological protection and cultivated land preservation are necessary for zoning and managing the rural area of Zheng–Bian–Luo. These measures will enhance land use efficiency and maintain the health and stability of rural ecosystems, thereby ensuring a suitable living environment and a high quality of life for local residents. Furthermore, this approach will provide theoretical support and scientific management for the subsequent integration of Zheng–Bian–Luo and the development of the Central Plains urban agglomeration. Based on the levels of ecosystem health, the following zoning management and policy recommendations should be implemented:
(1)
Health Improvement Zone: This zone includes villages with poor and relatively poor levels of ecosystem health near the urban areas of Zhengzhou, Kaifeng, and Luoyang. The government should scientifically plan ecological restoration areas, implement key restoration projects, and encourage and support public and societal participation. Measures should include the efficient utilization of resources to reduce development intensity, greening activities in ecologically degraded villages, and alleviation of ecosystem pressure.
(2)
Health Optimization Zone: This zone comprises villages with average levels of health in the plains areas of Zhengzhou, Kaifeng, and Luoyang, particularly between the mountainous and urban areas of Luoyang, between Songshan and Zhengzhou, and in most areas surrounding the outskirts of Kaifeng. Villages in these areas can focus on developing circular agriculture, promoting advanced ecological protection technologies, and planning land use patterns in a reasonable manner. Moreover, smart management levels should be enhanced, information transparency should be improved, and the regulatory system for ecosystem health should be strengthened. Additionally, cross-regional cooperation between Zhengzhou, Kaifeng, and Luoyang can be fostered to achieve better scientific management and improve ecosystem integrity and continuity.
(3)
Health Conservation Zone: This zone includes areas with high levels of health, such as the southwest mountainous regions of Luoyang, northern Xin’an County, and villages near Songshan. These areas are ecologically sensitive, and attention should be given to adjacent cultivated lands. To enhance supervision, it is crucial to improve and integrate policies and regulations for ecosystem health with digital technologies. Achieving a balance between tourism and ecological protection, as well as establishing appropriate ecological compensation mechanisms, are of utmost importance.
This study utilizes the EVORS model and multi-scenario land use simulation results to predict the ecosystem health status of the Zheng–Bian–Luo rural area under three scenarios. By doing so, it contributes to the existing research on ecosystem health in the region, providing a reliable foundation for future rural development planning and policy-making to support rural revitalization. Nonetheless, there are significant challenges in ecosystem health research, such as integrating interdisciplinary knowledge, handling complex ecosystem data, and assessing and predicting the impacts of human activities on ecosystems.

4.4. Methodological Limitations

This paper employs the EVORS model to analyze the results of multi-scenario land use simulations in order to forecast the health status of the ecosystem in the Zheng–Bian–Luo rural area across three distinct scenarios. This research not only enhances the existing literature on assessing different ecosystem health regions but also offers a robust foundation for future development planning and policy formulation in rural areas. This study utilizes villages as the unit of analysis, which offers advantages in terms of research scale. However, the difficulty in obtaining certain climate data and population change data at the village level, which may influence ecosystem health assessment, poses limitations to the research presented in this paper. This paper employs an elasticity approach to quantitatively analyze the impact of land use changes on ecosystem health; however, it overlooks the inherent complexity of ecosystem health itself. The evolution of ecosystem health is influenced by multiple factors. This study focuses solely on land use changes resulting from policy scenario alterations, neglecting other significant factors such as climate change and population dynamics. This represents a limitation of the research methodology. Future research should take a more comprehensive approach to understanding the factors that influence rural ecosystem health. It should also focus on developing more robust models to simulate future changes in rural ecosystem health accurately.

5. Conclusions

This study focuses on the Zheng–Bian–Luo rural area, examining changes in land use area and land use transition characteristics from 2000 to 2020. Utilizing the EVORS model, the spatiotemporal patterns of ecosystem health were assessed. The PLUS model was utilized to simulate three scenarios: ND, EP, and CP. These simulations predicted land use types and the corresponding ecosystem health status in 2035. The following conclusions were drawn:
(1)
From 2000 to 2020, the area of cultivated land in Zheng–Bian–Luo rural areas decreased, the area of forest land first decreased and then increased, and the area of construction land increased.
(2)
During the study period, ecosystem health improved as ecosystem vigor and services increased. From 2000 to 2020, low-value areas of ecosystem health showed a shrinking trend, most notably in Kaifeng.
(3)
The PLUS model yielded a Kappa coefficient of 0.777 and an FoM coefficient of 0.122, suggesting its suitability for simulating the 2035 land use status. The ND scenario shows the most significant expansion of construction land and the largest reduction in grassland. Cultivated land decreases under the ND and EP scenarios but increases under the CP scenario, reaching a size 1.14 times that of 2020.
(4)
The simulated average ecosystem health values for the ND, EP, and CP scenarios are 0.34, 0.37, and 0.35, respectively, in 2035. In comparison to 2020, no areas are identified as having poor ecosystem health levels, with the EP scenario exhibiting the best ecosystem health for the Zheng–Bian–Luo rural area in 2035. The ecosystem health near the Songshan Mountains, which was at an excellent level in 2020, experienced a significant decline under the ND and CP scenarios. However, when compared to the EP scenario, the CP scenario demonstrates advantages in improving the ecosystem health of the western rural areas of Luoyang and the southeastern agricultural areas of Kaifeng.
According to the simulation results of future rural ecosystem health, local governments should prioritize economic development while operating within the constraints of ecological protection and cultivated land preservation. This involves strengthening the protection of ecologically sensitive areas such as the Songshan Mountains and cultivated lands while appropriately promoting economic development in areas like Qi County in Kaifeng. The research methods and findings presented in this paper can serve as a valuable reference for assessing and managing ecosystem health in rural areas with similar characteristics.
This study employs an elasticity approach to simulate the future rural ecosystem health level but fails to account for the complexity of ecosystem health, as it focuses exclusively on land use changes driven by policy scenarios while neglecting other important factors like climate change and population dynamics. Future research should adopt a more holistic approach to understanding the various influences on rural ecosystem health and develop more robust models for predicting future changes.

Author Contributions

Conceptualization, H.W.; Funding acquisition, L.L.; Investigation, Y.M. and W.J.; Methodology, Q.H. and M.L.; Visualization, Q.H.; Writing—original draft, H.W.; Writing—review and editing, L.L., J.H. and W.F. All authors have read and agreed to the published version of the manuscript.

Funding

This research was funded by the National Key R&D Program of China (2021YFD1700900), the Key project of Henan Provincial Science and Technology R&D Plan Joint Fund (225200810045), and the Humanities and Social Sciences Research Program of Henan Province Colleges and Universities (2023-ZZJH-098).

Data Availability Statement

The data presented in this study are available on request from the corresponding author.

Conflicts of Interest

The authors declare no conflicts of interest.

References

  1. Manggat, I.; Zain, R.; Jamaluddin, Z. The Impact of Infrastructure Development on Rural Communities: A Literature Review. Int. J. Acad. Res. Bus. Soc. Sci. 2018, 8, 637–648. [Google Scholar] [CrossRef] [PubMed]
  2. Wang, Y.; Zhao, N.; Lei, X.; Long, R. Green Finance Innovation and Regional Green Development. Sustainability 2021, 13, 8230. [Google Scholar] [CrossRef]
  3. Ahn, S.R.; Kim, S.J. Assessment of integrated watershed health based on the natural environment, hydrology, water quality, and aquatic ecology. Hydrol. Earth Syst. Sci. 2017, 21, 5583–5602. [Google Scholar] [CrossRef]
  4. Allen, E. Forest Health Assessment in Canada. Ecosyst. Health 2001, 7, 28–34. [Google Scholar] [CrossRef]
  5. Rapport, D.J. What constitutes ecosystem health? Perspect. Biol. Med. 1989, 33, 120–132. [Google Scholar] [CrossRef]
  6. Schaeffer, D.J.; Herricks, E.E.; Kerster, H.W. Ecosystem health: I. Measuring ecosystem health. Environ. Manag. 1988, 12, 445–455. [Google Scholar] [CrossRef]
  7. Costanza, R. Toward an Operational Definition of Ecosystem Health. In Ecosystem Health: New Goals for Environmental Management; Island Press: Washington, DC, USA, 1992; pp. 239–269. [Google Scholar]
  8. Fu, B.J.; Liu, S.L.; Ma, K.M. The contents and methods of integrated ecosystem assessment (IEA). Acta Ecol. Sin. 2001, 21, 1885–1892. [Google Scholar]
  9. Xiao, F.; Ouyang, H. Ecosystem Health and Its Evolution Indicator and Method. J. Nat. Resour. 2002, 2, 203–209. [Google Scholar]
  10. Cui, B.S.; Yang, Z.F. Research review on wetland ecosystem health. China J. Ecol. 2001, 20, 31–36. [Google Scholar]
  11. Sun, Y.; Zhou, Y.M.; Zhang, Q.W. Ecosystem Health: Theory, Concept and Assessment Methods. Adv. Earth Sci. 2011, 26, 887–896. [Google Scholar]
  12. Huo, Z.; Wang, J. Assessment on Ecological Health in Northwest Conservation Area of Beijing City Based on PSR Model. China Land Sci. 2020, 34, 105–112. [Google Scholar]
  13. Zhou, Q.; Peng, C.; Liu, X.; Xiang, Y.; Zhou, L. Ecosystem health assessment of water level fluctuating zone in three gorges reservoir area based on VOR model. Res. Soil Water Conserv. 2022, 29, 310–318. [Google Scholar]
  14. Chen, W.X.; Zhao, X.L.; Zhong, M.X.; Li, J.F.; Zeng, J. Spatiotemporal evolution patterns of ecosystem health in the Middle Reaches of the Yangtze River Urban Agglomerations. Acta Ecol. Sin. 2022, 42, 138–149. [Google Scholar]
  15. Bi, X.; Fu, Y.; Wang, P.; Zhang, Y.; Yang, Z.; Hou, F.; Li, B. Ecosystem health assessment based on deep learning in a mountain-basin system in Central Asia’s arid regions, China. Ecol. Indic. 2024, 165, 112148. [Google Scholar] [CrossRef]
  16. Xu, W.; He, M.; Meng, W.; Zhang, Y.; Yun, H.; Lu, Y.; Huang, Z.; Mo, X.; Hu, B.; Liu, B.; et al. Temporal-spatial change of China’s coastal ecosystems health and driving factors analysis. Sci. Total Environ. 2022, 845, 157319. [Google Scholar] [CrossRef]
  17. Ye, D.; Yang, L.; Zhou, M. Spatiotemporal Variation in Ecosystem Health and Its Driving Factors in Guizhou Province. Land 2023, 12, 1439. [Google Scholar] [CrossRef]
  18. Yuan, M.; Liu, Y.; Wang, M.; Tian, L.; Peng, J. Ecosystem health assessment based on the framework of vigor, organization, resilience and contribution in Guangzhou City. Chin. J. Ecol. 2019, 38, 1249–1257. [Google Scholar]
  19. Li, Y.; Deng, M.; Fang, G.; Lu, Y.; Sun, C.; Zhu, Z. Ecosystem health evaluation based on land use change—Case study of the riparian zone of the Yangtze River in Jiangsu Province, China. Environ. Monit. Assess. 2024, 196, 206. [Google Scholar] [CrossRef]
  20. Wu, W.; Hu, J.; Song, D. Assessment of marine ecosystem health and its key influencing factors in Laizhou Bay, China. Front. Mar. Sci. 2023, 10, 1115896. [Google Scholar] [CrossRef]
  21. Wei, H.; Han, Q.; Yang, Y.; Li, L.; Liu, M. Spatial Heterogeneity of Watershed Ecosystem Health and Identification of Its Influencing Factors in a Mountain–Hill–Plain Region, Henan Province, China. Remote Sens. 2023, 15, 3751. [Google Scholar] [CrossRef]
  22. Chen, W. A multi-scale assessment of ecosystem health based on the Pressure-State-Response framework: A case in the Middle Reaches of the Yangtze River Urban Agglomerations, China. Environ. Sci. Pollut. Res. 2022, 29, 29202–29219. [Google Scholar] [CrossRef]
  23. Shen, W.; Li, Y.; Qin, Y. Research on the influencing factors and multi-scale regulatory pathway of ecosystem health: A case study in the Middle Reaches of the Yellow River, China. J. Clean. Prod. 2023, 406, 137038. [Google Scholar] [CrossRef]
  24. Yang, L.; Chen, W.; Pan, S.; Zeng, J.; Yuan, Y.; Gu, T. Spatial relationship between land urbanization and ecosystem health in the Yangtze River Basin, China. Environ. Monit. Assess. 2023, 195, 957. [Google Scholar] [CrossRef]
  25. Wu, S.; Tian, C.; Li, B.; Wang, J.; Wang, Z. Ecological environment health assessment of lake water ecosystem system based on simulated annealing-projection pursuit: A case study of plateau lake. Sustain. Cities Soc. 2022, 86, 104131. [Google Scholar] [CrossRef]
  26. Guo, Y.; Xu, D.; Xu, J.; Yang, Z. Multi-Scale Analysis of Spatial and Temporal Evolution of Ecosystem Health in the Harbin–Changchun Urban Agglomeration, China. Sustainability 2024, 16, 837. [Google Scholar] [CrossRef]
  27. Qiao, W.; Huang, X. The impact of land urbanization on ecosystem health in the Yangtze River Delta urban agglomerations, China. Cities 2022, 130, 103981. [Google Scholar] [CrossRef]
  28. Ashraf, A.; Haroon, M.A.; Ahmad, S.; Abowarda, A.S.; Wei, C.Y.; Liu, X.H. Use of remote sensing-based pressure-state-response framework for the spatial ecosystem health assessment in Langfang, China. Environ. Sci. Pollut. Res. 2023, 30, 89395–89414. [Google Scholar] [CrossRef]
  29. Hasani, S.S.; Mojtahedi, A.; Reshadi, M.A.M. Development of a novel fuzzy logic-based wetland health assessment approach for the management of freshwater wetland ecosystems. Wetlands 2021, 41, 100. [Google Scholar] [CrossRef]
  30. Wu, C.; Chen, W. Indicator system construction and health assessment of wetland ecosystem-Taking Hongze Lake Wetland, China as an example. Ecol. Indic. 2020, 112, 106164. [Google Scholar] [CrossRef]
  31. Das, S.; Pradhan, B.; Shit, P.K.; Alamri, A.M. Assessment of Wetland Ecosystem Health Using the Pressure–State–Response (PSR) Model: A Case Study of Mursidabad District of West Bengal (India). Sustainability 2020, 12, 5932. [Google Scholar] [CrossRef]
  32. Zhao, H.; Wang, G.; Song, Y.; Zhao, Q. Evaluation of ecosystem health in Futian mangrove wetland based on the PSR-AHP model. Appl. Math. Nonlinear Sci. 2022, 7, 985–998. [Google Scholar] [CrossRef]
  33. Bai, X.L.; Wang, L.X.; Ji, S.X.; Chen, Z.X.; Chang, X.L. Assessment of ecosystem health in grassland-desert ecotone in northern Ordos: A case study of Ten Tributaries Basin. J. Desert Res. 2020, 40, 187–194. [Google Scholar]
  34. Soubry, I.; Doan, T.; Chu, T.; Guo, X. A Systematic Review on the Integration of Remote Sensing and GIS to Forest and Grassland Ecosystem Health Attributes, Indicators, and Measures. Remote Sens. 2021, 13, 3262. [Google Scholar] [CrossRef]
  35. Wang, K.; Cao, C.; Xie, B.; Xu, M.; Yang, X.; Guo, H.; Duerler, R.S. Analysis of the Spatial and Temporal Evolution Patterns of Grassland Health and Its Driving Factors in Xilingol. Remote Sens. 2022, 14, 5179. [Google Scholar] [CrossRef]
  36. Wu, Z.; Lei, S.; Lu, Q.; Bian, Z.; Ge, S. Spatial distribution of the impact of surface mining on the landscape ecological health of semi-arid grasslands. Ecol. Indic. 2020, 111, 105996. [Google Scholar] [CrossRef]
  37. Zhou, Y.; Yue, D.; Li, S.; Liang, G.; Chao, Z.; Zhao, Y.; Meng, X. Ecosystem health assessment in debris flow-prone areas: A case study of Bailong River Basin in China. J. Clean. Prod. 2022, 357, 131887. [Google Scholar] [CrossRef]
  38. Li, H.; Wan, H.; Sun, L.; Liu, Y.; Li, L.; Wang, Y. Remote sensing assessment and key driving factors of ecosystem health in Xinjiang. Arid Land Geogr. 2021, 44, 460–470. [Google Scholar]
  39. Yao, Y.; Li, S.; Su, M.; Liao, L.; Xu, C.; Yue, W. County ecosystem health assessment: A case study of 32 counties in Dongguan City, China. Acta Ecol. Sin. 2021, 41, 5998–6011. [Google Scholar]
  40. Das, M.; Inácio, M.; Das, A.; Barcelo, D.; Pereira, P. Mapping and Assessment of Ecosystem Health in the Vilnius Functional Zone (Lithuania). Sci. Total Environ. 2024, 912, 168891. [Google Scholar] [CrossRef]
  41. Brisbois, M.C.; Jamieson, R.; Gordon, R.; Stratton, G.; Madani, A. Stream ecosystem health in rural mixed land-use watersheds. J. Environ. Eng. Sci. 2008, 7, 439–452. [Google Scholar] [CrossRef]
  42. Connell, D.J. Sustainable Livelihoods and Ecosystem Health: Exploring Methodological Relations as a Source of Synergy. EcoHealth 2010, 7, 351–360. [Google Scholar] [CrossRef]
  43. Javaid, M.; Shafi, A.; Hamid, A.; Jehangir, A.; Yousuf, A. Dynamics of the wetland ecosystem health in urban and rural settings in high altitude ecoregion. Sci. Total Environ. 2023, 904, 166566. [Google Scholar] [CrossRef]
  44. Xu, Y.; Chen, Q.; Zeng, H. Rural Ecosystem Health Assessment and Spatial Divergence—A Case Study of Rural Areas around Qinling Mountain, Shaanxi Province, China. Sustainability 2024, 16, 6323. [Google Scholar] [CrossRef]
  45. Xiao, Z.; Liu, R.; Gao, Y.; Yang, Q.; Chen, J. Spatiotemporal variation characteristics of ecosystem health and its driving mechanism in the mountains of southwest China. J. Clean. Prod. 2022, 345, 131138. [Google Scholar] [CrossRef]
  46. Peng, J.; Liu, Y.; Li, T.; Wu, J. Regional ecosystem health response to rural land use change: A case study in Lijiang City, China. Ecol. Indic. 2017, 72, 399–410. [Google Scholar] [CrossRef]
  47. Liu, Y.; Yang, C.; Tan, S.; Zhou, H.; Zeng, W. An approach to assess spatio-temporal heterogeneity of rural ecosystem health: A case study in Chongqing mountainous area, China. Ecol. Indic. 2022, 136, 108644. [Google Scholar] [CrossRef]
  48. Lei, D.; Zhang, Y.; Ran, Y.; Gao, L.; Li, J.; Li, Z.; Mo, J.; Liu, X. Assessment of ecosystem health based on landscape pattern in ecologically fragile regions at different spatial scales: A case study of dianchi lake basin, China. Front. Environ. Sci. 2023, 11, 1076344. [Google Scholar] [CrossRef]
  49. Liu, Y.; Xu, N.; Zeng, H. Ecosystem health assessment and its scale dependence in the coastal region of the East China Sea. Acta Ecol. Sin. 2022, 42, 9913–9926. [Google Scholar]
  50. Ren, Y.; Lü, Y.; Comber, A.; Fu, B.; Harris, P.; Wu, L. Spatially explicit simulation of land use/land cover changes: Current coverage and future prospects. Earth-Sci. Rev. 2019, 190, 398–415. [Google Scholar] [CrossRef]
  51. Yang, S.; Su, H.; Zhao, G. Multi-scenario simulation of urban ecosystem service value based on PLUS model: A case study of Hanzhong city. J. Arid. Land Resour. Environ. 2022, 36, 86–95. [Google Scholar]
  52. Shi, J.; Shi, P.; Wang, Z.; Wang, L.; Li, Y. Multi-Scenario Simulation and Driving Force Analysis of Ecosystem Service Value in Arid Areas Based on PLUS Model: A Case Study of Jiuquan City, China. Land 2023, 12, 937. [Google Scholar] [CrossRef]
  53. Lou, Y.; Yang, D.; Zhang, P.; Zhang, Y.; Song, M.; Huang, Y.; Jing, W. Multi-Scenario Simulation of Land Use Changes with Ecosystem Service Value in the Yellow River Basin. Land 2022, 11, 992. [Google Scholar] [CrossRef]
  54. Wang, B.; Chen, H.; Dong, Z.; Zhu, W.; Qiu, Q.; Tang, L. Impact of land use change on the water conservation service of ecosystems in the urban agglomeration of the Golden Triangle of Southern Fujian, China, in 2030. Acta Ecol. Sin. 2020, 40, 484–498. [Google Scholar]
  55. Liu, K.; Zhang, C.; Zhang, H.; Xu, H.; Xia, W. Spatiotemporal Variation and Dynamic Simulation of Ecosystem Carbon Storage in the Loess Plateau Based on PLUS and InVEST Models. Land 2023, 12, 1065. [Google Scholar] [CrossRef]
  56. Li, P.; Chen, J.; Li, Y.; Wu, W. Using the InVEST-PLUS Model to Predict and Analyze the Pattern of Ecosystem Carbon storage in Liaoning Province, China. Remote Sens. 2023, 15, 4050. [Google Scholar] [CrossRef]
  57. Zhao, H.; Guo, B.; Wang, G. Spatial–Temporal Changes and Prediction of Carbon Storage in the Tibetan Plateau Based on PLUS-InVEST Model. Forests 2023, 14, 1352. [Google Scholar] [CrossRef]
  58. Zhang, D. Study on the Value of Cultural Ecosystem Service in Rural Area—A Case of Huzhou, Zhejiang Province; Zhejiang University: Hangzhou, China, 2021. [Google Scholar]
  59. Yan, F.; Shangguan, W.; Zhang, J.; Hu, B. Depth-to-bedrock map of China at a spatial resolution of 100 meters. Sci. Data 2020, 7, 1–13. [Google Scholar] [CrossRef]
  60. Wu, Y.; Shi, K.; Chen, Z.; Liu, S.; Chang, Z. Developing Improved Time-Series DMSP-OLS-Like Data (1992–2019) in China by Integrating DMSP-OLS and SNPP-VIIRS. IEEE Trans. Geosci. Remote Sens. 2022, 60, 4407714. [Google Scholar] [CrossRef]
  61. Zhu, W.Q.; Pan, Y.Z.; Zhang, J.S. Estimation of net primary productivity of Chinese terrestrial Vegetation based on remote sensing. J. Plant Ecol. 2007, 31, 413–424. [Google Scholar]
  62. Han, P.; Hu, H.; Zhou, J.; Wang, M.; Zhou, Z. Integrating key ecosystem services to study the spatio-temporal dynamics and determinants of ecosystem health in Wuhan’s central urban area. Ecol. Indic. 2024, 166, 112352. [Google Scholar] [CrossRef]
  63. Peng, J.; Liu, Y.; Wu, J.; Lv, H.; Hu, X. Linking Ecosystem Services and Landscape Patterns to Assess Urban Ecosystem Health: A Case Study in Shenzhen City, China. Landsc. Urban Plan. 2015, 143, 56–68. [Google Scholar] [CrossRef]
  64. Sharp, R.; Douglass, J.; Wolny, S.; Arkema, K.; Bernhardt, J.; Bierbower, W.; Chaumont, N.; Denu, D.; Fisher, D.; Glowinski, K.; et al. InVEST 3.10.2. User’s Guide; The Natural Capital Project; Stanford University: Stanford, CA, USA, 2020. [Google Scholar]
  65. Meng, Q.; Zhang, L.; Wei, H.; Cai, E.; Xue, D.; Liu, M. Linking Ecosystem Service Supply–Demand Risks and Regional Spatial Management in the Yihe River Basin, Central China. Land 2021, 10, 843. [Google Scholar] [CrossRef]
  66. Xie, G.; Zhen, L.; Lu, C.-X.; Xiao, Y.; Chen, C. Expert knowledge based valuation method of ecosystem services in China. J. Nat. Resour. 2008, 23, 911–919. (In Chinese) [Google Scholar]
  67. Zhou, Y.; Li, X.; Liu, Y. Land use change and driving factors in rural China during the period 1995–2015. Land Use Policy 2020, 99, 105048. [Google Scholar] [CrossRef]
  68. Wang, J.; Chen, Y.; Shao, X.; Zhang, Y.; Cao, Y. Land-use changes and policy dimension driving forces in China: Present, trend and future. Land Use Policy 2012, 29, 737–749. [Google Scholar] [CrossRef]
  69. Allan, A.; Soltani, A.; Abdi, M.H.; Zarei, M. Driving Forces behind Land Use and Land Cover Change: A Systematic and Bibliometric Review. Land 2022, 11, 1222. [Google Scholar] [CrossRef]
  70. Liu, J.; Zhang, Z.; Xu, X.; Kuang, W.; Zhou, W.; Zhang, S.; Li, R.; Yan, C.; Yu, D.; Wu, S.; et al. Spatial patterns and driving forces of land use change in China during the early 21st century. J. Geogr. Sci. 2010, 20, 483–494. [Google Scholar] [CrossRef]
  71. Wang, Z.; Guo, M.; Zhang, D.; Chen, R.; Xi, C.; Yang, H. Coupling the Calibrated GlobalLand30 Data and Modified PLUS Model for Multi-Scenario Land Use Simulation and Landscape Ecological Risk Assessment. Remote Sens. 2023, 15, 5186. [Google Scholar] [CrossRef]
  72. Zhou, Y.; Geng, J.; Liu, X. Urban Habitat Quality Enhancement and Optimization under Ecological Network Constraints. Land 2024, 13, 1640. [Google Scholar] [CrossRef]
  73. Hua, Z.; Ma, J.; Sun, Y.; Yang, Y.; Zhu, X.; Chen, F. Multi-Scenario Simulating the Impacts of Land Use Changes on Ecosystem Health in Urban Agglomerations on the Northern Slope of the Tianshan Mountain, China. Land 2024, 13, 571. [Google Scholar] [CrossRef]
  74. Zhang, J.; Ding, H.; Xu, J.; Zheng, B. A Simulation-Based Prediction of Land Use Change Impacts on Carbon Storage from a Regional Imbalance Perspective: A Case Study of Hunan Province, China. Land 2024, 13, 1721. [Google Scholar] [CrossRef]
  75. State Bureau of Surveying and Mapping. Rules for Grading Agricultural Land [TD/T 1005-2003]; China Standards Publishing House: Beijing, China, 2003. [Google Scholar]
  76. Dong, G.; Ge, Y.; Jia, H.; Sun, C.; Pan, S. Land Use Multi-Suitability, Land Resource Scarcity and Diversity of Human Needs: A New Framework for Land Use Conflict Identification. Land 2021, 10, 1003. [Google Scholar] [CrossRef]
  77. Liang, X.; Guan, Q.; Clarke, K.C.; Liu, S.; Wang, B.; Yao, Y. Understanding the drivers of sustainable land expansion using a patch-generating land use simulation (PLUS) model: A case study in Wuhan, China. Comput. Environ. Urban Syst. 2021, 85, 101569. [Google Scholar] [CrossRef]
  78. Li, W.; Kang, J.; Wang, Y. Identifying the contribution and spatial effects of land use conversion on ecosystem health in Chongqing: A multi-scenario simulation perspective. Ecol. Indic. 2024, 165, 112232. [Google Scholar] [CrossRef]
  79. Song, W.; Deng, X.Z. Land-use/land-cover change and ecosystem service provision in China. Sci. Total Environ. 2016, 576, 705–719. [Google Scholar] [CrossRef]
  80. Mallick, J.; Al Qadhi, S.; Talukdar, S.; Pradhan, B.; Bindajam, A.A.; Islam, A.R.M.T.; Dajam, A.S. A Novel Technique for Modeling Ecosystem Health Condition: A Case Study in Saudi Arabia. Remote Sens. 2021, 13, 2632. [Google Scholar] [CrossRef]
  81. Chen, W.; Gu, T.; Xiang, J.; Luo, T.; Zeng, J.; Yuan, Y. Ecological restoration zoning of territorial space in China: An ecosystem health perspective. J. Environ. Manag. 2024, 364, 121371. [Google Scholar] [CrossRef]
  82. Wang, X.; Yao, W.; Luo, Q.; Yun, J. Spatial relationship between ecosystem health and urbanization in coastal mountain city, Qingdao, China. Ecol. Inform. 2024, 79, 102458. [Google Scholar] [CrossRef]
  83. Liu, R.; Dong, X.; Wang, X.; Zhang, P.; Liu, M.; Zhang, Y. Relationship and driving factors between urbanization and natural ecosystem health in China. Ecol. Indic. 2023, 147, 109972. [Google Scholar] [CrossRef]
  84. Chen, W.; Wang, G.; Zeng, J. Impact of urbanization on ecosystem health in Chinese urban agglomerations. Environ. Impact Assess. Rev. 2023, 98, 106964. [Google Scholar] [CrossRef]
  85. Wu, J.; Cheng, D.; Xu, Y.; Huang, Q.; Feng, Z. Spatial-temporal change of ecosystem health across China: Urbanization impact perspective. J. Clean. Prod. 2021, 326, 129393. [Google Scholar] [CrossRef]
  86. Li, W.; Xie, S.; Wang, Y.; Huang, J.; Cheng, X. Effects of urban expansion on ecosystem health in Southwest China from a multi-perspective analysis. J. Clean. Prod. 2021, 294, 126341. [Google Scholar] [CrossRef]
  87. Das, M.; Das, A.; Pereira, P.; Mandal, A. Exploring the Spatio-Temporal Dynamics of Ecosystem Health: A Study on a Rapidly Urbanizing Metropolitan Area of Lower Gangetic Plain, India. Ecol. Indic. 2021, 125, 107584. [Google Scholar] [CrossRef]
  88. Wei, H.; Xue, D.; Huang, J.; Liu, M.; Li, L. Identification of Coupling Relationship between Ecosystem Services and Urbanization for Supporting Ecological Management: A Case Study on Areas along the Yellow River of Henan Province. Remote Sens. 2022, 14, 2277. [Google Scholar] [CrossRef]
Figure 1. Location of the study area.
Land 13 01788 g001
Figure 2. Technology roadmap.
Land 13 01788 g002
Figure 3. Influence factor of PLUS model selection. Note: (a) GDP; (b) Distance to national road; (c) Distance to provincial government; (d) Distance to provincial road; (e) Distance to municipal government; (f) Distance to county government; (g) Distance to county road; (h) Distance to township government; (i) Distance to township road; (j) Distance to village settlements; (k) Distance to water bodies; (l) Distance to highway; (m) Distance to railway; (n) DEM; (o) Annual average rainfall; (p) Slope; (q) Population density; (r) Aspect; (s) Annual average temperature.
Land 13 01788 g003
Figure 4. Land use type area change in rural areas of Zhengzhou, Kaifeng, and Luoyong from 2000 to 2020.
Land 13 01788 g004
Figure 5. Land use type transfer in rural areas of Zhengzhou, Kaifeng, and Luoyang from 2000 to 2020.
Land 13 01788 g005
Figure 6. Ecosystem vigor in rural areas of Zheng–Bian–Luo rural areas.
Land 13 01788 g006
Figure 7. Ecosystem organizations in Zheng–Bian–Luo rural areas.
Land 13 01788 g007
Figure 8. Ecosystem resilience in the rural areas of Zhengzhou, Kaifeng, and Luoyang.
Land 13 01788 g008
Figure 9. Ecosystem services in the rural areas of Zhengzhou, Kaifeng, and Luoyang.
Land 13 01788 g009
Figure 10. Proportional stacking map for ecosystem health classification in rural areas of Zheng–Bian–Luo.
Land 13 01788 g010
Figure 11. Ecosystem health in rural areas of Zheng–Bian–Luo.
Land 13 01788 g011
Figure 12. Land use simulation under multiple scenarios in Zheng–Bian–Luo rural area in 2035.
Land 13 01788 g012
Figure 13. Ecosystem health accumulation map under three development scenarios. Note: ND—Natural Development; EP—Ecological Protection; CP—Cropland Protection. The same as below.
Land 13 01788 g013
Figure 14. Ecosystem health under multiple scenarios in Zheng–Bian–Luo rural area in 2035.
Land 13 01788 g014
Table 1. Data sources and their uses.
Data NameData FormatData SourceData Use
DEMRaster datahttp://www.gscloud.cn/search
(accessed on 16 June 2023)
Obtain DEM, extract slope and aspect
Land Use Remote Sensing DataRaster datahttp://www.resdc.cn/
(accessed on 8 June 2023)
Basic parameter input for simulating NPP and InVEST model
MOD13Q1Raster dataNASA website (https://www.nasa.gov/
(accessed on 4 June 2023))
Obtain NDVI data
Global Land Cover Data China SubsetRaster dataCold and Arid Regions Science Data Center
(http://bdc.casnw.net/index.shtml
(accessed on 12 September 2023))
Obtain vegetation-type data for the study area
Soil Texture and Soil Organic Matter ContentRaster dataCold and Arid Regions Science Data Center
(http://bdc.casnw.net/index.shtml
(accessed on 12 September 2023))
Basic parameter input for the InVEST model
Root Depth Data [59]Raster dataSun Yat-sen University Land-Atmosphere Interaction Research Group
(http://globalchange.bnu.edu.cn/research
(accessed on 15 May 2023))
Basic parameter input for the InVEST model
Temperature, Precipitation, and Potential Evapotranspiration DataList datahttp://data.cma.cn/
(accessed on 19 July 2022)
Input for the InVEST model and PLUS model
Food Production, County Population, and Regional GDPStatistical dataHenan Statistical Yearbook, various county statistical bureausStudy area overview, food supply
Night Light Index [60]Raster dataAn improved time–series DMSP–OLS–like data (1992–2021) in China by integrating DMSP–OLS and SNPP–VIIRS—Harvard DataverseInput for the PLUS model
GDP, Population DensityRaster datahttps://www.resdc.cn/
(accessed on 8 June 2023)
Input for the PLUS model
Table 2. Quantification methods of ecosystem services.
Ecosystem ServicesIndicatorMethodFormula Description
Provisioning ServicesFood ProductionMapping statistical food production data using the notable linear correlation observed between NDVI and yields of crops and livestock products [21,65].
G i = G s u m × N D V I i N D V I s u m
Gi is the food supply of grid i, Gsum is the total food production, NDVIi is the NDVI of grid i, and NDVIsum is the sum of NDVI values of cultivated land.
Regulating ServicesWater YieldQuantitative calculation of each grid’s water yield based on the water balance principle, utilizing the discrepancy between precipitation and actual evapotranspiration as per the water yield module in the InVEST model [64].
W Y ( x ) = ( 1 A E F ( x ) P ( x ) ) × P ( x )
WY(x) is the water yield of grid x (mm), AEF(x) is the annual actual evapotranspiration of grid x (mm), and P(x) is the annual precipitation of grid x (mm).
Carbon StorageCalculation of carbon storage considering four carbon pools: aboveground, belowground, soil, and dead organic matter according to the InVEST model carbon storage module [64].
C S t o t a l = C S a b o v e + C S b e l o w + C S s o i l + C S d e a d
CStotal is the total carbon storage, CSabove is the aboveground biomass carbon storage, CSblow is the belowground biomass carbon storage, CSsoil is the soil carbon storage, and CSdead is the dead organic matter carbon storage.
Water PurificationCalculation of water purification considering the purification of Total Nitrogen and Total Phosphorus according to the InVEST model water purification module [64].
A L V i = H S S i × p o l i
AIVi is the load value of grid unit i, poli is the output coefficient of grid unit i, and HSSi is the hydrological sensitivity score of grid unit i.
Supporting ServicesSoil RetentionEstimated using the Universal Soil Loss Equation (USLE), considering the plot’s ability to intercept upstream sediments [21].
S C = R K L S - U S L E = R × K × L S × ( 1 - C P )
SC is the soil retention, RKLS and USLE are the potential and actual erosion amounts (t·hm−2·a−1), respectively, R is the rainfall erosivity factor (MJ·mm·hm−2·h−1 a−1), K is the soil erodibility factor (t·hm2·h·MJ−1·mm−1·hm2), LS is the topographic factor, C is the vegetation cover factor, and P is the soil conservation management factor.
Habitat QualityCalculation of habitat quality considering the threat of settlements, farming, roads and population according to the InVEST model water purification module [64].
Q x j = H j × ( 1 ( D x j z / ( D x j z + k z ) ) )
Qxj is the habitat quality index of land use/cover type j in grid unit x, Hj is the habitat suitability of land use/cover type j, Dx is the habitat degradation degree of land use/cover type j in grid unit x, k is the half-saturation constant (half of the maximum degradation), and z is the normalization constant (a default parameter in the model).
Cultural ServicesCultural ServicesMeasured based on the value equivalent method [66] and appropriately adjusted using three crops: wheat, corn, and peanuts.
D = i = 1 n m i p i q i M
D is the cultural service value per equivalent factor (CNY/ha), i is the crop type, mi is the planting area of crop i (ha), pi is the national average price of crop i in a certain year (CNY/kg), qi is the unit area yield of crop i (kg/ha), and M is the total planting area of all crops (ha).
Table 3. Scenario settings for PLUS model multi-scenario development.
Scenario ModeScenario Description
Natural Development (ND) ScenarioBased on the land use expansion rate from 2000 to 2020, without altering the land use conversion probability.
Ecological Protection (EP) ScenarioFollows ecological protection principles. Due to data limitations, only natural reserves are set as restricted expansion areas. The conversion probability of forest and grassland to construction land is reduced by 50%, and the reduced land area is added to forest and grassland. The conversion probability from cultivated land to construction land is decreased by 30%, and the conversion probability from forest land to cultivated land is reduced by 50%. The decreased proportions are reallocated to the probability of cultivated land converting to forest land.
Cropland Protection (CP) Scenario Overlays cultivated land data from 2000 to 2020, selecting areas that were consistently cultivated land over five years as long-term stable cultivated land. Additionally, high-quality cultivated land with slopes less than 6° is extracted based on the Agricultural Land Grading Procedures and previous studies [75,76], and these areas are merged as restricted conversion zones.
Table 4. Comparison of actual land use and modeling in 2020.
Land Use TypeActual SituationSimulated SituationError
Area (km2)Proportion (%)Area (km2)Proportion (%)Area (km2)Proportion (%)
Cropland10,729.49155.31810,933.68656.371204.1951.053
Forestland5066.15226.1204892.35325.224173.7990.896
Grassland1476.8777.6141370.9277.068105.9500.546
Water283.1861.460269.7081.39113.4780.069
Construction Land1836.3619.4681926.2199.93189.8580.463
Unused land3.9410.0203.1150.0160.8260.004
Table 5. Dynamic degrees of land use types in Zheng–Bian–Luo rural area (2000–2020).
PeriodCroplandForestlandGrasslandWaterConstruction LandUnused Land
2000–2005−0.09−0.02−0.021.810.66−6.34
2005–2010−0.08−0.63−2.29−1.216.86−11.55
2010–2015−0.250.02−0.081.161.4840.95
2015–2020−0.340.270.330.451.01−5.02
2000–2020−0.19−0.09−0.520.542.83−1.70
Disclaimer/Publisher’s Note: The statements, opinions and data contained in all publications are solely those of the individual author(s) and contributor(s) and not of MDPI and/or the editor(s). MDPI and/or the editor(s) disclaim responsibility for any injury to people or property resulting from any ideas, methods, instructions or products referred to in the content.

