Abstract
Soil erosion due to rainfall is a critical environmental issue in North Korea, exacerbated by deforestation and climate change. This study aims to estimate rainfall erosivity (RE) in North Korea using automated machine learning (AutoML), with a particular focus on regional soil erosion risks. North Korean data were sourced from the European Centre for Medium-Range Weather Forecasts (ECMWF) ReAnalysis 5 dataset, while South Korean data were obtained from the Korea Meteorological Administration. Data from 50 stations in South Korea (2013–2019) and 27 stations in North Korea (1980–2020) were used. The GradientBoostingRegressor (GBR) model, optimized using the Tree-based Pipeline Optimization Tool (TPOT), was trained on South Korean data. The model’s performance was evaluated using metrics such as the root mean square error (RMSE), mean absolute error (MAE), and coefficient of determination (R2), achieving high predictive accuracy across eight stations in South Korea. Using the optimized model, RE in North Korea was estimated, and the spatial distribution of RE was analyzed using the Kriging interpolation. Results reveal significant regional variability, with the southern and western areas displaying the highest erosivity. These findings provide valuable insights into soil erosion management and the development of sustainable agricultural and environmental strategies in North Korea.
1. Introduction
Globally, soil erosion management has emerged as a critical issue in environmental conservation and resource management, particularly in relation to agricultural productivity, water quality management, and ecosystem protection [1,2,3]. In North Korea, the problem of soil erosion is especially severe due to the country’s high reliance on agriculture and its mountainous terrain, which exacerbates soil loss during rainfall events [4,5].
Additionally, forest degradation has significantly exacerbated soil erosion in North Korea [6,7]. Land clearing, fuelwood collection, timber export, and indiscriminate logging for disaster recovery have degraded forest ecosystems, reducing their ability to protect and stabilize soil. The loss of forest cover weakens soil cohesion and increases exposure to rainfall, accelerating erosion, especially on steep slopes [8]. Climate change further compounds these challenges by altering precipitation patterns and increasing the frequency of extreme weather events. North Korea had experienced a decline in overall annual rainfall but an increase in rainfall intensity, which is strongly linked to higher soil erosion rates. This combination of forest degradation and changing rainfall patterns poses a heightened risk to soil stability, leading to adverse effects on agricultural productivity and water quality [8].
To address this, the North Korean government has implemented various policies, such as forest restoration plans and the enactment of forest laws aimed at forest conservation. However, due to high reliance on fuelwood, short-term reforestation efforts, and insufficient post-restoration management, deforestation has continued, preventing a fundamental solution to the soil erosion problem [8,9]. Consequently, proactive measures to tackle soil erosion are urgently needed to protect North Korea’s agricultural lands, ecosystems, and water resources.
One of the most commonly used methods for estimating annual soil loss is the Revised Universal Soil Loss Equation (RUSLE), developed by the U.S. Department of Agriculture (USDA) [10,11]. This empirical model is used to estimate soil loss and is based on parameters from the Universal Soil Loss Equation (USLE), which has been modified to reflect factors such as land cover and complex terrain conditions. RUSLE estimates annual soil loss using five main factors: rainfall erosivity (RE), soil erodibility, topography, land cover, and erosion control practices. Among these, RE represents rainfall erosivity—the potential of rainfall to cause soil erosion—and is defined as the interaction between raindrop kinetic energy, intensity, and the soil surface [12,13].
RE is commonly calculated as the product of the total kinetic energy (E) of a storm and the maximum 30-min rainfall intensity (I30), known as the EI30 index [14]. Accurate R-factor calculation typically requires high-resolution rainfall data, ideally sub-hourly, to capture precise I30 values. However, collecting high-resolution rainfall data (such as sub-hourly measurements) can be challenging, especially in regions like North Korea, due to technical, political, and economic limitations. Given the unavailability of high-resolution rainfall data, various alternative methods have been proposed, including empirical equations based on daily, monthly, or annual rainfall [15,16,17], the Modified Fourner Index (MFI) [18,19], and rainfall disaggregation techniques [20,21]. These diverse methodologies have been applied and evaluated in various regions, including Italy, Switzerland, South Korea, Brazil, and Rwanda [12,17,18,22,23,24]. However, as RE is highly influenced by rainfall intensity, relying solely on monthly or annual rainfall can lead to significant estimation errors [12,25].
Machine learning (ML) models have been introduced to reduce uncertainty arising from low-resolution rainfall data, leveraging their superior ability to capture relationships between rainfall characteristics and RE. ML models are capable of handling complex and nonlinear interactions among various factors, enabling more precise predictions. Multiple studies have demonstrated the potential of various ML models—including random forest (RF), support vector machine (SVM), decision tree (DT), extreme gradient boost (XGB), and artificial neural network (ANN) models—to provide accurate RE estimate across different regions [22,26,27,28,29].
However, there is a lack of research applying ML techniques specifically to estimate RE and analyze its spatial variability in North Korea, where unique environmental and political challenges restrict data access. The few existing studies on soil erosion in the region have relied on conventional methods that may not fully capture the localized effects of rainfall erosivity, especially given the intensifying impacts of climate change on rainfall intensity and frequency. ML-based approaches hold promise for addressing these limitations, providing improved RE estimates even under data scarcity. Leveraging ML could thus offer insights into North Korea’s erosion risk profiles, overcoming data limitations and providing accurate RE estimations.
Despite MLs’ promising performance of ML models, existing studies often lack guidance on selecting the best ML model among the many available options. This is particularly challenging because different MLs may perform optimally depending on the regions’ unique environmental dynamics. Additionally, individually developing and comparing various ML models for a given region is both inefficient and labor-intensive. Automated ML (AutoML) offers a solution to these challenges. AutoML simplifies the machine learning process by automatically constructing various pipelines, including feature engineering, feature selection, optimization, and model selection [30].
In this context, the aim of this study is to develop an optimal ML model using AutoML based on high-resolution rainfall data from South Korea, which shares a similar climate with North Korea, to indirectly estimate RE across North Korea and analyze the results. This will allow for the more accurate identification of erosion-prone areas in North Korea and contribute to understanding long-term soil erosion patterns in the context of climate change. Additionally, the findings are expected to provide valuable information for developing sustainable agricultural and environmental management strategies in North Korea.
2. Materials and Methods
2.1. Study Area and Data Collection
The study area is North Korea, located adjacent to South Korea along the Demilitarized Zone (DMZ), spanning from 124° E to 131° E longitude and 37° N to 44° N latitude (Figure 1). North Korea experiences a temperate climate with distinct seasons, though it is significantly influenced by continental climatic conditions. Natural disasters, such as floods and typhoons, frequently occur during the summer. According to reanalysis data from 27 meteorological stations in North Korea (Table 1), the average annual precipitation from 1981 to 2020 was 1133 mm, with considerable variation across regions, ranging from 775 mm to a maximum of 1447 mm. Recent precipitation patterns show a decline in average annual rainfall, but an increasing trend in maximum hourly rainfall intensity (Figure 2).
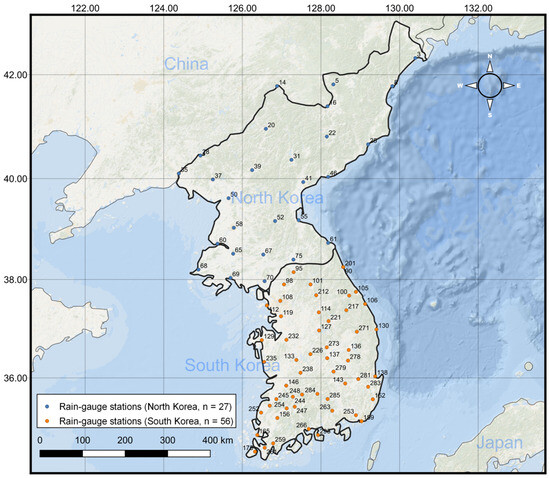
Figure 1.
The geographical extent of the study area, covering North Korea and its proximity to South Korea, along with the locations of meteorological stations used in this study.

Table 1.
Location and average annual precipitation data of 27 meteorological stations in North Korea.
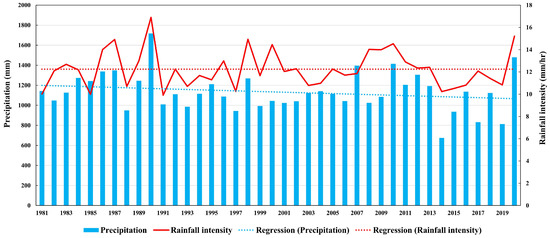
Figure 2.
Annual precipitation and average rainfall intensity of North Korea with their trends during the study period.
North Korea’s land cover characteristics differ from South Korea due to its mountainous terrain, which affects agricultural practices. As of 2022, North Korea had 502,000 hectares of rice paddies and 1,408,000 hectares of upland fields, indicating a relatively higher proportion of dry-field farming compared to South Korea [31]. In particular, extensive slash-and-burn farming occurs on steep slopes, raising the potential for severe soil erosion during rainfall events [32]. Although North Korea’s total forested area is larger than South Korea’s, ongoing deforestation due to land clearing, fuelwood collection, timber export, and disaster recovery logging has led to continued forest degradation [31]. These environmental issues exacerbate the risks of soil erosion and natural disasters.
This study aims to develop an ML model to predict RE in North Korea. To achieve this, meteorological data were collected from both South and North Korea. For South Korea, data from 50 meteorological stations between 2013 and 2019 were gathered, while for North Korea, data from 27 meteorological stations between 1980 and 2020 were obtained. North Korean meteorological data were sourced from the ReAnalysis 5 dataset provided by the European Centre for Medium-Range Weather Forecasts (ECMWF) [33], and South Korean data were obtained from the Korea Meteorological Administration’s database [34].
2.2. Calculation of Monthly Rainfall Erosivity in South Korea
In this study, the monthly rainfall erosivity (RE) was calculated for 56 rainfall gauge stations in South Korea from 2013 to 2019, using Equation (1). The RE is the product of the kinetic energy of a rainfall event () and its maximum 30-min intensity () [35]:
where RE represents the average monthly RE (MJ mm ha−1 h−1 month−1), is the number of years recorded, is the number of erosive events during a given month and is the RE index of a single event k. The erosivity of a single event (Equation (2)) is calculated as follows:
where is the unit rainfall kinetic energy (MJ ha−1 mm−1) and is the rainfall volume (mm) during the rth period of a storm that is divided into m parts. is the maximum 30-min rainfall intensity (mm h−1). The rainfall kinetic energy ( for each time interval is computed using Equation (3) [35]:
where is the rainfall intensity during the time interval (mm h−1).
To calculate the RE, the standard guidelines of RUSLE were followed. These guidelines require a minimum 6-h break between each event. Additionally, an event must reach a minimum total rainfall amount of 12.7 mm to be classified as erosive [11]. This threshold prevents small, non-erosive rainfall events from influencing the RE calculation, which is designed to reflect only rainfall with significant erosive potential.
However, an exception was made for particularly intense rainfall, where more than 6.35 mm of rain occurred within a 15-min period. For these cases, the approach described by Foster [36] was applied, allowing such events to qualify as erosive even if they didn’t meet the standard 6-h separation rule. The RE for all individual rainfall events was calculated using 10-min precipitation data, applying the equations and criteria explained above. This high temporal resolution allows for precise calculation of rainfall erosivity, as it captures changes in intensity within each event. The monthly and annual RE were determined by summing these individual event values on a monthly and yearly basis, respectively.
2.3. Application of TPOT for Monthly Rainfall Erosivity Estimation
The Tree-based Pipeline Optimization Tool (TPOT) is an automated ML tool built on the scikit-learn package, designed to enhance model selection and optimization efficiency [30,37]. TPOT utilizes genetic programming to evaluate various data preprocessing techniques, feature selection methods, and model combinations, ultimately identifying the most suitable ML pipeline for a given dataset [30]. In this process, TPOT selects the best-performing model and hyperparameters and verifies the model’s generalization ability by testing it on a hold-out dataset. TPOT includes a variety of ML models, such as linear models, DT, RF, XGB, ANN, and ensemble models, allowing it to compare multiple model combinations to identify the optimal model.
In this study, the applicability of TPOT for predicting RE was evaluated using data from various regions in South Korea. This served as a preliminary step to estimating RE in North Korea. The TPOT included training variables such as month (1–12), total monthly precipitation (m_sum_r), maximum daily precipitation (d_sum_r), and maximum hourly precipitation (h_max_r), with the monthly RE as the target variable. For the model training, datasets from 48 out of the total 56 rainfall gauge stations in South Korea were used, and a 5-fold cross-validation was conducted to generalize the model performance. TPOT was configured with parameters of 100 generations and a population size of 60. Based on this configuration, the optimal model was selected, and its hyperparameters were identified through an iterative process. The optimal model was then used to predict RE for eight stations in South Korea.
The performance of the optimal model was evaluated using metrics such as the root mean square error (RMSE), mean absolute error (MAE), and determination coefficient (R2). These metrics are frequently used in ML modeling studies to evaluate the accuracy between model-estimated values and actual values [22,38,39]. Lower values of RMSE and MAE indicate that the model has achieved a better estimation [40]. R2 is optimal at 1, indicating a perfect fit between the observed values and those estimated by the model [41]. The calculations for these metrics were as follows:
where n is the number of data samples, and and are the ith observed and estimated values, respectively. and are the average observed and estimated values.
2.4. Rainfall Erosivity Estimation and Spatial Distribution
The optimal model selected by TPOT was used to estimate the monthly RE from 1981 to 2020 at 27 rainfall gauge stations in North Korea. The annual RE was calculated by aggregating the monthly RE values. To determine the mean monthly and annual RE at these stations, the values were averaged accordingly. The computed mean annual RE was spatially distributed using the ordinary Kriging interpolation method within the Esri ArcGIS version 10.3 [42]. A coefficient of variation (CV) was applied to assess the inter-annual variability of RE values at each station. Additionally, the variation in monthly RE was analyzed over the entire study period to evaluate temporal changes.
3. Results and Discussion
3.1. Correlation Analysis Between Input Features and RE
A correlation analysis was conducted to evaluate the relationships between the input features and the target variable, RE. The correlation coefficients (r) between the input variables—month, m_sum_r, d_max_r, and h_max_r—and RE are presented in Table 2. Given that RE is determined by the kinetic energy of rainfall and its intensity, it was anticipated that h_max_r would exhibit the strongest correlation with RE. This expectation was based on the premise that short, intense rainfall events contribute significantly to soil erosion. However, the analysis revealed that while h_max_r did have a high correlation with RE (r = 0.79), total monthly precipitation (m_sum_r) showed an even slightly stronger correlation (r = 0.80). This result suggests that, although maximum hourly intensity is a key factor influencing RE, the cumulative effect of total monthly precipitation plays an equally, if not more, important role. The strong correlation of m_sum_r indicates that larger amounts of precipitation over a month can lead to more frequent or intense erosive events, even if individual rainfall events are less intense than the hourly maximum. In addition, maximum daily precipitation (d_max_r) displayed a moderately strong positive correlation (r = 0.65), which highlights that daily rainfall extremes also contribute to erosivity but to a lesser extent compared to monthly totals and hourly extremes. Conversely, month had a weak correlation with RE (r = 0.13). Overall, the findings align with the hypothesis that rainfall intensity is a significant factor, but they also emphasize the critical role of total monthly precipitation in predicting monthly RE. This suggests that a comprehensive understanding of both rainfall intensity and total volume is essential for accurate RE estimation.
Table 2.
Correlation analysis results between input features and the target variable (RE).
3.2. Best Model Algorithm and Pipeline Selected by TPOT
Figure 3 shows the changes in the cross-validation scores of the optimal pipelines for each generation observed during the automated ML pipeline optimization process inside TPOT. The cross-validation scores started at around 0.68 in the initial generations and gradually improved up to approximately 0.72 in the final generation through the evolutionary process. This indicates that the TPOT algorithm is finding better models as it progresses through the generations. The optimization process using TPOT yielded GradientBoostingRegressor (GBR) as the best-performing model for estimating RE. The optimal pipeline configuration included ElasticNetCV with a l1_ratio of 0.4 and a tolerance of 0.001, paired with GradientBoostingRegressor hyperparameters set to: alpha = 0.75, learning_rate = 0.1, loss = huber, max_depth = 4, max_features = 0.5, min_samples_leaf = 9, min_samples_split = 11, n_estimators = 100, and subsample = 0.4. This pipeline leverages ElasticNetCV for initial feature selection and regularization, enhancing model robustness before feeding data into the GradientBoostingRegressor. The combination allows for a balanced approach, using ElasticNetCV to control feature complexity and GradientBoostingRegressor to iteratively refine predictions through an ensemble of decision trees. This setup enables the model to handle outliers effectively while improving prediction accuracy across generations.
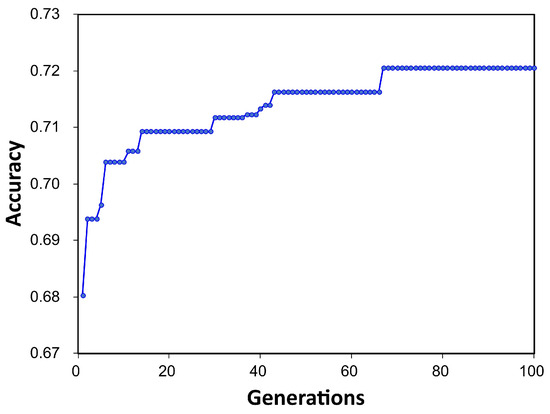
Figure 3.
Changes in cross-validation accuracy over generations during the TPOT model pipeline optimization.
3.3. Model Validation on Estimated Rainfall Erosivity in South Korea
The optimal pipeline model selected by TPOT was applied to predict monthly RE at eight weather stations in South Korea from 2013 to 2019 (Figure 4). The model’s performance was evaluated using several metrics, achieving an R2 of 0.87, RMSE of 371.74, and MAE of 112.33. These results outperform those of similar studies, such as Lee et al. [43], which reported an average R2 of 0.75 for five stations, demonstrating the superior predictive accuracy of the TPOT-selected model.
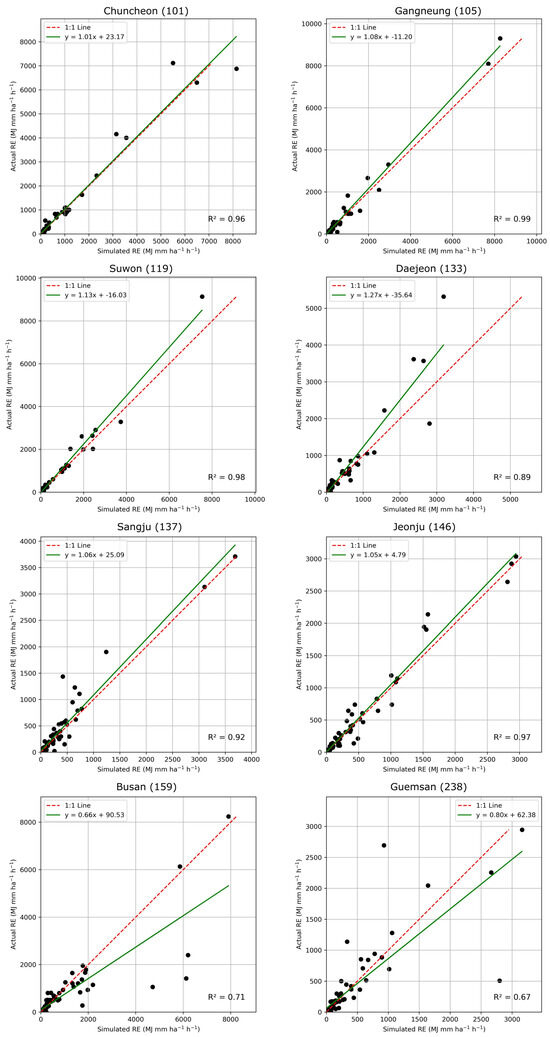
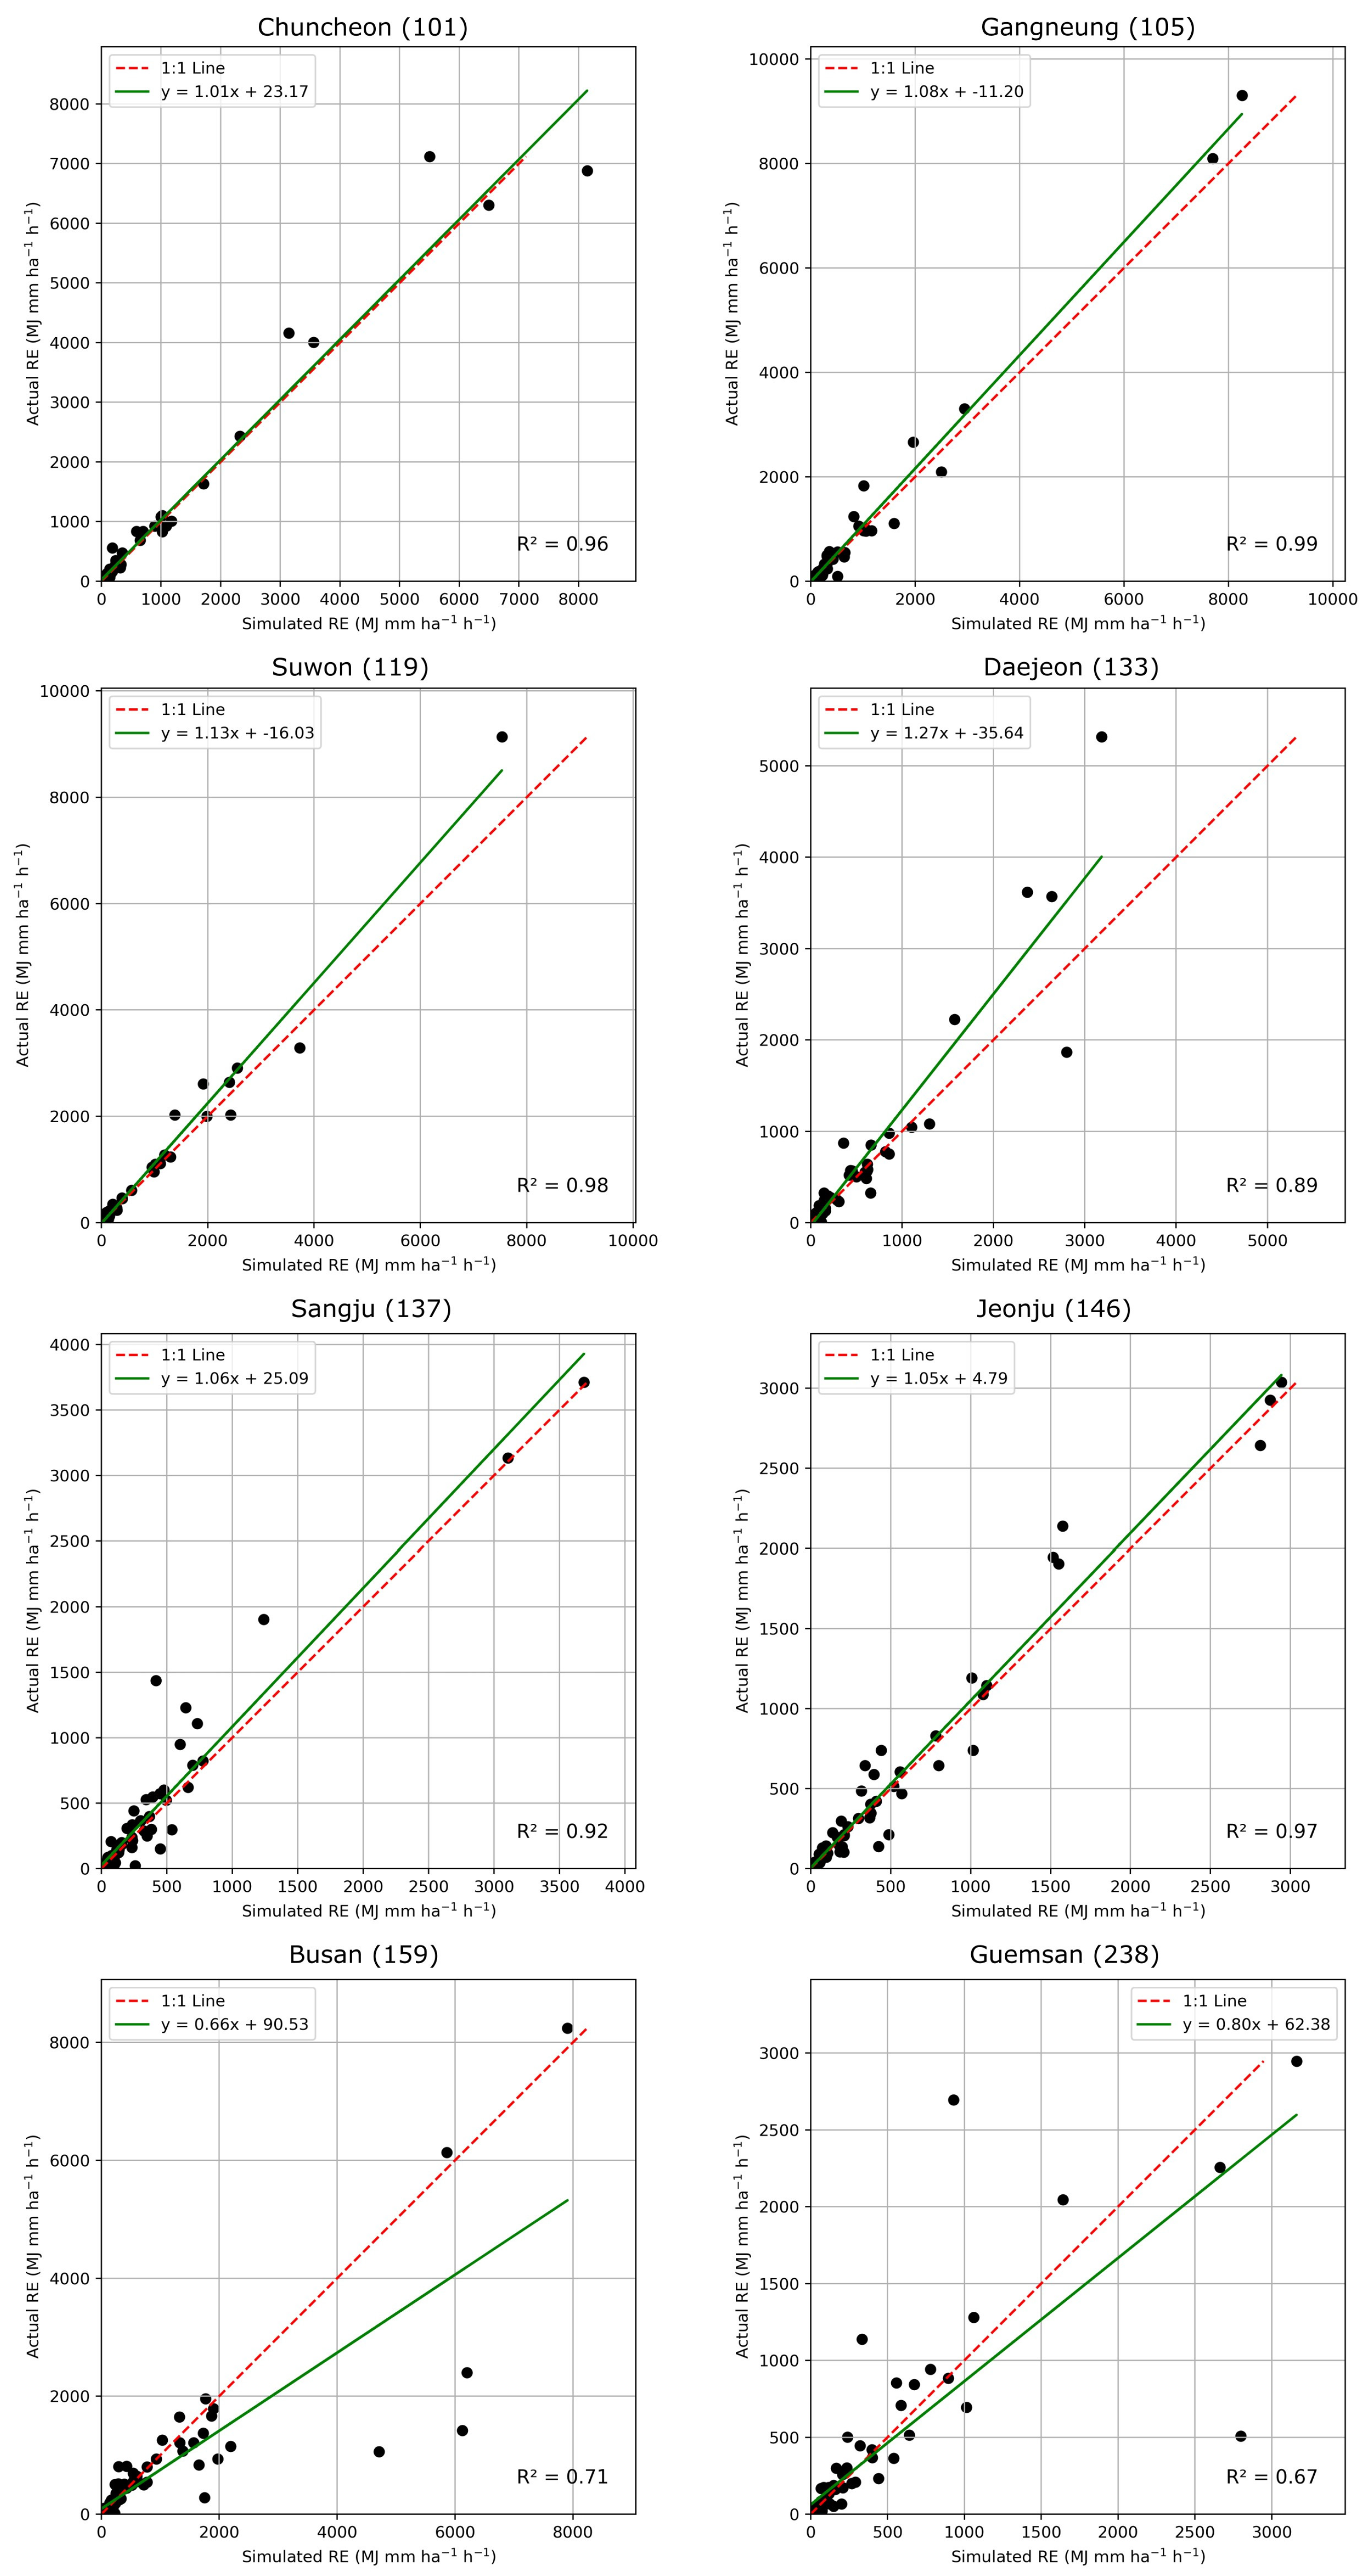
Figure 4.
Scatter plot of estimated monthly RE from best TPOT model and monthly RE at eight test stations in South Korea (Solid line stands for 1:1 line, and dash line stands for regression lines, respectively).
The analysis of monthly RE estimates for each station revealed varying levels of model performance (Table 3). The R2 values for each station were as follows: Chuncheon (0.96), Gangneung (0.99), Suwon (0.98), Daejeon (0.89), Sangju (0.92), Jeonju (0.97), Busan (0.71), and Geumsan (0.67). While the model performed exceptionally well for most stations, particularly in Gangneung and Suwon, the performance in Busan and Geumsan was notably lower.
Table 3.
Prediction performance of the TPOT model for monthly RE at eight test stations based on RMSE, MAE, and R2.
To further investigate the reasons behind the lower accuracy in Busan and Geumsan, a correlation analysis between RE and input features was conducted for each station (Figure 5). Interestingly, despite Busan and Geumsan showing a lower R2, the correlation analysis of monthly RE with the input features in these two stations followed similar trends to those observed at other stations (Table 2). This suggests that the lower prediction accuracy in these regions may not stem from different feature relationships but from other factors, such as the quality or resolution of the data, the location of the weather stations, or unique rainfall patterns. These factors could have negatively affected the model’s performance in predicting RE at these locations. Therefore, it is worth considering that data completeness or other regional specifics may have played a role in reducing prediction accuracy in Busan and Geumsan.
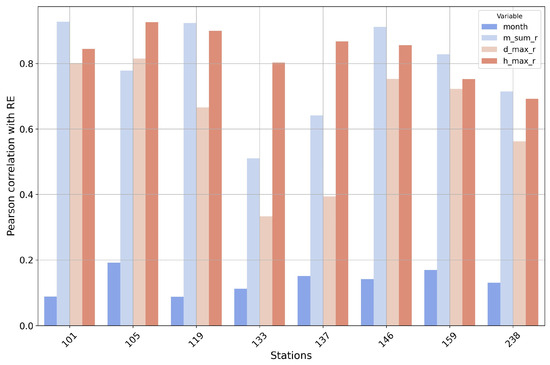
Figure 5.
Bar chart showing the correlation (r) values between input features and RE for each weather station used for testing.
On the other hand, Daejeon and Sangju exhibited different trends compared to other stations. In these regions, m_sum_r (total monthly precipitation) and d_max_r (maximum daily precipitation) were relatively low, suggesting that in Daejeon and Sangju, short-term intense rainfall events (represented by h_max_r) may have had a greater influence on RE than total precipitation. Despite these differences, the model still achieved high prediction accuracy in both regions, with R2 values of 0.89 and 0.92, respectively. This highlights the model’s ability to capture and reflect the influence of rainfall intensity and short-term precipitation patterns on RE in regions where total rainfall is less impactful.
3.4. Estimated Rainfall Erosivity in North Korea
The optimal model was used to estimate the RE for 27 weather stations across North Korea. The results of these predictions, including the stations’ annual precipitation, average annual RE, and the coefficient of variation (CV), are summarized in Table 4 and mapped in Figure 6. The spatial distribution of RE across North Korea was visualized using Kriging interpolation, reflecting significant regional differences in RE intensity.
Table 4.
Annual precipitation, average annual RE, and CV for each rainfall gauge station across North Korea.

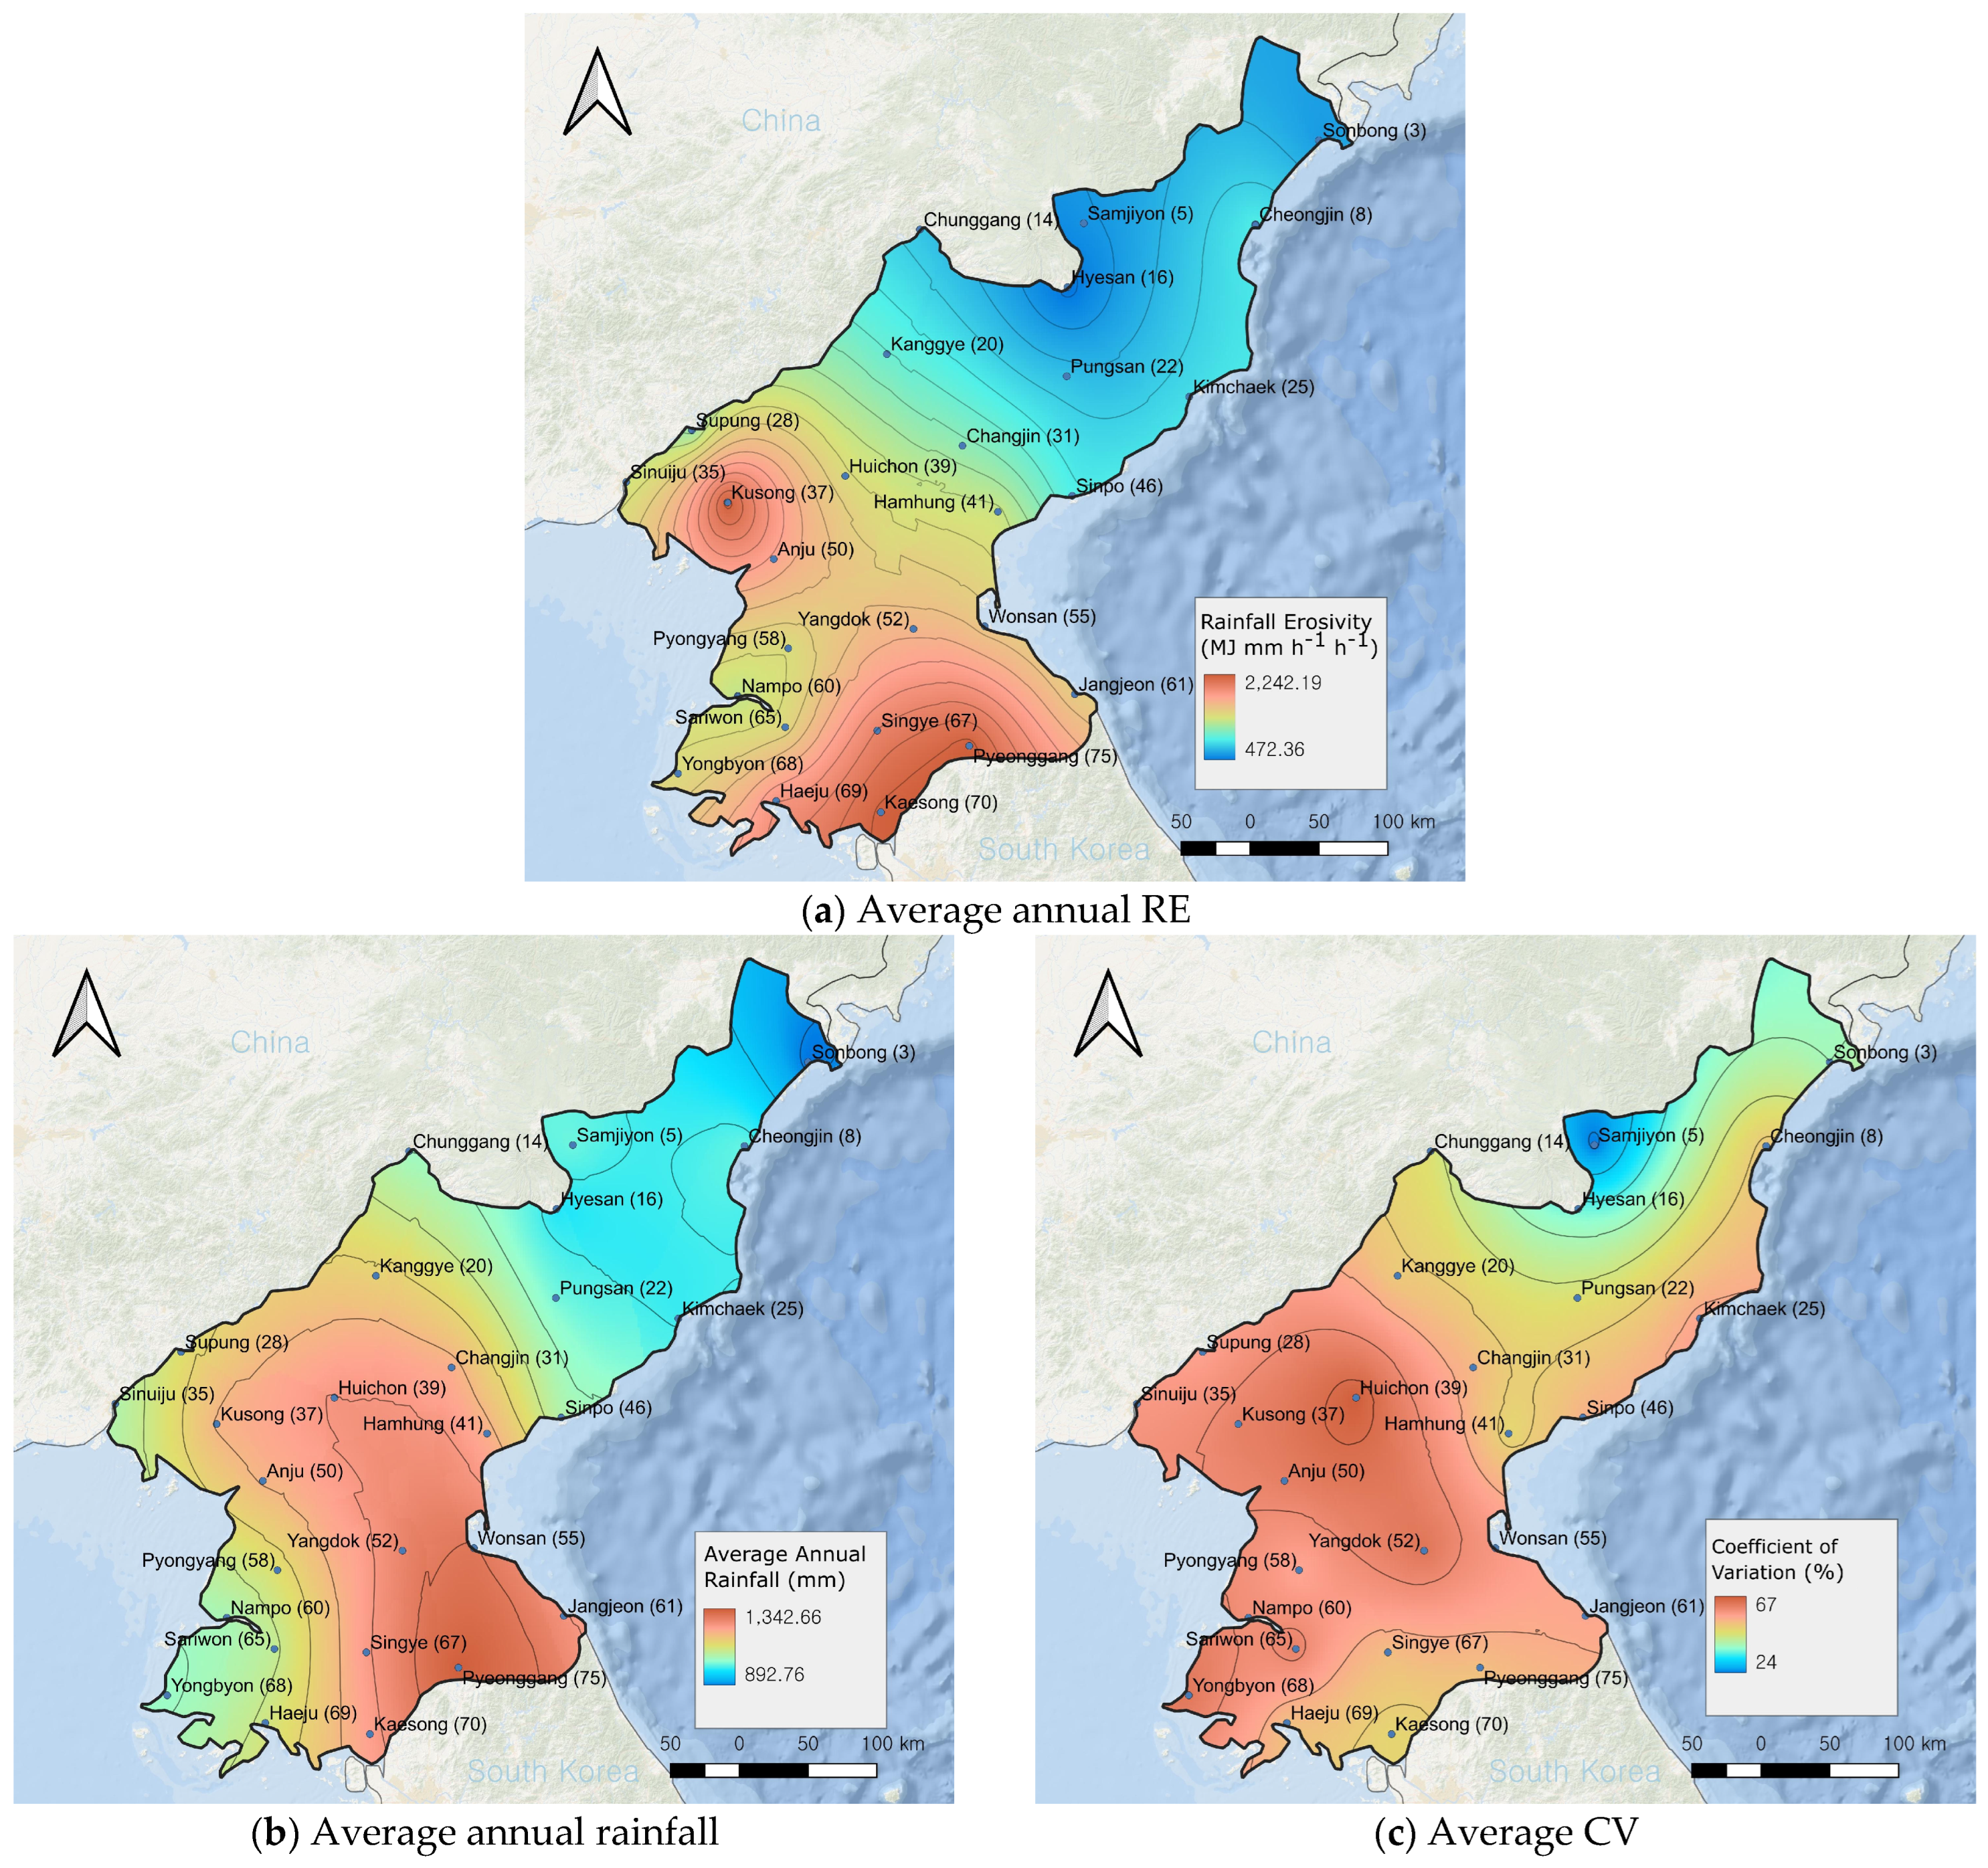
Figure 6.
Spatial distribution of average annual RE, average annual rainfall, and CV across North Korea.
As shown in Figure 6a, higher RE values were concentrated in the southern (Pyeonggang and Kaesong) and western (Kusong) regions of North Korea. In contrast, areas with elevations above 400 m, such as the highland regions (e.g., Kanggye, Hyesan, and Samjiyon) and areas north of Hamhung along the eastern coastline, exhibited relatively lower RE values. This spatial distribution aligns with findings by Lee and Heo et al. [44] and Jung et al. [23] suggesting that the estimated RE distribution in this study accurately represents the relative erosion potential across North Korea.
However, the average annual RE estimated in this study (1331 MJ mm ha−1 h−1) differs from previous studies. Lee and Heo et al. [44], using empirical equations based on annual rainfall, reported an average RE of 4947 MJ mm ha−1 h−1, while Jung et al. [23], relying on monthly rainfall data, estimated an average RE of 259 MJ mm ha−1 h−1. These discrepancies likely arise from differences in the rainfall data periods and the methods or models used for calculation. Notably, a limitation of prior studies is the absence of validation with actual measurements, as no high-resolution rainfall data are available for North Korea [5]. Future research should validate these methods, including the model developed in this study, against ground-based measurements from regions where high-resolution rainfall data are available, enabling more accurate RE estimates for North Korea.
Higher RE values correspond to regions with higher annual precipitation (Figure 6b), which contributes to their elevated erosivity. In contrast, northern stations such as Samjiyon (586 MJ mm ha−1 h−1) and Hyesan (468 MJ mm ha−1 h−1) exhibited relatively lower RE values. These lower values are likely due to the reduced annual precipitation in these regions, resulting in fewer frequent or intense rainfall events that typically drive high RE.
Additionally, the northern stations, located at higher elevations, such as Hyesan, Samjiyon, and Pungsan, demonstrated lower CV values (Figure 6c), indicating more consistent rainfall patterns throughout the year. The CV for RE across the stations ranged from 21% (Samjiyon) to 69% (Huichon), with higher CV values representing greater variability in monthly RE. The spatial distribution of CV (Figure 6c) closely mirrored the RE distribution (Figure 6a), showing a moderate positive correlation (r = 0.5) with the average annual RE values. Therefore, regions with both high RE and high CV may be particularly vulnerable to soil erosion. The overall average CV across all stations was 53%, indicating significant year-to-year variability in RE. This variability implies that short-term or single-year assessments may not provide a comprehensive understanding of long-term erosion risk, as RE can fluctuate considerably over time. Thus, it is crucial to consider long-term data when evaluating erosion risk to avoid misinterpreting temporary anomalies.
These findings have significant implications for soil erosion management and policy development in North Korea. Regions with high RE and CV, such as the southern and western areas, should be prioritized for soil conservation practices, as they are more vulnerable to erosion due to their high erosivity and variability. Furthermore, policymakers could leverage these insights to design region-specific soil erosion control programs, acknowledging that northern regions with lower RE and CV values may require fewer intensive interventions. Recognizing the role of rainfall intensity and its variability in soil erosion risk can lead to more targeted, cost-effective measures that improve the resilience of North Korea’s agricultural landscapes in the face of climate change. Emphasizing long-term data in erosion risk assessments will also support the development of sustainable land management policies that adapt to evolving climate patterns over time.
4. Conclusions
This study developed an ML model using high-resolution rainfall data from South Korea to estimate and analyze the rainfall erosivity (RE) in North Korea. By applying a GradientBoostingRegressor optimized through the AutoML, i.e., TPOT, we predicted monthly RE across 27 stations in North Korea, gaining insights into the spatial and temporal variability of RE. Correlation analysis highlighted the importance of total monthly precipitation and rainfall intensity in determining erosivity. The model performed well overall, with an average R2 of 0.87, although accuracy was lower at certain stations, such as Busan and Geumsan. Future work could employ explainable AI (XAI) techniques, such as Shapley Additive Explanations (SHAP) or Local Interpretable Model-agnostic Explanations (LIME), to identify region-specific factors that influence RE, particularly in areas with lower accuracy.
The RE estimation of North Korea revealed significant regional differences, with higher values in southern and western regions, such as Kusong, Kaesong, and Pyeonggang, where both annual precipitation and RE variability are greater, increasing their susceptibility to soil erosion. Conversely, northern regions like Samjiyon and Hyesan exhibited lower RE due to more consistent rainfall patterns. The analysis also showed that regions with higher RE variability, indicated by their CV values, are more prone to year-to-year fluctuations in erosion risk, emphasizing the importance of using long-term data to assess erosion risk effectively.
In conclusion, the study provides a comprehensive overview of rainfall erosivity in North Korea, highlighting the need to consider both total rainfall and intensity when assessing soil erosion risk. The findings can inform future soil erosion management strategies and may serve as valuable data for estimating soil loss using RUSLE. Furthermore, the results can contribute to discussions on environmental cooperation between North and South Korea, particularly in light of the increasing impact of climate change. The study’s insights can be critical in developing sustainable agricultural and environmental strategies to mitigate soil erosion in North Korea.
Author Contributions
Conceptualization, J.H. and S.L.; methodology, J.H. and S.L.; formal analysis, J.H. and S.L.; data curation, J.H.; writing—original draft preparation, J.H.; writing—review and editing, J.H. and S.L.; visualization, J.H. and S.L.; supervision, S.L.; project administration, S.L.; funding acquisition, S.L. All authors have read and agreed to the published version of the manuscript.
Funding
This work was supported by the Korea Environment Industry & Technology Institute (KEITI) through the Aquatic Ecosystem Conservation Research Program, funded by the Korea Ministry of Environment (MOE) (2020003030004).
Data Availability Statement
The original contributions presented in the study are included in the article, further inquiries can be directed to the corresponding author.
Conflicts of Interest
The authors declare no conflicts of interest.
References
- Kum, D.; Jang, C.H.; Shin, M.H.; Choi, J.; Kim, B.; Jeong, G.-C.; Won, C.H.; Lim, K.J. Determination of Model Parameters of Surface Cover Materials in Evaluation of Sediment Reduction and Its Effects at Watershed Scale Using SWAT. J. Korean Soc. Water Environ. 2012, 28, 923–932. [Google Scholar]
- Guerra, C.A.; Maes, J.; Geijzendorffer, I.; Metzger, M.J. An Assessment of Soil Erosion Prevention by Vegetation in Mediterranean Europe: Current Trends of Ecosystem Service Provision. Ecol. Indic. 2016, 60, 213–222. [Google Scholar] [CrossRef]
- Issaka, S.; Ashraf, M.A. Impact of Soil Erosion and Degradation on Water Quality: A Review. Geol. Ecol. Landsc. 2017, 1, 1–11. [Google Scholar] [CrossRef]
- He, J.; Xu, J. Is There Decentralization in North Korea? Evidence and Lessons from the Sloping Land Management Program 2004–2014. Land Use Policy 2017, 61, 113–125. [Google Scholar] [CrossRef]
- Lee, E.; Ahn, S.; Im, S. Estimation of Soil Erosion Rate in the Democratic People’s Republic of Korea Using the RUSLE Model. Forest Sci. Technol. 2017, 13, 100–108. [Google Scholar] [CrossRef]
- Lim, C.-H.; Choi, Y.; Kim, M.; Jeon, S.W.; Lee, W.-K. Impact of Deforestation on Agro-Environmental Variables in Cropland, North Korea. Sustainability 2017, 9, 1354. [Google Scholar] [CrossRef]
- Jin, Y.; Zhu, J.; Cui, G.; Yin, Z.; Zhu, W.; Lee, D.K. Characterization of Two Main Forest Cover Loss Transitions in North Korea from 1990 to 2020. Forests 2023, 14, 1966. [Google Scholar] [CrossRef]
- Korea Development Bank. The North Korea’s Industry, 2nd ed.; Korea Development Bank: Seoul, Republic of Korea, 2020. [Google Scholar]
- Engler, R.; Teplyakov, V.; Adams, J.M. An Assessment of Forest Cover Trends in South and North Korea, From 1980 to 2010. Environ. Manag. 2014, 53, 194–201. [Google Scholar] [CrossRef]
- Renard, K.G.; Foster, G.R.; Weesies, G.A.; Porter, J.P. RUSLE: Revised Universal Soil Loss Equation. J. Soil. Water Conserv. 1991, 46, 30–33. [Google Scholar]
- Renard, K.G. Predicting Soil Erosion by Water: A Guide to Conservation Planning with the Revised Universal Soil Loss Equation (RUSLE); US Department of Agriculture, Agricultural Research Service: Washington, DC, USA, 1997; ISBN 0160489385.
- Rutebuka, J.; De Taeye, S.; Kagabo, D.; Verdoodt, A. Calibration and Validation of Rainfall Erosivity Estimators for Application in Rwanda. CATENA 2020, 190, 104538. [Google Scholar] [CrossRef]
- Nearing, M.A.; Yin, S.; Borrelli, P.; Polyakov, V.O. Rainfall Erosivity: An Historical Review. CATENA 2017, 157, 357–362. [Google Scholar] [CrossRef]
- Wischmeier, W.H.; Smith, D.D. Predicting Rainfall Erosion Losses: A Guide to Conservation Planning; Department of Agriculture, Science and Education Administration: Washington, DC, USA, 1978. [Google Scholar]
- Bonilla, C.A.; Vidal, K.L. Rainfall Erosivity in Central Chile. J. Hydrol. 2011, 410, 126–133. [Google Scholar] [CrossRef]
- Wu, L.; Liu, X.; Ma, X. Spatiotemporal Distribution of Rainfall Erosivity in the Yanhe River Watershed of Hilly and Gully Region, Chinese Loess Plateau. Environ. Earth Sci. 2016, 75, 315. [Google Scholar] [CrossRef]
- Ferro, V.; Porto, P.; Yu, B. A Comparative Study of Rainfall Erosivity Estimation for Southern Italy and Southeastern Australia. Hydrol. Sci. J. 1999, 44, 3–24. [Google Scholar] [CrossRef]
- Muhire, I.; Ahmed, F.; Abd Elbasit, M.M.M. Spatio-Temporal Variations of Rainfall Erosivity in Rwanda. J. Soil Sci. Environ. Manag. 2015, 6, 72–83. [Google Scholar]
- Arnoldus, H.M.J. Methodology Used to Determine the Maximum Potential Average Annual Soil Loss Due to Sheet and Rill Erosion in Morocco. FAO Soilds Bull. 1977, 34, 39–48. [Google Scholar]
- Li, X.; Li, Z.; Lin, Y. Suitability of TRMM Products with Different Temporal Resolution (3-Hourly, Daily, and Monthly) for Rainfall Erosivity Estimation. Remote Sens. 2020, 12, 3924. [Google Scholar] [CrossRef]
- Moreira, L.L.; Novais, R.R.; Schwamback, D.; de Carvalho Júnior, S.M. Spatial–Temporal Dynamics of Rainfall Erosivity in the State of Espírito Santo (Brazil) from Remote Sensing Data. World J. Sci. Technol. Sustain. Dev. 2020, 17, 297–309. [Google Scholar] [CrossRef]
- Lee, S.; Bae, J.H.; Hong, J.; Yang, D.; Panagos, P.; Borrelli, P.; Yang, J.E.; Kim, J.; Lim, K.J. Estimation of Rainfall Erosivity Factor in Italy and Switzerland Using Bayesian Optimization Based Machine Learning Models. CATENA 2022, 211, 105957. [Google Scholar] [CrossRef]
- Jeong, Y.-S.; Park, C.-S.; Jeong, P.-K.; Im, J.-N.; Shin, J.-S. Estimation of R-Factor for Universal Soil Loss Equation with Monthly Precipitation Data in North Korea. Korean J. Soil Sci. Fert. 2002, 35, 87–92. [Google Scholar]
- Teixeira, D.B.d.S.; Cecílio, R.A.; Moreira, M.C.; Pires, G.F.; Fernandes Filho, E.I. Recent Advancements in Rainfall Erosivity Assessment in Brazil: A Review. CATENA 2022, 219. [Google Scholar] [CrossRef]
- Beguería, S.; Serrano-Notivoli, R.; Tomas-Burguera, M. Computation of Rainfall Erosivity from Daily Precipitation Amounts. Sci. Total Environ. 2018, 637–638, 359–373. [Google Scholar] [CrossRef] [PubMed]
- Nguyen, K.A.; Chen, W.; Lin, B.-S.; Seeboonruang, U. Using Machine Learning-Based Algorithms to Analyze Erosion Rates of a Watershed in Northern Taiwan. Sustainability 2020, 12, 2022. [Google Scholar] [CrossRef]
- Chakrabortty, R.; Pal, S.C.; Sahana, M.; Mondal, A.; Dou, J.; Pham, B.T.; Yunus, A.P. Soil Erosion Potential Hotspot Zone Identification Using Machine Learning and Statistical Approaches in Eastern India. Nat. Hazards 2020, 104, 1259–1294. [Google Scholar] [CrossRef]
- de Souza, C.M.P.; Veloso, G.V.; de Mello, C.R.; Ribeiro, R.P.; da Silva, L.A.P.; Leite, M.E.; Fernandes Filho, E.I. Spatiotemporal Prediction of Rainfall Erosivity by Machine Learning in Southeastern Brazil. Geocarto Int. 2022, 37, 11652–11670. [Google Scholar] [CrossRef]
- Vantas, K.; Sidiropoulos, E.; Evangelides, C. Rainfall Erosivity and Its Estimation: Conventional and Machine Learning Methods. In Soil Erosion—Rainfall Erosivity and Risk Assessment; IntechOpen: London, UK, 2019; p. 19. [Google Scholar]
- Olson, R.S.; Bartley, N.; Urbanowicz, R.J.; Moore, J.H. Evaluation of a Tree-Based Pipeline Optimization Tool for Automating Data Science. In Proceedings of the Genetic and Evolutionary Computation Conference 2016, Denver, CO, USA, 20–24 July 2016; pp. 485–492. [Google Scholar]
- North Korea Information Portal. Available online: https://nkinfo.unikorea.go.kr/ (accessed on 28 September 2024).
- Korea Development Bank. The North Korea’s Industry; Korea Development Bank: Seoul, Republic of Korea, 2015. [Google Scholar]
- ECMWF|Advancing Global NWP through International Collaboration. Available online: https://www.ecmwf.int/ (accessed on 28 September 2024).
- Korea Meteorological Administration. Available online: https://data.kma.go.kr/cmmn/main.do (accessed on 28 September 2024).
- Brown, L.; Foster, G. Storm Erosivity Using Idealized Intensity Distributions. Trans. ASAE 1987, 30, 379. [Google Scholar] [CrossRef]
- Foster, G.R. User’s Reference Guide: Revised Universal Soil Loss Equation (RUSLE2); US Department of Agriculture, Agricultural Research Service: Washington, DC, USA, 2004.
- Olson, R.S.; Moore, J.H. TPOT: A Tree-Based Pipeline Optimization Tool for Automating Machine Learning. In Proceedings of the Workshop on Automatic Machine Learning, PMLR, New York, NY, USA, 24 June 2016; 2016; pp. 66–74. [Google Scholar]
- Alqahtani, A.; Shah, M.I.; Aldrees, A.; Javed, M.F. Comparative Assessment of Individual and Ensemble Machine Learning Models for Efficient Analysis of River Water Quality. Sustainability 2022, 14, 1183. [Google Scholar] [CrossRef]
- Jimeno-Sáez, P.; Martinez-Espana, R.; Casalí, J.; Pérez-Sánchez, J.; Senent-Aparicio, J. A Comparison of Performance of SWAT and Machine Learning Models for Predicting Sediment Load in a Forested Basin, Northern Spain. CATENA 2022, 212, 105953. [Google Scholar] [CrossRef]
- Chen, J.-L.; Liu, H.-B.; Wu, W.; Xie, D.-T. Estimation of Monthly Solar Radiation from Measured Temperatures Using Support Vector Machines—A Case Study. Renew. Energy 2011, 36, 413–420. [Google Scholar] [CrossRef]
- Waseem, M.; Mani, N.; Andiego, G.; Usman, M. A Review of Criteria of Fit for Hydrological Models. Int. Res. J. Eng. Technol. 2017, 4, 1765–1772. [Google Scholar]
- Environmental Systems Research Institute (Esri). ArcGIS Desktop: Release 10.3; Environmental Systems Research Institute (Esri): Redlands, CA, USA, 2014. [Google Scholar]
- Lee, J.; Lee, S.; Hong, J.; Lee, D.; Bae, J.H.; Yang, J.E.; Kim, J.; Lim, K.J. Evaluation of Rainfall Erosivity Factor Estimation Using Machine and Deep Learning Models. Water 2021, 13, 382. [Google Scholar] [CrossRef]
- Lee, J.-H.; Heo, J.-H. Estimation of Rainfall Erosivity in North Korea Using Modified Institute of Agricultural Sciences. J. Soil Sci. Fert. 2011, 44, 1004–1009. [Google Scholar]


Disclaimer/Publisher’s Note: The statements, opinions and data contained in all publications are solely those of the individual author(s) and contributor(s) and not of MDPI and/or the editor(s). MDPI and/or the editor(s) disclaim responsibility for any injury to people or property resulting from any ideas, methods, instructions or products referred to in the content. |
© 2024 by the authors. Licensee MDPI, Basel, Switzerland. This article is an open access article distributed under the terms and conditions of the Creative Commons Attribution (CC BY) license (https://creativecommons.org/licenses/by/4.0/).