
Land Use Challenges in Emerging Economic Corridors of the Global South: A Case Study of the Laos Economic Corridor


Abstract
:1. Introduction
2. Materials and Methods
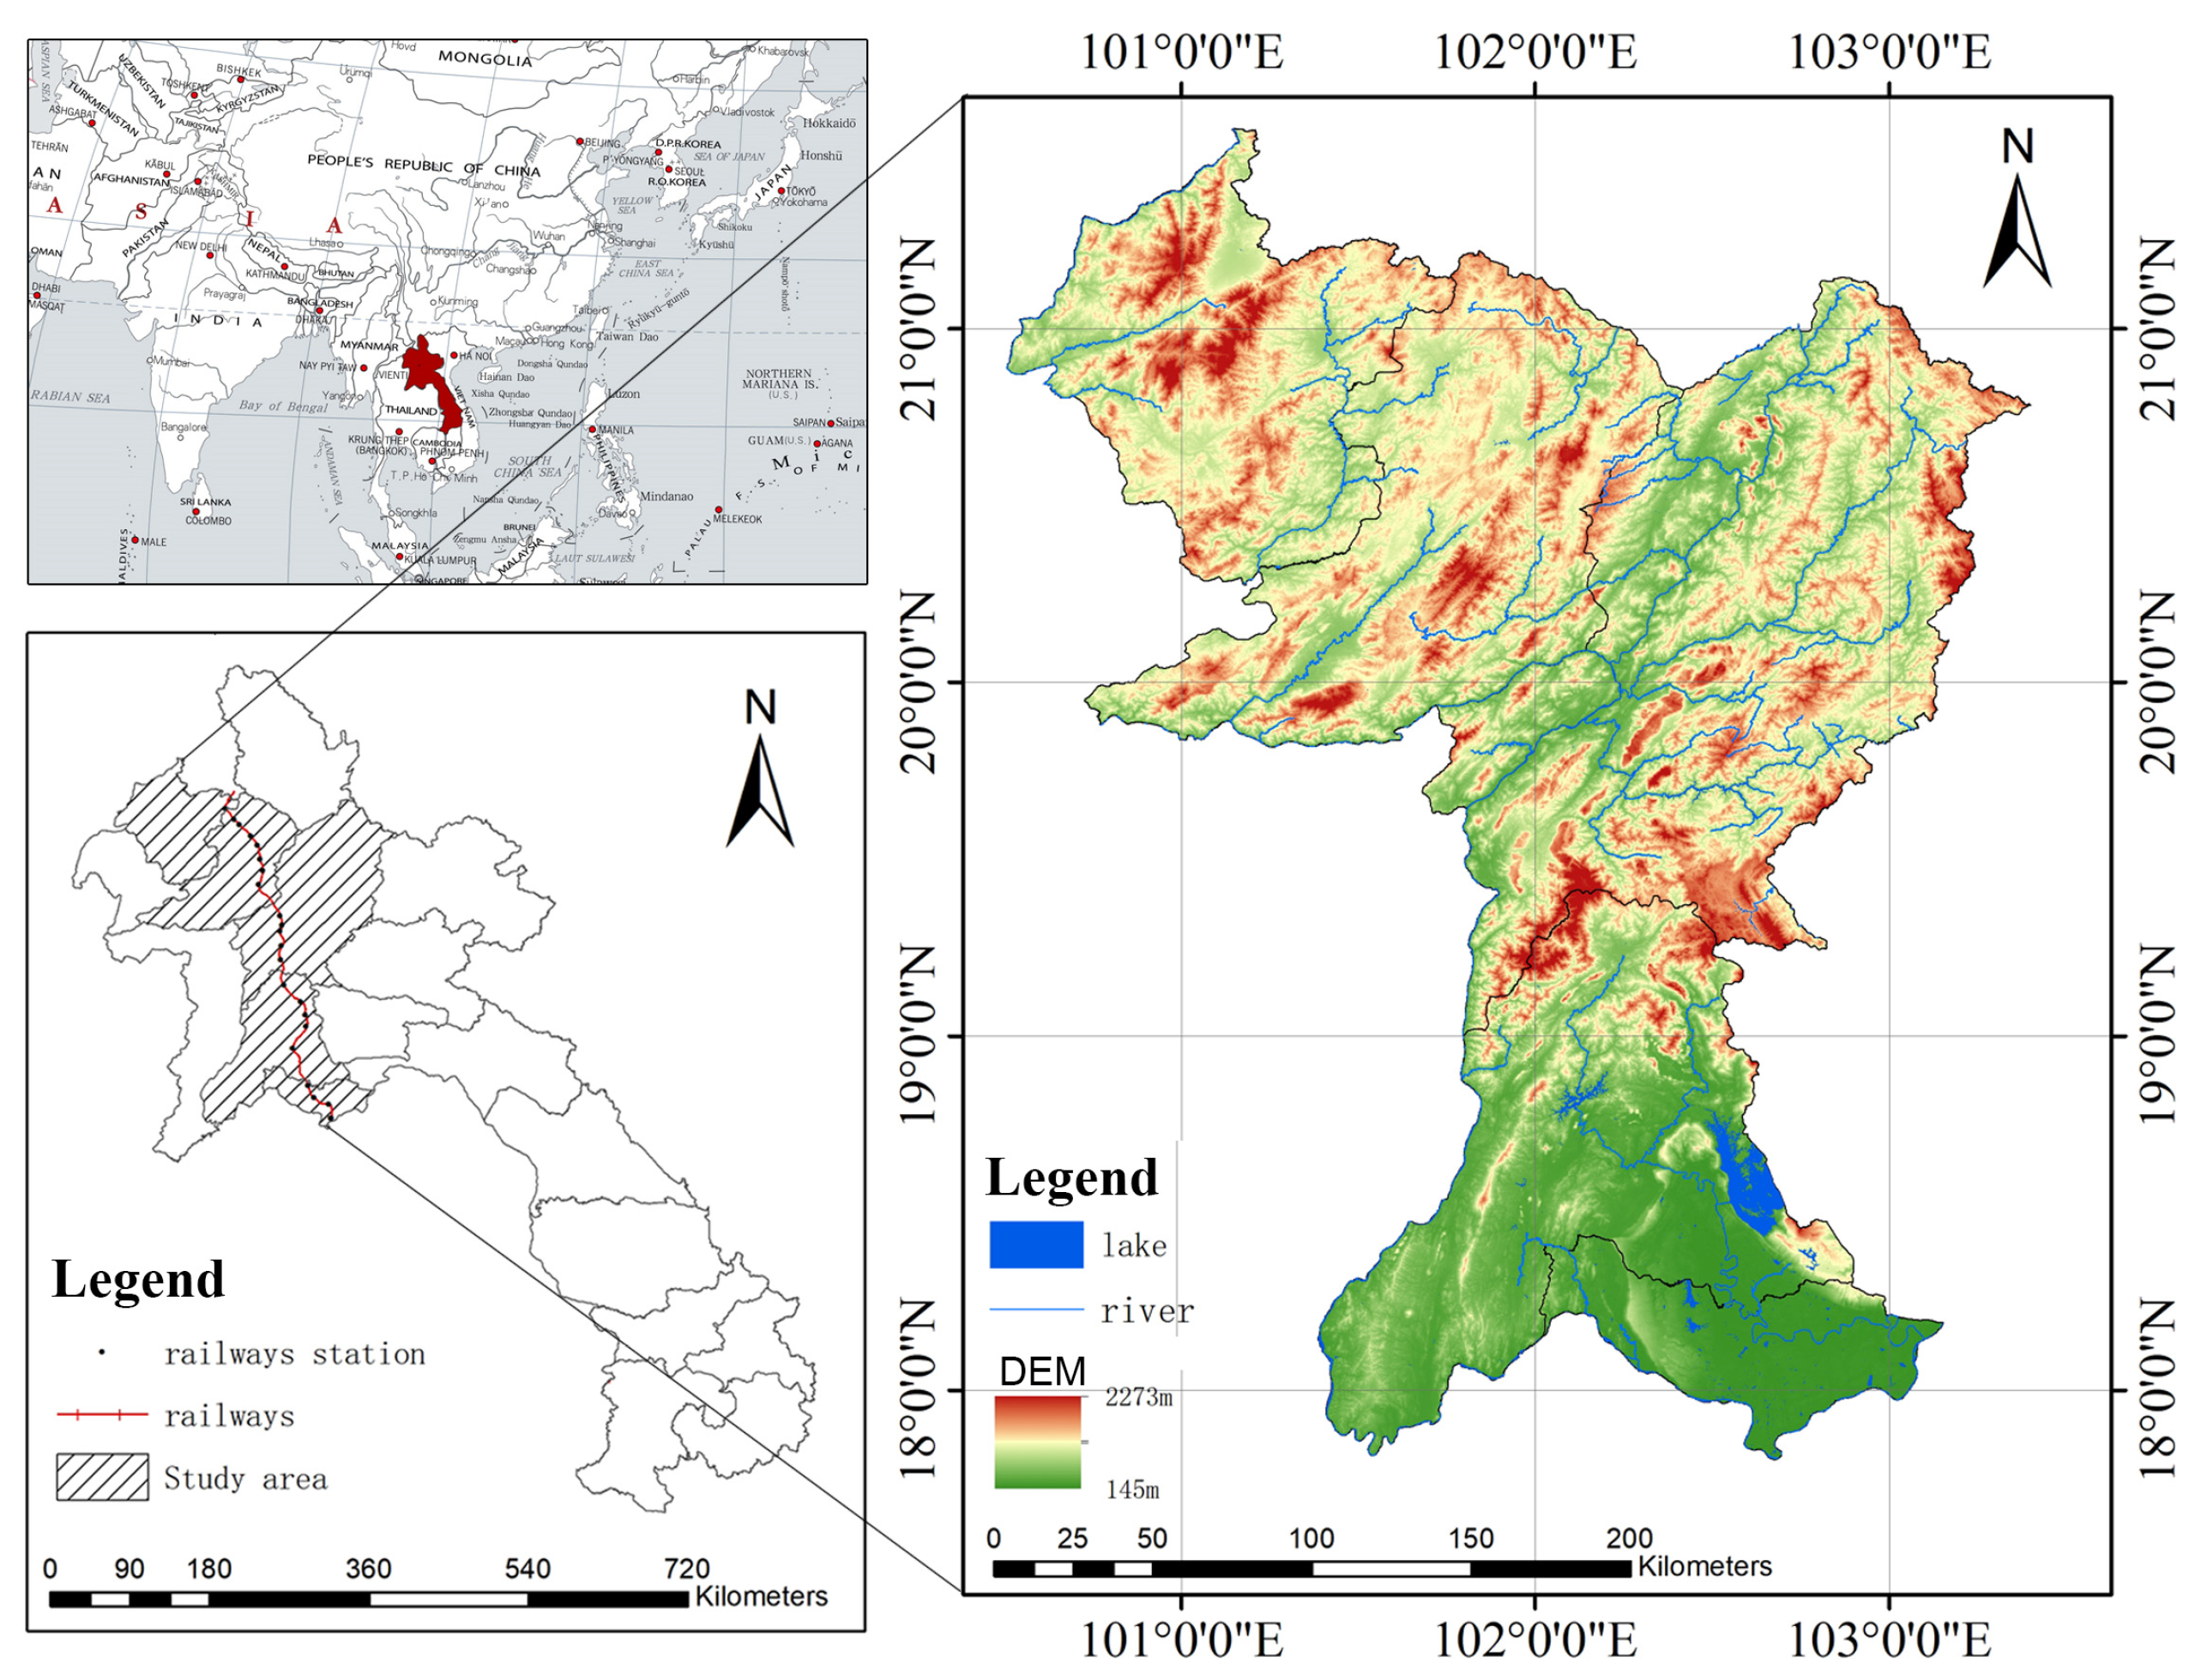
2.1. Study Area
2.2. Dataset
2.2.1. Land Cover Maps
2.2.2. Natural Resource Dataset
2.2.3. Socio-Economic Dataset
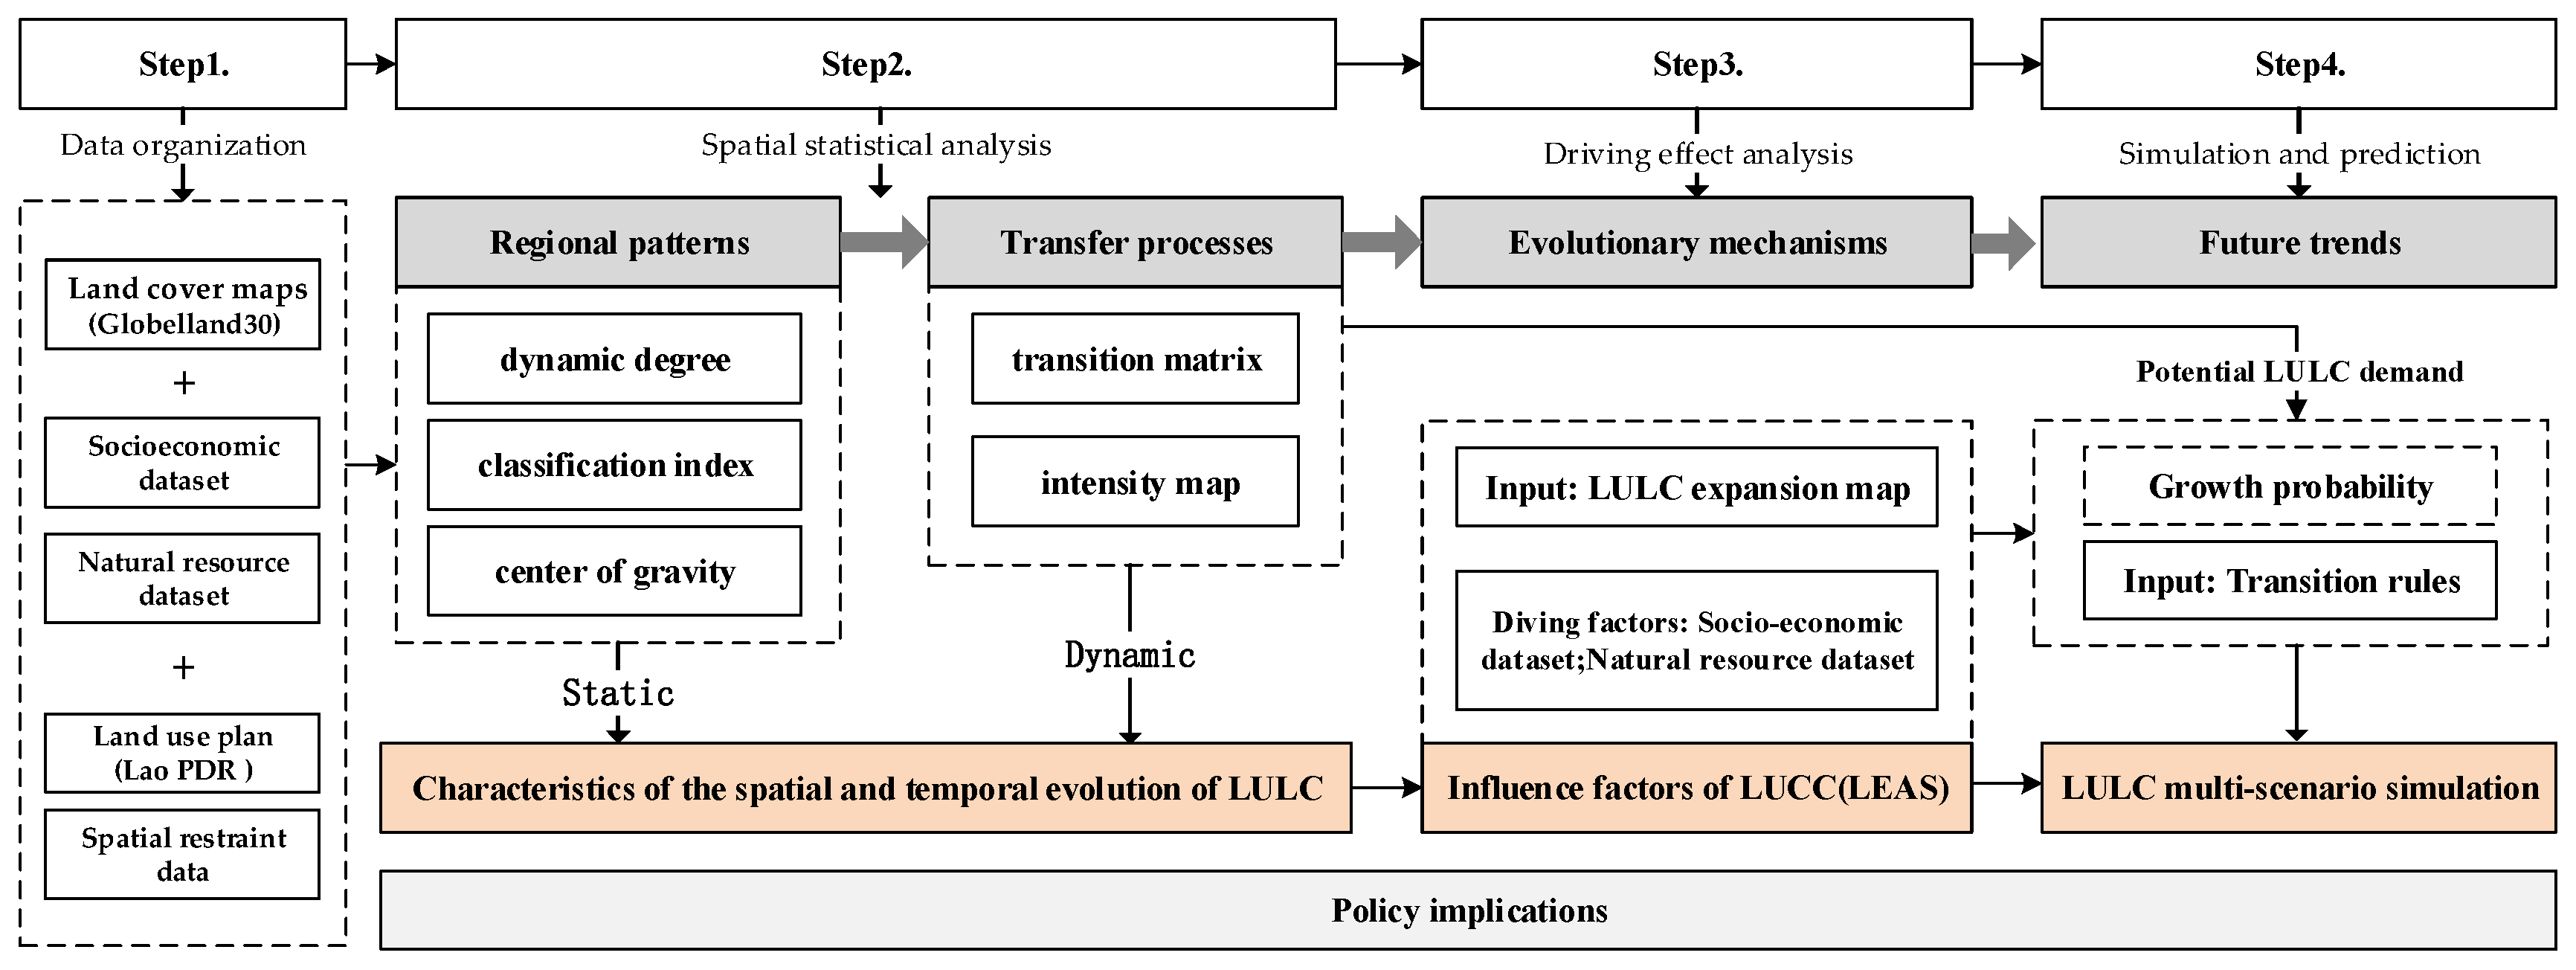
2.3. Methods
2.3.1. Characteristics of the Spatial and Temporal Evolution of LULC
- (1)
- Land use dynamic degree
- (2)
- Land use transition matrix
- (3)
- LUCC intensity
- (4)
- Comprehensive Index of Land Use Degree
2.3.2. Analysis of Factors Contributing to Land Expansion
2.3.3. Land Use Forecast Model
3. Results
3.1. Spatio-Temporal Characteristics of Land Use Evolution
3.1.1. Overall Land Cover Changes
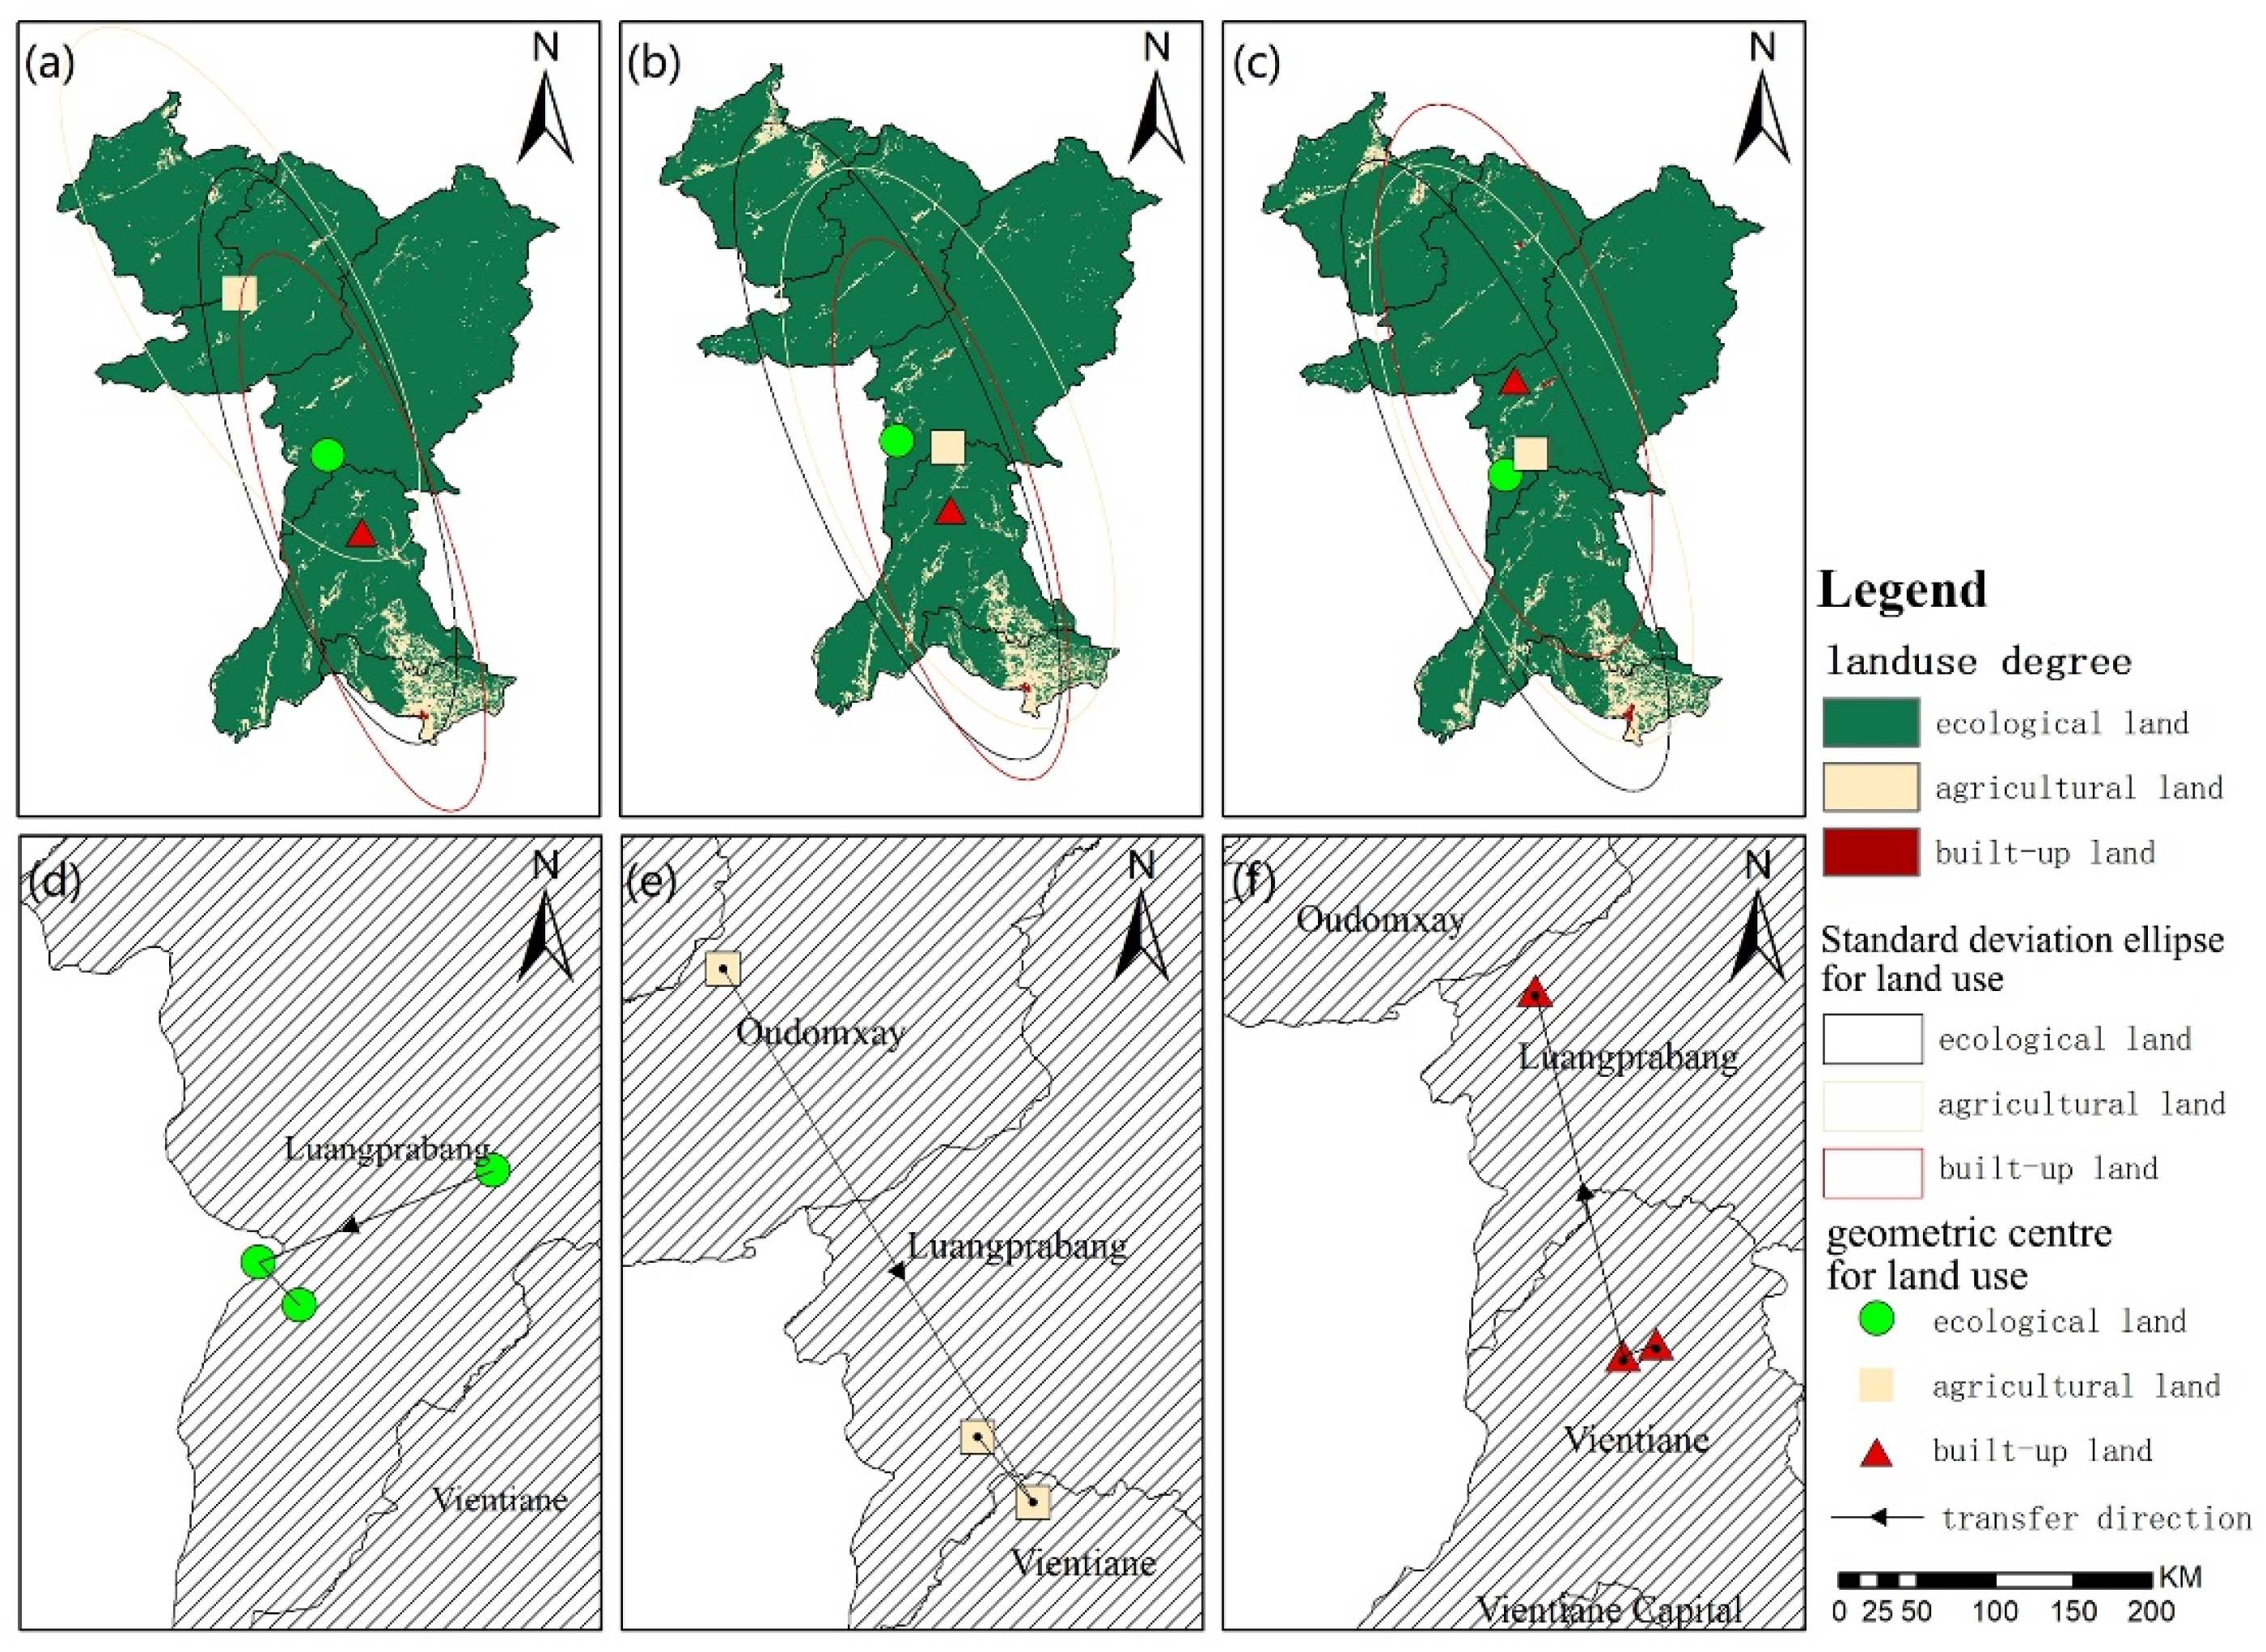
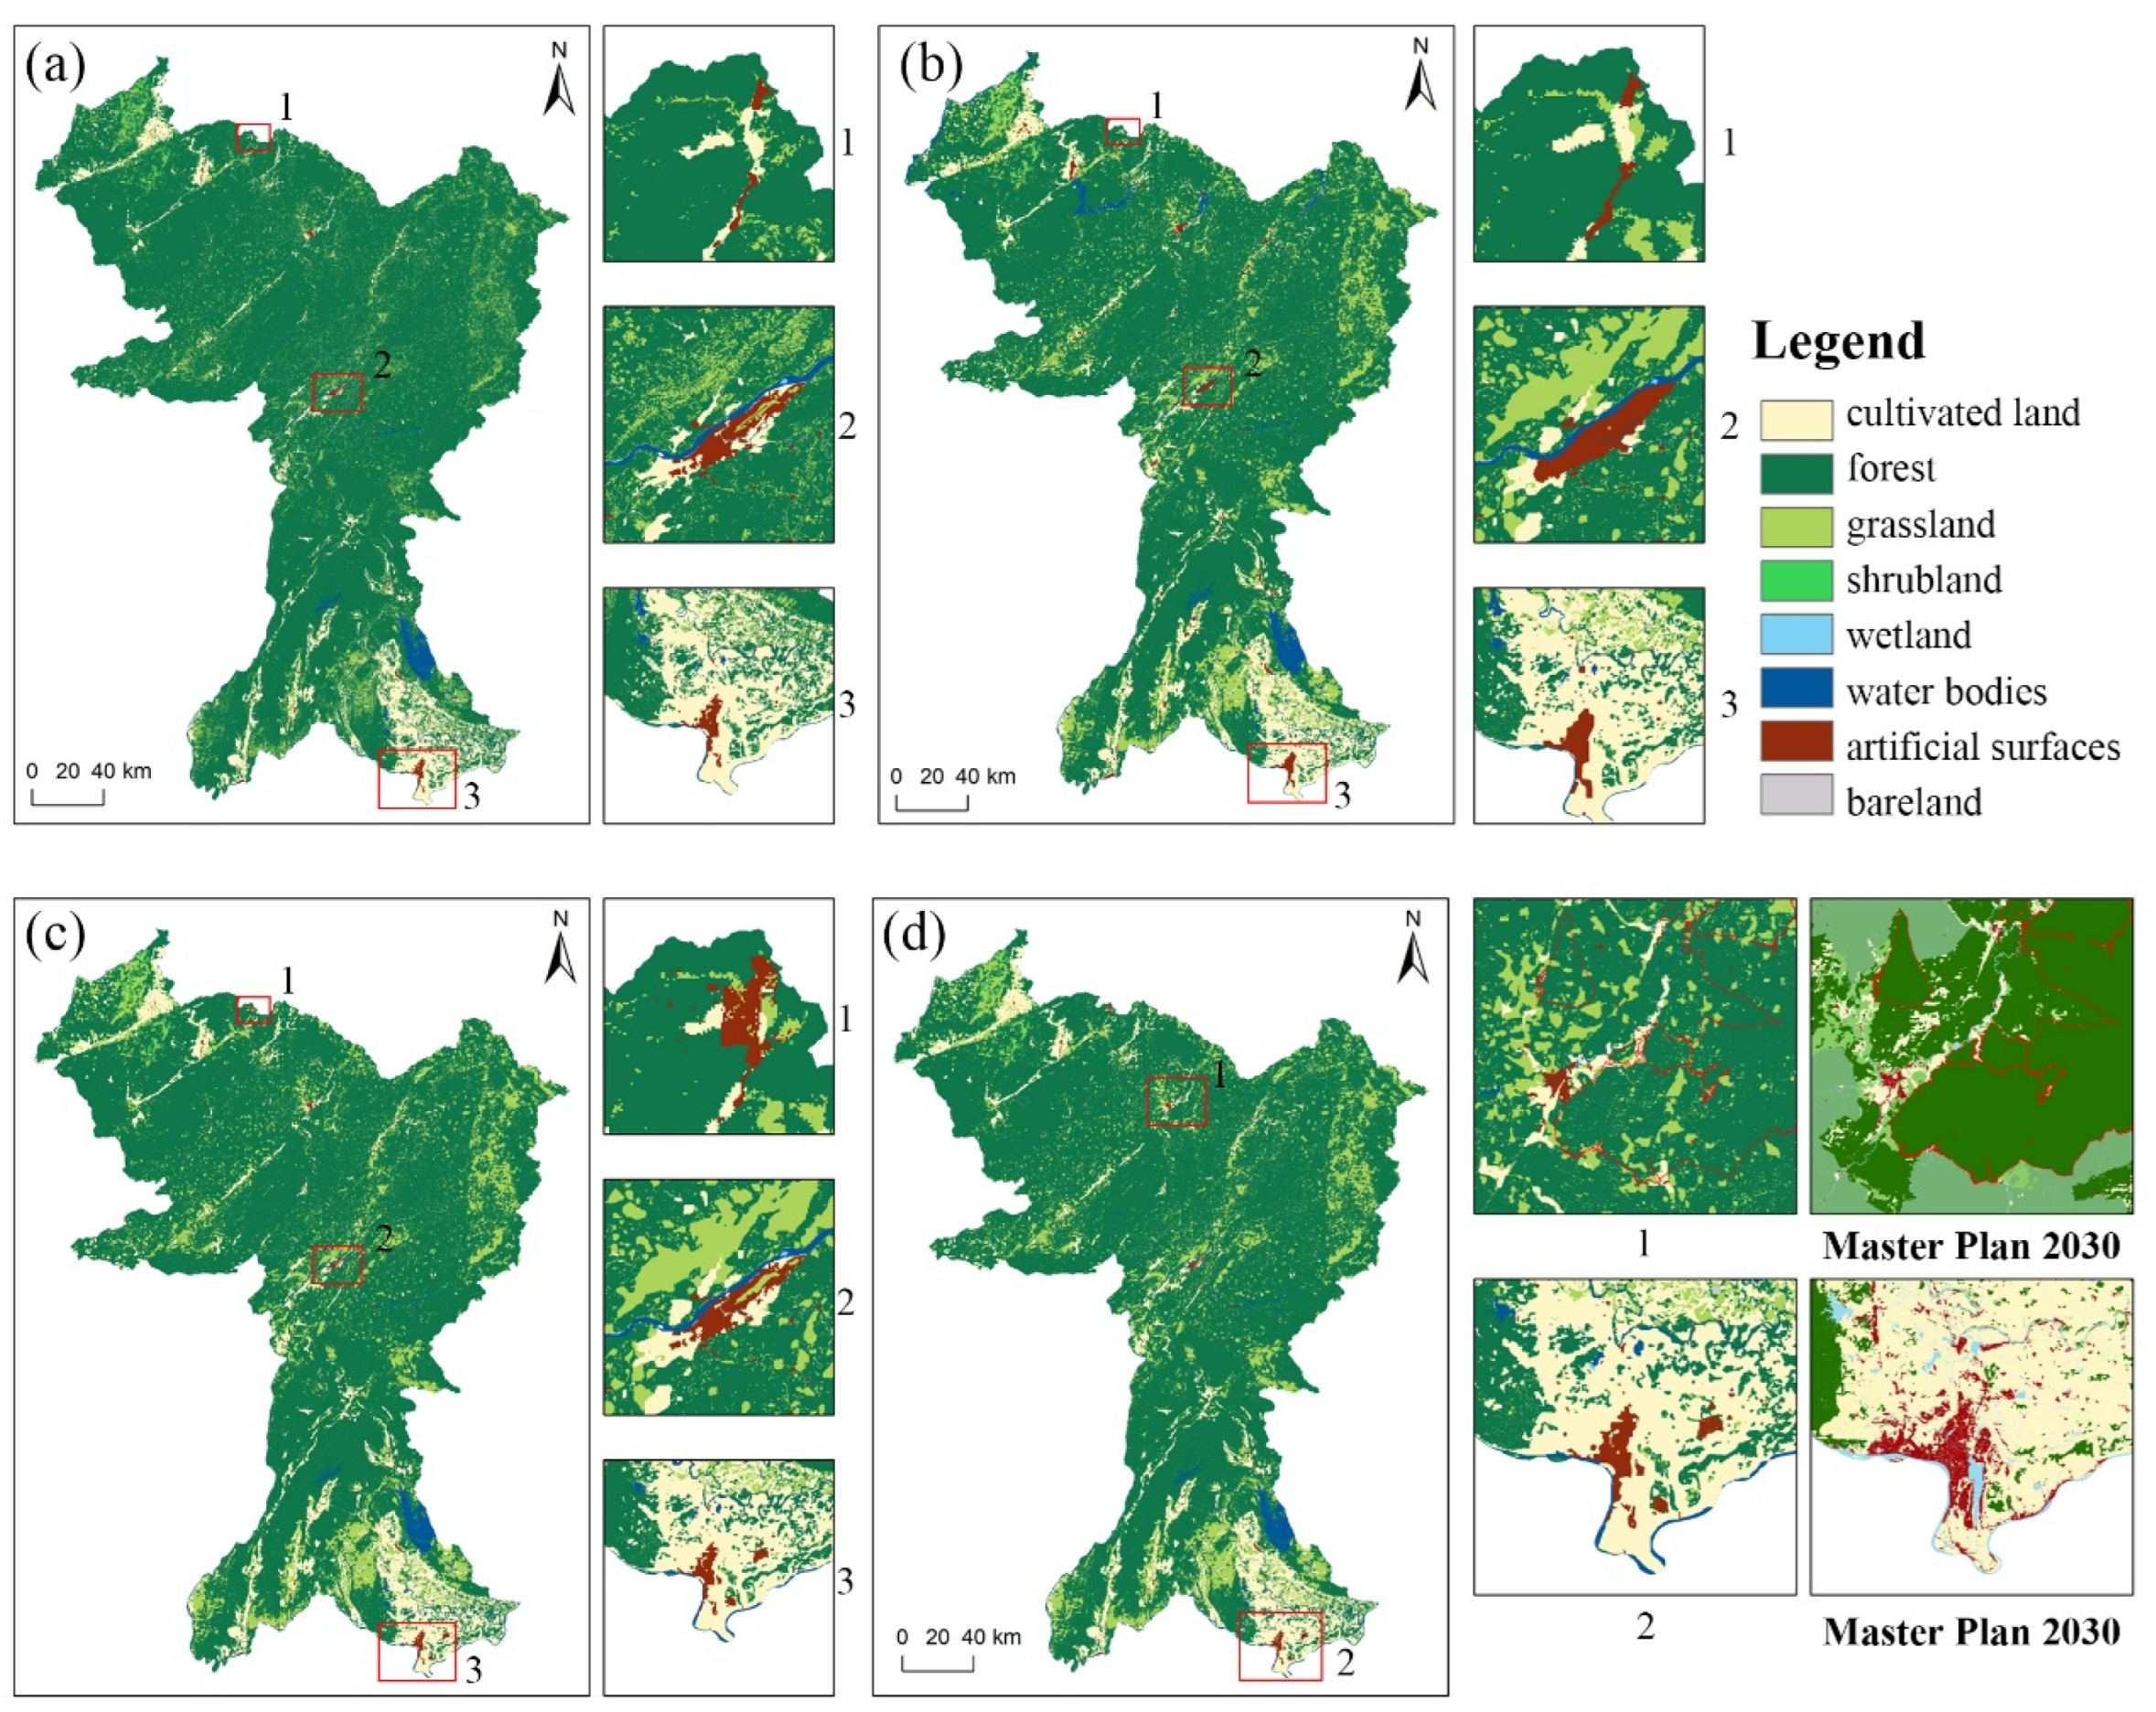
3.1.2. Spatial Pattern of Land Use
3.1.3. Land Use Transition Pathways
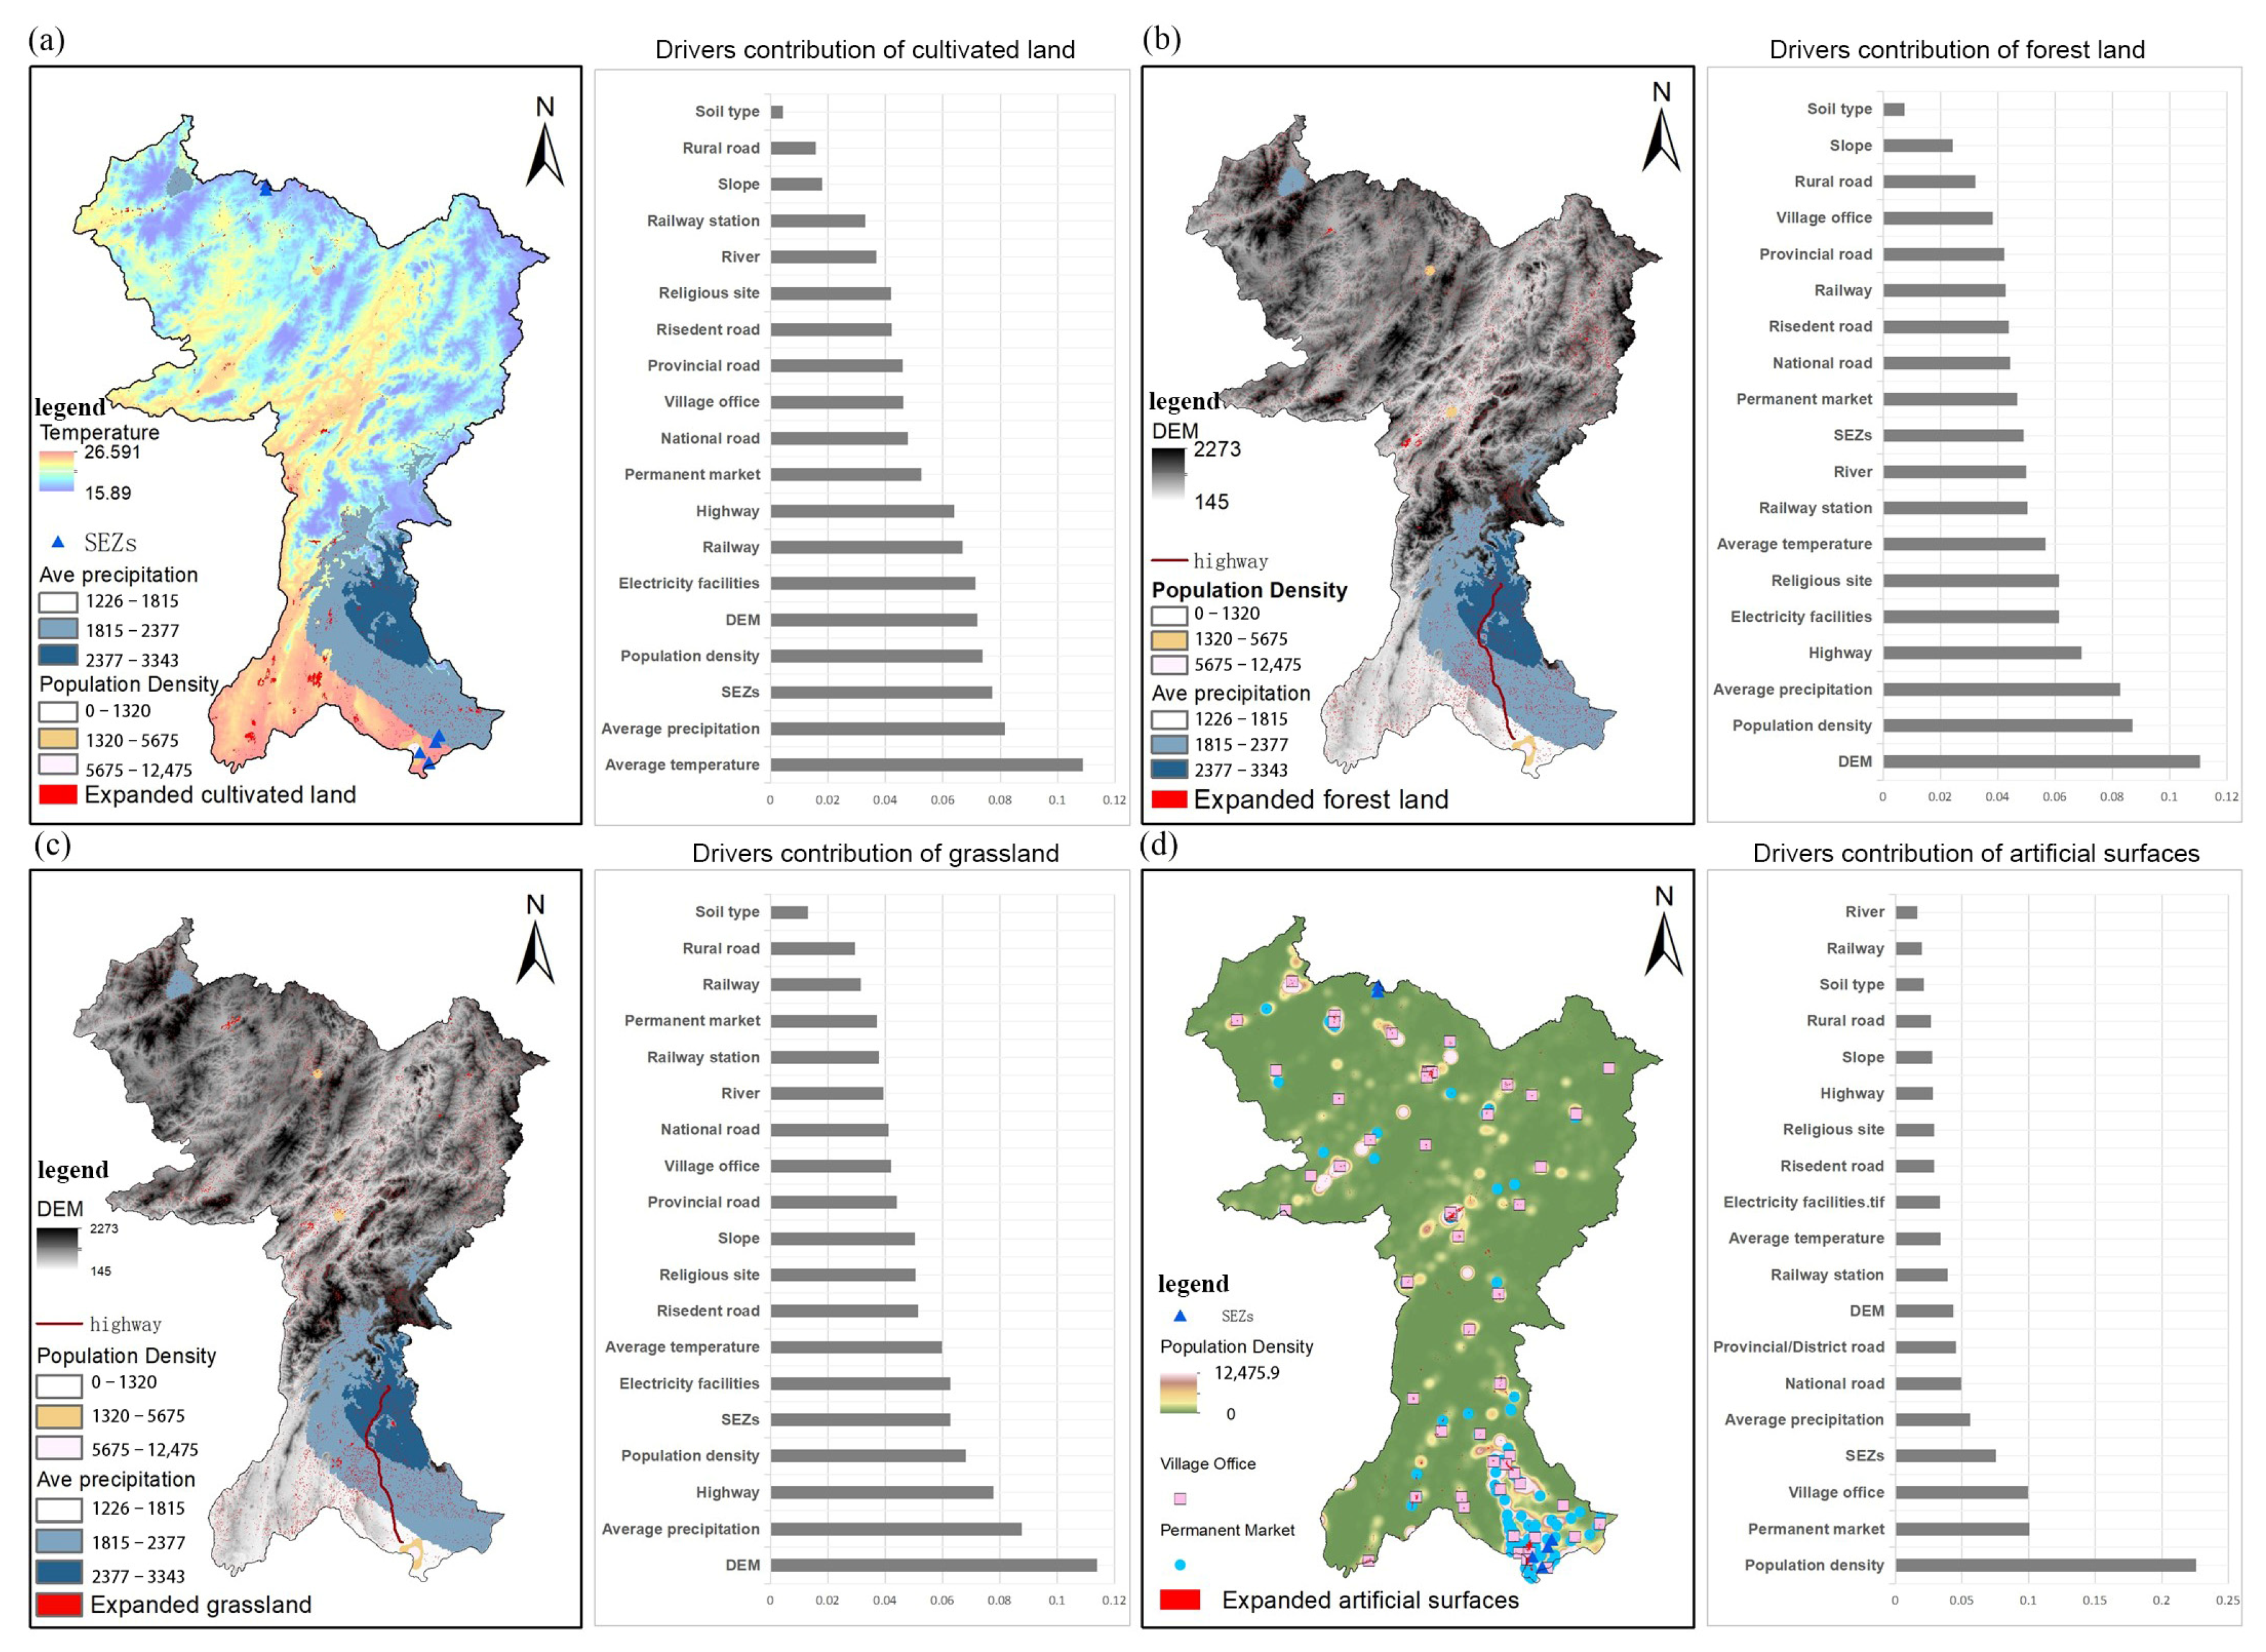
3.2. Contribution Analysis of Driving Factors
3.3. Multi-Scenario Simulation of LULC
- (1)
- Baseline Development (BD)
- (2)
- Investment-prioritized development (IPD)
- (3)
- Harmonious development (HD)
4. Discussion
4.1. Evolution of Spatial Patterns of Land Use in Economic Corridors
4.2. Land Use Structure and Transition Pathways in Economic Corridors
4.3. Trends and Challenges in Land Use Development in Economic Corridors
4.4. Policy Implications
5. Conclusions
- Shift to a Dumbbell Structure in Land Use Patterns: With the construction of economic corridors, the land use pattern in Laos’ corridor regions has gradually shifted from a “single-core radial” structure to a “dumbbell-shaped” structure. The development and restructuring of land-use functions have created new growth points, potentially alleviating issues of unbalanced spatial development typical of the Global South, where metropolitan areas often develop disproportionately. However, due to a weak economic foundation and an export-oriented economy, the corridor tends to favor this two-end aggregation, reinforcing a dumbbell pattern.
- Land Use Conflicts Through Unidirectional Conversion: In the evolution of spatial land use, the unidirectional flow from forestland to cultivated land and cultivated land to artificial surfaces serves as a potential source of land-use conflict. From 2000 to 2020, there was a substantial transformation between forestland, grassland, and cultivated land in the Laos corridor. A systematic trend was observed in the conversion of forestland to grassland, with forestland loss intensifying over time. This process of unidirectional transition poses a risk for land use conflicts in Global South economic corridors, necessitating appropriate guidance and timely control.
- Mechanisms of Land Use Pattern Evolution: Although geographic and climatic conditions still play a decisive role in shaping cultivated land, forestland, and grassland, the series of projects within economic corridors have reshaped the socio-economic and spatial environment of these areas. Key factors such as transportation infrastructure and industrial spatial layout drive changes in the patterns of ecological land, agricultural land, and built-up land. The 2030 forecast underscores the need for urgent spatial planning intervention, with land management rules that prioritize both forest protection and intensive development to balance economic growth and environmental preservation.
Author Contributions
Funding
Data Availability Statement
Conflicts of Interest
References
- Anderson, J.E.; Van Wincoop, E. Trade costs. J. Econ. Lit. 2004, 42, 691–751. [Google Scholar] [CrossRef]
- Brunner, H.-P. What is economic corridor development and what can it achieve in Asia’s subregions? Asian Dev. Bank Econ. Work. Pap. Ser. 2013, 117, 11. [Google Scholar] [CrossRef]
- Campbell, M.M.; Hauptfleisch, A.C. The impact of the Maputo development corridor on wealth creation within the region it serves. J. Civ. Eng. Archit. 2012, 6, 1184. [Google Scholar]
- Laurance, W.F.; Sloan, S.; Weng, L.; Sayer, J.A. Estimating the environmental costs of Africa’s massive “development corridors”. Curr. Biol. 2015, 25, 3202–3208. [Google Scholar] [CrossRef] [PubMed]
- Nanhthavong, V.; Epprecht, M.; Hett, C.; Zaehringer, J.G.; Messerli, P. Poverty trends in villages affected by land-based investments in rural Laos. Appl. Geogr. 2020, 124, 102298. [Google Scholar] [CrossRef]
- Borras, S.M., Jr.; Mills, E.N.; Seufert, P.; Backes, S.; Fyfe, D.; Herre, R.; Michéle, L. Transnational land investment web: Land grabs, TNCs, and the challenge of global governance. Globalizations 2020, 17, 608–628. [Google Scholar] [CrossRef]
- Li, J.; Wang, J.; Zhang, J.; Zhang, J.; Kong, H. Dynamic changes of vegetation coverage in China-Myanmar economic corridor over the past 20 years. Int. J. Appl. Earth Obs. Geoinf. 2021, 102, 102378. [Google Scholar] [CrossRef]
- Kaarhus, R. Agricultural growth corridors equals land-grabbing? Models, roles and accountabilities in a Mozambican case. In Proceedings of the International Conference on Global Land Grabbing, Brighton, UK, 6–8 April 2011. [Google Scholar]
- Sloan, S.; Campbell, M.J.; Alamgir, M.; Engert, J.; Ishida, F.Y.; Senn, N.; Huther, J.; Laurance, W.F. Hidden challenges for conservation and development along the Trans-Papuan economic corridor. Environ. Sci. Policy 2019, 92, 98–106. [Google Scholar] [CrossRef]
- Taylor, G. Urban Geography: A Study of Site, Evolution, Patern and Classification in Villages, Towns and Cities; Routledge: London, UK, 1949. [Google Scholar]
- Whebell, C.F. Corridors: A theory of urban systems. Ann. Assoc. Am. Geogr. 1969, 59, 1–26. [Google Scholar] [CrossRef]
- Romein, A.; Trip, J.J.; de Vries, J. The multi-scalar complexity of infrastructure planning: Evidence from the Dutch–Flemish megacorridor. J. Transp. Geogr. 2003, 11, 205–213. [Google Scholar] [CrossRef]
- Chapman, D.; Pratt, D.; Larkham, P.; Dickins, I. Concepts and definitions of corridors: Evidence from England’s Midlands. J. Transp. Geogr. 2003, 11, 179–191. [Google Scholar] [CrossRef]
- Priemus, H.; Zonneveld, W. What are corridors and what are the issues? Introduction to special issue: The governance of corridors. J. Transp. Geogr. 2003, 11, 167–177. [Google Scholar]
- Dühr, S.; Stead, D.; Zonneveld, W. The Europeanization of spatial planning through territorial cooperation. Plan. Pract. Res. 2007, 22, 291–307. [Google Scholar] [CrossRef]
- De Vries, J.; Priemus, H. Megacorridors in north-west Europe: Issues for transnational spatial governance. J. Transp. Geogr. 2003, 11, 225–233. [Google Scholar] [CrossRef]
- Hospers, G.-J. Beyond the Blue Banana? Structural change in Europe’s geo-economy. Intereconomics 2003, 38, 76–85. [Google Scholar] [CrossRef]
- Georg, I.; Blaschke, T.; Taubenböck, H. A global inventory of urban corridors based on perceptions and night-time light imagery. ISPRS Int. J. Geo-Inf. 2016, 5, 233. [Google Scholar] [CrossRef]
- Webster, D.; Muller, L. Challenges of Peri-Urbanization in the Lower Yangtze Region: The Case of the Hangzhou-Ningbo Corridor; Asia/Pacific Research Center Stanford: Stanford, CA, USA, 2002. [Google Scholar]
- De, P. ASEAN-India Connectivity: An Indian Perspective. In ASEAN-India Connectivity: The Comprehensive Asia Development Plan Phase II; ERIA: Jakarta, Indonesia, 2011; pp. 96–150. [Google Scholar]
- Yeung, Y.; Lo, F. Global Restructuring and Emerging Urban Corridors in Pacific Asia; UNU Press: Tokyo, Japan, 1996; pp. 17–47. [Google Scholar]
- Rizvi, H.A. The China-Pakistan Economic Corridor. Strateg. Stud. 2014, 34, 1–17. [Google Scholar]
- UNHABITAT. The State of African Cities 2008: A Framework for Addressing Urban Challenges in Africa; UNHABITAT: Nairobi, Kenya, 2008. [Google Scholar]
- Li, P.; Cao, X. Evolution and development of Guangzhou-Hong Kong corridor. Chin. Geogr. Sci. 2005, 15, 206–211. [Google Scholar] [CrossRef]
- Moghadam, H.S.; Helbich, M. Spatiotemporal urbanization processes in the megacity of Mumbai, India: A Markov chains-cellular automata urban growth model. Appl. Geogr. 2013, 40, 140–149. [Google Scholar] [CrossRef]
- Dharmapatni, I.A.I.; Firman, T. Problems and Challenges of Mega-Urban Regions in Indonesia: The Case of Jabotabek and the Bandung Metropolitan Area; University of British Columbia Press: Vancouver, BC, Canada, 1995; pp. 296–314. [Google Scholar]
- Linthicum, A.S.; Lambert, J.H. Risk management for infrastructure corridors vulnerable to adjacent land development. J. Risk Res. 2010, 13, 983–1006. [Google Scholar] [CrossRef]
- Cao, X.; Yan, X. A review of corridor and transport corridor. City Plan. Rev. 2003, 27, 50–56. [Google Scholar]
- Huang, Z.; Du, X. How does high-speed rail affect land value? Evidence from China. Land Use Policy 2021, 101, 105068. [Google Scholar] [CrossRef]
- Biswas, P.; Dey, P. Spatio-temporal impact of industrial corridor development on built-up growth: A case of Delhi–Mumbai industrial corridor, India. GeoJournal 2023, 88, 3791–3815. [Google Scholar] [CrossRef]
- Li, D.; Wang, X. Land-use change and efficiency in Laos’ Special Economic Zones. Land 2021, 10, 1012. [Google Scholar] [CrossRef]
- Mengistu, D.T.; Gebremariam, E.; Wang, X.; Zhao, S. Trans-Regional railway corridor implications on urbanization. J. Infrastruct. Policy Dev. 2024, 8, 3456. [Google Scholar] [CrossRef]
- Newman, P.W.; Kenworthy, J.R. The land use—Transport connection: An overview. Land Use Policy 1996, 13, 1–22. [Google Scholar] [CrossRef]
- Sutton, C.J. Land use change along Denver’s I-225 beltway. J. Transp. Geogr. 1999, 7, 31–41. [Google Scholar] [CrossRef]
- Srivastava, P. Regional corridors development in regional cooperation. Asian Dev. Bank Econ. Work. Pap. Ser. 2011, 258, 1–10. [Google Scholar]
- Vreeker, R.; De Groot, H.L.; Verhoef, E.T. Urban multifunctional land use: Theoretical and empirical insights on economies of scale, scope and diversity. Built Environ. 2004, 30, 289–307. [Google Scholar] [CrossRef]
- Quium, A.A. Transport corridors for wider socio–economic development. Sustainability 2019, 11, 5248. [Google Scholar] [CrossRef]
- Sang, C.C.; Olago, D.O.; Ongeri, Z.J. The factors driving land cover transitions and land degradation and the potential impacts of the proposed developments in the Isiolo dam watershed, LAPSSET corridor, Kenya. Discov. Sustain. 2023, 4, 9. [Google Scholar] [CrossRef]
- Van Der Ree, R.; Smith, D.J.; Grilo, C. Handbook of Road Ecology; John Wiley & Sons: Hoboken, NJ, USA, 2015. [Google Scholar]
- Sang, C.C.; Olago, D.O.; Nyumba, T.O.; Marchant, R.; Thorn, J.P.R. Assessing the underlying drivers of change over two decades of land use and land cover dynamics along the standard gauge railway corridor, Kenya. Sustainability 2022, 14, 6158. [Google Scholar] [CrossRef]
- Guo, L.; Di, L.; Tian, Q. Detecting spatio-temporal changes of arable land and construction land in the Beijing-Tianjin corridor during 2000–2015. J. Geogr. Sci. 2019, 29, 702–718. [Google Scholar]
- Stan, K.D.; Sanchez-Azofeifa, A. The Edmonton-Calgary corridor: Simulating future land cover change under potential government intervention. Land Use Policy 2017, 63, 356–368. [Google Scholar] [CrossRef]
- Pijanowski, B.C.; Brown, D.G.; Shellito, B.A.; Manik, G.A. Using neural networks and GIS to forecast land use changes: A land transformation model. Comput. Environ. Urban Syst. 2002, 26, 553–575. [Google Scholar] [CrossRef]
- Van Asselen, S.; Verburg, P.H. Land cover change or land-use intensification: Simulating land system change with a global-scale land change model. Glob. Change Biol. 2013, 19, 3648–3667. [Google Scholar] [CrossRef] [PubMed]
- Braimoh, A.K.; Onishi, T. Spatial determinants of urban land use change in Lagos, Nigeria. Land Use Policy 2007, 24, 502–515. [Google Scholar] [CrossRef]
- Van Vliet, J.; de Groot HL, F.; Rietveld, P.; Verburg, P.H. Manifestations and underlying drivers of agricultural land use change in Europe. Landsc. Urban Plan. 2015, 133, 24–36. [Google Scholar] [CrossRef]
- Wang, J.; Lin, Y.; Glendinning, A.; Xu, Y. Land-use changes and land policies evolution in China’s urbanization processes. Land Use Policy 2018, 75, 375–387. [Google Scholar] [CrossRef]
- Hoshino, S. Statistical Analysis of Land-Use Change and Driving Forces in the Kansai District; IIASA: Laxenburg, Austria, 1996. [Google Scholar]
- Noszczyk, T.; Rutkowska, A.; Hernik, J. Determining Changes in Land Use Structure in Małopolska Using Statistical Methods. Pol. J. Environ. Stud. 2017, 26, 211–220. [Google Scholar] [CrossRef]
- Gao, L.; Tao, F.; Liu, R.; Wang, Z.; Leng, H.; Zhou, T. Multi-scenario simulation and ecological risk analysis of land use based on the PLUS model: A case study of Nanjing. Sustain. Cities Soc. 2022, 85, 104055. [Google Scholar] [CrossRef]
- ADB. Initial Assessments of Road Transport Infrastructure and Transport and Logistic Services for Trade Facilitation in the GMS Countries; ADB: Manila, Philippines, 2012. [Google Scholar]
- Xiao, C.; Wang, Y.; Yan, M.; Chiaka, J.C. Impact of cross-border transportation corridors on changes of land use and landscape pattern: A case study of the China-Laos railway. Landsc. Urban Plan. 2024, 241, 104924. [Google Scholar] [CrossRef]
- Xiao, C.; Li, P.; Feng, Z.; You, Z.; Jiang, L.; Boudmyxay, K. Is the phenology-based algorithm for mapping deciduous rubber plantations applicable in an emerging region of northern Laos? Adv. Space Res. 2020, 65, 446–457. [Google Scholar] [CrossRef]
- Jun, C.; Ban, Y.; Li, S. Open access to Earth land-cover map. Nature 2014, 514, 434. [Google Scholar] [CrossRef] [PubMed]
- Arsanjani, J.J.; Tayyebi, A.; Vaz, E. GlobeLand30 as an alternative fine-scale global land cover map: Challenges, possibilities, and implications for developing countries. Habitat Int. 2016, 55, 25–31. [Google Scholar] [CrossRef]
- Fick, S.; Hijmans, R. New 1 km spatial resolution climate surfaces for global land areas. Int. J. Climatol. 2021, 5086. [Google Scholar] [CrossRef]
- Chen, S.; Tong, Q.; Guo, H. Study of Information Mechanism of Remote Sensing; Science Press: Beijing, China, 1998. [Google Scholar]
- Qiao, W.; Sheng, Y.; Fang, B.; Wang, Y. Land use change information mining in highly urbanized area based on transfer matrix: A case study of Suzhou, Jiangsu Province. Geogr. Res. 2013, 32, 1497. [Google Scholar]
- Yang, J.; Gong, J.; Gao, J.; Ye, Q. Stationary and systematic characteristics of land use and land cover change in the national central cities of China using intensity analysis: A case study of Wuhan City. Resour. Sci. 2019, 41, 701–716. [Google Scholar]
- Li, S.; Gong, J.; Yang, J.; Chen, G.; Zhang, Z.; Zhang, M. Characteristics of LUCC patterns of the Lanzhou-Xining urban agglomeration: Based on an intensity analysis framework. Resour. Sci. 2023, 45, 480–493. [Google Scholar]
- Liang, X.; Guan, Q.; Clarke, K.C.; Liu, S.; Wang, B.; Yao, Y. Understanding the drivers of sustainable land expansion using a patch-generating land use simulation (PLUS) model: A case study in Wuhan, China. Comput. Environ. Urban Syst. 2021, 85, 101569. [Google Scholar] [CrossRef]
- Li, X.; Wang, Y.; Li, J.; Lei, B. Physical and socioeconomic driving forces of land-use and land-cover changes: A Case Study of Wuhan City, China. Discret. Dyn. Nat. Soc. 2016, 2016, 8061069. [Google Scholar] [CrossRef]
- Liu, J.; Deng, X. Progress of the research methodologies on the temporal and spatial process of LUCC. Chin. Sci. Bull. 2010, 55, 1354–1362. [Google Scholar] [CrossRef]
- Badoe, D.A.; Miller, E.J. Transportation–land-use interaction: Empirical findings in North America, and their implications for modeling. Transp. Res. Part D Transp. Environ. 2000, 5, 235–263. [Google Scholar] [CrossRef]
- Kasraian, D.; Maat, K.; Stead, D.; van Wee, B. Long-term impacts of transport infrastructure networks on land-use change: An international review of empirical studies. Transp. Rev. 2016, 36, 772–792. [Google Scholar] [CrossRef]
- Bao, J.; Gao, S.; Ge, J. Dynamic land use and its policy in response to environmental and social-economic changes in China: A case study of the Jiangsu coast (1750–2015). Land Use Policy 2019, 82, 169–180. [Google Scholar] [CrossRef]
- Wang, X. Analysis on demographic factors and land use/land cover change. Resour. Sci. 2000, 22, 39–43. [Google Scholar]
- Stuart-Fox, M. A History of Laos; Cambridge University Press: Cambridge, UK, 1997. [Google Scholar]
- Liu, X.; Jiang, L.; Feng, Z.; Li, P. Rubber plantation expansion related land use change along the Laos-China border region. Sustainability 2016, 8, 1011. [Google Scholar] [CrossRef]
- Geist, H.; Lambin, E. What drives tropical deforestation? In A Meta-Analysis of Proximate and Underlying Causes of Deforestation Based on Subnational Case Study Evidence; LUCC International Project Office: Louvain-la-Neuve, Belgium, 2001; Volume 4, p. 116. [Google Scholar]
- Wu, C.-F.; Lin, Y.-P.; Chiang, L.-C.; Huang, T. Assessing highway’s impacts on landscape patterns and ecosystem services: A case study in Puli Township, Taiwan. Landsc. Urban Plan. 2014, 128, 60–71. [Google Scholar] [CrossRef]
- Zheng, F.; Huang, J.; Feng, Z.; Xiao, C. Impact of the Kunming–Bangkok highway on land use changes along the route between Laos and Thailand. Land 2021, 10, 991. [Google Scholar] [CrossRef]
- Lesutis, G. How to understand a development corridor? The case of Lamu Port–South Sudan–Ethiopia-Transport corridor in Kenya. Area 2020, 52, 600–608. [Google Scholar] [CrossRef]
- Kanchan, A.; Nitivattananon, V.; Tripathi, N.K.; Winijkul, E.; Mandadi, R.R. A spatio-temporal examination of land use and land cover changes in smart cities of the Delhi–Mumbai industrial corridor. Land 2024, 13, 957. [Google Scholar] [CrossRef]
- Vongpraseuth, T.; Choi, C.G. Globalization, foreign direct investment, and urban growth management: Policies and conflicts in Vientiane, Laos. Land Use Policy 2015, 42, 790–799. [Google Scholar] [CrossRef]
- Vongvisouk, T.; Mertz, O.; Thongmanivong, S.; Heinimann, A.; Phanvilay, K. Shifting cultivation stability and change: Contrasting pathways of land use and livelihood change in Laos. Appl. Geogr. 2014, 46, 1–10. [Google Scholar] [CrossRef]
- Dong, S.; Li, Y.; Li, Y.; Li, S. Spatiotemporal patterns and drivers of land use and land cover change in the China-Mongolia-Russia economic corridor. Pol. J. Environ. Stud. 2021, 30, 1–15. [Google Scholar] [CrossRef]
- Naboureh, A.; Li, A.; Bian, J.; Lei, G.; Nan, X. Land cover dataset of the China Central-asia West-asia Economic Corridor from 1993 to 2018. Sci. Data 2023, 10, 728. [Google Scholar] [CrossRef] [PubMed]
- Fan, Z.; Li, S.; Fang, H. Explicating the mechanisms of land cover change in the New Eurasian Continental Bridge Economic Corridor region in the 21st century. J. Geogr. Sci. 2021, 31, 1403–1418. [Google Scholar] [CrossRef]
- Wettasin, M.; Chaiyarat, R.; Youngpoy, N.; Jieychien, N.; Sukmasuang, R.; Tanhan, P. Environmental factors induced crop raiding by wild Asian elephant (Elephas maximus) in the Eastern Economic Corridor, Thailand. Sci. Rep. 2023, 13, 13388. [Google Scholar] [CrossRef]
- Li, X.; Zhang, X.; Xu, X. Precipitation and anthropogenic activities jointly green the China–Mongolia–Russia economic corridor. Remote Sens. 2022, 14, 187. [Google Scholar] [CrossRef]
- Assessment, M.E. Millennium Ecosystem Assessment; World Resources Institute: Washington, DC, USA, 2005. [Google Scholar]
- Ramankutty, N.; Foley, J.A.; Olejniczak, N.J. People on the land: Changes in global population and croplands during the 20th century. AMBIO A J. Hum. Environ. 2002, 31, 251–257. [Google Scholar] [CrossRef]
- Reddy, C.S.; Singh, S.; Dadhwal, V.K.; Jha, C.S.; Rao, N.R.; Diwakar, P.G. Predictive modelling of the spatial pattern of past and future forest cover changes in India. J. Earth Syst. Sci. 2017, 126, 8. [Google Scholar] [CrossRef]
- Thongmanivong, S.; Fujita, Y.; Fox, J. Resource use dynamics and land-cover change in Ang Nhai village and Phou Phanang National Reserve forest, Lao PDR. Environ. Manag. 2005, 36, 382–393. [Google Scholar] [CrossRef]
- Wolfersberger, J.; Delacote, P.; Garcia, S. An empirical analysis of forest transition and land-use change in developing countries. Ecol. Econ. 2015, 119, 241–251. [Google Scholar] [CrossRef]
- Zhai, J.; Xiao, C.; Feng, Z.; Liu, Y. Spatio-Temporal Patterns of Land-Use Changes and Conflicts between Cropland and Forest in the Mekong River Basin during 1990–2020. Land 2022, 11, 927. [Google Scholar] [CrossRef]


| Data Type | Data Name | Source |
|---|---|---|
| Land cover maps | LUCC2000/2010/2020 | GlobeLand30 (http://globeland30.org/, accessed on 5 June 2024) |
| Land use plan | Land Use Master Plan2030 | Lao PDR Geographic Information Platform (https://apps.k4d.la/explorer/, accessed on 10 June 2024) Open Street Map (http://www.openstreetmap.org/, accessed on 10 June 2024) |
| Spatial restraint data | Lakes | |
| Rivers | ||
| National Protection Forest Area | ||
| Socio-economic dataset | Administrative boundary | |
| Population density | ||
| Highway | ||
| Railway | ||
| Railway station | ||
| National road | ||
| Rural road | ||
| Provincial road | ||
| Residential road | ||
| SEZs | ||
| Electricity | ||
| Permanent market | ||
| Community office | ||
| Religious site | ||
| Natural resource dataset | Soil type | |
| Average temperature | ||
| Average precipitation | ||
| DEM | USGS (https://www.usgs.gov/, accessed on 10 June 2024) | |
| Slope |
| Land Use Degree | Land Cover Type | Index |
|---|---|---|
| Ecological land | Forest, grassland, shrubland, wetland, water bodies | 1 |
| Agricultural land | Cultivated land | 2 |
| Built-up land | Artificial surfaces | 3 |
| Time (Year) | 2000 | 2010 | 2020 | K (The Single Land Use Dynamic Degree) | ||
|---|---|---|---|---|---|---|
| 2000–2010 | 2010–2020 | 2000–2020 | ||||
| Cultivated land | 3132.587 | 3773.854 | 3800.890 | 2.047 | 0.072 | 1.067 |
| Forest | 49,318.946 | 48,441.016 | 47,907.157 | −0.178 | −0.110 | −0.143 |
| Grassland | 4399.753 | 4637.147 | 4824.366 | 0.540 | 0.404 | 0.483 |
| Shrubland | 105.645 | 150.045 | 150.192 | 4.203 | 0.010 | 2.108 |
| Wetland | 8.083 | 5.733 | 4.811 | −2.908 | −1.608 | −2.024 |
| Water bodies | 673.974 | 625.226 | 773.962 | −0.723 | 2.379 | 0.742 |
| Artificial surfaces | 39.844 | 45.812 | 214.57 | 1.498 | 36.838 | 21.927 |
| Bare land | 0.035 | 0.035 | 2.913 | 0.000 | 0.000 | 0.000 |
| Administrative Region | Classification Index of Land Use Degree | 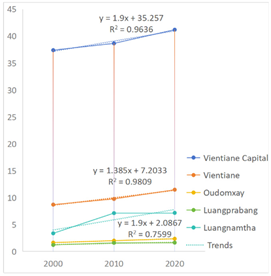 | ||
| 2000 | 2010 | 2020 | ||
| Vientiane Capital | 37.37 | 38.63 | 41.17 | |
| Vientiane | 8.70 | 9.75 | 11.47 | |
| Oudomxay | 1.65 | 2.01 | 2.36 | |
| Luangprabang | 1.22 | 1.61 | 1.65 | |
| Luangnamtha | 3.37 | 7.12 | 7.17 | |
| Cumulative index | 52.32 | 59.12 | 63.81 | |
| ∆LUD | - | 11.5% | 7.3% | |
| 2000–2010 | Cultivated Land | Forest | Grassland | Shrubland | Wetland | Water Bodies | Artificial Surfaces | Bare Land | Total2000 |
| Cultivated land | 2788.064 | 263.417 | 66.011 | 0.481 | 0.077 | 7.174 | 7.366 | - | 3132.588 |
| Forest | 821.761 | 46,893.545 | 1546.565 | 27.840 | 0.149 | 28.726 | 0.361 | - | 49,318.946 |
| Grassland | 136.937 | 1215.149 | 2976.462 | 46.704 | 0.817 | 23.265 | 0.420 | - | 4399.754 |
| Shrubland | 0.368 | 17.269 | 13.811 | 74.081 | - | 0.115 | 0.002 | - | 105.646 |
| Wetland | 0.756 | 1.201 | 1.097 | 0.005 | 1.521 | 3.505 | - | - | 8.084 |
| Waterbodies | 24.087 | 50.216 | 33.148 | 0.936 | 3.170 | 562.246 | 0.172 | - | 673.975 |
| Artificial surfaces | 1.882 | 0.221 | 0.055 | - | - | 0.195 | 37.492 | - | 39.845 |
| Bare land | - | - | - | - | - | - | - | 0.035 | 0.035 |
| Total 2010 | 3773.855 | 48,441.0 | 4637.147 | 150.045 | 5.733 | 625.226 | 45.813 | 0.035 | 57,678.872 |
| 2010–2020 | Cultivated land | Forest | Grassland | Shrubland | Wetland | Waterbodies | Artificial surfaces | Bare land | Total2010 |
| Cultivated land | 3339.460 | 198.458 | 91.042 | 0.383 | 0.045 | 27.807 | 116.659 | - | 3773.855 |
| Forest | 368.350 | 46,481.315 | 1394.863 | 26.321 | 0.141 | 131.140 | 36.220 | 2.668 | 48,441.017 |
| Grassland | 83.543 | 1178.429 | 3304.231 | 17.086 | 0.098 | 36.077 | 17.458 | 0.227 | 4637.147 |
| Shrubland | 0.592 | 24.976 | 17.658 | 106.187 | - | 0.493 | 0.140 | - | 150.045 |
| Wetland | 0.050 | 0.074 | 0.019 | - | 3.975 | 1.616 | - | - | 5.733 |
| Waterbodies | 7.153 | 23.796 | 15.769 | 0.216 | 0.552 | 576.761 | 0.961 | 0.019 | 625.226 |
| Artificial surfaces | 1.743 | 0.077 | 0.783 | - | - | 0.069 | 43.141 | - | 45.813 |
| Bare land | - | 0.034 | 0.001 | - | - | - | - | - | 0.035 |
| Total 2020 | 3800.891 | 47,907.1 | 4824.366 | 150.192 | 4.811 | 773.962 | 214.578 | 2.913 | 57,678.872 |
Disclaimer/Publisher’s Note: The statements, opinions and data contained in all publications are solely those of the individual author(s) and contributor(s) and not of MDPI and/or the editor(s). MDPI and/or the editor(s) disclaim responsibility for any injury to people or property resulting from any ideas, methods, instructions or products referred to in the content. |
© 2024 by the authors. Licensee MDPI, Basel, Switzerland. This article is an open access article distributed under the terms and conditions of the Creative Commons Attribution (CC BY) license (https://creativecommons.org/licenses/by/4.0/).
Share and Cite
Dong, M.; Wang, X.; Yan, Y.; Li, D. Land Use Challenges in Emerging Economic Corridors of the Global South: A Case Study of the Laos Economic Corridor. Land 2024, 13, 2236. https://doi.org/10.3390/land13122236
Dong M, Wang X, Yan Y, Li D. Land Use Challenges in Emerging Economic Corridors of the Global South: A Case Study of the Laos Economic Corridor. Land. 2024; 13(12):2236. https://doi.org/10.3390/land13122236
Chicago/Turabian StyleDong, Mingjuan, Xingping Wang, Yiran Yan, and Dongxue Li. 2024. "Land Use Challenges in Emerging Economic Corridors of the Global South: A Case Study of the Laos Economic Corridor" Land 13, no. 12: 2236. https://doi.org/10.3390/land13122236
APA StyleDong, M., Wang, X., Yan, Y., & Li, D. (2024). Land Use Challenges in Emerging Economic Corridors of the Global South: A Case Study of the Laos Economic Corridor. Land, 13(12), 2236. https://doi.org/10.3390/land13122236