Article

Climate Proofing Cities by Navigating Nature-Based Solutions in a Multi-Scale, Social–Ecological Urban Planning Context: A Case Study of Flood Protection in the City of Gothenburg, Sweden

1
Tingsryds kommun, P.O. Box 88, 362 22 Tingsryd, Sweden
2
Ljusdal Energi, Björkhamrevägen 2 A, 827 35 Ljusdal, Sweden
3
Department of Building Engineering, Energy Systems and Sustainability Science, University of Gävle, Kungsbäcksvägen 47, 801 76 Gävle, Sweden
4
The Beijer Institute of Ecological Economics, Royal Swedish Academy of Sciences, 104 05 Stockholm, Sweden
5
Department of Architecture and Civil Engineering, Chalmers University of Technology, 412 96 Gothenburg, Sweden
*
Author to whom correspondence should be addressed.
Land 2024, 13(2), 143; https://doi.org/10.3390/land13020143
Submission received: 27 December 2023 / Revised: 22 January 2024 / Accepted: 22 January 2024 / Published: 26 January 2024

Abstract

:
Due to unsustainable land management and climate change, floods have become more frequent and severe over the past few decades and the problem is exacerbated in urban environments. In the context of climate-proofing cities, the importance of nature-based solutions (NBSs), obtaining relevant outcomes in the form of ecosystem services, has been highlighted. Although the role of ecosystem services in building resilience against negative climate change effects is widely recognized and there is an identified need to better integrate ecosystem services into urban planning and design, this has proven difficult to operationalize. A critical limitation is that modeling is a time-consuming and costly exercise. The purpose is to roughly estimate the ecosystem service of water run-off mitigation through simplified, cost-effective, and user-friendly modelling at three nested biophysical scales, under four climate change scenarios. Using the Swedish city of Gothenburg as an example, we propose an approach for navigating NBS-oriented flooding adaptation strategies, by quantifying the ecosystem service of water run-off mitigation at three nested biophysical scales, under four climate change scenarios, hence, proposing an approach for how to navigate nature-based solutions in a multi-scale, social–ecological urban planning context against present and future flooding events. Our findings validate the effectiveness of employing an ecosystem service approach to better comprehend the significant climate change issue of flooding through user-friendly and cost-efficient modeling.

1. Introduction

Urban green spaces have recently been shown to be an effective tool for regulating climate [1,2]. Climate change is predicted to increase the frequency and intensity of extreme weather events, potentially increasing the severity of various natural disasters. Carbon emission mitigation through so-called nature-based solutions (NBSs) involves working with green space as a tool through ecosystem services and green infrastructure. Assuming maximum theoretical implementation, the NBSs in the residential, transport and industrial sectors have been shown to reduce urban carbon emissions by up to 25% [2]. Hence, conserving green spaces in cities is an important strategy to mitigate and adapt to climate change. Additionally, the potential of green spaces and their ecosystem services to enhance resilience against the adverse effects of climate change is widely acknowledged [3,4]. However, this aspect is rarely scrutinized in urban development schemes not the least due to that it is a highly time-consuming and labor-intensive process with associated economic costs.
Conserving urban green spaces is important for several of the 17 Sustainable Development Goals (SDGs) and their associated targets as well as for enacting and implementing the various policy initiatives of the European Green Deal. Because comprehensive assessments are both time-consuming and economically costly, an alternative approach could involve analyzing the impact of urban incremental growth on specific types of ecosystem services [5]. This is particularly important in a climate-change context in which such services may become critical to conserve.
The purpose of this paper is to roughly estimate the ecosystem service of water run-off mitigation through simplified, cost-effective, and user-friendly modelling. Using the Swedish city of Gothenburg as an example, we propose an approach for navigating NBS-oriented flooding adaptation strategies, by quantifying the ecosystem service of water run-off mitigation at three nested biophysical scales, under four climate change scenarios, Using the Swedish city of Gothenburg as an example, this paper presents an approach for navigating NBS-oriented flooding adaptation strategies, by quantifying the ecosystem service of water run-off mitigation at three nested biophysical scales, under four climate change scenarios. We propose an approach for how to navigate a nature-based solution framework in a multiscale, social–ecological urban planning context against present and future flooding events. We quantify the ecosystem service of water run-off mitigation at three nested biophysical scales, under four climate-change scenarios, comprising: (a) a planned, site-specific, local urban development project named Kärra-Skogome, located north of Gothenburg; (b) the sub-drainage basin area within which Kärra-Skogome is located; and (c) the large-scale Västra Götaland region, within which the city of Gothenburg constitutes the core. To facilitate the implementation of the suggested approach in an urban planning context, we utilize user-friendly, open-source tools with low data requirements for quantifying ecosystem services. We elaborate on how the proposed approach can contribute to both informing urban planning and governance processes at various biophysical scales, aiming to climate-proof entire cities against flooding, with a focus on the suitability of applying a rather simple, non-costly, and user-friendly modelling approach known as the InVEST model. It enables decision-makers to evaluate quantified tradeoffs linked to alternative management decisions and pinpoint areas where investing in natural capital can improve both human development and conservation efforts [6].

1.1. Theoretical Background

Floods are the most common extreme weather events and can cause heavy damage to property, infrastructure, and lives [7,8]. While numerous technical and strategic solutions exist to address flooding, historical patterns reveal the difficulty in altering human behavior, particularly the persistent tendency to construct in low-lying floodplains or near rivers. Despite previous research offering insights on improving flood risk management, studies indicate that material damage and casualties resulting from river floods remain alarmingly high in many regions worldwide [9]. Among the different types of floods, e.g., coastal, fluvial, and pluvial [10,11], this article will focus on pluvial flooding, which occurs when an area is overwhelmed by heavy rainfall. This type of flooding is usually local and can cause significant damage in urban areas, especially if the drainage system is inadequate or overwhelmed [10,11]. Due to unsustainable land management practices coupled with climate change, floods have become more frequent and severe at a global level over the past few decades [12,13,14], and the problem is exacerbated in the built environment as impervious surfaces of urban areas reduce adaptation to flooding that is otherwise provided by vegetation and soil [8,12]. At the same time, we are observing exponential urbanization [15], which, amongst other things, will further intensify land-use transformation, potentially turning even more green areas into urban built-up land [5]. Urban green spaces through their generation of ecosystem services, both within cities as well as in the surrounding regional landscape, have proven essential for providing cities with the goods and services they need for basic consumption and waste disposal [16], including the provisioning of services for adapting to current and future climate threats [2,17,18].

1.1.1. Nature-Based Solutions for Climate Proofing Cities

In an effort to acknowledge the importance of the work of urban natural areas for moving towards sustainable and resilient societies, not least in a climate-change context [19,20,21], the Intergovernmental Panel for Climate Change (IPCC), as well as the Intergovernmental Science-Policy Platform on Biodiversity and Ecosystem Services (IPBES) have highlighted the importance of NBSs [17,22]. More specifically, NBS is an umbrella term for the development pathways that utilize natural features—as opposed to solely relying on, for example, man-made technologies and grey infrastructure—for addressing societal challenges [20,23]. NBSs include strategies like green roofs and urban parks to enhance urban sustainability, while practices like riparian buffer zones and agroforestry focus on restoring ecosystems and promoting sustainable agriculture. Additionally, approaches such as constructed wetlands and living shorelines exemplify how nature-based solutions can mitigate environmental challenges by utilizing natural processes for water treatment and coastal protection. NBSs can also be used in what is known as ‘hybrid infrastructure’, constituting built environments coupled with landscape-scale biophysical structures and processes for dealing with increased variation in the frequency, magnitude and different phases of climate-related disturbances [24]. The NBS term encompasses established concepts, such as ecological engineering, ecosystem-based adaptation, and green-blue infrastructure [25]. NBSs are supported in large-scale EU policies, like the European Green Deal, the Biodiversity Strategy for 2030, and the Green Infrastructure Strategy [26]. The European Commission defines the application of NBSs as: “... the deliberate inclusion of natural system processes within human environments to obtain relevant outcomes in the form of ecosystem services” [27] (p. 19).

1.1.2. The Scale-Related Challenge of Integrating NBSs into Urban Planning

Although the potential role of ecosystem services in building resilience against negative climate-change effects is widely recognized [3,4], this insight has often proven difficult to operationalize in an urban planning context. In fact, although there is a clearly identified need to better integrate ecosystem services into urban planning and design [17,28,29], this integration is still, to a great extent, lacking. This is often due to financial constraints and limited fiscal budgets [5]. When NBS-oriented policy and action plans are implemented in an urban planning and design context, they are often limited to small-scale interventions at the micro-scale of cities, such as the construction of green roofs, rain gardens, permeable and porous pavement, vegetated swales and bioretention. While implementing small-scale NBSs certainly is useful, climate-proofing an entire city, or parts of a city, requires upscaling such as at the regional level of a city or a drainage basin context [30,31,32]. Depending on the ecosystem service at hand, such upscaling may not be as straightforward as merely implementing NBSs in appropriate places in the city. Such upscaling may also be difficult because of the lack of suitable modelling methods to assess more complex spatial contextual factors [33].

2. Case Study Background

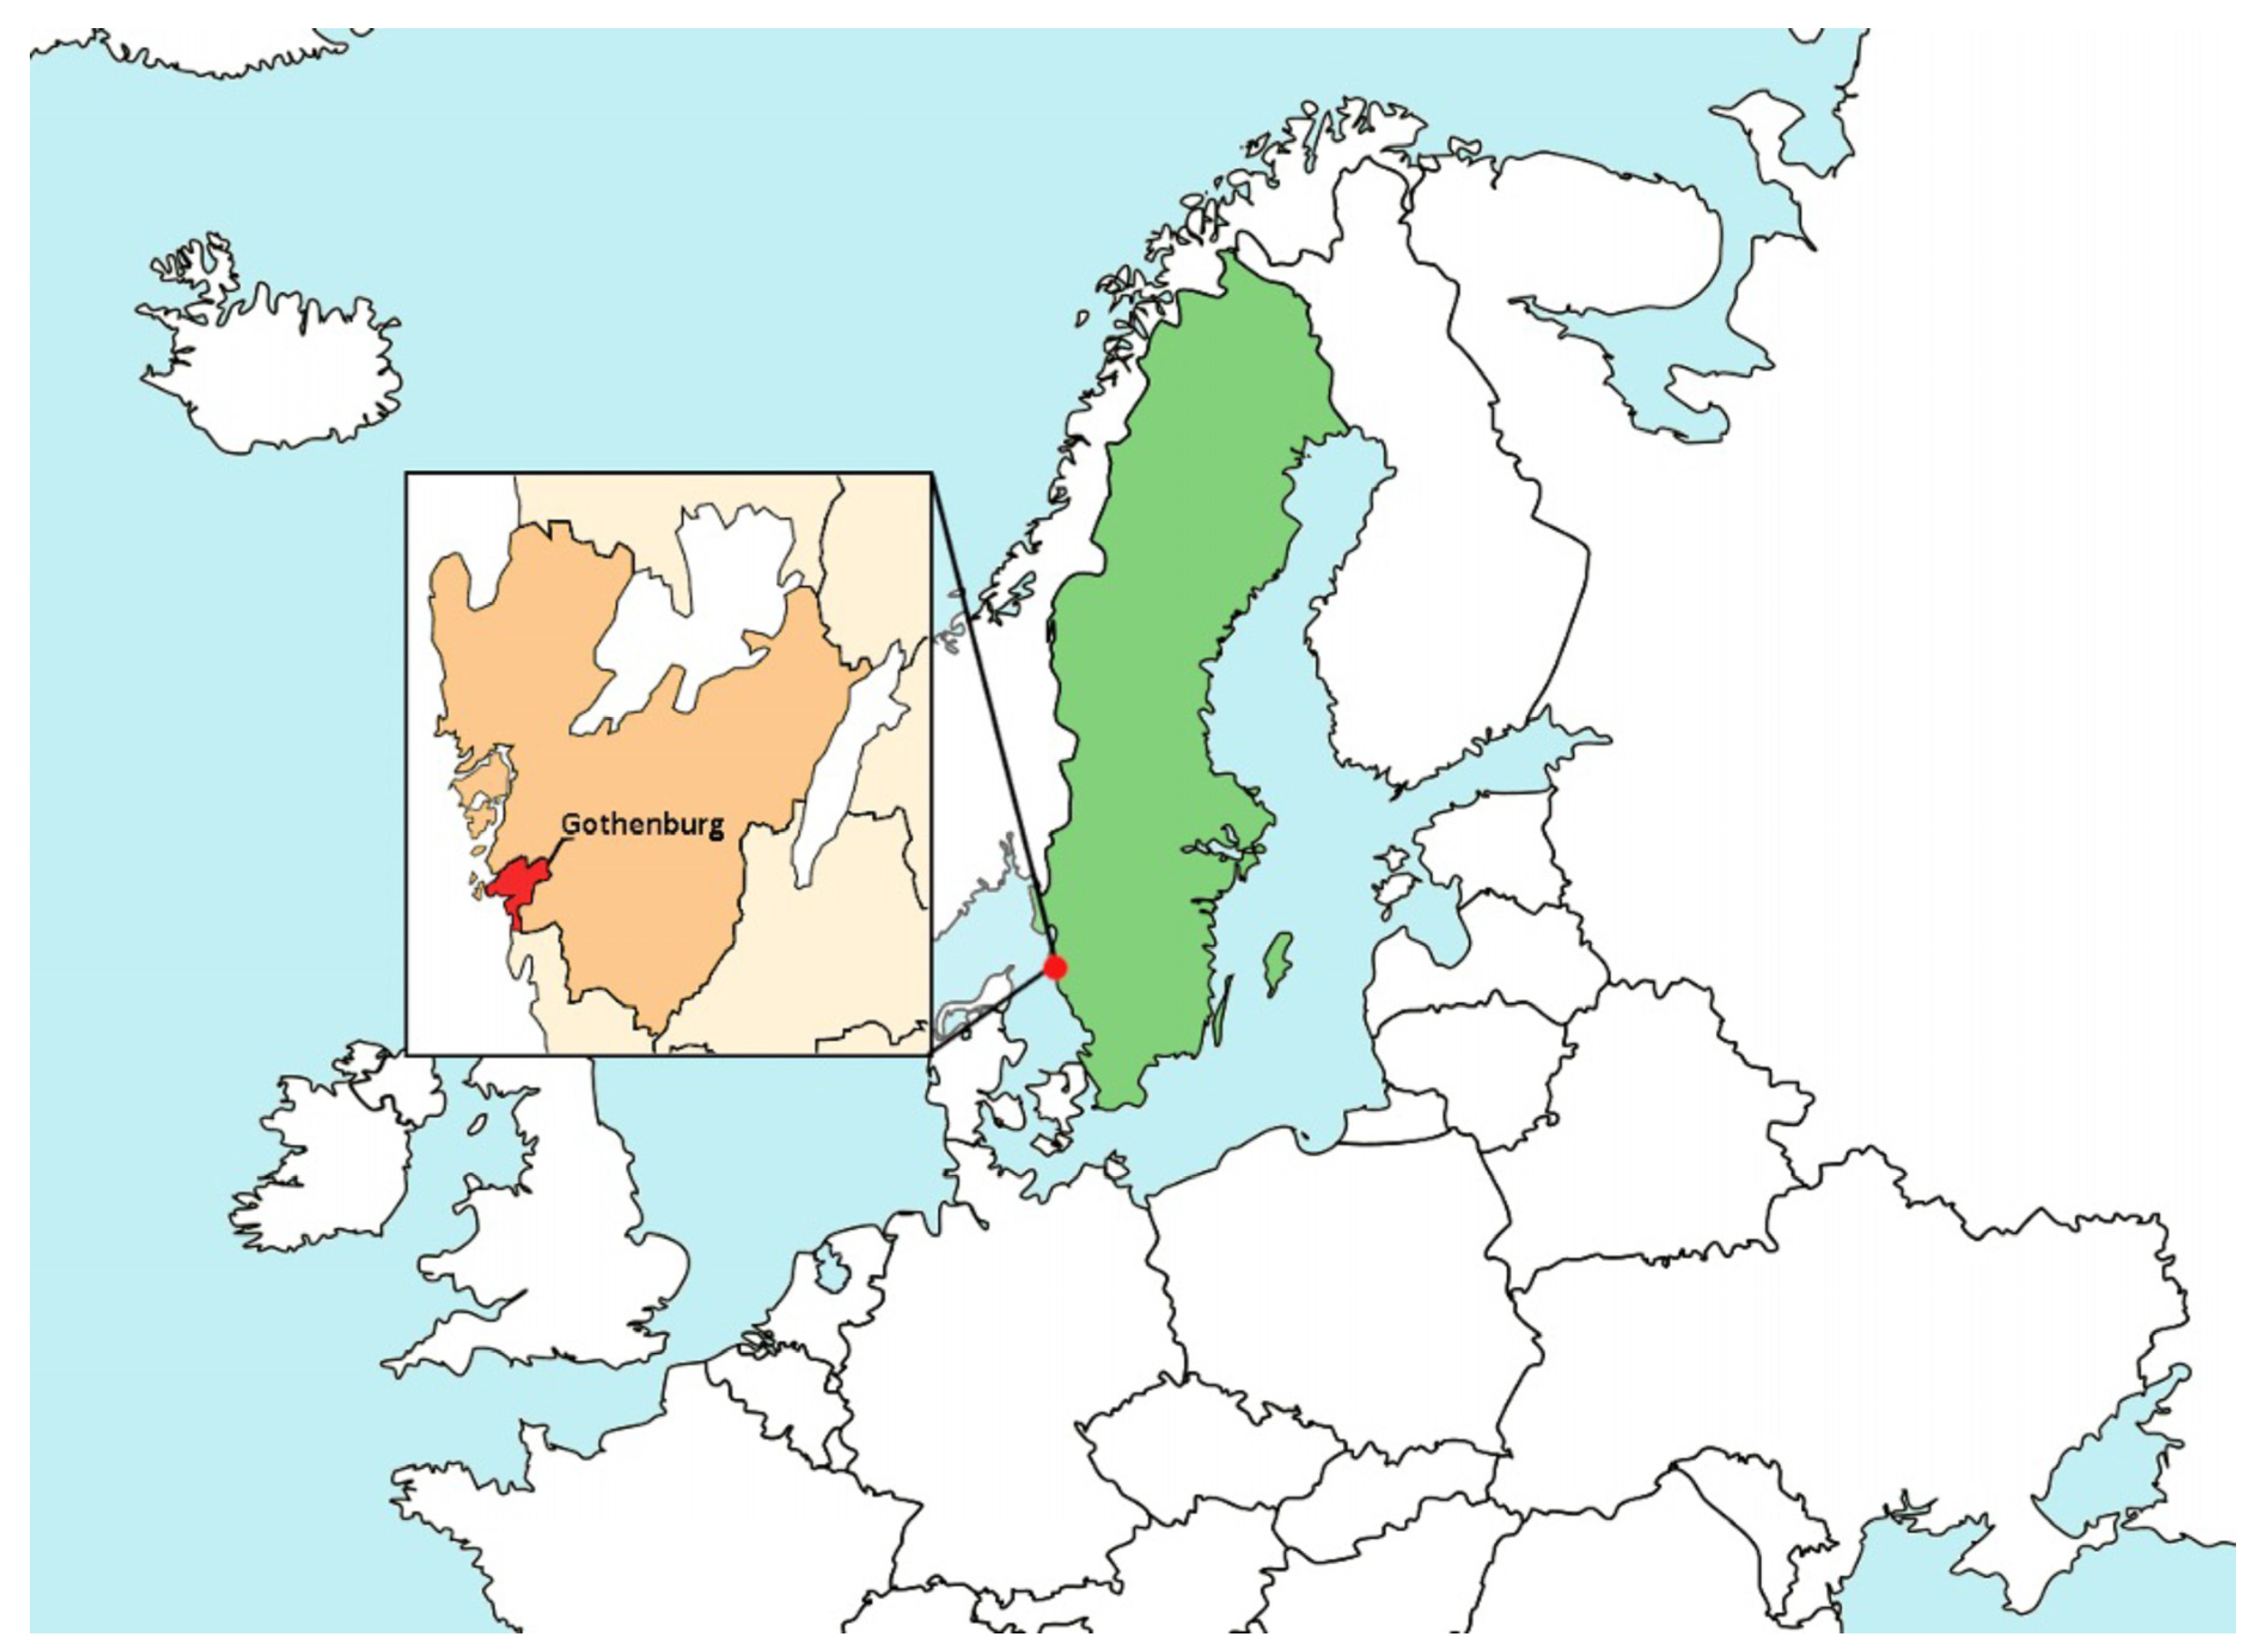
2.1. The City of Gothenburg

Sweden is predicted to experience increased frequency and intensity of heavy rainfall events, while simultaneously being in a phase of prominent urbanization [34,35]. Gothenburg municipality has set ambitious goals in the context of climate change [36], whilst also facing challenges in accommodating housing shortages [37]. The city is undergoing a development phase that involves substantial construction of housing and major infrastructure, with explicit objectives of promoting densification and restricting urban sprawl.
Although flooding affects most Swedish municipalities, the city of Gothenburg, due to its coastal location and being located at the confluence of many important rivers, including Mölndalsån, Säveån, and Göta River (Figure 1), is particularly vulnerable, making a large portion of the city prone to multiple types of flooding. Pluvial flooding, which is the focus of this study, occurs when an area is overwhelmed by heavy rainfall. This type of flooding is usually local and can cause significant damage in urban areas, especially if the drainage system is inadequate or overwhelmed [10,11].
Also, the soil type in focus here is largely composed of clay and the landscape has a varied topography, where parts of the vegetation (mainly forests) are located on a higher elevation than the built areas below, making natural infiltration solutions and the capability of draining heavy rains challenging [38]. Hence, the city of Gothenburg faces climate change challenges on multiple fronts [38].

2.2. Scales of Study Interest

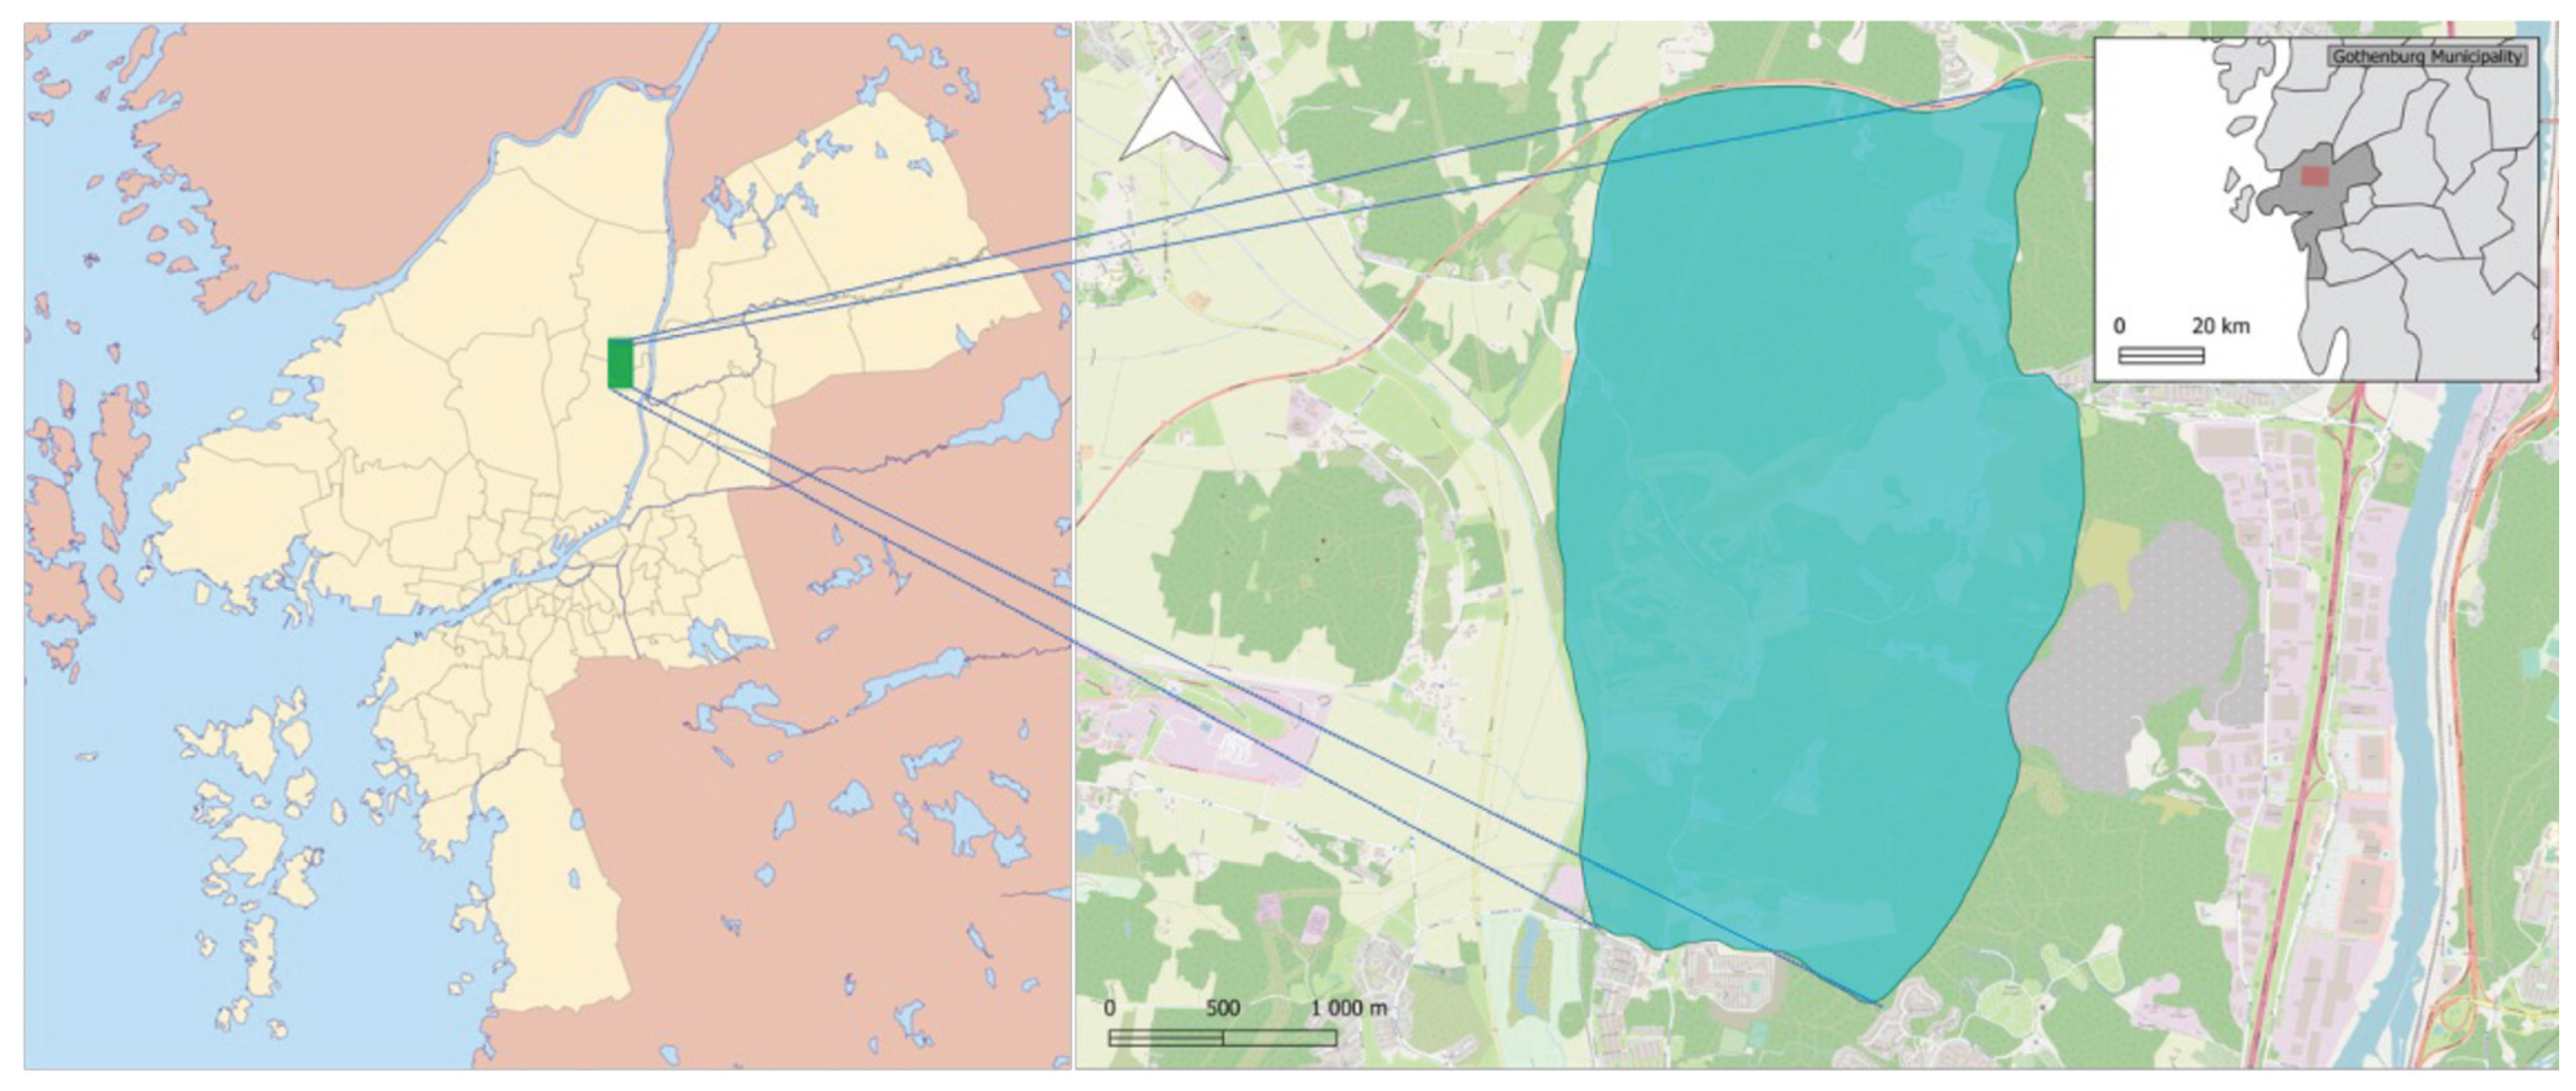
2.2.1. Kärra-Skogome

To explore NBS-oriented flooding adaptation strategies within a nested multiscale social–ecological and urban planning context, the planned urban development project, Kärra-Skogome (Figure 2), was selected as a local-scale example for several reasons: (a) the project serves as an illustration of the growing trend in ‘urban development thinking,’ involving the establishment of new urban nuclei outside the city center [39]; (b) the area is situated upstream of Göta River, north of Gothenburg; and (c) its implementation involves the transformation of multiple natural ecosystems, primarily forests into urban land use, potentially affecting the ecosystem service of water runoff mitigation.
The study area is approximately 750 hectares and consists of agricultural and grazing land, as well as forest and marshland. Besides a handful of buildings in the south and the golf club ‘Albatross’, the area is rather sparsely populated [40]. Apart from the residences that the area is planned to accommodate, it is also planned to provide community services, town centre functions, and parks. The development of the area will require new infrastructure, public transport, water and sewerage, and energy supply [40]. The landscape contains valuable natural and cultural environments and a small area of agricultural land [36]. While previous assessments of the area have appraised natural values, including protected habitats, red-listed species, water protection areas, and cultural heritage interests [40], there is a gap in the assessment concerning the mentioned runoff mitigation service. Additionally, a deficiency exists in both sub-drainage basin and larger regional scale assessments.

2.2.2. Sub-Drainage Basin of Kärra-Skogome

From a water run-off mitigation perspective, Kärra-Skogome does not exist in isolation, but is part of a larger drainage basin context set by geographical location and topography. Therefore, quantifying the runoff mitigation potential of the sub-drainage basin where Kärra-Skogome is situated is important not only from a run-off perspective, but also from an ecosystem perspective since the planned built-up land will affect both flooding and ecosystem processes. From a biodiversity governance perspective, it places the planned local development project within the larger dynamics of the Gothenburg sub-drainage basin with its associated governance jurisdictions.

2.2.3. The Västra Götaland Region

Gothenburg is also part of a larger regional drainage basin, known as the Västra Götaland region, defined by political boundaries. The Regional Council, which is the highest decision-making body, has the overarching goals to increase the region’s appeal and competitiveness as well as work towards sustainable regional development [41]. Quantifying the water run-off mitigation service at the regional scale could potentially answer questions about whether the region is moving in a more climate-proof direction, or whether the ecosystem service of water run-off mitigation is being eroded on a regional scale.

3. Materials and Methods

3.1. Quantifying the Water Run-Off Mitigation Potential Using the Urban Flood Risk Mitigation Model

Based on our intent to apply easy-to-use, open source, and low data requirements tools, the toolbox that was chosen for quantifying the water runoff mitigation potential was the Integrated Valuation of Ecosystem Services and Tradeoffs (InVEST) model (v. 3.12.1). InVEST is a series of 18 open-source software models that are explicitly developed to assess ecosystem services (see, e.g., this journal [42]) and is one of the most used tools for that purpose [43]. It is developed by the Natural Capital Foundation to promote natural capital valuation in policy planning [44].
In its ‘toolbox’, InVEST includes an Urban Flood Risk Mitigation (UFRM) model, which is one of the newest additions to the series of existing InVEST models. As such, only a few applications of the UFRM model can be found in the literature [11,45,46]. In contrast to more precise, but also more data-intensive hydrologic models (e.g., see the Soil and Water Assessment Tool (SWAT) [47,48] and the Spatial Tools for River basins and Environment and Analysis of Management options (STREAM) [49], the UFRM model is relatively simple, has a low data requirement and the data format used in the model is also compatible with other InVEST models, which opens the possibility to assess other ecosystem services in the future and to analyze trade-offs between them [44]. For example, there is no temporal aspect considered in the selected rainfall event, and the model does not account for topographical characteristics—a limitation that is further elaborated in the Section 5 of this article.
To estimate run-off, the UFRM model uses the ’soil conservation service-curve number’ method (SCS–CN), which requires low amounts of data. The SCS-CN method is an accepted empirical method that has been used by public agencies and researchers for the last five decades [11,45]. An overview of the input data required to run the UFRM model is presented in Table 1. As a vector layer for the area of interest in Table 1 (i.e., the Kärra-Skogome area) was missing, the GIS software QGIS v3.28.1 was used to create one (Figure 2). Also, a flowchart of the methodological process is presented in Figure 3.

3.2. Input Data to the UFRM Model

3.2.1. Curve Number Values

The curve number (CN) is a dimensionless value that empirically estimates run-off depth caused by rainfall. It varies between 0 and 100, where a low number represents high soil permeability and therefore low runoff potential, and vice versa [45]. The CN value is dependent on land use/land cover (LULC) and the hydrologic soil group [44] Values for each LULC class and soil hydrologic group were derived from the USDA handbook [50,51].

3.2.2. Reclassification of LULC Data

The land cover map Swedish Land Cover Data, from the Swedish EPA [52] includes 25 land cover classes. The data include information on land cover, such as agricultural land, forest, built areas, and water bodies. It is a continuous dataset, covering the entire country and is updated regularly. The latest mapping was performed in the period 2017–2019 [52].
Deriving the curve number values needed for running the UFRM model, requires the reclassification of the 25 land cover classes. This reclassification was performed according to UN– SPIDER (United Nations—Space-based Information for Disaster Management and Emergency Response) and the USDA handbook [50,53]. The 25 land cover class labels were extracted manually from the QGIS raster layer and listed together with their identification number in Excel. They were then translated from Swedish to English and sorted into the new classification (see Supplementary Material Table S1 for a detailed table). Based on these data, the land cover map was reclassified in QGIS, using the function ‘Reclassify by table’.

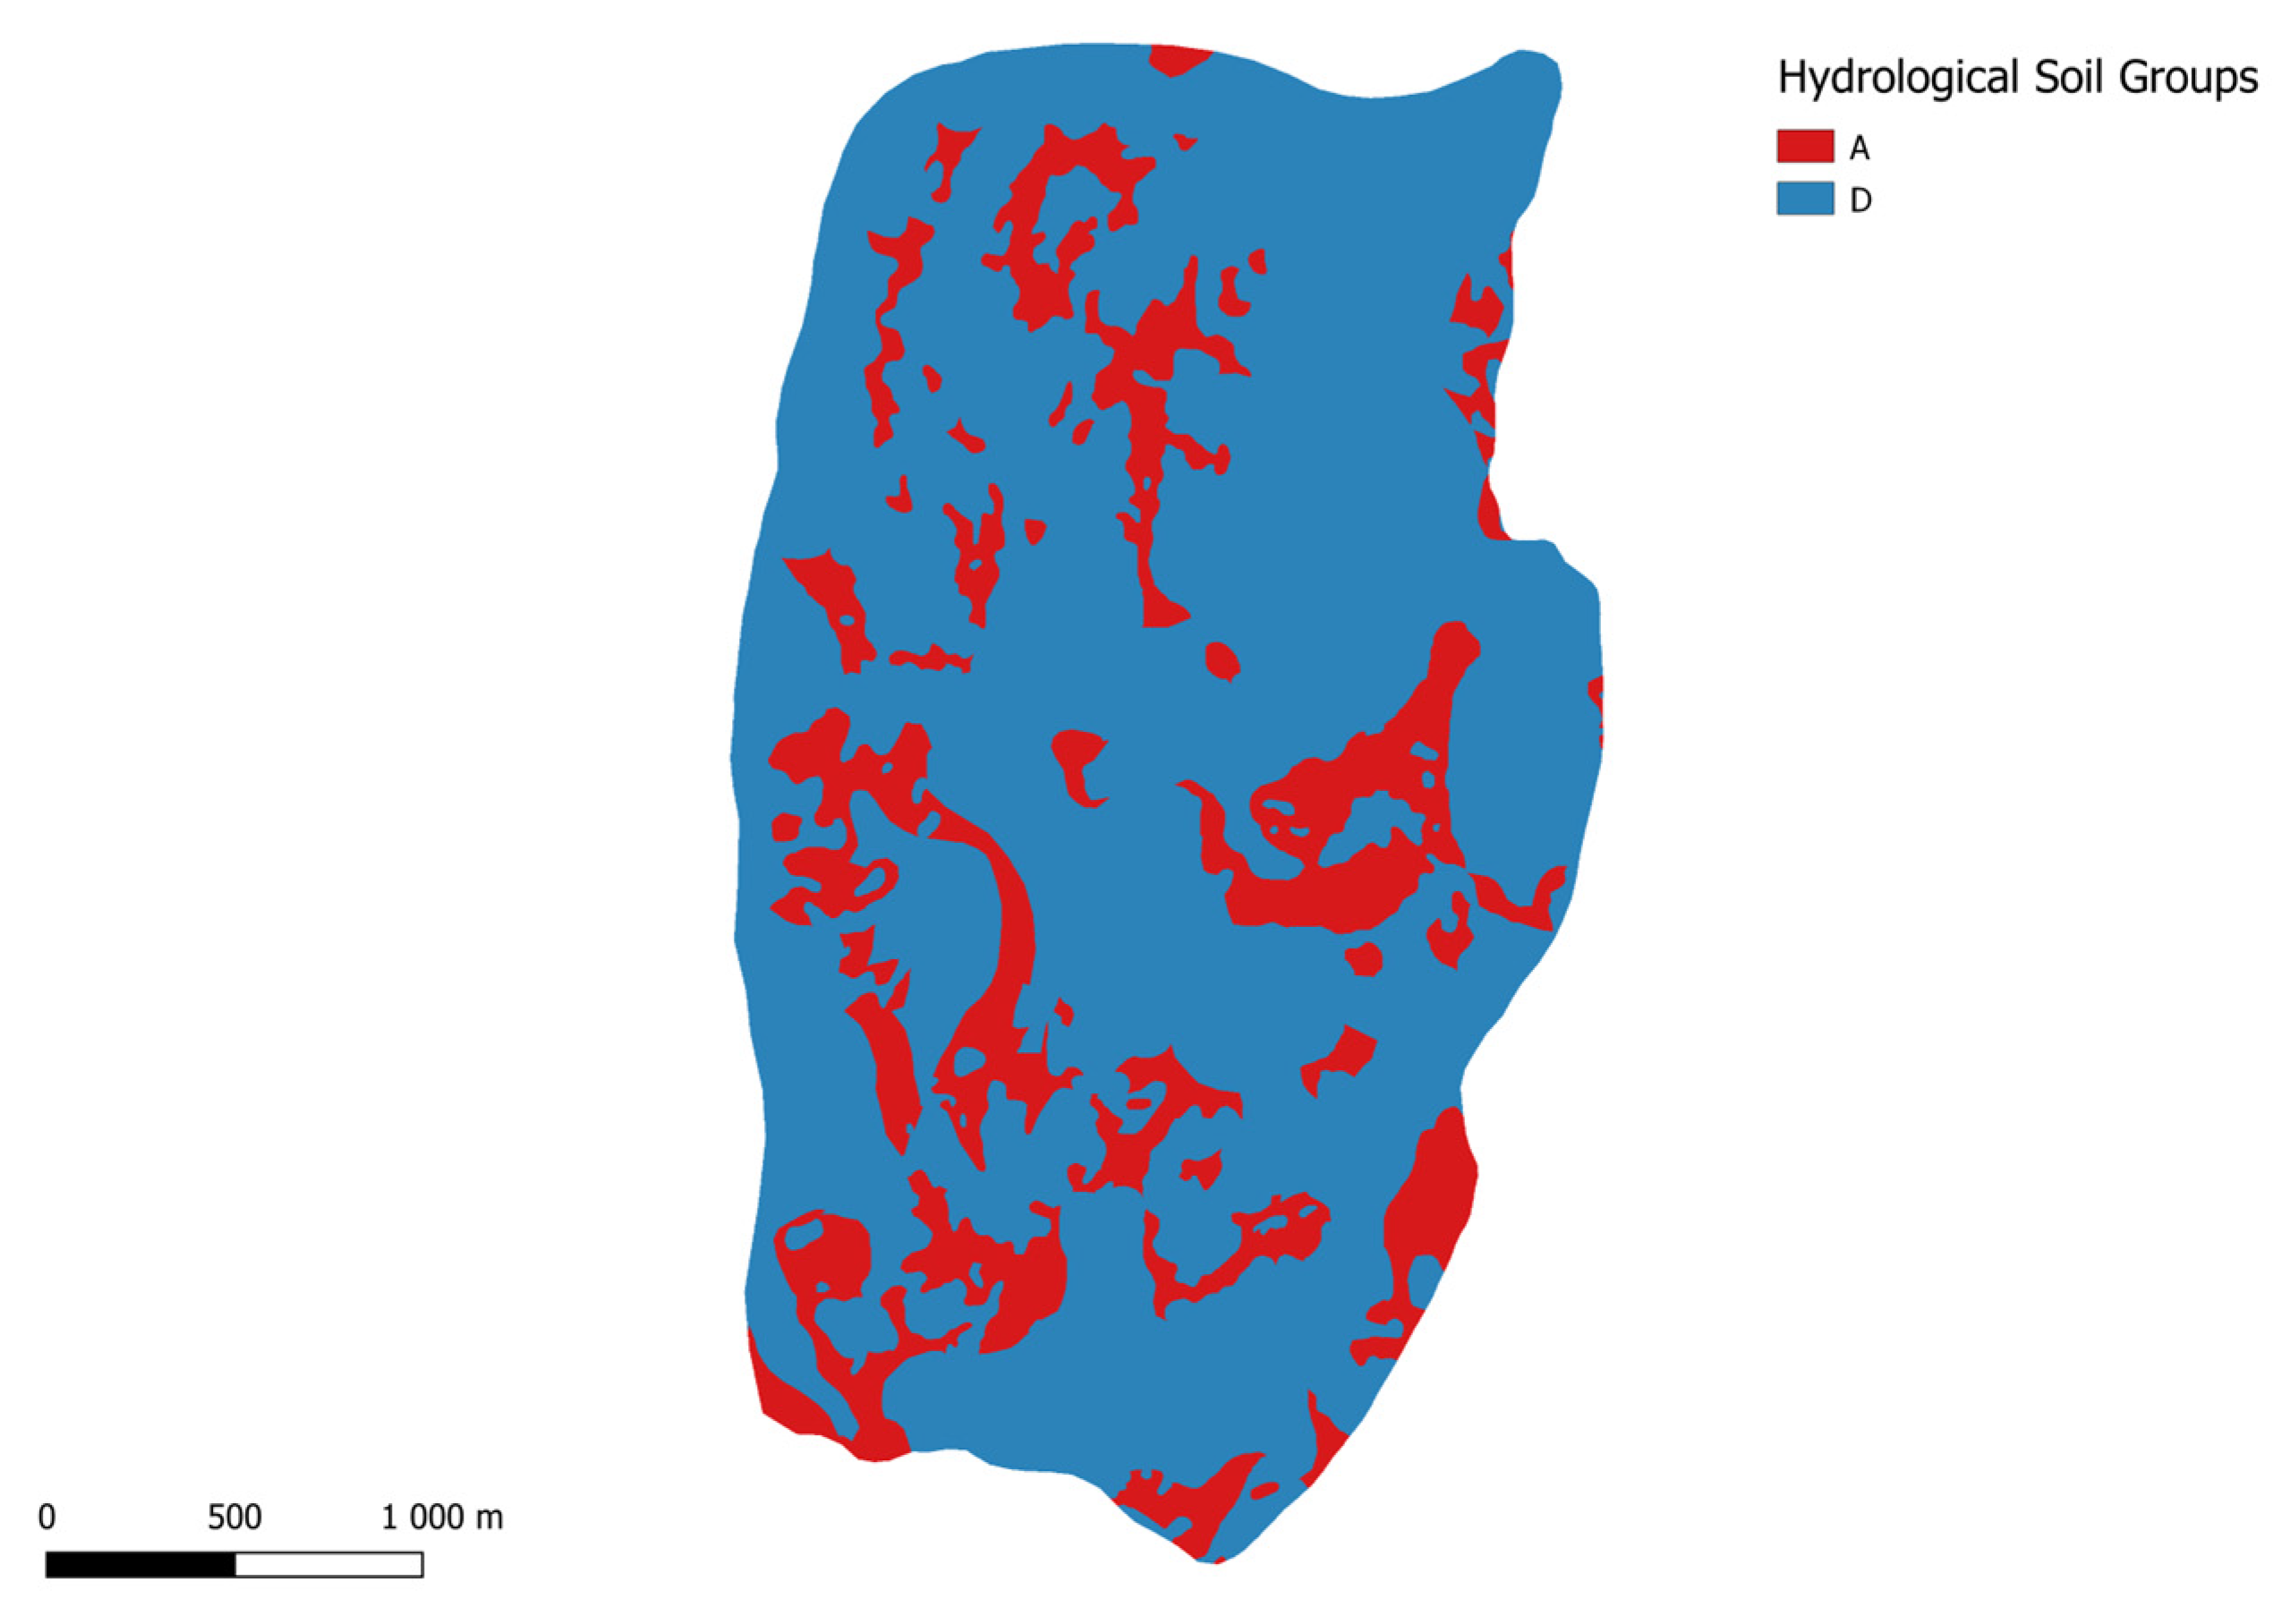
3.2.3. Reclassifying Hydrologic Soil Type to Hydrological Soil Groups

The vector layer of soil types displays 17 soil types [54]. Different soil types vary in their potential to hold water. To assess the runoff potential of various soil types, they are put into different hydrological soil groups (HSGs). In a Swedish context, four HSG groups exist: A, B, C, and D, where A has the least runoff potential and D has the most. The dataset for HSGs was derived from soil maps from the Geological Survey of Sweden (SGU), via the Swedish University of Agricultural Sciences [54].
For the soil type vector layer to be compatible with InVEST, it had to be reclassified according to the four HSGs. Also, to use the dataset in the UFRM model, letter values must be translated into numerical values [44]. Hence, every soil type had to be assigned a numerical value, where A = 1; B = 2; C = 3; and D = 4. The reclassification was based on the USDA handbook and Nilsson [55] (see Supplementary Material Table S2) [55,56]. In the attribute table of the soil map, which held 1276 features, a new field was added named “HSGgroups”. Due to the number of features, the assignment of values was not performed manually, but by using the function expression. The code input is shown in Supplementary Material Figure S1. The soil types were translated from Swedish to English in a similar manner, based on SGU’s symbology collection [54]. Once all features and soil types were assigned an HSG, the vector layer was reclassified in QGIS. As the model requires raster data as an input, the vector layer was rasterized.
Group A soils generally include less than 10% clay and greater than 90% sand, resulting in a high infiltration rate and low runoff. Group D soils are the dominant types in the area, which generally contain more than 40% clay and less than 50% sand, resulting in low infiltration rates and high runoff [56]. InVEST-compatible hydrologic soil group maps and land use/ land cover maps were also generated for the other two areas of interest, the sub-drainage basin and the Västra Götaland region (see Supplementary Material Figure S2).

3.2.4. Rainfall Events and the Selection of Rainfall Depths

For the selection of rainfall depths, data were retrieved from a report by the Swedish Meteorological and Hydrological Institute (SMHI), which contains data on rainfall volumes based on historical measurements in four regions of Sweden [57]. Two rainfall events were chosen, with return periods of 10 and 100 years, both with a duration of 1 h. Similarly, a climate factor (CF) of 1.15 based on the representative concentration pathway (RCP) 4.5 for the period 2041–2070 was chosen, resulting in four rainfall depth scenarios.

4. Results

4.1. Reclassifying Land Use/Land Cover

The land use/land cover classes were assessed for all three areas of interest, using data retrieved from the Swedish EPA [52] (2023). Figure 4 illustrates the resultant land use/land cover categories obtained for the Kärra-Skogome local development project area.

4.2. Reclassifying Hydrological Soil Type to Hydrological Soil Group

The resulting reclassified hydrological soil types as hydrological soil groups for Kärra-Skogome are shown in Figure 5.

4.3. Curve Number Values

Table 2 displays the curve number values derived from the reclassified land use/land cover map and the reclassified hydrological soil type grouped into hydrological soil groups (HSG).

4.4. Rain Falls Depth

Based on two rainfall events, 10 years over 1 h and 100 years over 1 h, and two climate factors, four rain depth scenarios were identified (Table 3). These were derived from the IPCC RCP 4.5 scenario, which is described by IPCC as a moderate scenario in which emissions peak around 2040 and then decline.

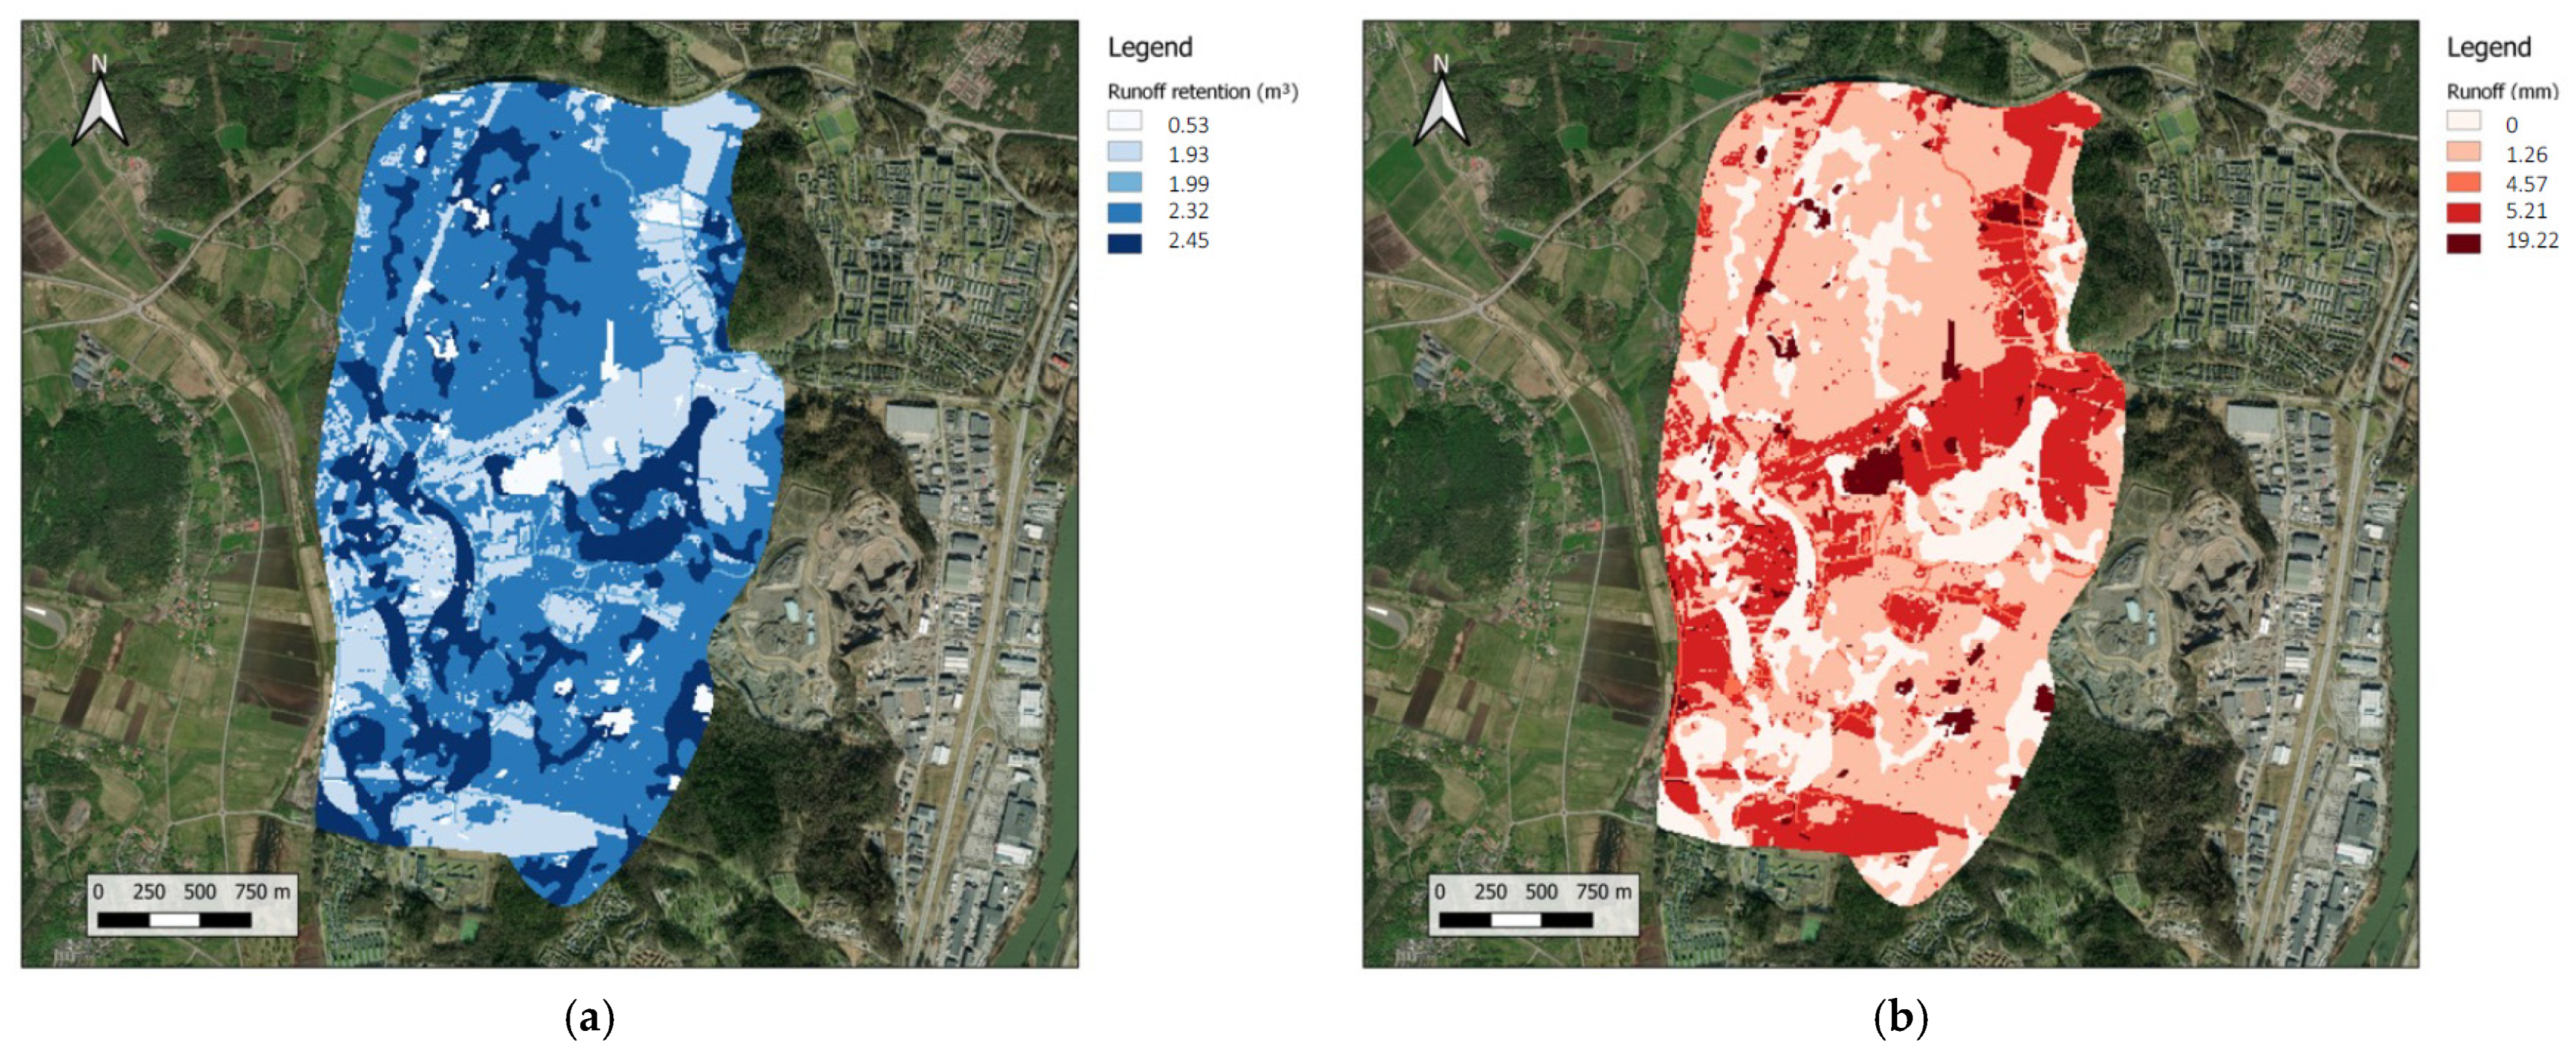
4.5. Quantifying the ES of Water Runoff

The InVEST/UFRM model results, quantifying the ecosystem service of water runoff mitigation at three different spatial scales under four rainfall event scenarios, are presented in Table 4. The runoff retention index (RRI) is the average runoff retention value per area of interest. It indicates the amount of water that is retained by the soil. To establish a clear and representative comparison between the performance of the three areas of interest, the relative retention capacity (RRV/area) and relative runoff volume per hectare (RV/area) are also included.
The InVEST/URFM model also provides results on spatial distribution per pixel of the run-off retention volume and the run-off volume. The spatial distribution per pixel for Kärra-Skogome, for a 24 mm rainfall event is shown in Figure 6.
Higher retention volumes (Figure 6a) are found in the forested areas, especially in combination with the high infiltration capacity of soil group A. The run-off volumes are particularly high (Figure 6b) where the agricultural land cover is combined with soil group D, as it is mostly composed of clay with low retention capacity. Since the study area currently has a small extent of developed land, the higher runoff volumes are seen in water bodies and agricultural land cover, such as cultivated land and pasture.
Maps of the spatial distribution per pixel of run-off retention volumes and run-off volumes were created for the sub-drainage basin (Figure 7) and the region of Västra Götaland (Figure 8).

5. Discussion

The key objective of this paper was to roughly estimate the ecosystem service of water runoff mitigation through a simplified, cost-effective, and user-friendly modeling approach. The InVEST model was utilized for this purpose and applied at three nested biophysical scales under four climate change scenarios. The study reveals how the water retention capacity of the area of interest is diminishing due to urban development. Consequently, the modeling exercise illustrates how runoff mitigation through metropolitan green spaces helps climate-proof the city of Gothenburg against present and future flooding events.
More specifically, our results indicate an average run-off retention index (RRI) at or above 0.8 for the two lowest rain event scenarios, across all addressed scales (see Table 4). However, the results also show that even small changes in the intensity of a rain event may generate large changes in the run-off (retention) volumes, exemplified by the 0.12 drop in the average run-off retention index, when, e.g., switching between the 28.2 mm rain event to the 45.2 mm rain event at the sub-drainage basin scale (Table 4), emphasizing the vulnerability of the city of Gothenburg in this context and the need for planners and policymakers to address climate resilience in the context of regional growth. Furthermore, the results also show that the local area, Kärra-Skogome, has an average water retention potential per area unit that surpasses that of the surrounding sub-drainage basin, as well as that of the larger region, across all rain event scenarios (Table 4). Therefore, and as hypothetically suggested by the results conveyed herein, what occurs locally has significant cascading impacts at larger biophysical scales, subsequently exerting negative effects on the region.
The result obtained in this study highlights the importance of carefully weighing the utility of executing site-specific urban development projects, such as Kärra-Skogome, against the potential erosion of the run-off mitigation service. In this context, the site-specific map, illustrating the spatial distribution run-off/retention volumes per pixel in Kärra-Skogome (Figure 6), could be used by urban planners for, e.g., testing alternative planning and design solutions, with the goal of minimizing the erosion of the run-off mitigation service at the local scale. Also, placing local site-specific urban development projects in a larger sub-drainage basin context as performed herein contributes to identifying potential downstream effects. In the case of the planned Kärra-Skogome project, the implementation of a sub-drainage basin context revealed that there are potential downstream repercussions for the very city center of Gothenburg. Such cross-scale interactions, here represented by linking the local, site-specific scale to the sub-drainage basin scale, need to be considered to obtain a comprehensive picture of the pros and cons of implementing specific local urban development projects in a climate resilience context.
The employed modeling approach simplifies the estimation of runoff water, but urban planners could enhance runoff potential through various design strategies. These include features like green roofs, bioswales, and biologically active surfaces such as lawns, rain gardens, and wetlands, which can effectively delay surface runoff. Therefore, the modeling exercise also offers planners a cost-effective analytical tool to assess potential investments in strategically planned urban design interventions essential for building resilience in new developments.
The city of Gothenburg, akin to the local area of Kärra-Skogome, operates within a broader ecological, economic, and decision-making context. Consequently, in the pursuit of sustainably integrating extensive urbanization with climate-proofing against future flooding events, the overarching regional scale of Västra Götaland becomes pertinent. Quantifying the water run-off retention service on a larger regional scale provides a benchmark against which ongoing and planned development projects in the Gothenburg region can be evaluated; hence, providing a useful tool for assessing the value of urban green spaces to regulate urban climate change. In this way, it is possible to track both incremental and cumulative changes over time to the regional ecosystem service of water run-off mitigation.

5.1. The Importance of Assessments and Modelling

At a more general level, and as demonstrated by the case study results, even a relatively basic and simple modelling approach, combining the UFRM model with its relatively low data requirement and the data format of the model developed herein, can provide valuable inputs to regional planners and policymakers. Given the limited funds of municipalities and the need to make pragmatic inventories and for balancing costs between urban monitoring and mitigation efforts [58], the InVEST model offers a hands-on, user-friendly and cost-effective model in environmental assessments for increase our understanding of the potential environmental impacts and consequences of flooding by a proposed building project plan. The purpose of environmental assessment is not only to inform urban planners and decision-makers about the potential effects on the environment, both positive and negative, that a building project has, but importantly also to inform the public about these impacts. This process helps ensure that environmental considerations are considered in a democratic, cost-effective decision-making process and that sustainable practices are promoted.
Cost-effective models to coordinate a more resilient oriented nestedness of biophysical scales require a poly-centric governance framework [59]. Polycentric urban governance involves the decentralized coordination and management of multiple centers of decision-making and authority across relevant spatial scales within a metropolitan region [60]. As the simple model generated herein is compatible also with other InVEST models, it opens the possibility to assess other types of ecosystem services, including biodiversity impacts by urban growth and development as well as how these services should be managed by different decision-making bodies at different spatial scales.

5.2. Pragmatic Urban Planning

While simple models may have their limitations, like the model used herein lacks temporal aspects of rainfall events and does not account for topographical characteristics, the utility of using this type of model surpasses the situation of using no model at all and thereby making no assessment at all. In our experience, this is all too common in many cities around the world, although its full extent is probably hard to determine. Applying a simple model like the InVEST model as used herein, also offers the possibility to assess other ecosystem services and to analyze trade-offs between them [44]. Suffice it to say, the InVEST model in this way embraces a pragmatic approach to urban planning and design, adopting the notion of “what work works” [61] (p. 125).
With its roots in the United States around 1870, and drawing upon such a prominent philosopher as William James, pragmatism applies a more practical approach to solving problems in situations when knowledge is incomplete, emphasizing the application of the best available knowledge and practices. Climate change represents such a situation, and as extreme weather events will likely increase, biophysical and geological assessments become increasingly important to perform and increasingly economically costly. Hence, it is sufficient to say that cost-efficient modelling will become increasingly important for climate change mitigation and adaptation of cities.

6. Conclusions

The type of evaluation performed in this paper provides insights into what role green spaces hold in urban settings to adapt to climate change at multiple nested biophysical scales. The study demonstrates the effectiveness of a straightforward, readily applicable, and cost-effective modeling approach in illustrating the impact of planned local urban development projects on water runoff mitigation. The findings highlight the potential exacerbating effects of such projects at larger spatial scales. Furthermore, in the context of project decisions, the modeling exercise provides planners with a valuable tool to evaluate potential investments in strategically planned urban design interventions. It can also help determine whether a region, such as the Gothenburg area, is progressing in a climate-resilient direction.
As proposed herein with the flooding/run-off mitigation example, basic models like the InVEST model can in an urban planning and decision-making context be quite handily used to examine such resilience perspectives. As InVEST includes a series of models, the work presented herein can further be built on by using other ecosystem service quantification models such as the Urban Stormwater Retention Model which assesses the more general hydrologic services offered by the landscape over a yearly timescale. The Habitat Quality Model is another tool that can be used to estimate the extent of habitat and vegetation types and represent the biodiversity of a landscape [62]. New attempts to combine descriptions in landscape ecology and urban morphology into a social–ecological spatial morphology have also paved the way for the planning and design of cities that bring the two fields together in a joint practice [63]. On a principal level digitalization offers the opportunity to shift from scale-defined maps to scale-free models, thereby creating the potential to describe both social and ecological urban phenomena closer. Unfortunately, this potential is currently often missed due to conservative mindsets and modes of working. Big-data models enable the precise analysis of diverse and massive datasets, allowing for the identification of climate patterns, vulnerabilities, and optimal resilience strategies, thereby offering unprecedented opportunities for designing and building climate-change resilient cities with greater precision.

Supplementary Materials

The following supporting information can be downloaded at: https://www.mdpi.com/article/10.3390/land13020143/s1, Table S1: Reclassification of Land Cover Classes according to UN-SPIDER and USDA; Table S2: reclassification of soil according to HSG; Figure S1: Algorithm to automatically assign HSG’s to soil types; Figure S2: Hydrologic soil Map.

Author Contributions

Conceptualization, C.H.E., M.L., Å.G.; methodology, C.H.E., M.L., Å.G.; software, C.H.E., M.L.; validation, C.H.E., M.L.; formal analysis, C.H.E., M.L.; writing—original draft preparation, C.H.E., M.L., Å.G., J.C.; writing—review and editing, C.H.E., M.L., Å.G., J.C., L.M., M.B.P. All authors have read and agreed to the published version of the manuscript.

Funding

Johan Colding’s research was funded by a joint grant from Mistra [DIA 2019/28] and Formas via the national research programme on climate (2021–00416). Johan Colding’s and Åsa Gren’s work have partly been funded by the University of Gävle, and the Beijer Institute of Ecological Economics. Meta Berghauser Pont’s, Lars Marcus’ and Åsa Gren’s work has been funded by the DITO-project through a grant from Formas (2020–01406) and the Chalmers University of Technology.

Data Availability Statement

Data are contained within the article.

Acknowledgments

The authors wish to thank FAIRTRANS and the University of Gävle for support of this work.

Conflicts of Interest

The authors declare no conflict of interest. The funders had no role in the design of the study; in the collection, analyses, or interpretation of data; in the writing of the manuscript; or in the decision to publish the results.

References

  1. Kabisch, N.; Frantzeskaki, N.; Pauleit, S.; Naumann, S.; Davis, M.; Artmann, M.; Haase, D.; Knapp, S.; Korn, H.; Stadler, J.; et al. Nature-Based Solutions to Climate Change Mitigation and Adaptation in Urban Areas: Perspectives on Indicators, Knowledge Gaps, Barriers, and Opportunities for Action. Ecol. Soc. 2016, 21, 26270403. [Google Scholar] [CrossRef]
  2. Pan, H.; Page, J.; Shi, R.; Cong, C.; Cai, Z.; Barthel, S.; Thollander, P.; Colding, J.; Kalantari, Z. Contribution of Prioritized Urban Nature-Based Solutions Allocation to Carbon Neutrality. Nat. Clim. Chang. 2023, 13, 862–870. [Google Scholar] [CrossRef]
  3. Dianat, H.; Wilkinson, S.; Williams, P.; Khatibi, H. Choosing a Holistic Urban Resilience Assessment Tool. Int. J. Disaster Risk Reduct. 2022, 71, 102789. [Google Scholar] [CrossRef]
  4. Sharifi, A.; Yamagata, Y. Resilience-Oriented Urban Planning. In Resilience-Oriented Urban Planning: Theoretical and Empirical Insights; Lecture Notes in Energy; Yamagata, Y., Sharifi, A., Eds.; Springer International Publishing: Cham, Switzerland, 2018; pp. 3–27. ISBN 978-3-319-75798-8. [Google Scholar]
  5. Colding, J.; Gren, Å.; Barthel, S. The Incremental Demise of Urban Green Spaces. Land 2020, 9, 162. [Google Scholar] [CrossRef]
  6. Natural Capital Project. Database of Publications Using InVEST and Other Natural Capital Project Software. 2023. Available online: https://doi.org/10.25740/bb284rg5424 (accessed on 6 April 2023).
  7. Brandt, S.A.; Lim, N.J.; Colding, J.; Barthel, S. Mapping Flood Risk Uncertainty Zones in Support of Urban Resilience Planning. Urban Plan. 2021, 6, 258–271. [Google Scholar] [CrossRef]
  8. Cao, W.; Zhou, Y.; Güneralp, B.; Li, X.; Zhao, K.; Zhang, H. Increasing Global Urban Exposure to Flooding: An Analysis of Long-Term Annual Dynamics. Sci. Total Environ. 2022, 817, 153012. [Google Scholar] [CrossRef] [PubMed]
  9. Kundzewicz, Z.W.; Pińskwar, I.; Brakenridge, G.R. Changes in River Flood Hazard in Europe: A Review. Hydrol. Res. 2017, 49, 294–302. [Google Scholar] [CrossRef]
  10. Kundzewicz, Z.W.; Pińskwar, I. Are Pluvial and Fluvial Floods on the Rise? Water 2022, 14, 2612. [Google Scholar] [CrossRef]
  11. Quagliolo, C.; Comino, E.; Pezzoli, A. Experimental Flash Floods Assessment Through Urban Flood Risk Mitigation (UFRM) Model: The Case Study of Ligurian Coastal Cities. Front. Water 2021, 3, 663378. [Google Scholar] [CrossRef]
  12. MacKinnon, M.; Pedersen Zari, M.; Brown, D.K.; Benavidez, R.; Jackson, B. Urban Biomimicry for Flood Mitigation Using an Ecosystem Service Assessment Tool in Central Wellington, New Zealand. Biomimetics 2023, 8, 9. [Google Scholar] [CrossRef]
  13. Vári, Á.; Kozma, Z.; Pataki, B.; Jolánkai, Z.; Kardos, M.; Decsi, B.; Pinke, Z.; Jolánkai, G.; Pásztor, L.; Condé, S.; et al. Disentangling the Ecosystem Service ‘Flood Regulation’: Mechanisms and Relevant Ecosystem Condition Characteristics. Ambio 2022, 51, 1855–1870. [Google Scholar] [CrossRef] [PubMed]
  14. Glosinska, E. Floodplain Management in the Context of Assessment and Changes of Flood Risk and the Environment—A Review. Pol. J. Environ. Stud. 2014, 23, 1895–1904. [Google Scholar]
  15. Peter, S.C. Reduction of CO2 to Chemicals and Fuels: A Solution to Global Warming and Energy Crisis. ACS Energy Lett. 2018, 3, 1557–1561. [Google Scholar] [CrossRef]
  16. Gómez-Baggethun, E.; Gren, Å.; Barton, D.N.; Langemeyer, J.; McPhearson, T.; O’farrell, P.; Andersson, E.; Hamstead, Z.; Kremer, P. Urban Ecosystem Services. In Urbanization, Biodiversity and Ecosystem Services: Challenges and Opportunities: A Global Assessment; Springer: Berlin/Heidelberg, Germany, 2013; pp. 175–251. [Google Scholar]
  17. Synthesis Report. Contribution of Working Groups I, II and III to the Sixth Assessment Report of the Intergovernmental Panel on Climate Change. 2023. Available online: https://climate-adapt.eea.europa.eu/en/metadata/publications/sixth-assessment-report (accessed on 26 December 2023).
  18. Potschin, M.; Haines-Young, R.; Fish, R.; Turner, R.K. Routledge Handbook of Ecosystem Services; Routledge: Abingdon, UK, 2016; ISBN 978-1-317-68704-7. [Google Scholar]
  19. Beitnes, S.S.; Kopainsky, B.; Potthoff, K. Climate Change Adaptation Processes Seen through a Resilience Lens: Norwegian Farmers’ Handling of the Dry Summer of 2018. Environ. Sci. Policy 2022, 133, 146–154. [Google Scholar] [CrossRef]
  20. Manes, S.; Vale, M.M.; Malecha, A.; Pires, A.P.F. Nature-Based Solutions Promote Climate Change Adaptation Safeguarding Ecosystem Services. Ecosyst. Serv. 2022, 55, 101439. [Google Scholar] [CrossRef]
  21. Sellberg, M.M.; Ryan, P.; Borgström, S.T.; Norström, A.V.; Peterson, G.D. From Resilience Thinking to Resilience Planning: Lessons from Practice. J. Environ. Manag. 2018, 217, 906–918. [Google Scholar] [CrossRef] [PubMed]
  22. Intergovernmental Science-Policy Platform on Biodiversity and Ecosystem Services (IPBES). IPBES Global Assessment Summary for Policymakers; IPBES: Bonn, Germany, 2019. [Google Scholar]
  23. United Nations Environment Programme. Nature-Based Solutions for Climate Change Mitigation. Nairobi and Gland. 2021. Available online: https://wedocs.unep.org/xmlui/bitstream/handle/20.500.11822/37318/NBSCCM.pdf (accessed on 13 April 2023).
  24. Andersson, E.; Grimm, N.B.; Lewis, J.A.; Redman, C.R.; Barthel, S.; Colding, J.; Elmivist, T. Urban Climate Resilience through Hybrid Infrastructure. Curr. Opin. Environ. Sustain. 2022, 55, 101158. [Google Scholar] [CrossRef]
  25. Schaubroeck, T. ‘Nature-Based Solutions’ Is the Latest Green Jargon That Means More than You Might Think. Nature 2017, 541, 133–134. [Google Scholar]
  26. European Environment Agency. Nature-Based Solutions in Europe Policy, Knowledge and Practice for Climate Change Adaptation and Disaster Risk Reduction 2021. Available online: https://www.eea.europa.eu/publications/nature-based-solutions-in-europe (accessed on 13 April 2023).
  27. Dumitru, A. Evaluating the Impact of Nature-Based Solutions: A Summary for Policy Makers; Publications Office of the European Union: Luxembourg, 2021; ISBN 978-92-76-40746-1. [Google Scholar]
  28. European Commission. Directorate General for Research and Innovation. Communication from the Commission to the European Parliament, the Council, the European Economic and Social Committee and the Committee of the Regions on European Missions; Publications Office: Luxembourg, 2021. [Google Scholar]
  29. Andersson-Sköld, Y.; Klingberg, J.; Gunnarsson, B.; Cullinane, K.; Gustafsson, I.; Hedblom, M.; Knez, I.; Lindberg, F.; Ode Sang, Å.; Pleijel, H.; et al. A Framework for Assessing Urban Greenery’s Effects and Valuing Its Ecosystem Services. J. Environ. Manag. 2018, 205, 274–285. [Google Scholar] [CrossRef]
  30. Jansson, Å.; Nohrstedt, P. Carbon Sinks and Human Freshwater Dependence in Stockholm County. Ecol. Econ. 2001, 39, 361–370. [Google Scholar] [CrossRef]
  31. Jansson, Å.; Folke, C.; Rockström, J.; Gordon, L.; Falkenmark, M. Linking Freshwater Flows and Ecosystem Services Appropriated by People: The Case of the Baltic Sea Drainage Basin. Ecosystems 1999, 2, 351–366. [Google Scholar] [CrossRef]
  32. Jansson, Å.; Colding, J. Tradeoffs between Environmental Goals and Urban Development: The Case of Nitrogen Load from the Stockholm County to the Baltic Sea. Ambi 2007, 36, 650–656. [Google Scholar] [CrossRef]
  33. Cimburova, Z.; Berghauser Pont, M. Location Matters. A Systematic Review of Spatial Contextual Factors Mediating Ecosystem Services of Urban Trees. Ecosyst. Serv. 2021, 50, 101296. [Google Scholar] [CrossRef]
  34. Boverket 2023. Behov av Bostadsbyggande 2022–2030. Available online: https://www.boverket.se/sv/samhallsplanering/bostadsmarknad/bostadsmarknaden/behov-av-bostadsbyggande/behov-2023/ (accessed on 10 April 2023).
  35. Statistikmyndigheten SCB 2022. Ökad Andel Boende i Tätorter. 2022. Available online: https://www.scb.se/hitta-statistik/sverige-i-siffror/miljo/tatorter-i-sverige/ (accessed on 17 April 2023).
  36. Göteborgs Stad 2021. Göteborgs Stads Miljö- och Klimatprogram 2021–2030. Available online: https://goteborg.se/wps/portal/start/kommun-och-politik/sa-arbetar-goteborgs-stad-med/hallbarhet-och-agenda-2030/program-och-planer-for-miljo-och-klimat/miljo--och-klimatprogram-for-goteborgs-stad-2021-2030 (accessed on 11 April 2023).
  37. Länsstyrelsen Västra Götaland. Bostadsmarknadsanalys 2022 Västra Götalands Län. 2022. Available online: https://catalog.lansstyrelsen.se/store/13/resource/2681 (accessed on 5 May 2023).
  38. Göteborgs Stad. Översiktsplan för Göteborg—Tematiskt Tillägg för Översvämningsrisker. 2019. Available online: https://goteborg.se/wps/wcm/connect/505ba586-d99d-4abc-8bc8-3473dd28002a/Tematisk+tillägg+ÖP+översvämningsrisk.pdf?MOD=AJPERES (accessed on 5 May 2023).
  39. Norlén, G.; Randall, L.; Sánchez Gassen, N.; Tapia, C.; Bogason, Á.; Cuadrado, A.; Heleniak, T.; Jokinen, J.C.; Karlsdóttir, A.; Lundgren, A.; et al. State of the Nordic Region 2022; Nordregio: Stockholm, Sweden, 2022. [Google Scholar]
  40. Göteborgs Stad. Stadsbyggnadskontoret. Förprövningsrapport Planbesked för bostäder vid Lerbäcksvägen (Skogome 8:13) inom stadsdelen Skogome, dnr 0354/19. Available online: http://www5.goteborg.se/prod/Intraservice/Namndhandlingar/SamrumPortal.nsf/93ec9160f537fa30c12572aa004b6c1a/48d9d189638ef143c12586db0053fca2/$FILE/2%20Forprovningsrapport.pdf (accessed on 5 May 2023).
  41. Västra Götalandsregionen 2021. Regional Development Strategy for Västra Götaland 2021–2030. Available online: https://www.vgregion.se/en/regional-development/ (accessed on 10 May 2023).
  42. Johnson, J.A.; Baldos, U.L.; Corong, E.; Hertel, T.; Polasky, S.; Cervigni, R.; Roxburgh, T.; Ruta, G.; Salemi, C.; Thakrar, S. Investing in Nature Can Improve Equity and Economic Returns. Proc. Natl. Acad. Sci. USA 2023, 120, e2220401120. [Google Scholar] [CrossRef] [PubMed]
  43. Burkhard, B.; Maes, J. Mapping Ecosystem Services. Adv. Books 2017, 1, e12837. [Google Scholar]
  44. Stanford University. Natural Capital Project, Urban Flood Risk Mitigation Model. 2023. Available online: https://naturalcapitalproject.stanford.edu/invest/urban-flood-risk-mitigation (accessed on 15 May 2023).
  45. Kadaverugu, A.; Nageshwar Rao, C.; Viswanadh, G.K. Quantification of Flood Mitigation Services by Urban Green Spaces Using InVEST Model: A Case Study of Hyderabad City, India. Model. Earth Syst. Environ. 2021, 7, 589–602. [Google Scholar] [CrossRef]
  46. Hamel, P.; Guerry, A.D.; Polasky, S.; Han, B.; Douglass, J.A.; Hamann, M.; Janke, B.; Kuiper, J.J.; Levrel, H.; Liu, H.; et al. Mapping the Benefits of Nature in Cities with the InVEST Software. Npj Urban Sustain 2021, 1, 25. [Google Scholar] [CrossRef]
  47. Liu, Y.; Xu, Y.; Zhao, Y.; Long, Y. Using SWAT Model to Assess the Impacts of Land Use and Climate Changes on Flood in the Upper Weihe River, China. Water 2022, 14, 2098. [Google Scholar] [CrossRef]
  48. Logsdon, R.A.; Chaubey, I. A Quantitative Approach to Evaluating Ecosystem Services. Ecol. Model. 2013, 257, 57–65. [Google Scholar] [CrossRef]
  49. Stürck, J.; Poortinga, A.; Verburg, P.H. Mapping Ecosystem Services: The Supply and Demand of Flood Regulation Services in Europe. Ecol. Indic. 2014, 38, 198–211. [Google Scholar] [CrossRef]
  50. United States Department of Agriculture. Chapter 9: Hydrologic Soil-Cover Complexes. In Part 630 National Engineering Handbook 2004. Available online: https://damtoolbox.org/wiki/National_Engineering_Handbook:_Chapter_9_-_Hydrologic_Soil-Cover_Complexes (accessed on 15 May 2023).
  51. Leena, K.; Barton, N.D.; Laura, C.; Pekka, H.; Marion, K.; Tin-Yu, L. Urban Experimental Ecosystem Accounting Pilot in the Nordic Cities; Nordic Council of Ministers: Copenhagen, Denmark, 2022; ISBN 978-92-893-7453-8. [Google Scholar]
  52. Naturvårdsverket. Nationella Marktäckedata (NMD) 2023. Available online: https://www.naturvardsverket.se/verktyg-och-tjanster/kartor-och-karttjanster/nationella-marktackedata/ (accessed on 9 May 2023).
  53. United Nations. Office for Outer Space Affairs UN-SPIDER Knowledge Portal. Step by Step: Flood Hazard Mapping. 2023. Available online: https://www.un-spider.org/advisory-support/recommended-practices/recommended-practice-flood-hazard-mapping/step-by-step (accessed on 10 May 2023).
  54. Sveriges Geologiska Undersökning. SGUs Symbolsamling För Jordarter. 2023. Available online: https://www.sgu.se/globalassets/produkter/kartor/symbolsamling_jordarter_ny.pdf (accessed on 9 May 2023).
  55. Nilsson, J. Hur Påverkar en Övergång från Konventionell Plöjning till Reducerad Jordbearbetning Avrinning från Åkermark; 2018; Department of Earth Sciences, Uppsala University. Available online: https://www.diva-portal.org/smash/get/diva2:1273266/FULLTEXT01.pdf (accessed on 15 May 2023).
  56. United States Department of Agriculture. Chapter 7. Hydrologic Soil Groups. In Part 630 Hydrology National Engineering Handbook. 2007. Available online: https://directives.sc.egov.usda.gov/22526.wba (accessed on 15 May 2023).
  57. Olsson, J.; Berg, P.; Eronn, A.; Simonsson, L.; Södling, J.; Wern, L.; Yang, W. Extremregn i nuvarande och framtida klimat Analyser av observationer och framtidsscenarier. Climatology 2018, 47, 367. [Google Scholar]
  58. Bennett, J.R.; Sisson, D.R.; Smol, J.P.; Cumming, B.F.; Possingham, H.P.; Buckley, Y.M. Optimizing Taxonomic Resolution and Sampling Effort to Design Cost-Effective Ecological Models for Environmental Assessment. J. Appl. Ecol. 2014, 51, 1722–1732. [Google Scholar] [CrossRef]
  59. McGinnis, M.D. Polycentric Governance and Development: Readings from the Workshop in Political Theory and Policy Analysis; University of Michigan Press: Ann Arbor, MI, USA, 1999; ISBN 978-0-472-08623-8. [Google Scholar]
  60. Derudder, B.; Meijers, E.; Harrison, J.; Hoyler, M.; Liu, X. Polycentric Urban Regions: Conceptualization, Identification and Implications. Reg. Stud. 2022, 56, 1–6. [Google Scholar] [CrossRef]
  61. Colding, J.; Marcus, L.; Barthel, S. Promoting Partnership between Urban Design and Urban Ecology through Social-Ecological Resilience Building. In Urban Transition—Perspectives on Urban Systems and Environments; IntechOpen: London, UK, 2021. [Google Scholar]
  62. Stanford University. Natural Capital Project, The InVEST Habitat Quality Model. Available online: https://naturalcapitalproject.stanford.edu/invest/habitat-quality (accessed on 20 May 2023).
  63. Marcus, L.; Pont, M.B.; Barthel, S. Towards a Socio-Ecological Spatial Morphology: A Joint Network Approach to Urban Form and Landscape Ecology. Urban Morphol. 2020, 24, 21–34. [Google Scholar] [CrossRef]
Figure 1. The city of Gothenburg (red) is situated on the west coast of Sweden (green), along the Göta River and situated in the Västra Götaland region (orange). Its biophysical location is characterized by a coastal setting, providing the city with access to the North Sea.
Land 13 00143 g001
Figure 2. The local development project, Kärra-Skogome, marked in turquoise and in red (small box), and with the city of Gothenburg in yellow.
Land 13 00143 g002
Figure 3. Flowchart of the methodological process. Green areas are presented in the result section.
Land 13 00143 g003
Figure 4. The reclassification of 25 land cover classes into four in Kärra-Skogome, follows the guidelines provided by UN-SPIDER (United Nations—Space-based Information for Disaster Management and Emergency Response) and the USDA handbook [50,53].
Land 13 00143 g004
Figure 5. Soil types in Kärra-Skogome reclassified as hydrological soil groups (HSG).
Land 13 00143 g005
Figure 6. Spatial distribution per pixel in Kärra-Skogome, of (a) the run-off retention volumes (m3) and (b) the run-off volume (m3), for a 24 mm rainfall event. High retention volumes are represented by darker blue areas and high run-off volumes are represented by dark red.
Land 13 00143 g006
Figure 7. Spatial distribution per pixel of (a) the Run-off Retention Volumes (RRV) and (b) the Run-off Volume (RV) in the sub-drainage basin, encompassing the study area of Kärra-Skogome (in green), for a 24 mm rainfall event.
Land 13 00143 g007
Figure 8. Spatial distribution per pixel of (a) the Run-off Retention Volumes (RRV) and (b) the Run-off Volume (RV) in the Västra Götaland Region, for a 24 mm rainfall event.
Land 13 00143 g008
Table 1. The input data for the InVEST software for running the UFRM model.
DataFormat (Unit/Scale)Spatial ResolutionSource
Area of interest avector25 mAuthors
LULC braster10 mNaturvårdsverket
Hydrologic soil groupraster25 mSGU
Curve number valuesconstantN/ANRCS
Rainfall depthmm24.5–54.2 mmSMHI
a As a vector layer for the Kärra-Skogome area was missing, the GIS software QGIS v3.28.1 was used to create one (Figure 2), b Land use, land cover.
Table 2. Curve number values for each land use/land cover and hydrological soil group combination.
LU a IDLU DescriptionHydrologic Soil Group
ABCD
1Water100100100100
2Medium residential57728186
3Forest30587178
4Agricultural67778387
a Land use.
Table 3. Selected rainfall events.
Rainfall EventClimate Factor
CF 0CF 1.15
10 yr, 1 h24.5 mm28.2 mm
100 yr, 1 h45.2 mm52.0 mm
Table 4. Quantification of the ecosystem service of water runoff mitigation at three different spatial scales, under four rainfall events, using the InVEST, UFRM model.
Area of InterestRain Event (mm)Average RRI aRRV b (m3)RV c (m3)RRV/Area (m3ha−1)RV/Area (m3ha−1)
Study area24.50.89160,37019,23021926
28.20.87179,03227,69124438
45.20.76250,48380,860342110
52.00.72274,231106,961374146
Sub-basins24.50.851,225,771221,44920837
28.20.821,359,453306,32723052
45.20.701,861,114808,859315137
52.00.662,024,3951,047,256343177
Region24.50.82504,910,859110,428,24220144
28.20.80565,600,428142,667,46822557
45.20.71806,169,243329,068,570321131
52.00.68888,463,565417,562,245354166
a Runoff retention index, b Runoff retention volume, c Runoff volume.
Disclaimer/Publisher’s Note: The statements, opinions and data contained in all publications are solely those of the individual author(s) and contributor(s) and not of MDPI and/or the editor(s). MDPI and/or the editor(s) disclaim responsibility for any injury to people or property resulting from any ideas, methods, instructions or products referred to in the content.

