Article

Aeolian Sand Sorting and Soil Moisture in Arid Namibian Fairy Circles

1
Department of Solar Energy and Environmental Physics, Blaustein Institutes for Desert Research, Sede Boqer Campus, Ben Gurion University of the Negev, Beersheba 8499000, Israel
2
Institute for Theoretical Physics, Leipzig University, Brüderstr. 16, 04103 Leipzig, Germany
3
Department of Environmental, Geoinformatics, and Urban Planning Sciences, Ben Gurion University of the Negev, Beersheba 8410501, Israel
*
Author to whom correspondence should be addressed.
Land 2024, 13(2), 197; https://doi.org/10.3390/land13020197
Submission received: 26 November 2023 / Revised: 18 January 2024 / Accepted: 31 January 2024 / Published: 6 February 2024

Abstract

:
We studied fairy circles 20 km west of Sesriem at one of the driest locations of fairy circles in Namibia, at the foot of the popular Sossusvlei dunes. These fairy circles lack the typical hexagonal order of the Namibian fairy circles. After years of drought, their pattern is more similar to that of vegetation rings, due to the sparse vegetation in the area between the circles. Cross-section measurements of the soil water content (SWC) show that the upper layer (12 cm) is very dry (~1%) and much below the wilting point of Stipagrostis ciliata grasses, whereas the deeper soil layer is wetter (4%). The grain size distribution of soil samples taken from inside and outside the fairy circles reveals considerable heterogeneity in the size fractions due to aeolian (wind-driven) sand sorting. The bare soil inside the fairy circles contains coarser grains, and the ground surface is covered by sand megaripples. There is a linear trend between the vertical soil moisture gradient and the median grain diameter. Fine particles trapped on the vegetated edges of the fairy circle result in small nebkhas that increase the soil water retention at the surface. The dry and loose coarser topsoil inside the fairy circles may prevent the recolonization of new seedlings with short root lengths inside the fairy circles. Our results highlight the role of aeolian sand transport and deposition in desert vegetation environments and seem to support the notion that fairy circle formation may be affected by the interplay between sand sorting and soil moisture gradients.

1. Introduction

Fairy circles are remarkable bare circular gaps in a background of uniform grass. They are common within the pro-Namib Desert in areas with 50–100 mm of annual precipitation and in the Pilbara region in Western Australia, where the average precipitation is 330 mm but with ten times more evaporation (Figure 1; [1,2,3] and references therein). Their formation is still under debate both in Australia and Namibia. In the Australian fairy circles, the water transport is by the overland flow of surface water from the center of the gap to the periphery due to the low infiltrability of the physical soil crust at the bare soil. In contrast, in the sandy environment of Namibia, the water transport is below the surface due to lateral soil diffusion from the center to the edges [4,5,6]. Thus, both in Namibia and Australia, the bare soil patches in the fairy circles are a source of extra water available for the vegetation in the matrix. These vegetation patterns can survive drier conditions than the uniform vegetation and they are very important for the ecological system in these harsh environments [4]. A recent work, based on remote sensing analysis [7], claimed that FC-like patterns are globally distributed, and discovered 263 new sites of vegetation gaps, but more detailed field work is needed to understand the formative mechanisms (physical and ecological) at these new sites and to distinguish between FC-like patterns (vegetation gaps) to proper FCs [8].
The aim of the current work is to study the physical characteristics of fairy circles in one of the driest places in the Namib Desert and the role of aeolian interaction in their formation and persistence. Unlike the fairy circles in the other areas of the Namib Desert that have a unique hexagonal spatial order [9], the fairy circles near Sesriem are more random, lacking the typical spatial order observed at the famous, more densely covered FC sites (Figure 1).
In this extreme climate, the grass in the matrix, which is the area between the circles, is very sparse and the fairy circles resemble vegetation rings (Figure 2). Most of the fairy circles in the study site were decorated by small megaripples and their effect on the ecohydrology of fairy circles is still unknown. Normal aeolian (impact) ripples develop due to an instability of an initially flat bed of cohesionless sand that is mobilized into a hopping motion called saltation. These very common ripples emerge on relatively fine desert sands with typically unimodal and well-sorted grain size distributions and form rather parallel wave trains. They can be characterized as effectively two-dimensional bedforms, displaying only small crest modulations transverse to the wind direction. In contrast, so-called megaripples are larger bedforms that develop from poorly sorted sands and their crests exhibit greater sinuosity due to transverse instability that increases with the ripple’s age and is further controlled by wind intensity and direction [10].
Two main theories have been proposed to explain fairy circle development. According to the termite hypothesis, the termites eat the grass’ roots in the Namibian fairy circles (NFCs), whereas the hard pavement created by the termites prevent grass growth in the Australian fairy circles (AFCs; [11,12,13,14]). The self-organizing theory views the fairy circles as one of the various vegetation patterns that form in water-limited systems due to competition between plants for water [15,16]. According to this hypothesis, patterns form due to the instability of the uniform vegetation state to non-uniform perturbations (known as Turing instability or finite wavelength instability) that include short positive feedbacks and long-range negative feedbacks. This generic mechanism, which is also known as scale-dependent feedback [17], can explain the formation of spots, stripes (labyrinths on flat terrains), and gaps depending on the amount of rainfall.
According to a new model, these FC ‘ring-like’ patterns are the last viable patterns before collapse to the bare soil state occurs [18]. This new model takes into account phenotypic changes in the root structure of plants coupled with pattern-forming feedback between the two soil layers. It accounts for the lack of the predicted stripe and spot patterns in Namibia along the rainfall gradient by taking into account the phenotypic plastically feedback, namely that plants can grow longer roots to reach high water content in deeper layers [18]. According to this new model, the final pattern before tipping to the bare soil is a bare matrix with peripheral rings similar to the pattern observed in the study site (Figure 2).
Figure 2. 
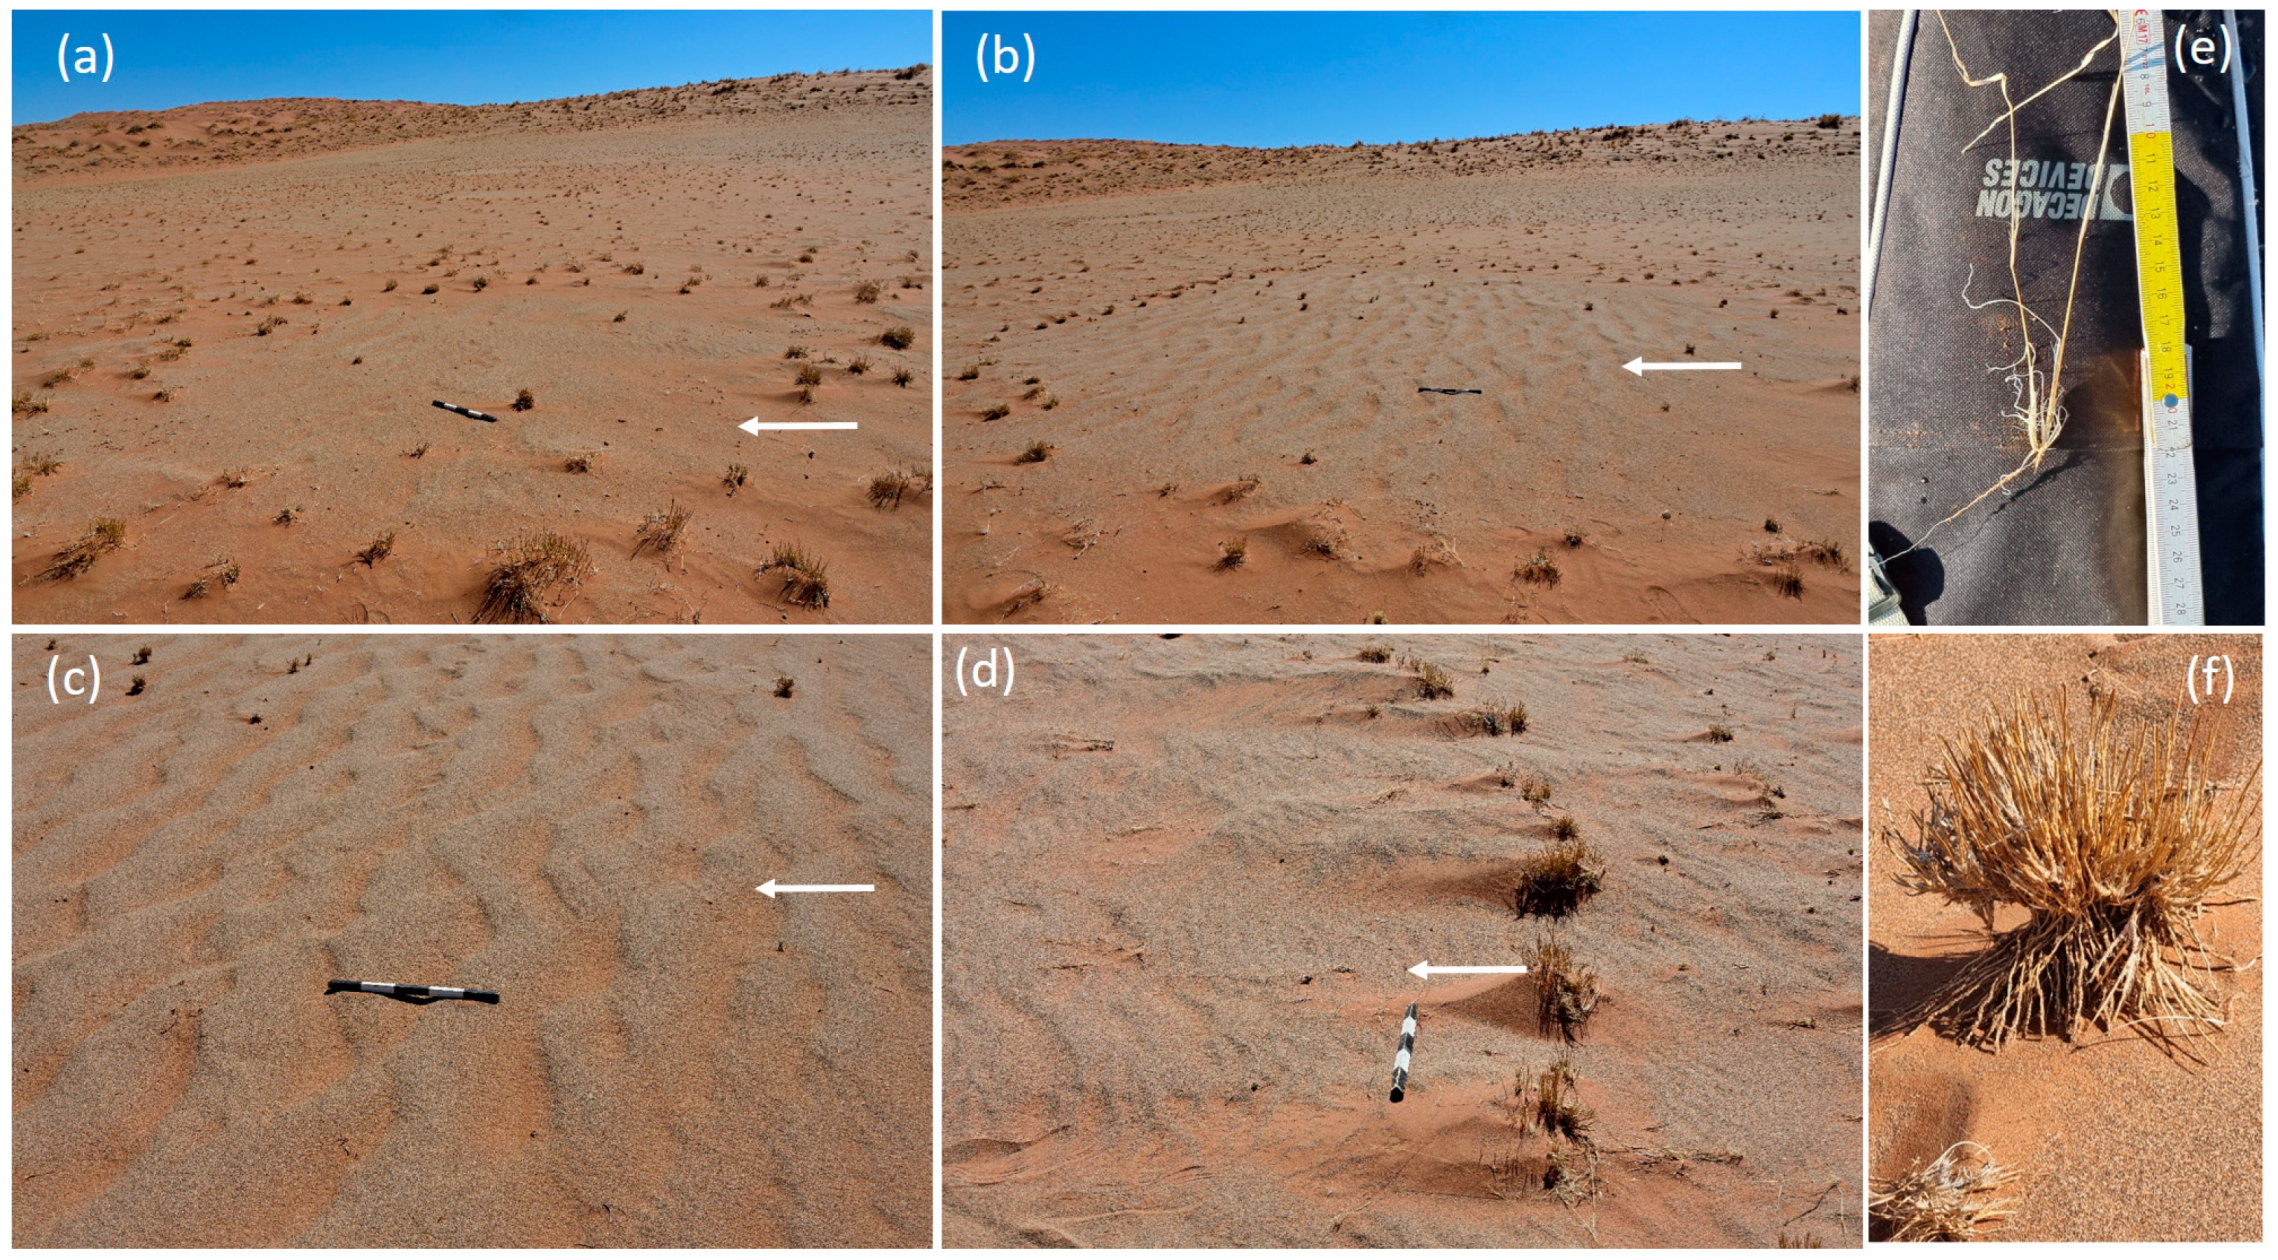
The fairy circles near Sesriem Namibia (latitude 24°36.5104′ S, longitude 15°40.4276′ E) look more like vegetation rings in the dry season, as the vegetation in the matrix is very sparse (panels (a,b)) due to the lower precipitation rate in the year before our measurements. The interior is predominantly covered by small megaripples (panel (c); average wavelength ~30 cm), whereas the plants at the periphery form small nebkhas (d) due to the accumulation of fine sand behind the plants that act as barriers for sand transport. The prevailing wind direction is from the east, indicated by the white arrows. Note the difference between the greyish coarse grains (mode 900 µm) and the reddish fine sand (mode 230 µm). The red color is caused by iron oxide [19]. The length of the scale bar is 50 cm. (e) Dead seedling from the center of a fairy circle that appears to have died due to a lack of water and not due to root harvesting termites. (f) Stipagrostis ciliata grass with exposed roots due to wind erosion at the edge of the fairy circle.
Land 13 00197 g002

2. Materials and Methods

2.1. Study Site

The study site is located 20 km west of Sesriem near the main road to the famous dunes of Sossusvlei (24°36.5104′ S, 15°40.4276′ E). These are the most western fairy circles that can be found in this area, just before the large dunes of the Namib (Figure 3). The dominant grass that decorates the fairy circles is Stipagrostis ciliata. The climate is arid with a mean annual precipitation of 79 mm, and the rainy months are from January to April. The variability in precipitation is very large, and can be 114 mm in 2021 and 28 mm in 2019 (Figure 4). Our field work was completed in August 2023 after a dry period of 12 months in which the total precipitation was 14 mm (Figure 4b; data from meteorological station near Sesriem https://www.wunderground.com/dashboard/pws/IHARDA6, accessed on 22 November 2023).
The average yearly wind speed is 4 m/s (https://globalwindatlas.info/en, accessed on 22 November 2023) measured at a standard height of 10 m with averages gusts of 7.8 m/s. The average temperature is 34 °C in January and 7 °C in July (Figure S1).

2.2. Field Work

The field work included in situ measurements of the volumetric soil water content (SWC) at cross-sections in 10 fairy circles (average diameter 8.4 ± 2.2 m), at intervals of 0.5 m in the east–west direction, in two depths of 12 and 20 cm, by a TDR instrument (HydroSense II, Campbell Scientific, Inc., Logan, UT, USA). The records of the SWC can be expressed by the normalized lateral and vertical moisture gradients specially; we evaluated the difference in the soil water between the center and the periphery defined by [20]
δ w = ( W c W p ) / W c
Where W c is the average soil content in the center and W p is the average soil water content at the periphery (includes the two measurements at the perimeter near the plants). δ w = 0 means that there is no difference between the soil water content between the center and the periphery, where δ w = 1 is the maximum normalized difference in the soil water content between the center and the periphery. Another index used is δ w , 12 , defined as the difference between the soil water content at the center and that at the periphery at 12 cm depth. We used quadratic splines for the estimation of these values.
The in situ measurements of the hydraulic properties were conducted inside the fairy circles using the Mini-disk infiltrometer (Decagon Devices). One can estimate the hydraulic conductivity by fitting the following cumulative infiltration function I(t) to the field data:
I ( t ) = k A t + C 2 t
where C 2 is the sorptivity and k the hydraulic conductivity; the parameter A depends on the van Genuchten parameters for a given soil texture and suction value; and A = 0.5 was used for our measurements in sand.
Soil samples from the upper 1 cm layer were taken from inside and outside each fairy circle in three replicates (a total of 60 soil samples). Six measurements from a 20 cm depth were taken from FC2. The grain size distribution (GSD) was obtained in the laboratory by the dry sieving method. The samples were placed on a set of 21 sieves in diameters between 63 and 2000 μm and were shaken on an electronic sieving apparatus (RETSCH AS 300 Control, Germany) The different modes of the distributions, D90 (the grain size at which 90% of the grains are coarser) and D50 (the median grain size), were calculated using “GRADISTATv8” [21].

3. Results

Figure 5 shows two fairy circles, FC8 covered with sand megaripples and FC9 covered with normal ripples composed mainly of fine sand, and the corresponding soil water content in the cross-sections. In both fairy circles, FC8 and FC9, the upper 12 cm is very dry (~1%), whereas at a depth of 20 cm, the soil water content is about four times higher. Figure 6 shows that the megaripples in the interior of the fairy circle are a source of heterogeneity in the soil water content at 20 cm due to small difference between the crest and the troughs. As the crest is higher than the trough, the probe in the trough can reach slightly deeper and wetter soil.
Figure 7 shows the results of the soil water content in the cross-section for two fairy circles, FC1 and FC5 (Figure 7a). The soil water content at 20 cm is again about four times larger than the soil water content at 12 cm. This behavior is robust for all 10 of the fairy circles, as shown in Figure 7b and Figure S2. The values of the normalized δ w index for the two depths is shown in Figure 7c. For FC9 the values are quite low, and are higher for the soil depth of 12 cm than 20 cm. The calculated hydraulic conductivity (k) in the center of the fairy circles is shown in Figure 7d. The values are larger than the typical values of loose dry sand (0.15 ± 0.04 cm/s).
The different modes, D 50 and D 90 , inside and outside the fairy circles, are shown in Figure 8a,b. The grain size distribution of FC8 that is covered by megaripples and of FC9 that is covered by normal ripples is shown in Figure 9 and the photos of the typical coarse and fine grains are shown in Figure 10 with the grain size distribution of the silt fraction. Normally, the pores between the monodisperse coarse grains are larger than those between the monodisperse finer grains, enabling water to percolate quickly to the deeper soil layers.
Generally, due to the megaripple formation, the sand at the upper layers inside the fairy circles is coarser than the sand outside the fairy circles. In D 50 , there is a significant difference between the inside and outside environments for most of the fairy circles (FC2, FC4, FC5, FC6, FC8, FC10). In those fairy circles, the D 50 is much coarser (~800 µm) inside the circle compared with the soil outside the circles ( D 50 ~200 µm). This trend is also found for D 90 , which is much larger inside ( D 90 ~970 µm) the circles than outside ( D 90 ~400 µm). The megaripple crest inside the fairy circles contains coarse grains in the range of 1000–1200 µm, except for the circles FC7 and FC9, for which the interior is not covered by megaripples.
As one of our major findings Figure 8c shows that there is a linear trend between the average SWC at 20 cm and the fairy circle size (the FC diameter). The larger the fairy circle size, the higher is SWC. A similar trend also exists with D 50 inside the fairy circle, as shown in Figure 8d.
Interestingly, there is also a correlation between the FC size and the median grain diameter, D 50 (of sand from the FCs interior), as shown in Figure 11a. The coarser the grain, the larger the SWC is (Figure 8d). The negative correlation between dw12 and the FC size (Figure 11b) may be seen as an indication that SWC can diffuse laterally, which would support the vegetation at the periphery. The soil water diffusion coefficient, D W , is also larger for the coarser grains. A numerical simulation of a model for the Namibian FC showed that the FC size increases with D W [13], in agreement with our new finding. The full correlation relations analyses between the various measurement variables are shown in Figure S4.

4. Discussion

The fairy circles studied in this work are located at the extreme part of the Namib desert, where rainfall is low (79 mm annual average), with high inter-annual variability. Possibly because of the small limited area at the foot of the big dunes, they are not spatially periodic and lack the characteristic hexagonal ordering of fairy circles seen in other sites in Namibia like the Giribes plains or the Namib Rand Nature Reserve [2,9].
In very dry years (e.g., 2023), the vegetation in the matrix is very sparse and the fairy circles are more similar to vegetation rings, but in rainy years (e.g., 2011 with 180 mm and 2012 with 134 mm) the vegetation in the matrix recovers and the fairy circles become vegetation gaps, similar to the known fairy circles in the more humid sites in Namibia, with a visible perennial belt [11].
Most of the fairy circles in our studied area are covered with megaripples with a wavelength in the range of 20–30 cm and a height of 2 cm, which is relatively small compared to other known megaripples, e.g., [22,23]. Megaripples feature a characteristic bimodal grain size distribution, shaped by the bimodal transport process and the prevailing wind shear stress. The coarse peak corresponds to the grains that move only by reptation induced by saltating fine grains, found in the fine-grain peak [22]. However, the non-trivial interaction of the vegetation pattern with the sand transport makes megaripples in FCs a special case, potentially different from those in larger bare megaripple fields, without interfering vegetation. In particular, the trapping of fine saltating grains by the vegetation, as is well established for so-called nebkhas (Figure 2d), may be responsible for systematic deviations between the GSDs inside and outside the FCs, as shown by Ravi et al. [24] for FCs in Mirabib, Namibia, and other studies [25], and in Figure 9 (featuring the GSDs for two FCs). The observed absence of a clear fine-grain peak in the GSDs inside the FCs is thus most likely due to the fine, saltating grains being trapped with a higher rate by the vegetation outside and at the perimeter of the FCs than inside the FCs, leading to a large-scale lateral sorting. The induced under-saturated saltation flux leads to erosive conditions inside the FCs, favoring the formation of megaripples.
By taking into account both GSDs outside and inside of each FC, we arguably obtain a more complete picture of the transported grains that contribute to megaripple formation inside the FCs. In particular, we can then exploit that the margins of the coarse-grain (reptation) peak of the megaripples are sensitive to the prevailing wind conditions. This enables us to estimate the prevailing wind conditions, following the method proposed in [22]. Applying it to the GSDs of FCs covered by megaripples, the mean wind velocity at a 10 m height evaluates to u ~ 4.93 m/s, which compares well to the mean wind speed near the measurement site of about 4 m/s (https://globalwindatlas.info/en, accessed on 22 November 2023). A slight upward deviation of the inferred value as compared to the yearly average resonates with the usually stronger-than-average winds in the months prior to our measurements (https://globalwindatlas.info/en, accessed on 22 November 2023). Hence, altogether, the GSD analysis seems consistent with the predominant wind conditions and the notion of megaripple formation inside the FCs, yet it also hints at the special character of the grain sorting and megaripple formation inside the FCs compared to larger vegetation-free megaripple fields. The preliminary results by Yizhaq et al. (unpublished; Figure S5), based on the model of Manukyan and Prigozhin 2009 [26], appear to be consistent with our observations.
In addition to the spatially varying deposition rate due to the vegetation at the FCs’ periphery and matrix, the location of the study site in the deposition zone of a dune (Figure 3b) may induce further spatial irregularities in the GSDs. It can be qualitatively stated that the absence of megaripples is observed in the two FCs (7 and 9) with the closest upwind distance to the nearby dune. More extensive field measurements might yield a more systematic correlation between the presence or absence of megaripples and the distance to an upwind dunes, which act as sources of fine, saltating grains. In any case, our present observation is consistent with the sorting model of Lämmel et al. 2018 [27], which requires a low saturation of the wind with fine grains to allow for megaripple formation, and with the common knowledge that megaripple formation is strongly impeded in natural dune sands [10,23].
It seems plausible that the presence of megaripples may increase rainwater infiltration into the soil and thus indirectly increase the lateral diffusion of soil water to the periphery [5]. Such a correlation is supported by the linear relation between the average SWC at 20 cm (Figure 8d) and the median grain diameter inside the fairy circles. Moreover, the trapping of fine particles and the formation of small nebkahs around the grasses along the FC perimeter (Figure 2d) increases the soil water retention at the surface, which helps the vegetation to survive in this extreme environment. Altogether, the larger fairy circles thus seem to be more efficient in deep water harvesting both due to their larger area and their coarser sands (Figure 8c and Figure 11a), which may help support the vegetation circles along their perimeter. Consistently, we find the larger fairy circles in the studied site to be more resistant to prolonged droughts than the smaller ones that can diminish in drought years, as shown in Figure 12.
We also note that the distinction between the FCs and vegetation rings and our finding of megaripple formation in the former, seems significant. Namely, in contrast to fairy circles, the interior of small vegetation rings covered by fine grains has been found to enhance the growth of biocrust compared to fringes, thereby decreasing the infiltration into the center, for Asphodelus ramosus rings in the Northern Negev, Israel ([20]; Figure S6).
The dry and coarser topsoil inside the fairy circle (Figure S7) may prevent the recolonization of new seedlings inside the fairy circles [6]. Indeed, we found a few dead seedlings (Figure 2f and Figure 13) without any sign of damage caused by termites and with short root lengths (~10 cm), hence, too short to reach the deeper soil layers with a higher water content [6]. Although there is a reservoir of soil water in the deeper layers, the upper layer remained very dry (SWC at around 2%), well below the wilting point [28], thereby stabilizing the bare patches, especially during prolonged droughts.
The lack of the typical hexagonal order of fairy circles in the study site remains unclear and can be possibly attributed to the relatively limited area available for fairy circle growth in the foot of the large dunes. Further studies in this site located in the extreme edge of the climatic strip of Namibian fairy circles can help to solve the ongoing debate about the origin of fairy circles [2,8,18,27,29,30,31,32,33,34].

5. Conclusions

The study of the fairy circles near Sesriem reveals the role of aeolian sorting in the formation of the intriguing fairy circles of the Namib Desert. As a main result, we find good linear correlations between the deep vertical moisture gradient (essentially determined by the SWC at 20 cm depth), the sand composition inside the FCs (quantified by the median grain diameter, D 50 , in their interior), and the fairy circle size (FC diameter). Fine particles trapped along the vegetated perimeters of the fairy circles result in the formation of small nebkhas that increase the soil water retention at the surface and increase the resilience of the plants in prolonged droughts. The dry and loose coarser topsoil in the bare soil inside the FCs may prevent the recolonization of new seedlings with short root lengths and also contribute to the formation of perennial belts. These results emphasize the role of aeolian sand transport and deposition in desert vegetation environments and seem to support the notion that fairy circle formation in sandy environments may be affected by the interplay between sand sorting, megaripple formation, and soil moisture gradients.

Supplementary Materials

The following supporting information can be downloaded at https://www.mdpi.com/article/10.3390/land13020197/s1, Figure S1: Average rainfall by months; Figure S2: Cross-section SWC profiles; Figure S3: GSDs of soil samples; Figure S4: Correlation matrix; Figure S5: Numerical simulations of megaripples with different saturation flux; Figure S6: Asphodelus ramosus ring in the Northern Negev; Figure S7: The top 10 cm layer of the soil inside a fairy circle; Data S1 Excel file: TDR results; Data S2 Excel file: Grain size analyses results; Data S3 Excel file: Mini-disk infiltrometer results.

Author Contributions

Field work, H.Y., L.S. and C.R.; grain size analyses, N.C.; data analysis and conceptualization, H.Y., I.K., C.R. and K.K.; writing, H.Y., I.K., C.R. and K.K.; funding acquisition, K.K. and I.K. All authors have read and agreed to the published version of the manuscript.

Funding

This research was funded by the German Israeli Foundation for Scientific Research and Development GIF (no. 155-301.10/2018).

Data Availability Statement

The data presented in this study are available in the Supplementary Material.

Conflicts of Interest

The authors declare no conflicts of interest.

References

  1. Getzin, S.; Yizhaq, H.; Bell, B.; Erickson, T.E.; Postle, A.C.; Katra, I.; Tzuk, O.; Zelnik, Y.R.; Wiegand, K.; Wiegand, T.; et al. Discovery of fairy circles in Australia supports self-organization theory. Proc. Natl. Acad. Sci. USA 2016, 113, 3551–3556. [Google Scholar] [CrossRef]
  2. Getzin, S.; Yizhaq, H.; Tschinkel, W.R. Definition of “fairy circles” and how they differ from other common vegetation gaps and plant rings. J. Veg. Sci. 2021, 32, e13092. [Google Scholar] [CrossRef]
  3. Walsh, F.J.; Sparrow, A.D.; Kendrick, P.; Schofield, J. Fairy circles or ghosts of termitaria? Pavement termites as alternative causes of circular patterns in vegetation of desert Australia. Proc. Natl. Acad. Sci. USA 2016, 113, E5365–E5367. [Google Scholar] [CrossRef]
  4. Zelnik, Y.R.; Meron, E.; Bel, G. Gradual regime shifts in fairy circles. Proc. Natl. Acad. Sci. USA 2015, 112, 12327–12331. [Google Scholar] [CrossRef]
  5. Cramer, M.D.; Barger, N.N.; Tschinkel, W.R. Edaphic properties enable facilitative and competitive interactions resulting in fairy circle formation. Ecography 2016, 39, 001–011. [Google Scholar] [CrossRef]
  6. Sahagian, D. The magic of fairy circles: Built or created? J. Geophys. Res. Biogeosci. 2017, 122, 1294–1295. [Google Scholar] [CrossRef]
  7. Guirado, E.; Delgado-Baquerizob, M.; Benitoa, B.M.; Molina-Pardo, J.L.; Martínez-Valderrama, J.; Maestre, F.T. The global biogeography and environmental drivers of fairy circles. Proc. Natl. Acad. Sci. USA 2023, 120, e2304032120. [Google Scholar] [CrossRef] [PubMed]
  8. Dong, X. Fairy circles tales. Proc. Natl. Acad. Sci. USA 2023, 120, e2314908120. [Google Scholar] [CrossRef] [PubMed]
  9. Meyer, J.J.M.; Schutte, C.S.; Galt, N.; Hurter, J.W.; Meyer, N.L. The fairy circles (circular barren patches) of the Namib Desert—What do we know about their cause 50 years after their first description? S. Afr. J. Bot. 2021, 140, 226–239. [Google Scholar] [CrossRef]
  10. Kok, J.F.; Parteli, E.J.; Michaels, T.I.; Karam, D.B. The physics of wind-blown sand and dust. Rep. Prog. Phys. 2012, 75, 106901. [Google Scholar] [CrossRef] [PubMed]
  11. Jürgens, N. The Biological Underpinnings of Namib Desert Fairy Circles. Nature 2013, 339, 5. [Google Scholar] [CrossRef]
  12. Tarnita, C.E.; Bonachela, J.A.; Sheffer, E.; Guyton, J.A.; Coverdale, T.C.; Long, R.A.; Pringle, R.M. A theoretical foundation for multi-scale regular vegetation patterns. Nature 2017, 541, 398–401. [Google Scholar] [CrossRef] [PubMed]
  13. Jürgens, N.; Gröngröft, A.; Gunter, F. Evolution at the arid extreme the influence of climate on sand termite colonies and fairy circles of the Namib Desert. Phil. Trans. R. Soc. B 2023, 378, 20220149. [Google Scholar] [CrossRef]
  14. Walsh, F.; Bidu, G.K.; Bidu, N.K.; Evans, T.A.; Judson, T.M.; Kendrick, P.; Michaels, A.N.; Moore, D.; Nelson, M.; Oldham, C.; et al. First Peoples’ knowledge leads scientists to reveal ‘fairy circles’ and termite linyji are linked in Australia. Nat. Ecol. Evol. 2023, 7, 610–622. [Google Scholar] [CrossRef]
  15. Meron, E. From Patterns to Function in Living Systems: Dryland Ecosystems as a Case Study. Annu. Rev. Condens. Matter Phys. 2018, 9, 79–103. [Google Scholar] [CrossRef]
  16. Ge, Z. The hidden order of Turing patterns in arid and semi-arid vegetation ecosystems. Proc. Natl. Acad. Sci. USA 2023, 120, e2306514120. [Google Scholar] [CrossRef] [PubMed]
  17. Pringle, R.M.; Tarnita, C.E. Spatial self-organization of ecosystems: Integrating multiple mechanisms of regular-pattern formation. Annu. Rev. Entomol. 2017, 62, 359–377. [Google Scholar] [CrossRef]
  18. Bennett, J.J.R.; Bidesh, K.B.; Michel, F.; Yizhaq, H.; Getzin, S.; Meron, E. Phenotypic plasticity—A missing element in the theory of vegetation pattern formation. Proc. Natl. Acad. Sci. USA 2023, 120, e2311528120. [Google Scholar] [CrossRef] [PubMed]
  19. Grünert, N. Namibia-Fascinating of Geology; Klaus Hess Publishing: Göttingen, Germany, 2023; p. 259. [Google Scholar]
  20. Yizhaq, H.; Stavi, I.; Swet, N.; Zaady, E.; Katra, I. Vegetation ring formation by water overland flow in water-limited environments: Field measurements and mathematical modelling. Ecohydrology 2019, 12, e2135. [Google Scholar] [CrossRef]
  21. Blott, S.J.; Pye, K. GRADISTAT: A grain size distribution and statistics package for the analysis of unconsolidated sediments. Earth Surf. Process. Landf. 2001, 26, 1237–1248. [Google Scholar] [CrossRef]
  22. Tholen, K.; Pahtz, T.; Yizhaq, H.; Katra, I.; Kroy, K. Megaripple mechanics: Bimodal transport ingrained in bimodal sands. Nat. Commun. 2022, 13, 162. [Google Scholar] [CrossRef] [PubMed]
  23. Bagnold, R.A. The Physics of Blown Sand and Desert Dunes; Methuen: London, UK, 1941. [Google Scholar]
  24. Ravi, S.; Wang, L.; Kaseke, K.F.; Buynevich, I.V.; Marais, E. Ecohydrological interactions within “fairy circles” in the Namib Desert: Revisiting the self-organization hypothesis. J. Geophys. Res. Biogeosci. 2017, 122, 405–414. [Google Scholar] [CrossRef]
  25. Cramer, M.D.; Barger, N.N. Are Namibian “fairy circles” the consequence of self-organizing spatial vegetation patterning? PLoS ONE 2013, 8, e70876. [Google Scholar] [CrossRef] [PubMed]
  26. Manukyan, E.; Prigozhin, L. Formation of aeolian ripples and sand sorting. Phys. Rev. E 2009, 79, 031303. [Google Scholar] [CrossRef] [PubMed]
  27. Lämmel, M.; Meiwald, A.; Yizhaq, H.; Tsoar, H.; Katra, I.; Kroy, K. Aeolian sand sorting and megaripple formation. Nat. Phys. 2018, 14, 759–765. [Google Scholar] [CrossRef]
  28. Jürgens, N.; Gröngröft, A. Sand Termite Herbivory Causes Namibia’s Fairy Circles—A response to Getzin et al. (2022). Perspect. Plant Ecol. Evol. Syst. 2023, 60, 125745. [Google Scholar] [CrossRef]
  29. van Rooyen, M.W.; Theron, G.K.; van Rooyen, N.; Jankowitz, W.J.; Matthews, W.S. Mysterious circles in the Namib Desert: Review of hypotheses on their origin. J. Arid. Environ. 2004, 57, 467–485. [Google Scholar] [CrossRef]
  30. Vlieghe, K.; Picker, M. Do high soil temperatures on Namibian fairy circle discs explain the absence of vegetation? PLoS ONE 2019, 14, e0217153. [Google Scholar] [CrossRef]
  31. Vlieghe, K.; Picker, M.; Ross-Gillespie, V.; Erni, B. Herbivory by subterranean termite colonies and the development of fairy circles in SW Namibia. Ecol. Entomol. 2015, 40, 42–49. [Google Scholar] [CrossRef]
  32. Meyer, J.M.; Schutte, C.E.; Hurter, J.W.; Galt, N.S.; Degashu, P.; Breetzke, G.; Baranenko, D.; Meyer, N.L. The allelopathic, adhesive, hydrophobic and toxic latex of Euphorbia species is the cause of fairy circles investigated at several locations in Namibia. BMC Ecol. 2020, 20, 45. [Google Scholar] [CrossRef]
  33. Picker, M.D.; Ross-Gillespie, V.; Vlieghe, K.; Moll, E. Ants and the enigmatic Namibian fairy circles—Cause and effect? Ecol. Entomol. 2012, 37, 33–42. [Google Scholar] [CrossRef]
  34. Naude, Y.; van Rooyen, M.W.; Rohwer, E.R. Evidence for a geochemical origin of the mysterious circles in the Pro-Namib desert. J. Arid. Environ. 2011, 75, 446–456. [Google Scholar] [CrossRef]
Figure 1. (a) Fairy circle pattern in the Giribes, northwest Namibia, and a closer look at three fairy circles with a perennial belt (c). Note that vegetation is partly recovered in the fairy circle in the front. (b) Aerial image of fairy circles near the town of Newman in Western Australia’s Pilbara region, showing regularly hexagonal spaced bare-soil gaps. (d) Closer look at a fairy circle formed by the bunchgrass species Triodia basedowii E. (known also as spinifex). The top soil layer is barley permeable clay pan that generates overland water flow towards the denser vegetation patches at the gap edges. According to the current self-organization theory and the termite’s hypothesis, the vegetation in both sites benefit from the extra water transport from the bare soil patches, although they do not agree on the formative mechanism of gaps.
Land 13 00197 g001
Figure 3. (a) Aerial photos (from Google Earth) of the study area (latitude 24°36.5104′ S, longitude 15°40.4276′ E) at a large scale (indicated by the red symbol). (b) A closer look at the study area near the great dunes of the Namib Desert.
Land 13 00197 g003
Figure 4. (a) Annual rainfall for the years 2009–2023. The average is 79 with 40 mm standard deviation. Note the drought years 2013–2016 and 2019. The precipitation in the study site is probably less than that in Sesriem because it is located 20 km west of the meteorological station. (b) The monthly rainfall during the last 12 months before our field work. Data source: https://www.worldweatheronline.com/v2/weather-averages.aspx?q=szm&custom_header=sesriem+airport+(szm)+weather%2C+namibia, accessed on 22 November 2023.
Land 13 00197 g004
Figure 5. FC8 (a) and FC9 (c) and their soil water contents at 12 and 20 cm, (b,d) (Data S1). FC8 was covered by small megaripples, whereas FC9 interior was covered by fine sand with normal ripples. Note the difference in the size between the two fairy circles (scale bar is 0.5 m).
Land 13 00197 g005
Figure 6. Fairy circle covered by small megaripples with wavelength between 20 and 30 cm (a) and a closer look at the ripple crests (b). The small fluctuations in the soil water content (SWC) at 20 cm depth (c) may indicate small differences in total depth between the measurements taken at the crest or the trough of megaripples (d) where the measurements were performed specifically at the locations of megaripple crests and troughs.
Land 13 00197 g006
Figure 7. (a) Two cross-sections of SWC at two depths for FC1 and FC5. (b) Average volumetric SWC recorded in the cross-sections of 10 fairy circles at soil depths of 12 and 20 cm (180 records for each depth). The average SWC at 20 cm is about four times larger than the SWC at 12 cm. The soil water at the upper layer is very important for the establishment of new seedlings. (c) δ w index shows the normalized difference of SWC for the two depths. Note that for FC5, δ w < 0 , indicating that W p > W c . (d) Hydraulic conductivity (k) in cm/s calculated from the in situ measurements using the Mini-disk infiltrometer (Data S3).
Land 13 00197 g007
Figure 8. The statistics of the grain size distribution is shown in panels (a,b). Average SWC at 20 cm shows linear trend with fairy circle size (c) and with the median grain diameter D 50 inside the fairy circle (d). See also Figure S3 for the grain size distribution curves for all the FCs.
Land 13 00197 g008
Figure 9. Grain size distributions (GSDs) of samples taken from inside and outside (Data S2), from FC8 covered with megaripples (a) and from FC9 covered with normal ripples (b). The GSD of FC8 has a typical bimodal distribution of megaripples with coarse and fine modes.
Land 13 00197 g009
Figure 10. (a) Microscope photos of typical coarse grains with diameter between 0.9 and 1 mm and fine grains with range of 0.08–0.36 mm. Due to the sorting mechanism, the coarse grains are more abundant at the megaripple crests building the armoring layer [22]. (b) The GSDs of the silt fraction show that, at 20 cm depth (for FC2), there are more fine silt (2–20 µm) particles (66.32%) than for FC8 outside (48%) and inside (45.1%) samples measured at the surface.
Land 13 00197 g010
Figure 11. Linear fits between the FC size (diameter) and D 50 (a) and between δ w , 12 - (defined as the difference between SWC inside the FC and SWC at the perimeter at depth of 12 cm) and FC size (b).
Land 13 00197 g011
Figure 12. Aerial photos (from Google Earth) of the study area in different years. The white, orange, and blue arrows show the same fairy circles in all the panels. Note the vegetation in the matrix and the perennial belt in 2012 due to successive rainy years. The fairy circle indicated by the black arrow was not visible in 2023 (its location is marked by the dashed blue arrow). The spatial scale is the same in all the panels.
Land 13 00197 g012
Figure 13. Dead seedling from a fairy circle interior. Its root is indicated by the white arrows and its length is less than 10 cm. Its death appears to be due to lack of soil water in the upper layer and its short root length, rather than caused by termites.
Land 13 00197 g013
Disclaimer/Publisher’s Note: The statements, opinions and data contained in all publications are solely those of the individual author(s) and contributor(s) and not of MDPI and/or the editor(s). MDPI and/or the editor(s) disclaim responsibility for any injury to people or property resulting from any ideas, methods, instructions or products referred to in the content.

