Article

Spatial–Temporal Characteristics and Influencing Factors of Eco-Efficiency of Cultivated Land Use in the Yangtze River Delta Region

1
School of Public Administration, Nanjing University of Finance & Economics, 3 Wenyuan Road, Qixia Distinct, Nanjing 210023, China
2
The Key Laboratory of Carbon Neutrality and Territory Optimization, Ministry of Natural Resources, Nanjing 210023, China
3
School of Geography and Ocean Sciences, Nanjing University, Nanjing 210023, China
4
College of Earth Sciences, Jilin University, Changchun 130061, China
*
Author to whom correspondence should be addressed.
Land 2024, 13(2), 219; https://doi.org/10.3390/land13020219
Submission received: 2 January 2024 / Revised: 6 February 2024 / Accepted: 7 February 2024 / Published: 9 February 2024
(This article belongs to the Section Land Environmental and Policy Impact Assessment)

Abstract

:
The sustainable utilization of regional cultivated land systems in the Yangtze River Delta (YRD) region over the past 40 years has been severely impacted by rapid urbanization processes. Improving the eco-efficiency of cultivated land use (ECLU) plays a significant role in achieving the sustainable utilization of farmland and high-quality development of agriculture and rural areas. In this study, the spatial–temporal features and influencing factors of the ECLU in the YRD are investigated by various methods, such as a super-efficient SBM model, hot spot analysis, Dagum Gini coefficient, and panel tobit model. The findings indicate the following: the ECLU showed an overall high level from 2000 to 2020; the ECLU varied significantly over time and space in the YRD. The ECLU presented obvious spatial agglomeration in the YRD: southern regions exhibited a concentration of cold spots, while hot spots were primarily found in the east and north of the YRD. The trend of regional differences in ECLU during the research period fluctuated upwards in the YRD, and the density difference super-variable was the main source of regional differences. Increases in urbanization level and GDP per capita contributed to ECLU enhancement in the YRD, and agricultural intensity levels and agricultural industrial structures played a negative role in ECLU improvement. Finally, we suggest that different regions should adapt to local conditions, scientifically and reasonably allocate cultivated land production resources, and promote the coordinated improvement of ECLU. This study could provide a reference for policymakers to formulate better decisions on cultivated land utilization and management.

1. Introduction

Cultivated land resources are the most important and scarcest material resources for agricultural production in the world. Given its general national conditions of small per capita cultivated land and limited reserve of cultivated land resources, China has put in place the strictest system for protecting cultivated land [1], but due to the limited total amount of cultivated land resources, China’s cultivated land has remained in a state of high-intensity utilization for a long time [2,3]. High-intensity utilization of cultivated land has significantly raised the total amount of food produced from cultivated land and the output value of agriculture and related sectors; in 2020, China’s agricultural output value was about CNY 7.17 trillion, and grain output was about 669 million tons [4]. Between 2000 and 2020, the mean annual growth rates for grain output and agricultural output value were 1.78% and 8.12%, respectively. However, global emissions of greenhouse gases (especially carbon dioxide) from agriculture and food production are increasing every year. According to the “IPCC Guidelines for National Greenhouse Gas Inventory” and relevant research by scholars, the total carbon emissions in China were calculated. The mean year growth rate of carbon emissions from 2005 to 2020 was 3.74%, surging from 450.49 to 810.8 million tons [5]. In September 2020, the 75th United Nations General Assembly witnessed China’s proposal calling for a peak in carbon dioxide emissions by 2030 and “carbon neutrality” by 2060, respectively. In order to implement the policy of rural rejuvenation, accelerate the building of an ecological society, and provide a comprehensive response to climate change, it is imperative that carbon peaking and carbon neutrality be promoted in agricultural areas. The ECLU refers to the degree to which a certain input of production factors can maximize social and economic output and minimize environmental pollution during the utilization of farmland. The ECLU refers to the degree to which certain production factors, such as farmland, labor, and pesticides, are invested in the utilization of arable land, aiming to maximize expected output (agricultural output value, gross grain output) and minimize unexpected output (carbon emissions) [6,7]. In the current ecological civilization-building context, improving the efficient and environmentally friendly use of cultivated land and ensuring China’s food security and sustainable agricultural development depend on how well the ecological connotations are integrated into the evaluation of cultivated land efficiency.
At present, relevant studies on the ECLU at home and abroad mainly discuss measurement methods, spatial and temporal evolution characteristics, and influencing factors [8,9,10,11,12,13]. In terms of efficiency measurement, research has mainly been based on the differences in research backgrounds and objectives and has used different methods to quantitatively measure the ECLU [14,15], such as the stochastic frontier production function method [16], the DEA model [17], the SBM model [18], the Malmquist model [19], the Bootstrap method of random sampling [20], and the SWAT model [21], among others. Scholars have used the spatial autocorrelation method [22], kernel density method [23], exploratory spatial data analysis (ESDA) method [18], Gi* index [24], and other methods to detect spatial and temporal evolution characteristics of cultivated land utilization efficiency. Influencing factors have been investigated using a variety of techniques, including the econometric model [25], the tobit regression model [26,27], geographically weighted regression [16], and others. From a research scale standpoint, cultivated land utilization efficiency has mainly been analyzed on the national level [12,13,28] and provincial (city) level [29,30], exploring the driving factors of cultivated land utilization efficiency [31,32]. However, most existing research only focuses on desired outputs, such as cropland output and yield, while ignoring non-desired outputs, which will result in problems such as inaccurate ECLU estimation results [33].
With the increasing importance of ecological construction and environmental protection, scholars are paying more and more attention to research on farmland utilization and ecological integration. The notion of “eco-efficiency” was defined in 1990 by the German scientists Schaltegger and Sturm [34] as the ratio of negative environmental values caused by economic growth. Since then, eco-efficiency has been commonly used in various fields such as industry, agriculture, and tourism. The ECLU is an innovative application and advancement of farmland use efficiency. It aims to achieve coordination and unity of three categories, i.e., “resource, socio-economic, environment”, and achieve efficiency and effectiveness in maximizing desirable outputs and reducing undesirable outputs [35]. Our literature search found that scholars have now formed a more mature methodological system for the study of ECLU. But research on the integration of farmland utilization and ecology is still in its infancy and needs to be improved. The YRD region was selected as the object in this paper. As an important food production base and a region with a relatively large proportion of agricultural pollution emissions in China, the YRD region has received relatively little attention in relevant studies, and the selection of this region helps to enrich the relevance of this study in terms of the ECLU. Thirdly, previous studies have lacked research on internal differences in ECLU and its influencing factors in economically developed regions.
As one of the most active, open, and innovative regions in China, the YRD plays an important strategic position in the overall situation of China’s modernization and all-round opening [36]. The improvement of the ECLU in this region is conducive to alleviating the contradiction between supply and demand of cultivated land and improving the coefficient of food security. Therefore, what were the spatial–temporal patterns, area-dependent differences, and influencing factors of the ECLU in the YRD region from 2000 to 2020? Based on the above question, this paper attempts to integrate ecological connotations into the ECLU and construct an evaluation index system for the ECLU. The ECLU was measured at the city level by using the super-efficiency SBM model, and the spatial and temporal characteristics of the ECLU were explored by hot spot analysis. This paper explored the regional distribution differences in and sources of ECLU by calculating the Dagum Gini coefficient. Meanwhile, the tobit model was utilized to explore influencing factors of the ECLU.

2. Data and Methods

2.1. Study Area

The Yangtze River Delta (YRD) region (28°45′–33°25′ N, 118°20′–123°25′ E) is located in the lower reaches of the Yangtze River in China, covering an area of 358,000 square kilometers and encompassing the provinces of Shanghai, Jiangsu, Zhejiang, and Anhui (Figure 1). The YRD region has a sub-tropical monsoon climate and an average annual precipitation of 1000–1500 mm. The region also has a vast plain and abundant water resources, which are suitable for the production of a wide range of agricultural crops. With its excellent cultivated land, water, and heat resources, the YRD region has become an important production area for grain, tea, and other crops in China. The planting area of crops in the YRD was about 13.97 billion hectares in 2020, with a total grain output of 12.11 billion kilograms and an agricultural output value of about CNY 8359.6 trillion, playing an important role in maintaining national food security. However, as a result of the rapid increase in urbanization in the YRD region in recent years, the planting area of grain in the region has been on a decreasing trend, and meanwhile, the highly intensive use of farmland by farmers in the YRD region during the cultivation process has led to the prominence of the problem of pollution of resources. Therefore, the purpose of this paper is to investigate the spatial and temporal evolution characteristics of the ECLU and its influencing factors in the YRD region in order to provide support for the realization of sustainable regional agricultural development.

2.2. Data Sources

This paper takes 41 cities in the YRD region as the research object, based on the administrative district scale of prefecture-level cities as the basic research unit, i.e., a total of one municipality directly under the central government (Shanghai) and 40 prefecture-level cities (Nanjing, Wuxi, etc.) are included. The period of research is 2000–2020. This paper uses statistical data and administrative division data. Statistical data mainly come from 2001–2021 Statistical Yearbooks of Shanghai, Jiangsu, Zhejiang, and Anhui, the 2001–2021 Statistical Yearbooks of each prefecture-level city in these provinces, and the EPS database. Some of the missing data are supplemented by trend extrapolation or interpolation according to data characteristics. Data on administrative divisions are sourced from http://www.resdc.cn (assessed on 22 June 2022).
In addition, in order to analyze the ECLU in cities of different sizes in different areas of the YRD region, this study takes the resident population of urban areas as the statistical caliber and divides the cities in the YRD region into six grades: megacities, supercities, large cities (type I large-sized cities, type II large-sized cities), medium-sized cities, and small cities (type I small-sized cities), in accordance with the State Council’s “Circular on the Adjustment of the Standard for the Delineation of the Size of Cities (2014)”. Table 1 displays the distribution of city sizes in the YRD region.

2.3. Research Methodology

Based on the research objectives and content, this article selects the appropriate research methods, and the operational flowchart is shown in Figure 2. The specific research method is detailed in the following text.

2.3.1. Index System for Measuring the Efficiency of Cultivated Land Use

The ECLU reflects the changes and relationships in the integrated system of economic development, conservation of resources, and preservation of the environment in agriculture. In a way that is comprehensive, scientific, and operable, this paper refers to the existing research results [16,17,18,19,20,21] and selects labor force, land, irrigation, machinery, agricultural film, and pesticide and fertilizer use as the input indexes. Considering social and economic impacts, agricultural output value, which affects the income level of agricultural producers, and grain output, which is related to social stability, are selected as the desired output indexes. Gross agricultural carbon emissions are calculated with reference to Li Bo’s formula for estimating agricultural carbon emissions [37], which is used as the proxy for unanticipated production in farmland usage. Table 2 displays the index system.

2.3.2. Super-Efficient SBM Model Based on Undesired Outputs

The super-efficient SBM (slacks-based model) for undesired outputs was constructed by combining the advantages of the SBM with super-efficient DEA (data envelopment analysis) [38]. The conventional DEA model calculates efficiency using a flawed calculation procedure that prevents further comparisons when DEA efficiency results from different measurement units add up to one [39]. The SBM, based on super-efficiency of non-expected outputs and constructed by Japanese scholar Tone in 2002, considers non-expectation to address the shortcomings of the traditional DEA model. The model fully takes into account the impact of input and output slack variables on efficiency level, thus accurately measuring the input–output efficiency of decision-making units, and at the same time, it can be compared for multiple effective decision-making units. In this paper, the efficiency index measurement system not only includes desired outputs such as agricultural output value and food production, but also includes undesired outputs such as carbon emissions, so the super-efficient SBM based on undesired outputs was selected and the relevant formulas are as follows:
y k 0 a u = 1 , v 1 s λ v y k u a w k a , k = 1 , 2 , , p 2
λ v > 0 , v = 1 , 2 , , s , j 0 w u 0 , u = 1 , 2 , , t w r g 0 , w r g y r 0 g , r = 1 , 2 , p 1 w k a 0 , k = 1 , 2 , p 2
min θ = 1 + 1 t u = 1 t w u x u 0 1 1 p 1 + p 2 ( r = 1 p 1 w r g y r 0 g + k = 1 p 2 w k a y k 0 a )
s . t . x u 0 v = 1 , v 0 s λ v x u v w u , u = 1 , 2 , t y r 0 g v = 1 , v 0 s λ v y r v g + w r g , r = 1 , 2 , p 1
In the above equation, s is the number of decision units; t, p1, and p2 are the numbers of inputs, desired outputs, and non-desired outputs, respectively; w, wg, wa are the slacks of inputs, desired outputs, and non-desired outputs, respectively; λ is a vector of weights; x, yg, ya are the vectors of inputs, desired outputs, and non-desired outputs, respectively, where xRt and the matrix X = [x1, …. xs] ∈ Rt×s. In this study, MaxDEA 8 Ultra software was used to measure the ECLU.

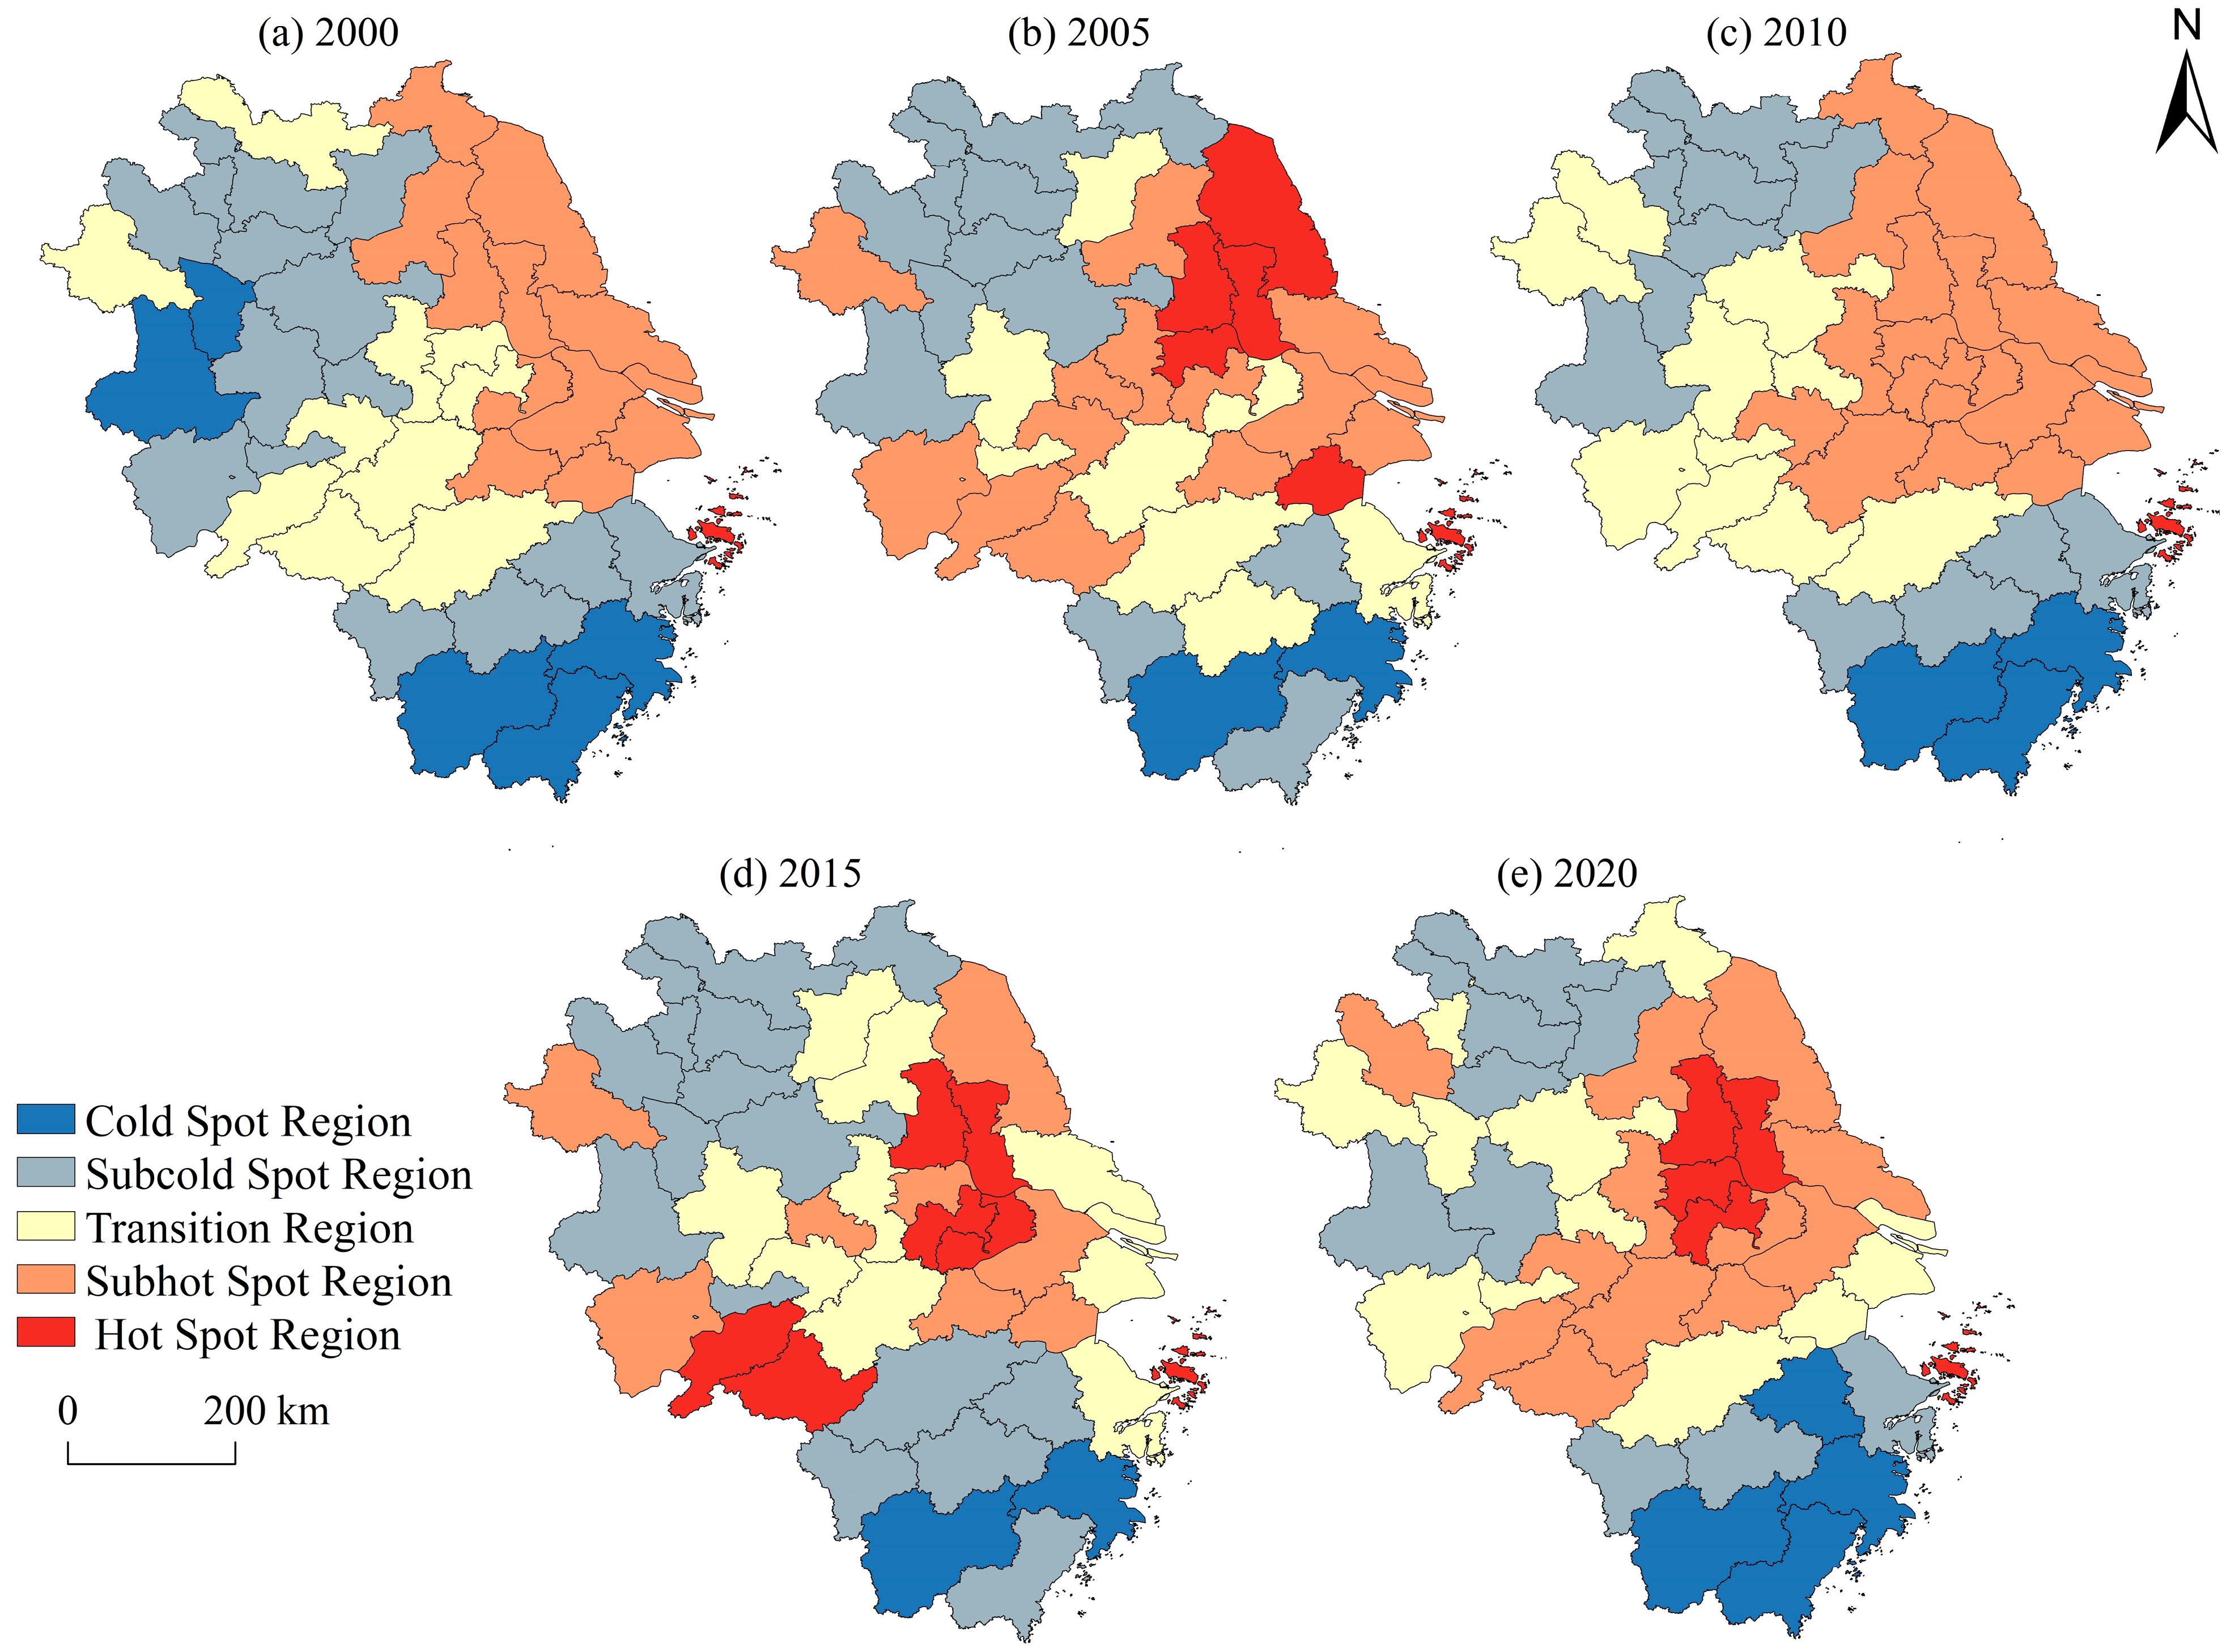
2.3.3. Hot Spot Analysis

Hot spot analysis is a method in spatial correlation analysis which focuses on calculating the Getis-Gi* statistic (called Gi*) for each element in the dataset that needs to be analyzed [40], returning Gi* and counting the Z scores, and determining whether or not there is a local correlation between the observations and neighboring elements. The hot spot analysis tool was chosen to determine where the high and low value clusters of ECLU are distributed spatially. They were analyzed and mapped using Arcgis 10.8 software. The specific formula of the Getis-Ord Gi* index is as follows:
G i * = j = 1 n W i j ( d ) X j j = 1 n X j
In the above equation, Gi* denotes the cold–hot spot analysis index of city i, d denotes the distance between city j and city i, Wij denotes the spatial weight of the distance between province i and province j, and Xj denotes the eco-efficiency of cultivated land use in province j. Gi* is normalized to
Z ( G i * ) = G i * E ( G i * ) V A R G i *
In the above equation, Z(Gi*) denotes the value of the cold–hot spot analysis index after standardized processing in province i; E(Gi*) denotes the expected value of Gi*; and VARGi* denotes the coefficient of variation of Gi*. When Z(Gi*) is positive and significant, it indicates that province i is a hot spot area, which means province i is a high-value agglomeration of ECLU and vice versa.

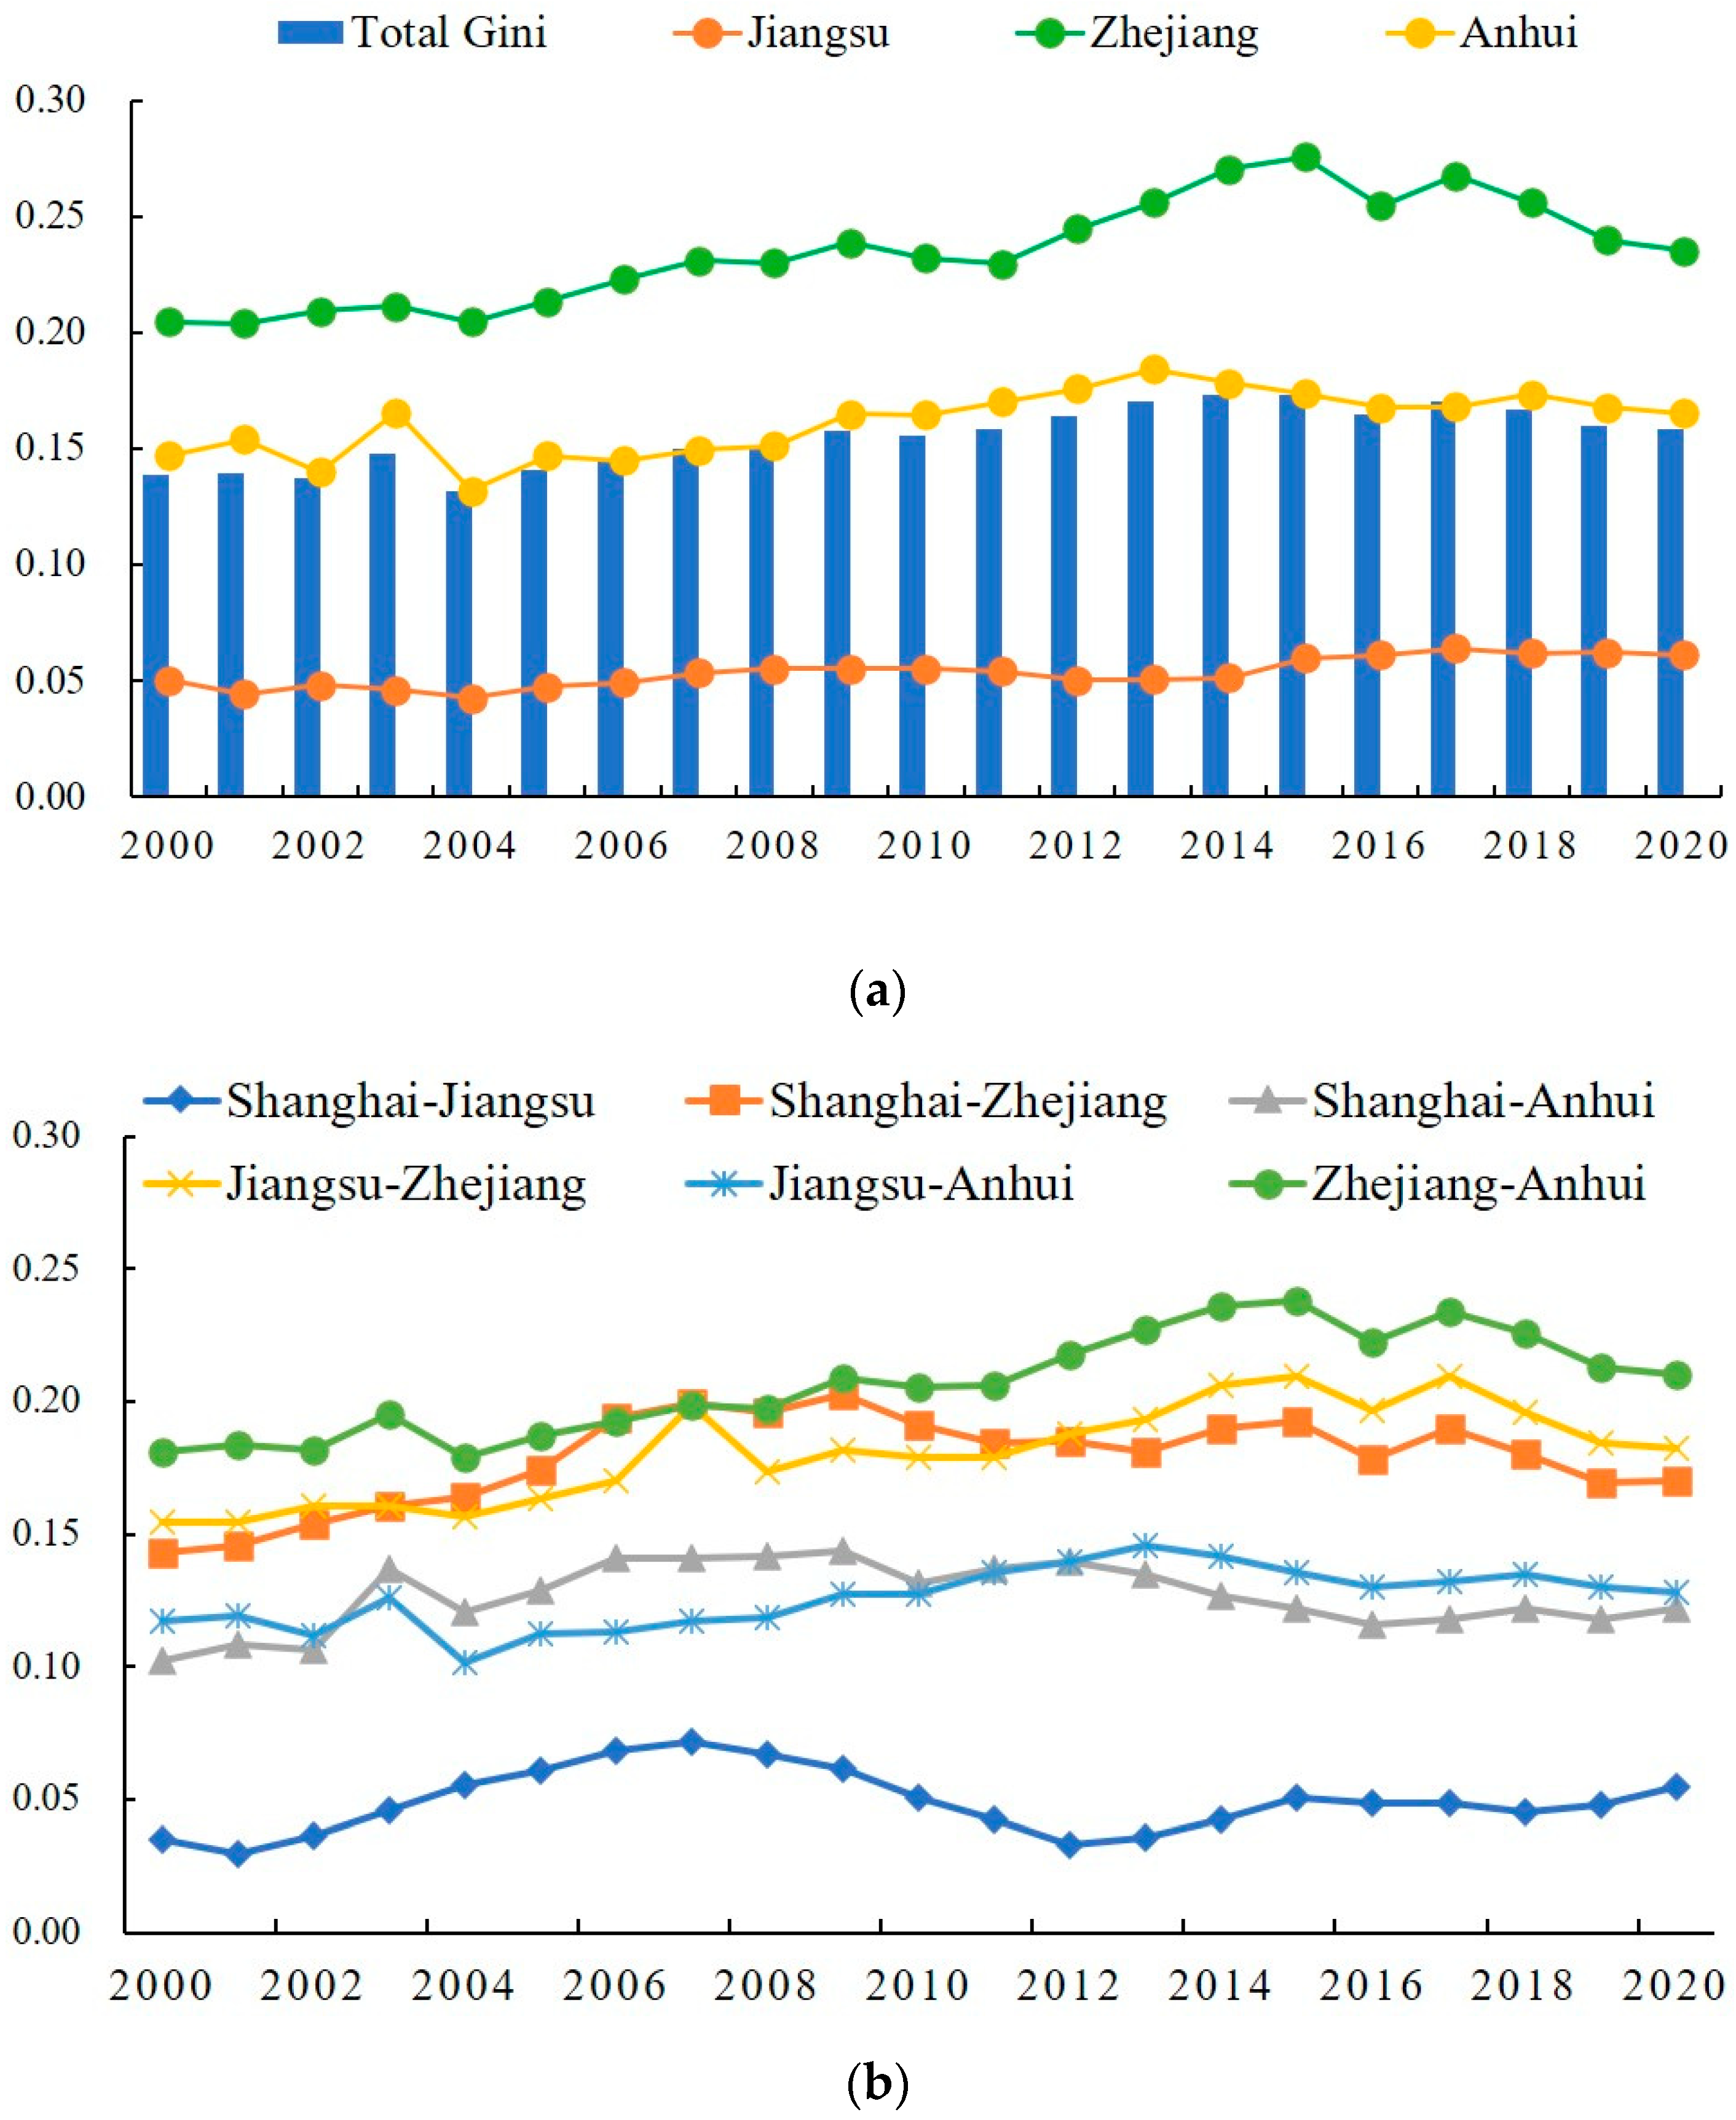
2.3.4. Dagum Gini Coefficient

The Dagum Gini Coefficient was constructed by Italian scholar Dagum in 1997 as a method for studying regional differences [41]. Unlike the Thiel index [42] and the traditional Gini coefficient, the Dagum Gini coefficient not only has the advantage of overcoming the problem of data overlap among samples and revealing the causes of overall differences, but also can further decompose the sources of differences in a particular index and decompose the overall regional differences into three parts: intra-regional differences Gw, inter-regional differences Gnb, and inter-regional hypervariable densities Gt [43]. In order to examine regional differences in ECLU and its sources, this paper adopts the Dagum Gini coefficient decomposition method and utilizes matlab2022 software to carry out specific calculations and decompositions. The defining equation of the Gini coefficient is:
G = j = 1 m h = 1 m i = 1 n j r = 1 n m | y j i y h r | 2 n 2 Y ¯
The Gini coefficient for area j is:
G j j = i = 1 n j r = 1 n j | y j i y j r | 2 n j 2 Y j ¯
The Gini coefficient between region j and region h is:
G j h = i = 1 n j r = 1 n h | y j i y h r | n j n h ( Y j ¯ + Y h ¯ )
Intra-area variation Gw, inter-area variation Gnb, and hypervariable density Gt are:
G w = j = 1 m G j j p j s j
G n b = j = 2 m h = 1 j 1 G j h D j h ( p j s h + p h s j )
G t = j = 2 m h = 1 j 1 G j h ( 1 D j h ) ( p j s h + p h s j )
In the above equation, m denotes the number of regions; n is the number of all cities; yji(yhr) denotes the ECLU of city i(r) within region j(h); and Y ¯ denotes the average value of ECLU of all cities. The magnitude of regional differences in ECLU is indicated by the magnitude of the measured Gini coefficient.

2.3.5. Index System for Evaluating Factors Influencing the ECLU

To synthesize previous studies, the socio-economy, natural environment, and agricultural development are the main influencing factors of ECLU [8,9,10,11,44]. Together, these three types of influencing factors constitute the index system of factors influencing the ECLU in the YRD. Table 3 shows the complete index system.
As for the socio-economic influencing factors, the urban population ratio index reflects the proportion of the rural population, the per capita GDP index reflects regional economic development, the agricultural GDP ratio index reflects the regional agricultural development level, and the disposable income of farmers expresses the influence of the main cropland operators on the ECLU. As for the natural environment influencing factors, the rainfall index, reflecting the regional of endowment water resources, was selected. Regarding the factors that influence agricultural development, the degree of modernization in agriculture is reflected by the index of mechanization density [45], the index of agricultural intensity level reflects the level of agricultural intensification in the region [46], and the index of agricultural industry structure reflects the type of structure of the primary industry in each region. Referring to the algorithm developed by Shu et al. [47], the agricultural industrial structure of the region is expressed by dividing the value of gross regional agricultural output by the value of gross agricultural, forestry, livestock, and fishery outputs.

2.3.6. Panel Tobit Models

The panel tobit regression model was proposed by the American scholar Tobin in 1958 to solve econometric models with restricted explanatory variables [48]. It can effectively compensate for the biased and inconsistent parameter estimation of the least squares method [49,50]. The obtained value domain of the ECLU is in the truncated state; estimation with the ordinary least squares method will have a large bias, so this study adopts the tobit regression model, which has a small bias and a high degree of accuracy. Stata17 software is used for evaluation. The expression is as follows:
y i * = X i β + ε i ε i ~ N ( 0 , σ 2 ) y i = y i * = X i β + ε i       y i * > 0 0 y i * < 0
In the above equation, yi* is the potential dependent variable; yi is the explanatory variable; Xi is the explanatory variable; and β is the coefficient of the explanatory variable, where i obeys N (0, δ2), i = 1, 2, 3, …, n.

3. Results

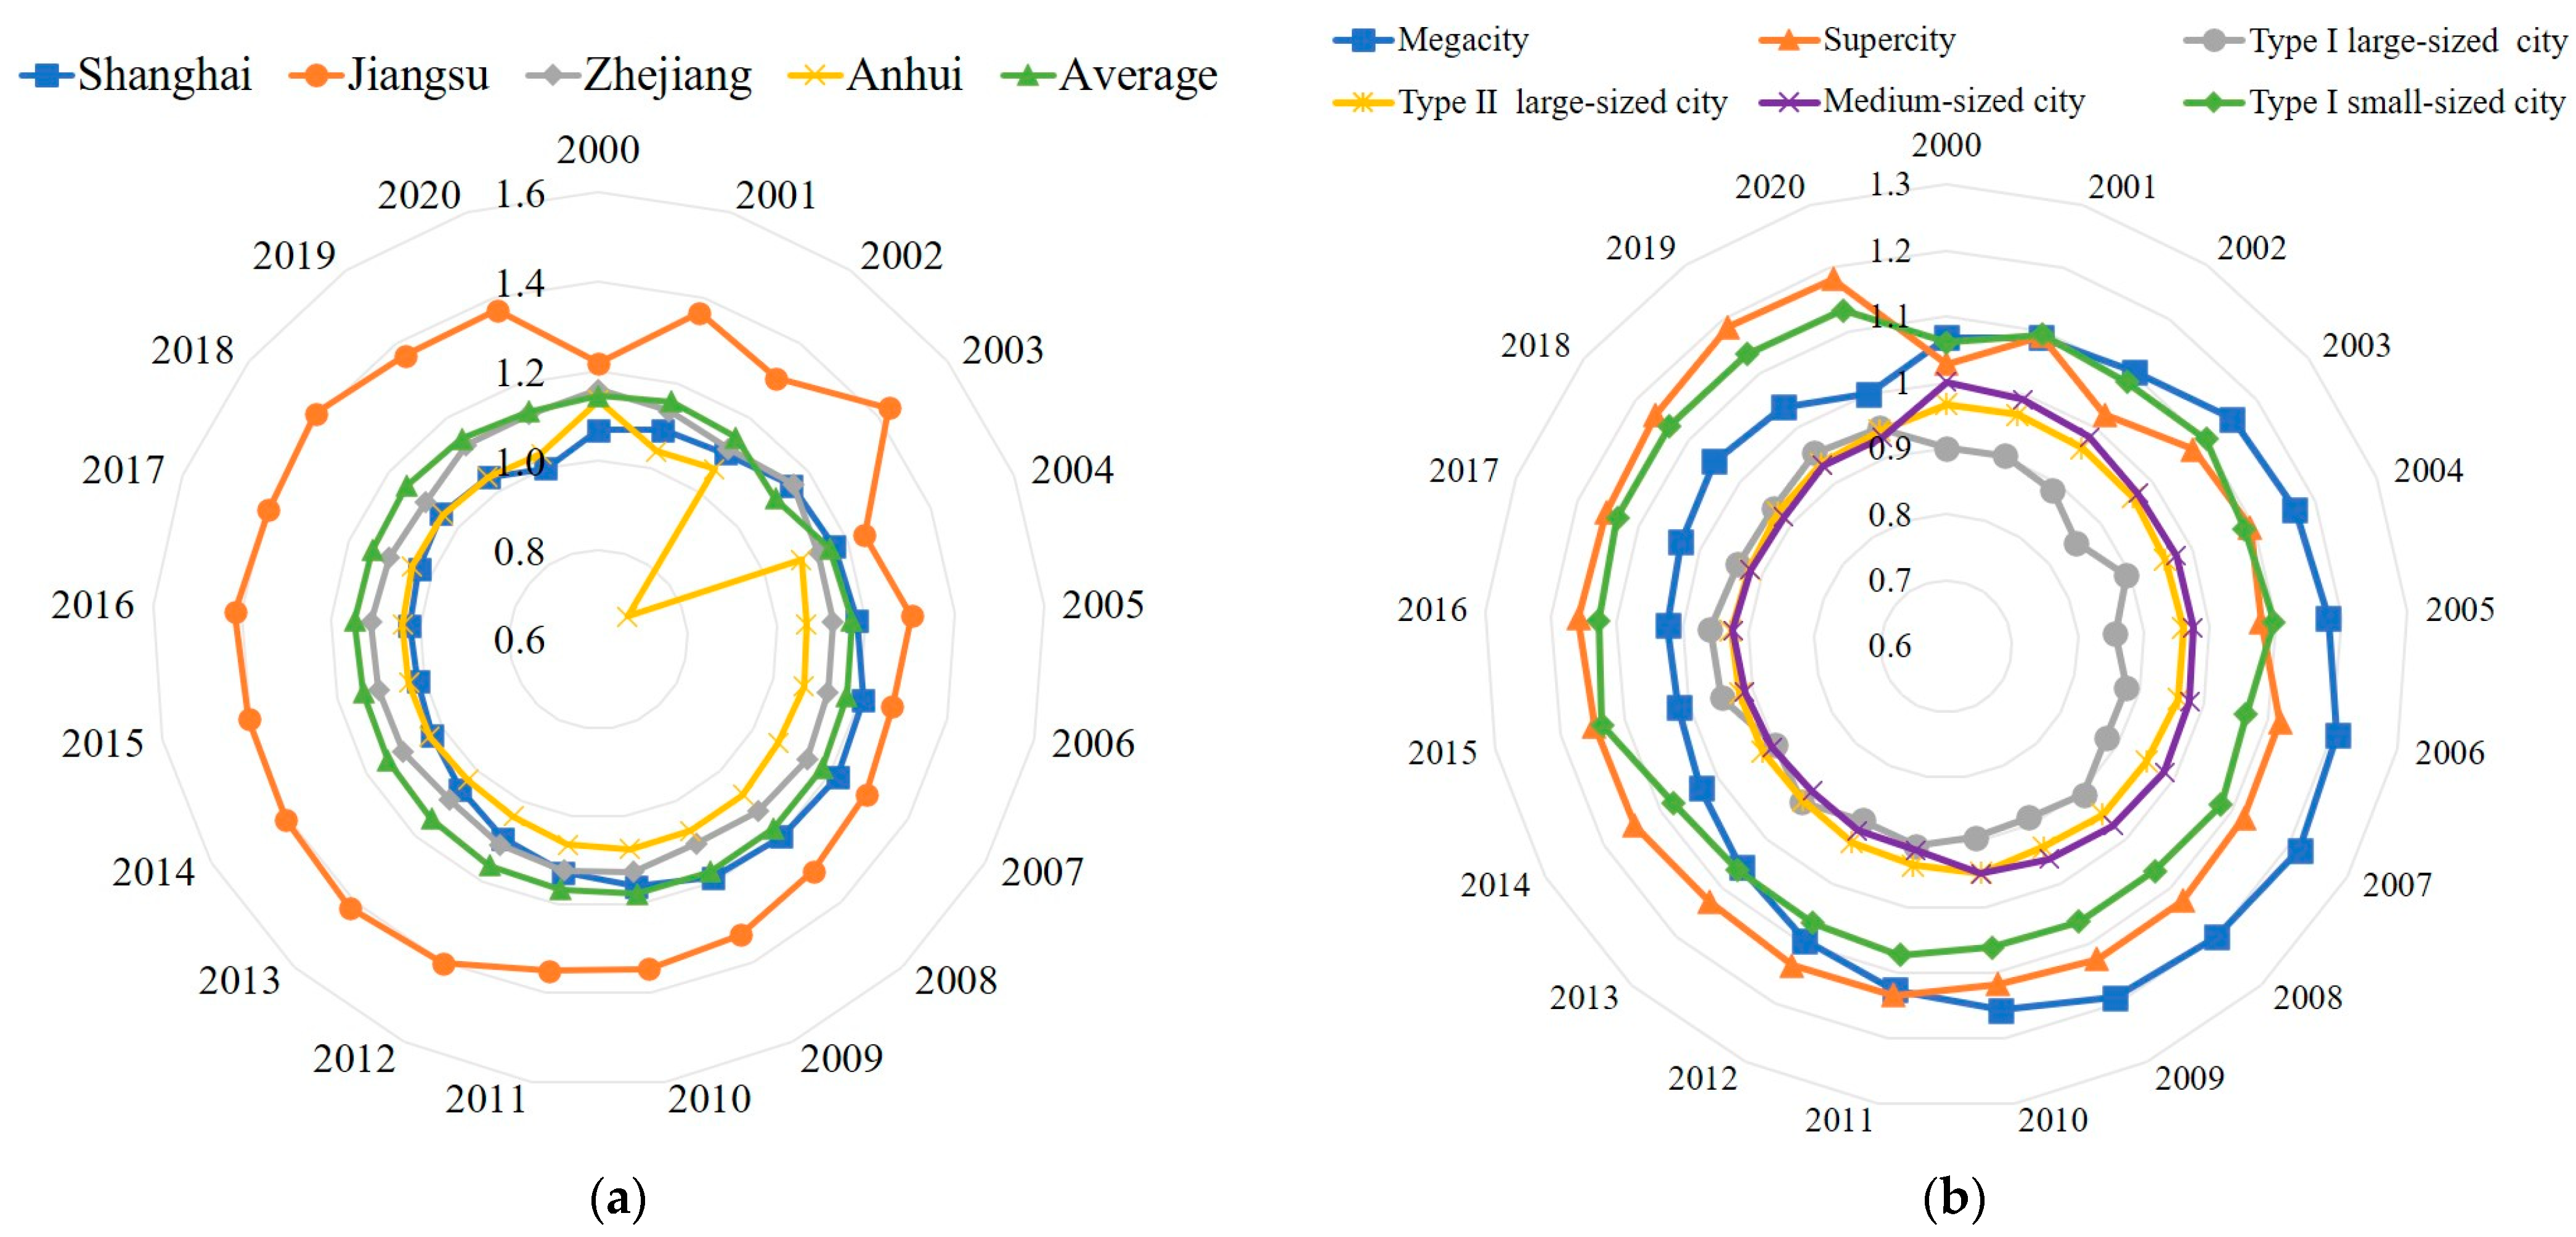
3.1. Temporal Variation Characteristics of the Eco-Efficiency of Cultivated Land Use

Based on the results of ECLU evaluation, this study plotted time series changes in 41 cities from 2000 to 2020 (Figure 3a). The results show that the ECLU in the YRD region is generally at a high level, with the total mean value fluctuating between 0.942 and 0.994; the overall fluctuation amplitude is small. The ECLU in Jiangsu is larger than the average of other regions in the YRD and shows a growing tendency in general. From 2000 to 2004, the fluctuation of the time series change trend was the most drastic in Jiangsu province, which was closely connected with the structural turn-up of primary industry and a shrinkage of grain-producing areas and total output caused by natural disasters. From 2000 to 2020, the overall efficiency of Shanghai showed a tendency that was “increased firstly and then decreased”, mainly because Shanghai was in a period of optimization and agricultural structure adjustment before 2007. Its degree of agricultural modernization led to improvement in the ECLU. After 2007, due to the high-speed development of non-primary industries, the crop area in Shanghai declined year by year, resulting in a decrease in the ECLU. The overall change in the ECLU in Zhejiang is relatively small. In Anhui, the ECLU showed a sudden drop in 2003 and then rose to the original level, mainly due to large floods that led to a substantial reduction in regional grain production. In summary, there are large differences in the time variation characteristics of ECLU among the provinces in the YRD region, with Jiangsu province having the highest and growing ECLU values, while Shanghai and Anhui have a decreasing trend and Zhejiang’s ECLU remains stable over the study period.
Grouped by city size, this study further plotted the time series changes in ECLU in cities of different sizes in the YRD region from 2000 to 2020 (Figure 3b). In Figure 3b, it can be seen that with 2011 as the boundary, the ECLU varies among cities of different sizes. Among them, during the period of 2000–2011, the ECLU in cities of different sizes in the YRD region is ranked as follows: megacity > supercity > type I small-sized city > medium-sized city > type II large-sized city > type I large-sized city. During the period of 2011–2020, the ECLU is ranked as follows: supercity > type I small-sized city > megacity > type I large-sized city > medium-sized city > type II large-sized city.
Specifically, Shanghai, as the only megacity in the YRD region, had the highest value of ECLU among the six types of cities from 2000 to 2011, and Shanghai’s efficiency peaked at 1.217 in 2007. During the study period, the ECLU of supercities such as Nanjing and Hangzhou showed a significant increase in fluctuation, which is closely related to the excellent natural endowment and developed economy of these areas. Suzhou, Wuxi, and other type I large-sized cities had the lowest mean eco-efficiency values, mainly because these cities are mostly high-tech developed cities with relatively weak primary industries, which results in low cultivated land use outputs such as agricultural output value and grain production compared with other regions. The ECLU in Xuzhou, Shaoxing, and other type II large-sized cities and in Taizhou, Zhoushan, and other medium-sized cities showed a fluctuating downward trend as a whole. These cities are rich in arable land resources and are important food-producing areas in the YRD region, but at the same time, the regional cultivated land carbon emissions are also larger, which results in the efficiency values being low. In 2014–2016, the ECLU in type I small-sized cities, such as Lishui, Chuzhou, and others, showed an obvious growth trend, which was due to the increase in farmland utilization inputs such as effective irrigation and increased mechanical power in type I small-sized cities during this period, which in turn improved the regional ECLU. Overall, the temporal variations in ECLU in cities of different sizes are characterized by the fact that ECLU in supercities, type I large-sized cities, and type I small-sized cities shows an increasing trend during the study period, while the ECLU values of megacities, type II large-sized cities, and medium-sized cities show a decreasing trend.

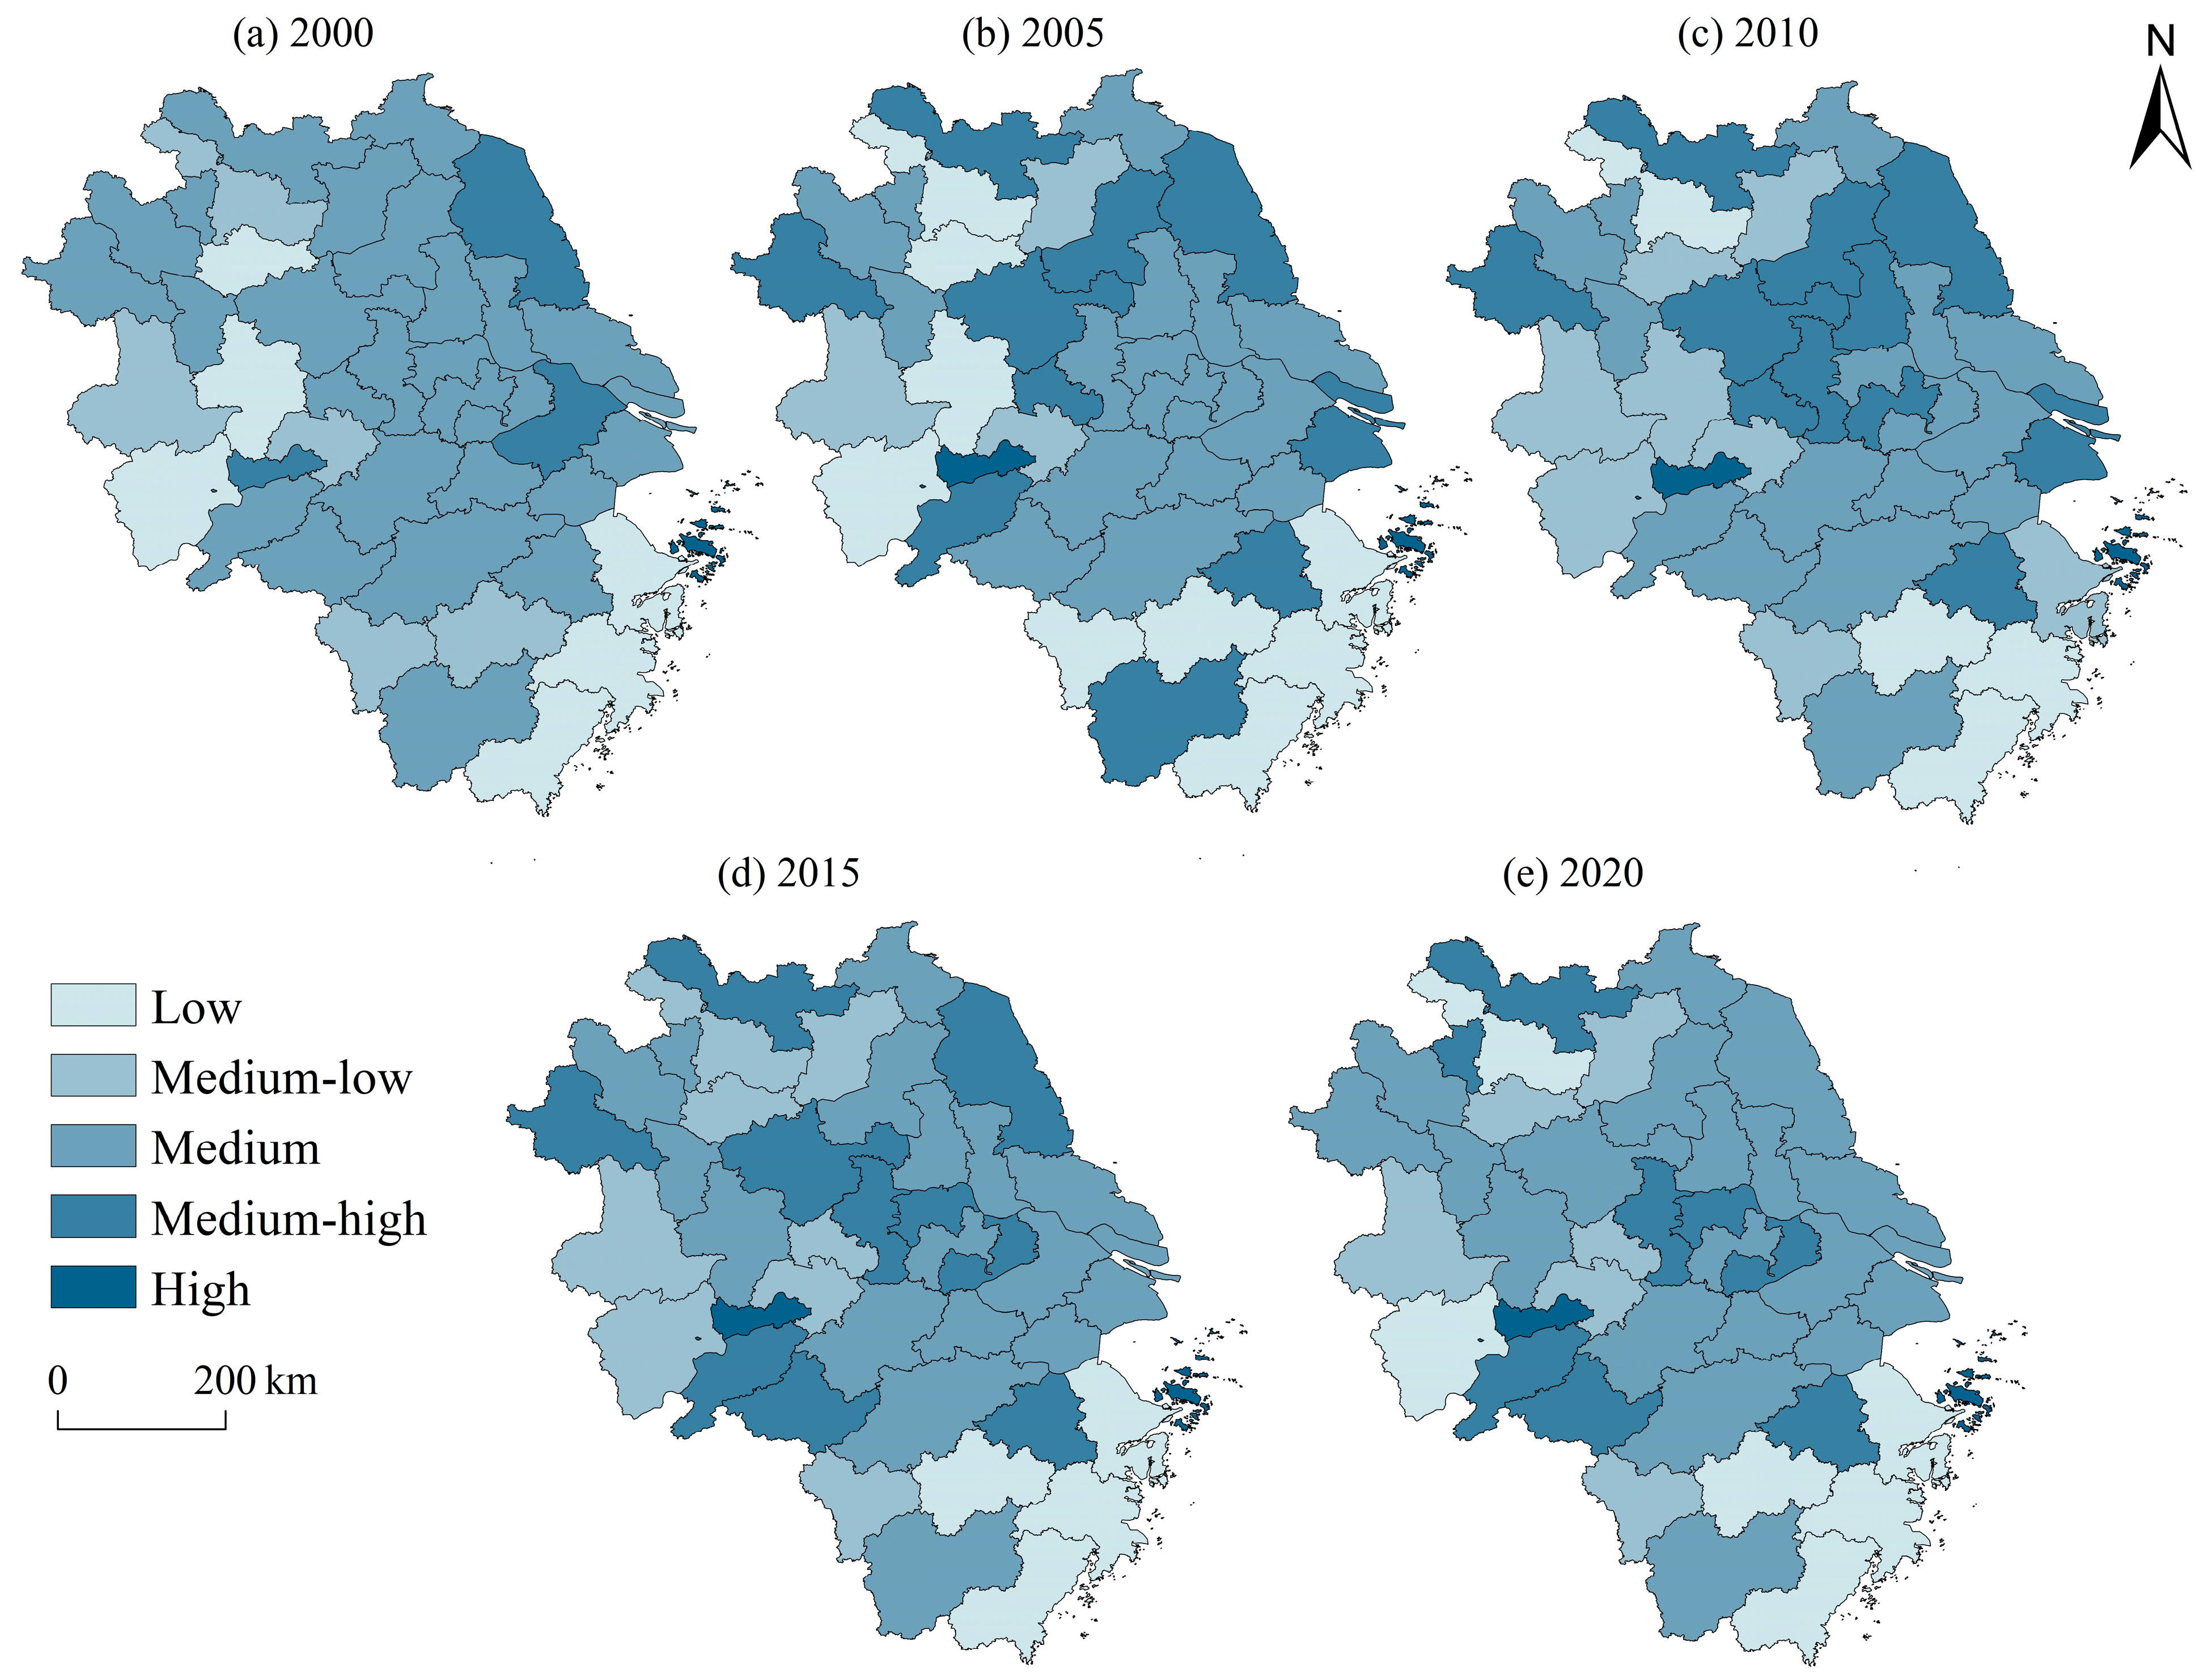
3.2. Spatial Variation Characteristics of the Eco-Efficiency of Cultivated Land Use

This study utilized panel data on the ECLU in 41 cities of the YRD region from 2000 to 2020. In order to avoid redundant analysis, cross-sectional data from 2000, 2005, 2010, 2015, and 2020 were selected. Using the natural breakpoint method, the YRD region was divided into five categories: high-, medium–high-, medium-, medium–low-, and low-efficiency areas. A spatial distribution map of the ECLU in the YRD region was drawn (Figure 4). From a spatial perspective, there are spatial distribution differences in the ECLU in the YRD region from 2000 to 2020, showing a pattern of high and low efficiency with multiple cores and a concentrated distribution. High-value areas are always located in Tongling city, Anhui province and Zhoushan city, Zhejiang province; data and distribution in higher-value areas show significant changes, but mainly radiate outward from the central region of Jiangsu Province as the core. The medium-efficiency zone is distributed in patches at the junction of three provinces and one city, and frequently transitions between higher- and lower-value zones. The low- and medium–low-efficiency areas are relatively stable, mainly in southeast Zhejiang and southwest Anhui. However, there are also small clusters in the northern Anhui region, with Suqian city as the core.
This study divided the spatial distribution pattern into four tiers of hot spot, sub-hot spot, sub-cold spot, and cold spot zones based on the z-score using the hot spot analysis tool on the ArcGIS platform to show the spatial distribution pattern of ECLU in the YRD region (Figure 5). The results show that the distribution of ECLU in the YRD region is “hot in the east and the north, cold in the west and the south”. Specifically, from 2000 to 2020, the ECLU hot spot in the YRD region was stably distributed in Zhoushan city, and the central part of Jiangsu province was transformed from a sub-hot spot to a hot spot during the period of 2010–2020. Shanghai and Jiangsu were the main sub-hot spots and showed a tendency to expand to southeastern Anhui and northern Zhejiang. In 2000–2020, the spatial distribution of transition zones of ECLU in the YRD region changed greatly, from a pattern of patchy distribution in the northwestern and southern parts of Anhui and the northwestern part of Zhejiang during 2000–2010 to a pattern of decentralized distribution of multiple cores around hot spot zones. High values and hot spots of ECLU in the YRD region were mainly concentrated in Shanghai and central Jiangsu, while low values and cold spots were distributed in Anhui province and southern Zhejiang province during the study period.

3.3. Regional Differences in Eco-Efficiency of Cultivated Land Use

To look at regional differences in ECLU in the YRD, this investigation evaluated and analyzed the ECLU Gini coefficient. The findings demonstrate that the spatial non-uniformity of ECLU in the YRD region rose annually, with the Gini coefficient of ECLU in the region generally displaying a fluctuating and slowly increasing trend (Figure 6).
From the point of view of the intra-regional Gini coefficient (Figure 6a), the Gini coefficient of Zhejiang province is the largest in 2000–2020, indicating that regional imbalance is the largest within Zhejiang. This is followed by Anhui, with an average value of 0.161 during the study period. And the Gini coefficient of Jiangsu is the lowest, indicating that eco-efficiency in Jiangsu shows a regionally balanced distribution pattern. Gini coefficients within the regions of Jiangsu, Zhejiang, and Anhui all showed fluctuating upward trends, indicating that regional differences within each of these regions gradually increased from 2000 to 2020. However, the degree of fluctuation and the magnitude of increase in the Gini coefficient within each region varies. Among them, the intra-regional value of Zhejiang fluctuates in the range of 0.203~0.276, which is the largest increase, indicating that regional ECLU disparities in Zhejiang are the highest and are increasing. The intra-regional Gini coefficients of Jiangsu and Anhui have a smaller degree of change, indicating that the regional distribution of the ECLU is well balanced.
In terms of inter-regional Gini coefficients (Figure 6b), the value of ECLU between Zhejiang and Anhui was the highest during the study period, remaining above 0.179 overall and reaching a maximum of 0.238, which indicates that the degree of regional imbalance in ECLU between Zhejiang and Anhui was the greatest. The degrees of regional imbalance between Shanghai and Zhejiang and Jiangsu and Zhejiang are also large; these inter-regional Gini coefficients remain above 0.143. The Gini coefficients between Shanghai city and Anhui and between Jiangsu and Anhui fluctuate in the range of 0.101~0.145. The Gini coefficient of ECLU between Shanghai and Jiangsu fluctuates in the range of 0.029~0.073, and the regional distribution between these two regions is generally more balanced. From the trend of inter-regional Gini coefficient changes, the values between the different provinces and municipalities showed a fluctuating upward tendency, indicating that the regional dissimilarities in ECLU among the different geographical areas in the YRD region gradually increased. Among them, the regional difference in ECLU between Shanghai and Jiangsu increased the most, with the inter-regional Gini coefficient increasing by 54.6% from 2000 to 2020, while the regional variation in ECLU between Jiangsu and Anhui changed to a lesser extent, with the inter-regional Gini coefficient increasing by only 9.4% during the study period. Overall, the Gini coefficient within Jiangsu region is the smallest, indicating the smallest difference in ECLU within the region, followed by Anhui and Zhejiang. The Gini coefficient between Jiangsu and Shanghai is the smallest, indicating that the efficiency difference between these two regions is relatively small, while the differences between the other regions are large.
The sources of regional distribution differences are hypervariable density and intra-regional and inter-regional differences (Table 4). Among the above sources, differences in hypervariable density are the most important spatial source of regional disparities in ECLU in the YRD region, and their contribution rate was more than 41.3%. Hypervariable density is the main source of regional disparities, which indicates that the crossing overlap problem of different regions has the strongest influence on ECLU. Conversely, the percentages of intra- and inter-regional variances vary between 28.5–29.8% and 22.5–29.7%, respectively, which is much lower than the contribution rates of hypervariable density disparity. Nonetheless, the inter-regional disparity component demonstrated an upward trend between 2000 and 2020, suggesting that disparities in ECLU among different provinces and cities expanded and their influence on regional differences in ECLU increased.

3.4. Influencing Factors of the Eco-Efficiency of Cultivated Land Use

This study conducts regression test on the factors influencing ECLU in the YRD region according to Equation (11). Firstly, the likelihood ratio (LR) test is conducted, and the results show that the original hypothesis is rejected, indicating the existence of individual effects, so this paper adopts the tobit model to explain the influencing factors of ECLU in the YRD region (Table 5). As shown in Table 4, the factors that pass the 1% significance test are as follows: urban population proportion, per capita GDP, rainfall, agricultural intensity level, and agricultural industrial structure. The influencing factor that passes the 5% significance test is agricultural GDP. This indicates that the above factors, such as urban population proportion, will have a significant impact on regional ECLU. Among them, the proportion of urban population, GDP per capita, and the share of GDP from agriculture have a noteworthy favorable impact on ECLU in the YRD, while rainfall, agricultural intensity level, and agricultural industrial structure have a significant negative effect on the ECLU.
The proportion of urban population, per capita GDP, and agricultural GDP are significantly and positively correlated with the ECLU, indicating that the larger the proportion of urban population, the higher the GDP, and the higher the agricultural GDP in the region, the greater the ECLU value will be. In terms of natural environmental factors, rainfall has a massive negative influence on the ECLU in the YRD. Rainfall is significantly negatively correlated with the ECLU at the 1% statistical level, indicating that an increase in rainfall has an obvious inhibitory effect on the ECLU, but the extent of this effect is very small. Among agricultural development factors, the level of agricultural intensity and the structure of agricultural industry had a significant negative effect, and the structure of agricultural industry had the strongest effect on the ECLU. This result is related to the economic structure and agricultural development mode of the YRD. Fishery, as the primary industry in the YRD region, accounts for a higher proportion of the region’s industrial structure than in other regions, which has a negative effect on the growth of agricultural output values and products, thus further affecting the ECLU. The level of agricultural intensity is weakly negatively correlated with the ECLU, which indicates that the per capita operating area in the YRD region is too large, and also indicates that the number of rural laborers is small, resulting in a reduction in ECLU in the region. In conclusion, it is evident that the degree of urbanization and per capita GDP positively affect the ECLU of the research region, whereas the degree of industrial structure and agricultural intensity level negatively affect the ECLU’s improvement in the YRD region, which is consistent with earlier research.

4. Discussion

4.1. Insights into the Spatial–Temporal Characteristics and Influencing Factors of the Eco-Efficiency of Cultivated Land Use

From 2000 to 2020, in terms of changes over time, the ECLU showed a slight improvement. Therefore, the YRD region should adopt appropriate agricultural policies in regions with diverse environmental factors and economic foundations so as to improve farmers’ incentives to grow food, enhance the use of regional cultivated land in combination with ecological construction, and facilitate greener agricultural practices. From the perspective of spatial evolution patterns, there are significant differences in the spatial distribution of ECLU, so it is necessary to explore the regional differentiation path of ECLU and fully leverage the leading role and spillover effects of the hot spot cluster in central Jiangsu, thereby driving improvements in ECLU in the surrounding provinces. At the same time, it is necessary to actively explore the cold spots in agglomerations in Zhejiang and Anhui and explore sustainable agricultural development models with low inputs, high yields, and low emissions. Regional differences in ECLU in the YRD region generally showed a gradually increasing tendency. This non-equilibrium pattern reflects the differences in resource allocation and input/output in the utilization and protection of cropland. To promote and coordinate the regional development of the ECLU, different regions should strengthen resource and agricultural production technology sharing, strengthen cooperation and development between adjacent cities, and narrow regional development differences. This will help to achieve the goal of “bringing the best to the worst”, thus promoting improvements in ECLU in the YRD region as a whole.
This paper also examined what factors may influence the ECLU in the YRD region. Regarding socio-economic factors, the model results show that the proportion of urban population, per capita GDP, and the proportion of agricultural GDP had an obvious positive influence on the ECLU in the YRD. Objective differences in resource endowment, economic development, agricultural production conditions, and other factors in the YRD region led to spatial differentiation in ECLU. Therefore, the YRD region should accelerate the integration of primary, secondary, and tertiary industries, increase investment in agriculture, and enhance agricultural GDP output. At the same time, policymakers should adjust and optimize the layout of cultivated land use, optimize the structure of agricultural production, and promote the construction of regional infrastructure such as agricultural machinery roads, irrigation, etc., as well as synchronize the promotion of low-carbon farming techniques and promote the application of new fertilizers, new technologies, and the use of organic fertilizer resources so as to limit the level of the YRD region’s agricultural intensity, better improve the quality of arable land in the region, and promote the efficient and green use of farmland resources.

4.2. Implications for Improving Eco-Efficiency of Cultivated Land Use in YRD

To improve the eco-efficiency of cultivated land use in the YRD region, the results of our study suggest the following strategies: optimizing inputs for crop production and controlling undesired outputs from arable land; strengthening the level of agricultural inputs; building a diversified, systematic, and structured agricultural input system, especially by increasing agricultural efforts and technical improvements in areas with low ECLU; increasing the motivation of farmers to pursue agricultural work; and encouraging laborers to return to their hometowns to undertake agricultural production. The construction of supporting infrastructure for agricultural production should be strengthened, and new agricultural production technologies such as irrigation, ploughing, and fertilization should be promoted [51]. The transformation of medium- and low-yield fields will provide strong support for improving the ECLU and raise the desired output level of cropland. Meanwhile, a reasonable carbon emission measurement system should be established, and in order to encourage the low-carbon use of farmland, an active and efficient carbon emission monitoring institution should be established to lessen the misuse and waste of agricultural films, pesticides, and other substances in the use of farmland [52].
In addition, we promote the establishment of ecological farmland communities with the goal of sustainable development. The spatiotemporal patterns of ECLU in the YRD region were influenced by multiple factors, which is also a reflection of the regional socio-economic development laws. The pursuit of coordinated and sustainable development in terms of the agricultural sector of the economy and ecological use of cropland must not only be given full consideration to significantly improve food security in China, but must also follow the principles of economic and social development and take the road of ecological civilization construction [53]. Each region of the YRD should develop its own ecological development paths for arable land according to the local conditions, regional economic development, and natural endowments. Meanwhile, regions with high ECLU should play a driving role, make use of the spillover effect, and drive the neighboring regions to improve the ECLU together, so as to establish effective cooperation combining the use of farmland and ecology [54].
Further recommendations for policymakers are as follows: coordinate the allocation of farmland resources and optimize the structure of primary industry; strengthen the construction of farmland production infrastructure; intensify farmland water conservation; encourage disaster prevention by constructing disaster reduction facilities [55]; reasonably determine the input levels of production, capital, and labor for the use of cropland and to reduce agricultural production costs; strictly control farmland areas and optimize the structure of cropland utilization; change the traditional, rough farming methods; promote the process of agricultural modernization; improve the quality of cropland; carry out scientific management and large-scale operations; and improve the agro-ecological environment. Relevant departments should enhance the intensity of agricultural land use and the industrialization of agricultural operation, further promote the flow of agricultural land, strengthen the transfer of surplus rural labor, and improve the production mechanism, market system, and quality standard system of agricultural products so as to improve the ECLU of the region and ensure the quality and safety of regional food production.
The YRD is the region with the most complete modern agricultural industry system, the strongest modern agricultural innovation ability, and the richest rural business formats in China. It is also one of the regions where rural development is most restricted by factors such as land and environmental resources, and the distribution of resources is very uneven. If the integrated development pattern of rural revitalization can be formed as soon as possible, it will undoubtedly achieve the synergistic development effect of rural revitalization in the YRD, improve the efficiency of regional integration development, and provide momentum for the high-quality implementation of national strategies, thus making greater contributions to the comprehensive construction of a new pattern of integrated development of rural revitalization. The policy recommendations for sustainable agricultural development in the YRD based on ECLU measurements and analyses are also applicable to several other economically developed regions in China, such as the Beijing–Tianjin–Hebei urban agglomeration (BTHA) and the Pearl River Delta (PRD).

4.3. Limitations and Future Prospects

Based on earlier studies, this work investigates the spatiotemporal variation characteristics of the ECLU and its influencing factors. However, as this paper is still only a preliminary study on the ECLU, it is unavoidable that there are certain shortcomings. Firstly, the ECLU indexes in this paper follow those used in previous studies, and since data acquisition is difficult, this paper fails to further consider the process of carbon sequestration of arable land use and fails to further take into account the impact of solid waste and organic fertilizer application on the ecological environment of arable land. Secondly, this paper only investigates the spatial and temporal patterns and regional imbalances in ECLU but does not explore the degree of coupling or the relationship between the two. Thirdly, the study of influencing factors conducted in this paper is only on panel data which are not linked to the spatial–temporal differentiation discussed in the previous section and are not analyzed using methods such as spatial econometric modeling.
Further research should therefore focus on the following: first, the characterization of the amount of non-desired outputs of arable land use systems in terms of net carbon emissions and source pollution, including cultivated land solid waste and organic fertilizers. Second, exploring the relationship and implications between changes in the spatial and temporal variability in ECLU and regional distributional imbalances. Third, investigating the influencing factors of regional ECLU by using spatial measurement models such as spatial lag models. These will be the focus of further in-depth research on the ecological efficiency of cropland use in the future.

5. Conclusions

With the continuous promotion of agricultural modernization and ecological civilization construction, achieving the sustainable development of agriculture through carbon reduction has become an inevitable choice. However, research on the correlation between farmland utilization efficiency and ecology is limited. This study selects 41 cities in the YRD region with high economic levels and excellent natural conditions as the research objects, integrates ecological connotations into the ECLU, constructs an evaluation index system for ECLU, scientifically evaluates the ECLU in the YRD region from 2000 to 2020, and further explores the spatiotemporal evolution characteristics and influencing factors of regional ECLU. The research results indicate the following: The ECLU is generally at a high level and is characterized by spatial clustering, with hot spots distributed in the eastern and northern parts. The regional imbalance in ECLU distribution is also gradually increasing. Economic factors such as urban population proportion and per capita GDP stimulate improvement in ECLU in the YRD region, while the agricultural industrial structure and intensity level play a role in inhibiting development.

Author Contributions

Conceptualization, Y.F., L.W. and X.L.; methodology, L.L., Y.L. and J.W.; software, W.N.; validation, W.N.; formal analysis, W.N.; investigation, W.N.; resources, Y.F. and W.N.; data curation, W.N.; writing—original draft preparation, W.N.; writing—review and editing, Y.F.; visualization, W.N.; supervision, Y.F., Y.L. and L.L.; project administration, Y.F. and X.L.; funding acquisition, Y.F., L.L., Y.L. and J.W. All authors have read and agreed to the published version of the manuscript.

Funding

This research was funded by the National Natural Science Foundation of China (Grant Nos. 42001225, 42101252, 42271271, 42201317, 42201282), Foundation of the Key Laboratory of Carbon Neutrality and Territory Optimization, Ministry of Natural Resources (No. CNTO-KFJJ-202305).

Data Availability Statement

Data is contained within the article.

Conflicts of Interest

The authors declare no conflicts of interest.

References

  1. Kong, X. Problems, Causes and Countermeasures of “non-food” cultivated land. China Land 2020, 11, 17–19. [Google Scholar]
  2. Liu, X.; Xin, L. Assessment of the Efficiency of Cultivated Land Occupied by Urban and Rural Construction Land in China from 1990 to 2020. Land 2022, 11, 941. [Google Scholar] [CrossRef]
  3. Deng, X.; Huang, J.; Rozelle, S.; Zhang, J.; Li, Z. Impact of urbanization on cultivated land changes in China. Land Use Policy 2015, 45, 1–7. [Google Scholar] [CrossRef]
  4. Jiang, L.; Guo, S.; Wang, G.; Kan, S.; Jiang, H. Changes in agricultural land requirements for food provision in China 2003–2011, A comparison between urban and rural residents. Sci. Total Environ. 2020, 725, 138293–138310. [Google Scholar] [CrossRef] [PubMed]
  5. Li, Q.; Gao, W.; Wei, J.; Jiang, Z.; Zhang, Y. Spatial and temporal evolution of net carbon sinks from cropland utilization and comprehensive zoning in China. J. Agric. Eng. 2022, 38, 239–249. [Google Scholar]
  6. Xie, H.; Zhang, Y.; Choi, Y. Measuring the Cultivated Land Use Efficiency of the Main Grain-Producing Areas in China under the Constraints of Carbon Emissions and Agricultural Nonpoint Source Pollution. Sustainbility 2018, 10, 1932. [Google Scholar] [CrossRef]
  7. Barbosa, J.A.; Braganca, L.; Mateus, R. Assessment of land use efficiency using BSA tools, Development of a new index. J. Urban Plan. Dev. 2015, 141, 04014020–04014037. [Google Scholar] [CrossRef]
  8. Yin, R.; Wang, Z.; Xu, F. Multi-scenario simulation of China’s dynamic relationship between water-land resources allocation and cultivated land use based on shared socioeconomic pathways. J. Environ. Manag. 2023, 341, 118062–118063. [Google Scholar] [CrossRef]
  9. Song, G.; Ren, G. Spatial response of cultivated land use efficiency to the maize structural adjustment policy in the “Sickle Bend” region of China: An empirical study from the cold area of northeast. Land Use Policy 2022, 9, 106421–106433. [Google Scholar] [CrossRef]
  10. Guo, B.; Chen, K.; Jin, G. Does multi-goal policy affect agricultural land efficiency? A quasi-natural experiment based on the natural resource conservation and intensification pilot scheme. Appl. Geogr. 2023, 163, 103141–103153. [Google Scholar] [CrossRef]
  11. Zhou, X.; Wu, D.; Li, J.; Liang, J.; Zhang, D.; Chen, W. Cultivated land use efficiency and its driving factors in the Yellow River Basin, China. Ecol. Indic. 2022, 144, 109411–109424. [Google Scholar] [CrossRef]
  12. Kuang, B.; Lu, X.; Zhou, M.; Chen, D. Provincial cultivated land use efficiency in China: Empirical analysis based on the SBM-DEA model with carbon emissions considered. Technol. Forecast. Soc. Change 2020, 151, 119874–119884. [Google Scholar]
  13. Haibin, H.; Xiaoyu, Z. Static and dynamic cultivated land use efficiency in China: A minimum distance to strong efficient frontier approach. J. Clean. Prod. 2020, 246, 119002–119017. [Google Scholar]
  14. Wang, J.; Su, D.; Wu, Q.; Li, G.; Cao, Y. Study on eco-efficiency of cultivated land utilization based on the improvement of ecosystem services and emergy analysis. Sci. Total Environ. 2023, 882, 163489–163498. [Google Scholar] [CrossRef]
  15. Guo, B.; He, D.; Jin, G. Agricultural production efficiency estimation and spatiotemporal convergence characteristic analysis in the Yangtze River Economic Belt: A semi-parametric metafrontier approach. Land Degrad. Dev. 2023, 34, 4635–4648. [Google Scholar] [CrossRef]
  16. Chen, Y.; Li, S.; Cheng, L. Evaluation of cultivated land use efficiency with environmental constraints in the Dongting lake eco-economic zone of Hunan, China. Land 2020, 9, 440. [Google Scholar] [CrossRef]
  17. Yang, B.; Wang, Z.; Zou, L.; Zou, L.; Zhang, H. Exploring the eco-efficiency of cultivated land utilization and its influencing factors in China’s Yangtze River Economic Belt, 2001–2018. J. Environ. Manag. 2021, 294, 112939–112952. [Google Scholar] [CrossRef] [PubMed]
  18. Hou, X.; Liu, J.; Zhang, D.; Zhao, M.; Xia, C. Impact of urbanization on the eco-efficiency of cultivated land utilization, A case study on the Yangtze River Economic Belt, China. J. Clean. Prod. 2019, 238, 117916–117925. [Google Scholar] [CrossRef]
  19. Ferreira, M.D.P.; Féres, J.G. Farm size and Land use efficiency in the Brazilian Amazon. Land Use Policy 2020, 99, 104901–104911. [Google Scholar] [CrossRef]
  20. Nkwasa, A.; Chawanda, C.J.; Msigwa, A.; Komakech, H.C.; Verbeiren, B.; van Griensven, A. How can we represent seasonal land use dynamics in SWAT and SWAT+ models for African cultivated catchments. Water 2020, 12, 1541. [Google Scholar] [CrossRef]
  21. Chen, Q.; Xie, H. Temporal-spatial differentiation and optimization analysis of cultivated land green utilization efficiency in China. Land 2019, 8, 158. [Google Scholar] [CrossRef]
  22. Luo, X.; Ao, X.; Zhang, Z.; Wan, Q.; Liu, X. Spatiotemporal variations of cultivated land use efficiency in the Yangtze River Economic Belt based on carbon emission constraints. J. Geogr. Sci. 2020, 30, 535–552. [Google Scholar] [CrossRef]
  23. Shi, Y.; Duan, W.; Fleskens, L.; Li, M.; Hao, J. Study on evaluation of regional cultivated land quality based on resource-asset-capital attributes and its spatial mechanism. Appl. Geogr. 2020, 125, 102284–102297. [Google Scholar] [CrossRef]
  24. Lu, X.; Qu, Y.; Sun, P.; Yu, W.; Peng, W. Green transition of cultivated land use in the Yellow River Basin, A perspective of green utilization efficiency evaluation. Land 2020, 9, 475. [Google Scholar] [CrossRef]
  25. Chen, W.; He, R.; Wu, Q. A novel efficiency measure model for industrial land use based on subvector data envelope analysis and spatial analysis method. Complexity 2017, 2017, 9516267. [Google Scholar] [CrossRef]
  26. Herzig, A.; Thanh Nguyen, T.; Ausseil, A.E.; Maharjan, G.R.; Dymond, J.R.; Arnhold, S.; Koellner, T.; Rutledge, D.; Tenhunen, J. Assessing resource-use efficiency of land use. Environ. Model. Softw. 2018, 107, 34–49. [Google Scholar] [CrossRef]
  27. Maxime, D.; Marcotte, M.; Arcand, Y. Development of eco-efficiency indicators for the Canadian food and beverage industry. J. Clean. Prod. 2006, 14, 636–648. [Google Scholar] [CrossRef]
  28. Han, H.; Zhang, X. Exploring environmental efficiency and total factor productivity of cultivated land use in China. Sci. Total Environ. 2020, 726, 138434–138449. [Google Scholar] [CrossRef]
  29. Pang, Y.; Wang, X. Land-Use Efficiency in Shandong (China), Empirical Analysis Based on a Super-SBM Model. Sustainbility 2020, 12, 10618. [Google Scholar] [CrossRef]
  30. Deng, X.; Gibson, J. Sustainable land use management for improving land eco-efficiency, A case study of Hebei, China. Ann. Oper. Res. 2020, 290, 265–277. [Google Scholar] [CrossRef]
  31. Chen, J.; Cheng, S.; Song, M. Estimating policy pressure for China’s cultivated land use protection based on an extended index. Phys. Chem. Earth Parts A/B/C 2017, 101, 21–34. [Google Scholar] [CrossRef]
  32. Peng, J.; Wen, L.; Fu, L.; Yi, M. Total factor productivity of cultivated land use in China under environmental constraints, temporal and spatial variations and their influencing factors. Environ. Sci. Pollut. Res. 2020, 27, 18443–18462. [Google Scholar] [CrossRef] [PubMed]
  33. Schaltegger, S.; Sturm, A. Ökologische Rationalität: Ansatzpunkte zur Ausgestaltung von ökologieorientierten Managementinstrumenten. Unternehmung 1990, 44, 273–290. [Google Scholar]
  34. Masini, E.; Tomao, A.; Barbati, A.; Corona, P.; Serra, P.; Salvati, L. Urban growth, land-use efficiency and local socioeconomic context, A comparative analysis of 417 metropolitan regions in Europe. Environ. Manag. 2019, 63, 322–337. [Google Scholar] [CrossRef] [PubMed]
  35. Yin, Y.; Hou, X.; Liu, J.; Zhou, X.; Zhang, D. Detection and attribution of changes in cultivated land use ecological efficiency, A case study on Yangtze River Economic Belt, China. Ecol. Indic. 2022, 137, 108753. [Google Scholar] [CrossRef]
  36. The State Council of the People’s Republic of China. The CPC Central Committee and the State Council Print and Issue the Outline Development Plan for Regional Integration of the Yangtze River Delta. In Bulletin of the State Council of the People’s Republic of China; The State Council of the People’s Republic of China: Beijing, China, 2019; pp. 10–34. [Google Scholar]
  37. Bo, L.; Junbiao, Z.; Haipeng, L. Spatial and temporal characteristics of agricultural carbon emissions in China and decomposition of influencing factors. Chin. J. Popul. Resour. Environ. 2011, 21, 80–86. [Google Scholar]
  38. Du, J.; Liang, L.; Zhu, J. A slacks-based measure of super-efficiency in data envelopment analysis: A comment. Eur. J. Oper. Res. 2010, 204, 694–697. [Google Scholar] [CrossRef]
  39. Wei, Q. Data Envelopment Analysis (DEA). Chin. Sci. Bull. 2000, 17, 1793–1808. [Google Scholar]
  40. Majumdar, D.D.; Biswas, A. Quantifying land surface temperature change from LISA clusters: An alternative approach to identifying urban land use transformation. Landsc. Urban Plan. 2016, 153, 51–65. [Google Scholar] [CrossRef]
  41. Dagum, C. A new approach to the decomposition of the Gini income inequality ratio. Empir. Econ. 1997, 22, 515–531. [Google Scholar] [CrossRef]
  42. Theil, H. Economics and Information Theory; North Holland Publishing Company: Amsterdam, The Netherlands, 1967; pp. 1–488. [Google Scholar]
  43. Anselin, L. Local indicators of spatial association-LISA. Geogr. Anal. 1995, 27, 93–115. [Google Scholar] [CrossRef]
  44. Li, W.; Wang, D.; Li, H.; Liu, S. Urbanization-induced site condition changes of peri-urban cultivated land in the black soil region of northeast China. Ecol. Indic. 2017, 80, 215–223. [Google Scholar] [CrossRef]
  45. Cui, X.; Wang, X. Urban land use change and its effect on social metabolism, An empirical study in Shanghai. Habitat Int. 2015, 49, 251–259. [Google Scholar] [CrossRef]
  46. Shu, X.; Feng, W.; Liao, F.; Ling, C. Study on the Spatiotemporal Evolution and Driving Factors of Agricultural Eco-efficiency of Urba Agglomeration in the Middle Reaches of the Yangtze River. J. Soil Water Conserv. 2022, 29, 394–403. [Google Scholar]
  47. Zhou, B.B.; Aggarwal, R.; Wu, J.; Lv, L. Urbanization-associated farmland loss: A macro-micro comparative study in China. Land Use Policy 2021, 101, 105228–105237. [Google Scholar] [CrossRef]
  48. Tobit, J. Estimation of Relationships for Limited Dependent Varia-bles. Econometrica 1958, 26, 24–36. [Google Scholar]
  49. Greene, W.H. On the Asymptotic Bias of the Ordinary Least Squares Estimator of the Tobit Model. Econometrica 1981, 49, 505–513. [Google Scholar] [CrossRef]
  50. Zhou, H.; Li, X. Tobit model estimation methods and applications. J. Econ. Perspect. 2012, 5, 105–119. [Google Scholar]
  51. Cao, W.; Zhou, W.; Wu, T.; Wang, X.; Xu, J. Spatial-temporal characteristics of cultivated land use eco-efficiency under carbon constraints and its relationship with landscape pattern dynamics. Ecol. Indic. 2022, 141, 109140–109155. [Google Scholar] [CrossRef]
  52. Luo, X.; Zhang, Z.; Lu, X.; Zhang, L. Topographic heterogeneity, rural labour transfer and cultivated land use, An empirical study of plain and low-hill areas in China. Pap. Reg. Sci. 2019, 98, 2157–2178. [Google Scholar] [CrossRef]
  53. Zitti, M.; Ferrara, C.; Perini, L.; Carlucci, M.; Salvati, L. Long-term urban growth and land use efficiency in Southern Europe, Implications for sustainable land management. Sustainability 2015, 7, 3359–3385. [Google Scholar] [CrossRef]
  54. Fan, Y.; Jin, X.; Gan, L.; Jessup, L.H.; Pijanowski, B.C.; Lin, J.; Yang, Q.; Lyu, L. Dynamics of spatial associations among multiple land use functions and their driving mechanisms: A case study of the Yangtze River Delta region, China. Environ. Impact Assess. Rev. 2022, 97, 106858–106872. [Google Scholar] [CrossRef]
  55. Fan, Y.; Gan, L.; Hong, C.; Jessup, L.H.; Jin, X.; Pijanowski, B.C.; Sun, Y.; Lv, L. Spatial identification and determinants of trade-offs among multiple land use functions in Jiangsu, China. Sci. Total Environ. 2021, 772, 145022–145036. [Google Scholar]
Figure 1. Location map of the Yangtze River Delta region.
Land 13 00219 g001
Figure 2. Research methodology framework diagram.
Land 13 00219 g002
Figure 3. Time series changes in ECLU in the YRD region: (a) classification by province; (b) classification by city size.
Land 13 00219 g003
Figure 4. Spatial distribution map of ECLU in the YRD region.
Land 13 00219 g004
Figure 5. Hot spot map of spatial distribution of ECLU in YRD region.
Land 13 00219 g005
Figure 6. Map of regional differences in ECLU in the YRD region: (a) characteristics of intra-regional variation; (b) characteristics of inter-regional variation.
Land 13 00219 g006
Table 1. Distribution of cities of different sizes in the YRD region.
City ScaleUrban Resident PopulationNumber of Cities of This Size in the YRD
Megacity>10 million1
Supercity5–10 million2
Type I large-sized city3–5 million5
Type II large-sized city1–3 million11
Medium-sized city500,000–1,000,0007
Type I small-sized city200,000–500,0005
Table 2. Index system for ECLU measurement in the YRD region.
NormVariantDescription of VariablesUnit (Of Measurement)
Input indexeslabor forceNumber of people working in agricultureman
cultivated landTotal area sown in cropshm2
irrigationEffective irrigated areahm2
agricultural machineryGross power of agricultural machinerykW
agricultural filmAgricultural plastic film usetons
agrochemicalsPesticide usetons
fertilizersAgricultural fertilizer application (pure)tons
Output indexesDesired outputsGross agricultural outputbillions
Grain productiontons
Non-desired outputsCarbon emissions from agriculturetons
Table 3. Index system of factors influencing ECLU in the YRD region.
FactorNormDescription of IndexesUnit (Of Measurement)
Socio-economic factorsUrbanization level
(X1)
Urban population/total population%
GDP per capita (X2)GDP/total populationCNY 10,000/person
Share of agricultural
output value (X3)
Agricultural output value/GDP%
Farmers’ disposable
income (X4)
Farmers’ disposable incomeCNY
Natural environmental factorsRainfall (X5)Average annual precipitationmillimeter
Agricultural development factorsAgricultural machinery density (X6)Gross agricultural machinery power/gross sown acreage of cropskw/hm2
Agricultural intensity level (X7)Farmland area/rural populationThousands of hm2/ten thousand people
Agricultural industrial structure (X8)Gross value of agricultural output/gross value of agricultural, forestry, animal husbandry, and fishery outputs%
Table 4. Sources and contribution rates of differences in ECLU in the YRD region.
YearTotal GiniIntra-Regional VariationInter-Regional VariationHypervariable Density
GwContribution Rate (%)GnbContribution Rate (%)GtContribution Rate (%)
20000.1380.04129.6130.03223.3280.06547.059
20010.1390.04129.4890.03424.1990.06546.311
20020.1370.04029.1750.03223.2560.06547.569
20030.1480.04329.3630.03523.8420.06946.795
20040.1320.03828.7520.03324.6830.06146.565
20050.1410.04129.2380.03323.0600.06747.702
20060.1450.04228.8010.03423.7290.06947.470
20070.1500.04329.0160.03422.5550.07248.429
20080.1500.04429.1740.03422.7210.07248.106
20090.1580.04629.1970.04125.6770.07145.125
20100.1560.04629.3720.04126.6420.06843.987
20110.1580.04629.1160.04427.7180.06843.165
20120.1640.04728.8520.04527.2650.07243.883
20130.1700.04928.8930.04727.8480.07443.260
20140.1730.04928.5280.04827.9070.07643.565
20150.1730.05028.9810.04726.9830.07644.036
20160.1640.04829.3420.04426.9470.07243.710
20170.1700.04928.9630.05129.7080.07041.329
20180.1670.04929.4110.04728.0060.07142.583
20190.1600.04829.7700.04125.7510.07144.479
20200.1580.04729.6760.04125.6840.07144.641
Table 5. Tobit regression analysis of factors influencing ECLU in the YRD region.
Explanatory VariableRatioStandard Errorz-Valuep-Value
Constant term (math.)−2.6470.546−4.850.000 ***
Proportion of urban population (X1)0.0660.0087.930.000 ***
GDP per capita (X2)0.0590.0144.160.000 ***
Share of agricultural GDP (X3)0.0710.0154.730.025 **
Farmers’ disposable income (X4)−1.7 × 10−57.4 × 10−6−2.250.148
Rainfall (X5)−9.7 × 10−66.7 × 10−6−1.450.002 ***
Agricultural machinery density (X6)0.1820.0593.070.235
Agricultural intensity level (X7)−0.0080.007−1.190.002 ***
Agricultural industrial structure (X8)−0.2060.065−3.170.000 ***
LR test of sigma u = 0: chibar2(01) = 161.87 Prob >= chibar2 = 0.000
Note: at the 1%, 5% levels, respectively, *** and ** denote significance.
Disclaimer/Publisher’s Note: The statements, opinions and data contained in all publications are solely those of the individual author(s) and contributor(s) and not of MDPI and/or the editor(s). MDPI and/or the editor(s) disclaim responsibility for any injury to people or property resulting from any ideas, methods, instructions or products referred to in the content.

