Review

Land Use Carbon Emissions or Sink: Research Characteristics, Hotspots and Future Perspectives

by
Lina Liu
1,2,
Jiansheng Qu
1,3,*,
Feng Gao
1,2,
Tek Narayan Maraseni
4,
Shaojian Wang
5,
Suman Aryal
4,
Zhenhua Zhang
6 and
Rong Wu
7
1
Northwest Institute of Eco-Environment and Resources, Chinese Academy of Sciences, Lanzhou 730000, China
2
Key Laboratory of Knowledge Computing and Intelligent Decision, Lanzhou 730000, China
3
Chengdu Library and Information Center, Chinese Academy of Sciences, Chengdu 610041, China
4
Centre for Sustainable Agricultural Systems, University of Southern Queensland, Queensland 4350, Australia
5
School of Geography and Planning, Sun Yat-Sen University, Guangzhou 510006, China
6
School of Economics, Lanzhou University, Lanzhou 730000, China
7
School of Architecture and Urban Planning, Guangdong University of Technology, Guangzhou 510062, China
*
Author to whom correspondence should be addressed.
Land 2024, 13(3), 279; https://doi.org/10.3390/land13030279
Submission received: 5 January 2024 / Revised: 19 February 2024 / Accepted: 21 February 2024 / Published: 23 February 2024

Abstract

:
The land use, land-use change and forestry (LULUCF) sector, as a source and a sink of greenhouse gas (GHG) emissions, is critical for achieving carbon neutrality. Many academic journals have published papers on land use carbon emission or sink (LUCES), but LUCES reviews are relatively rare, which poses great challenges in accurately understanding the research progress and future prospects. This work analyzes the research characteristics, hotspots and future perspectives of LUCES research by using a bibliometric analysis (such as DDA, VOSviewer, CiteSpace software) and a review based on the data (6115 scientific papers) during 1991–2023 from the Web of Science (WoS) platform. We found that (1) over the past 33 years, it first presented a steady growth, then fluctuating growth, and finally a rapid growth trend in the yearly number of publications in LUCES research. The USA (17.31%), China (14.96%), and the UK (7.37%) occupy a dominant position in this research field. (2) The related LUCES research is interdisciplinary, which mainly cover science and technology, meteorology and atmospheric sciences, geology, and environmental sciences and ecology disciplines. (3) The research hotspot analysis on LUCES shows that these articles mostly covered the follow three aspects: ecosystem services, climate change, and carbon neutrality. (4) A review of the past LUCES literature suggests that it is mainly focused on exploring the forefront issues in terms of the definition and boundaries, evaluation method and influencing factors, etc. This work suggests that further research could explore the main scientific problems on quantification of land-based carbon neutrality, quantitative analysis of the impact mechanisms, as well as interdisciplinary research and collaborative governance needed for carbon neutrality.

1. Introduction

At present, agriculture and land-use change contribute to 20% of global greenhouse gas (GHG) emissions [1]. During 2013–2022, the annual average global CO2 emission from land use, land-use change and forestry (LULUCF) was 1.3 ± 0.7 Gt C, and the preliminary forecast was 1.1 ± 0.7 Gt C in 2023 [2]. Through restoration/afforestation, etc., the annual average carbon sink was about 1.3 Gt C, which could offset two-thirds of the deforestation emissions [2]. The U.S. Department of Agriculture’s Forest Service has estimated that forests cover about one-third of the USA (the United States of America) and offset around 15% of the nation’s annual carbon emissions [3]. Based on the trends and projections, the EU’s carbon sink of the LULUCF sector in 2021 was 8% lower than that in 2020 [4]. Combined with a newly developed LULUCF database, Yu et al., (2022) used terrestrial ecosystem models and revealed a strong carbon sink of 8.9 ± 0.8 Pg carbon from 1980 to 2019 in China [5]. LULUCF not only played an important role in achieving global carbon neutrality goals, but also helped to achieve them for different countries or regions; sustainable land use is beneficial to human beings and the environment [6].
To achieve the zero deforestation goal by 2030 and fully tap the carbon emission reduction potential of the land use sector, the Glasgow Leaders’ Declaration on Forests and Land Use has been established [7]. The implementation of sustainable agriculture or LULUCF mitigation programs could significantly reduce GHG emissions and increase the carbon sink potential for carbon neutrality targets. Despite the crucial role for climate stability, LULUCF has received less stakeholders’ attention compared to energy systems. Here, the discussion on land use specifically focuses on its hierarchical classification in national land spatial planning. Currently, there are many academic publications on land use carbon emission or sink (LUCES). Some studies focus on the current research status [8,9,10,11,12,13], whereas others focus on research methods from carbon emissions [14,15,16,17,18,19,20,21] or carbon sink [22,23,24,25,26,27]. Moreover, some research noticed the determinants and future carbon emission reduction measures [28,29,30,31]. For example, scholars have explored the relationship between high-quality urbanization and energy transition in connecting land use, carbon emissions, and carbon sink [9,17]. However, related LUCES research reviews are relatively rare, which would otherwise be a great asset for understanding research progress and the further prospects.
The increasing trend of research publications could indirectly indicate the research’s recognition (e.g., applications, methods, etc.) [32,33,34]. Bibliometric analysis helped to understand the current situation and the development trend of the related research [33,34,35]. Bibliometric analysis has become a powerful tool for analytical science research, which could quantitatively describe the necessary information of specific research topics and provide the distribution characteristics of research in the form of a knowledge map. However, there are very few reviews on LUCES research, especially from the bibliometric or scientometric point of view. In this context, there are still some pertinent questions that need to be addressed. What are the global trends regarding publications in LUCES research? What are the prevalent research characteristics from this research trend? What are the hotspot topics of LUCES research? What is the research progress, and what are the future perspectives of LUCES?
Hence, this paper aims to provide a bibliometric analysis and review of the research on LUCES. This work uses a well-justified and executed methodology to analyze a large number of scientific papers, and discusses them in four sets of findings (including research characteristics, hotspot analysis, research progress and future perspectives). The remaining sections of the paper are organized as follows: Section 2 provides the materials and methods; Section 3 provides the research results; Section 4 and Section 5 present a discussion and the conclusions, respectively.

2. Materials and Methods

Web of Science (WoS) is one of the most authoritative citation data platforms, which include the Science Citation Index Expanded (SCIE) and Social Science Citation Index (SSCI) databases. There are lots of interdisciplinary, comprehensive and influential international academic journals in this platform. We used several key words for the retrieval of the literature related to land use carbon emission or sink (LUCES), such as title equaled “land” and title equaled “carbon peak*” or “carbon neutrality” or “double carbon” or “carbon emission*” or “CO2 emission*” or “carbon footprint*” or “CO2 footprint*” or “carbon emit*” or “CO2 emit*” or “GHG* emission*” or “greenhouse gas emission*” or “energy emission*” or “energy footprint*” or “low carbon” or “carbon reduce*” or “carbon sequestration” or “carbon sink”; abstract equaled “land” and abstract equaled “carbon peak*” or “carbon neutrality” or “double carbon” or “carbon emission*” or “CO2 emission*” or “carbon footprint*” or “CO2 footprint*” or “carbon emit*” or “CO2 emit*” or “GHG* emission*” or “Energy emission*” or “greenhouse gas emission*” or “carbon sequestration” or “energy footprint*” or “low carbon” or “carbon reduce*” or “carbon sink”. A total of 6214 publications were found (articles from 1991 to 2022 were collected on 31 May 2023, and articles from 2023 were collected on 1 December 2023; in addition, for 2023, articles were considered only up to 1 December 2023). During 1991–2023, a total of 230 publications were collected from Nature (36) as well as its subsidiaries, including Nature Climate Change (37), Nature Communications (39), Nature Food (12), Nature Geoscience (20) and Nature Sustainability (10); and Science (16) and its subsidiaries, including science advances (8) and PNAS (Proceedings of the National Academy of Sciences) (52). The journals mentioned above were collectively referred to as “NSP”, which accounted for more than 90% of the total publications in the journals Nature, Science, PNAS, and their related subsidiaries.
In order to make the data comparable, some papers were cleaned or removed [33,36] (Figure 1a). For example, publications from China included articles from mainland China, HongKong, Macao and Taiwan; publications from the UK included articles from England, Scotland, Wales and Northern Ireland. Furthermore, this work also excluded non-English articles, and only considered English articles to ensure the data comparability. In addition, we removed the papers that belonged to such terms as organ, compound, nana, brain, chemistry, in these medicine or chemistry research fields, etc. Finally, a total of 6115 scientific papers and 230 scientific papers of “NSP”, as well as 151 highly cited scientific papers, were used in this work.
In order to address the three research questions noted above, we reviewed and analyzed the evaluation method, current situation, influence mechanism and mitigation measures on this research field. As shown in Figure 1b, we used software such as Derwent Data Analyzer v7 (DDA, Clarivate Analytics, Boston, MA, USA), CiteSpace 6.2.R3 (https://citespace.podia.com/, accessed on 31 March 2023) and VOSviewer version 1.6.16 (https://www.vosviewer.com/, accessed on 25 November 2022) to visualize the textual data on LUCES research. By using the above software, the scholars performed some bibliometric and systemic analysis on such topics as NDVI (the Normalized Difference Vegetation Index), material flow mapping and household CO2 emissions research [32,33,34]. Based on the existing research foundation, we constructed the framework of this research. Firstly, we analyzed the global research characteristics from five main measurable indicators, such as the number of articles, national distribution, institutional distribution, journal distribution and subject categories. Then, research hotspots were analyzed from the following four perspectives: highly cited papers, cluster analysis, theme evolution and frontier analysis. At the end, we reviewed the evaluation method, current situation, influence mechanism and mitigation measures on this research field, and discussed the future perspectives.

3. Results

3.1. Research Characteristics

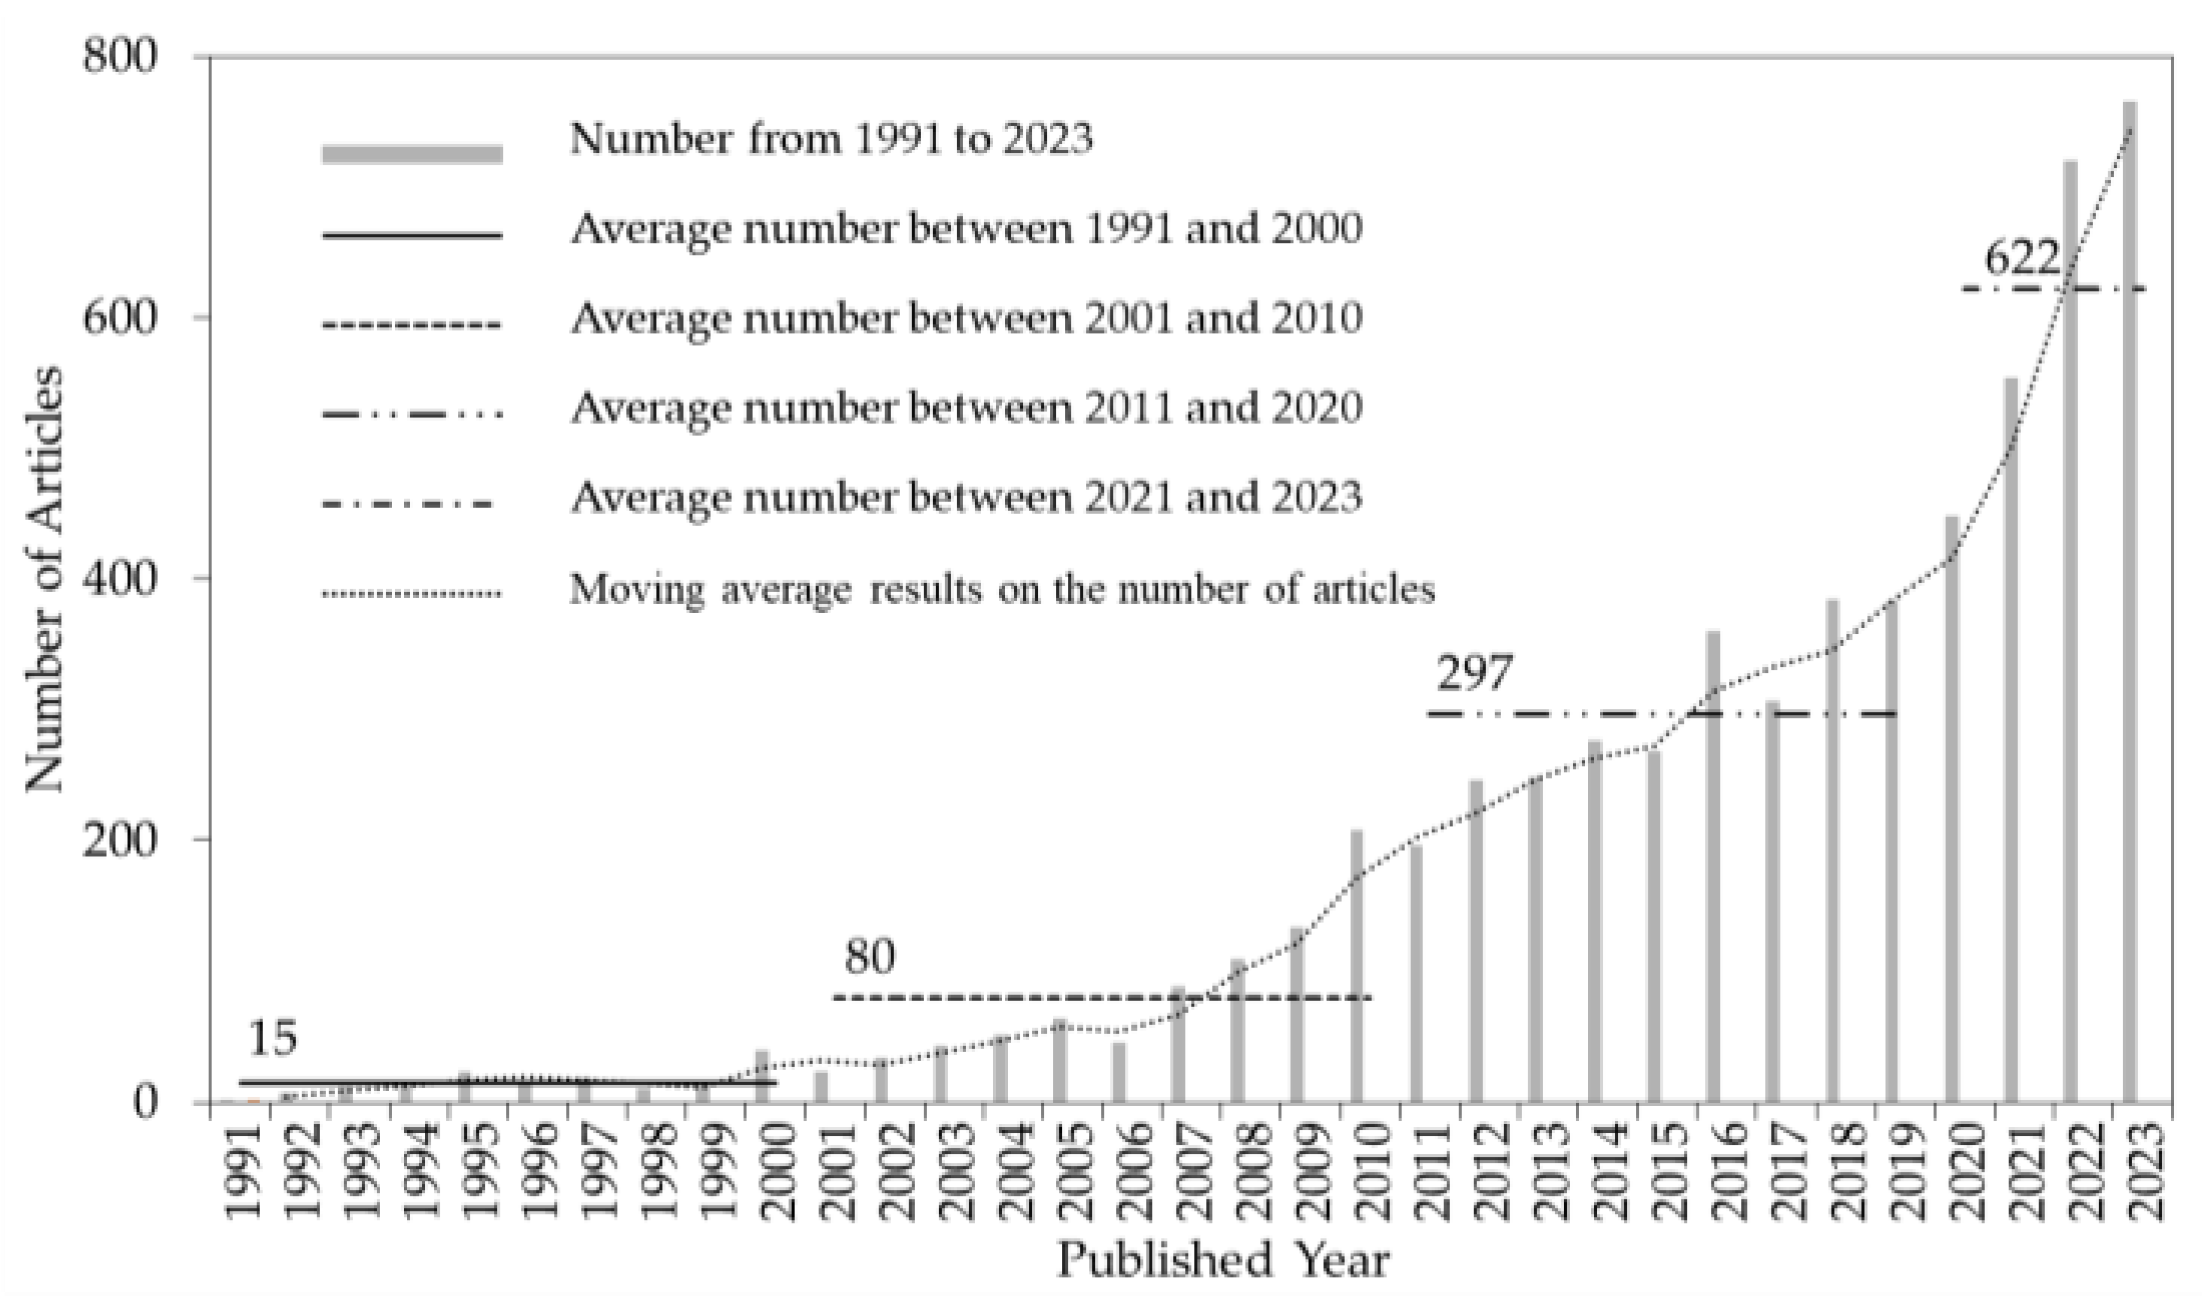
3.1.1. Global Trends of Articles

Analysis on the LUCES research found that the cumulative number of articles was 6115 (Figure 2), with an annual publication of 1 in 1991 to 766 in 2023. According to the moving average, we found that the number of published articles on LUCES research first showed a steady upward trend, then a fluctuated upward trend, and finally showed a rapid upward trend. Specifically, the first stage (1991–2000) was an initial stage (the number of publications per year was small), with a cumulative number of 152 (the annual average was 15), which accounted for only 2.49% of the total publications. The second stage (2001–2010) was the rising stage of fluctuation, with the cumulative articles of 801 (the average was 80), which accounted for 13.10% of the total. The third stage (2011–2019) also saw a rising stage of fluctuation, with the cumulative article number of 2673 (the average was 297), which accounted for 43.71% of the total. The fourth one (2020–2023) was a rapid growth period, with the cumulative number of 2489 (the average was 622), which accounted for 40.70% of the total. The number of cumulative articles in the third stage and fourth stage was 16.59 and 15.38 times higher than that in the first one, respectively. From the perspective of overall trend of published articles in the research on LUCES, although there has been a downward trend in some years (such as 2001, 2011 and 2017) compared to the previous year, it has shown varying degrees of growth trends over last 33 years. It revealed that this research field has been widely recognized and concerned in recent years.

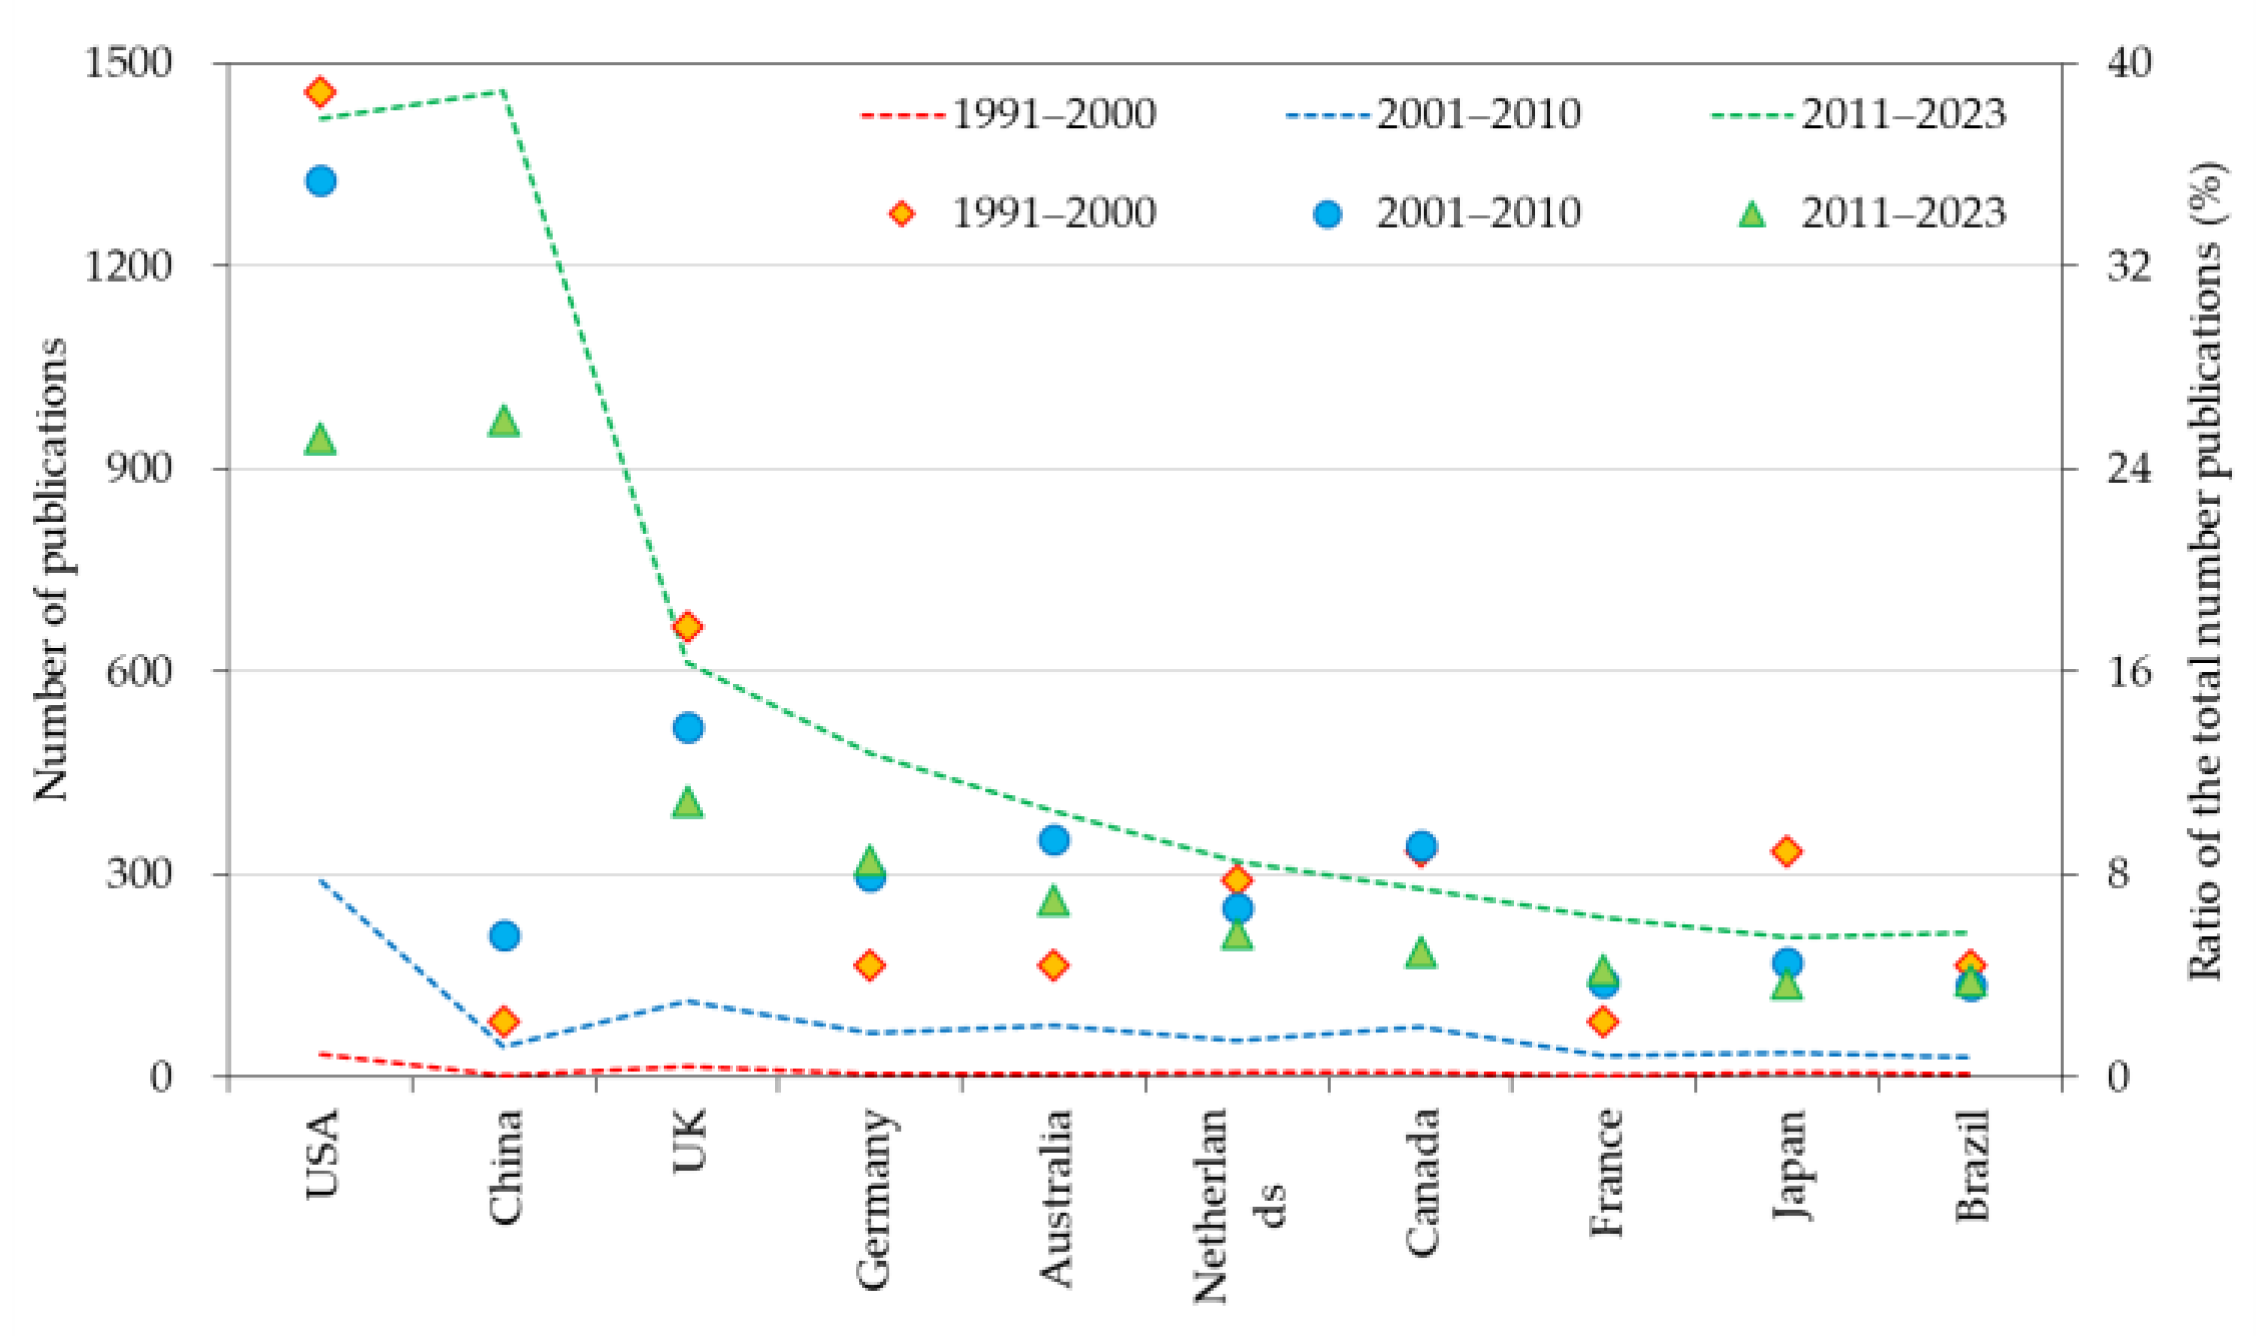
3.1.2. National Distribution Characteristics

Firstly, based on the data from the WoS platform, publications in LUCES research were from 138 countries/territories, and the top 10 countries, with the ratio 64.83% of the total, included the USA, China, the UK, Germany, Australia, Canada, Netherlands, France, Japan and Brazil, as shown in Figure 3. Among them, the cumulative number of publications from the USA ranked first during 1991–2000 and 2001–2010, accounting for 38.89% and 35.41% of the total top 10 countries; from 2011 to 2023, the cumulative number of articles published by China ranked first, accounting for 25.59% of the total. Overall, in the early stage, the USA dominated this research field, and in the later stage, China gradually moved towards the dominant position in this research field.
Secondly, this work drew the national cooperation network diagram based on the VOSviewer version 1.6.16, which could be divided into four clusters on LUCES research (Figure 4a). The first cluster (red one, 12 countries) included Germany, the Netherlands, Sweden, Spain, Denmark, Finland, Austria, Italy, Switzerland, Belgium and France, which was the largest one. The cluster 2 (green one, nine countries) included the USA, China, Australia, Japan, India, New Zealand, Indonesia, South Korea and Malaysia, which was the second largest one. The cluster 3 (blue one, three countries) included the UK, Scotland and Brazil. The cluster 4 (yellow one, one country) only included Canada. The national cooperation network diagram of LUCES research could provide readers with an intuitive understanding for the rapid assessment of national cooperation intensity [8,33]. Overall, the USA, China, the UK and Germany occupied a dominant position when comparing the total cooperation intensity in this research field. Since China proposed to achieve a carbon neutrality goal by 2060, which has promoted China’s dominant position in the related research fields to greater prominence.
Thirdly, this paper also drew the national cooperation network diagram on LUCES research from the related “NSP” journals, and it can be divided into three clusters (Figure 4b). The first one (red cluster, 10 countries) included the USA, the UK, Japan, Canada, Germany, Demark, Switzerland, Australia, Sweden and Indonesia, which was the largest cluster. The second one (green cluster, eight countries) included the Netherlands, Spain, Italy, Scotland, Belgium, Austria, Kenya and Brazil. The third one (blue cluster, two countries) included China and France. From this point of view, the USA, the UK, the Netherlands and China occupied a dominant position in this research field.

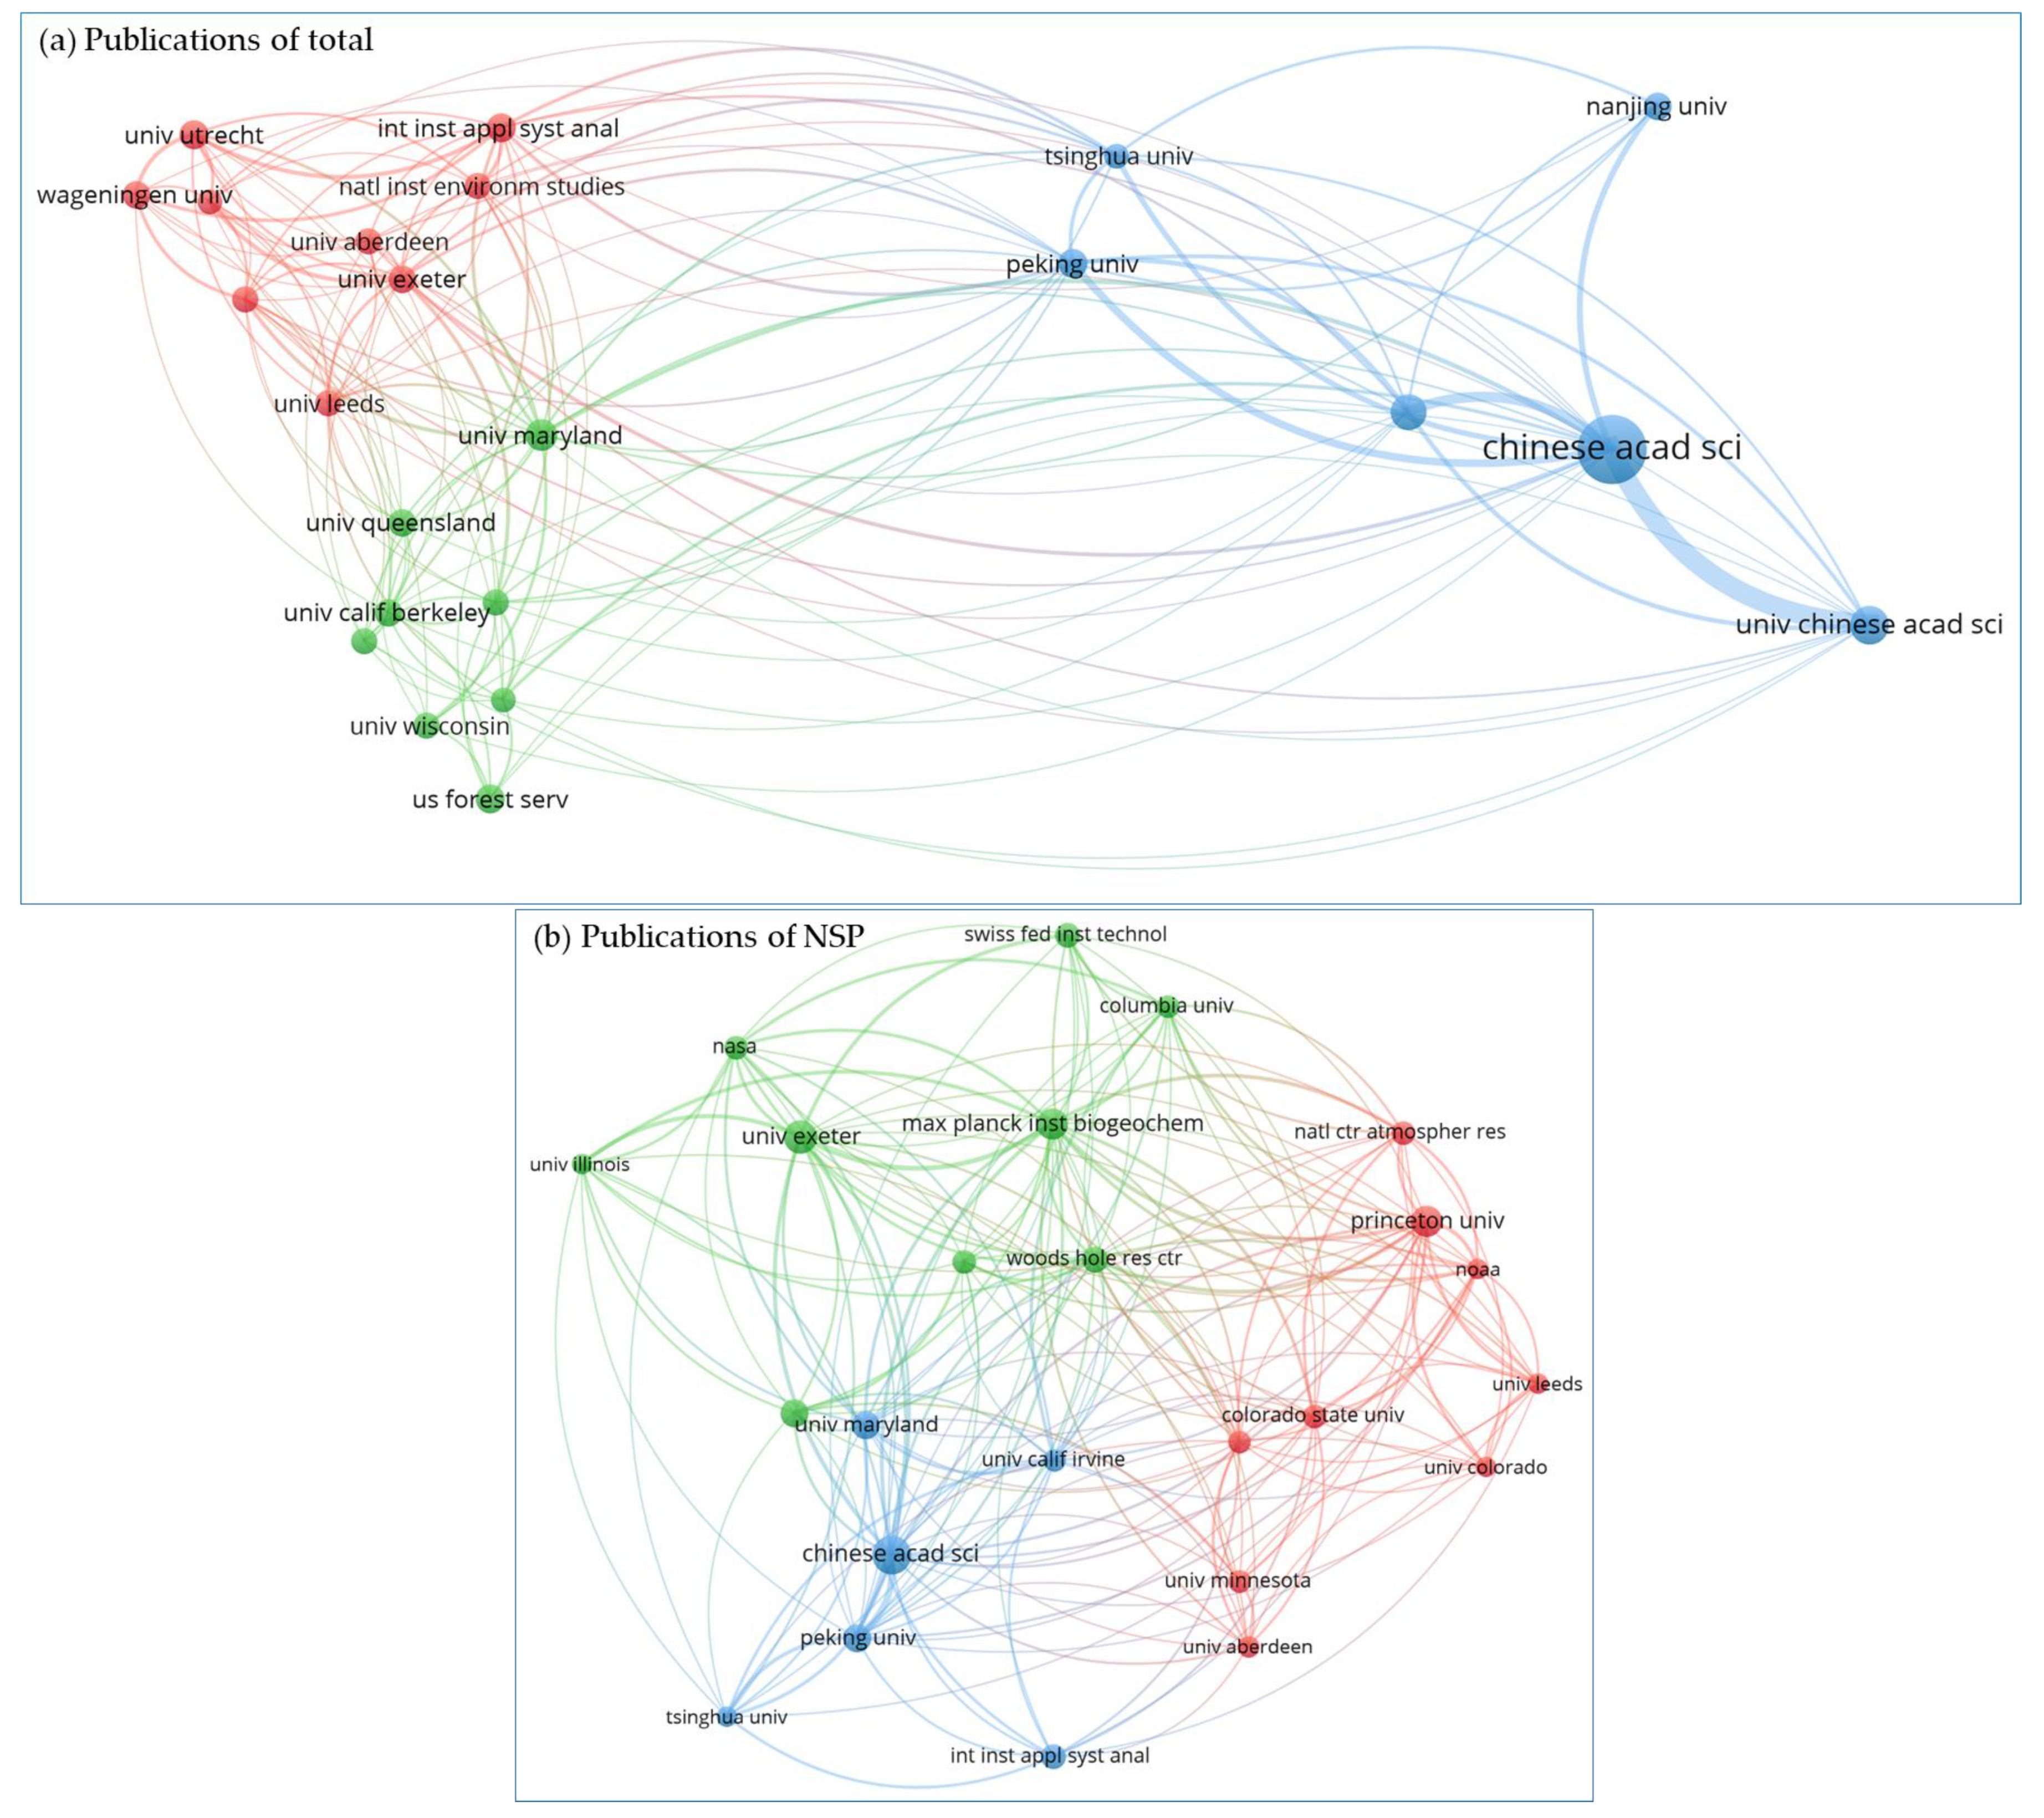
3.1.3. Institutional Distribution Characteristics

Firstly, over the past 33 years, there were 5082 research institutions that published articles on LUCES research. There were 710 institutions (accounting for 13.97% of the total institutions) that published ≥ 5 articles; meanwhile, the related articles only accounted for 7.41% of the total publications. The top 10 active institutions accounted for about 6.49% of the total publications (Table 1). The top 10 productive institutions included the Chinese Academy of Sciences (386, 2.73%), Wageningen University (112, 0.64%), Beijing Normal University (101, 0.57%), the International Institute for Applied Systems Analysis (92, 0.52%), the University of Maryland (92, 0.52%), the National Institute for Environmental Studies (76, 0.43%), Utrecht University (73, 0.41%), the University of Exeter (73, 0.41%), the United States Forest Service (70, 0.40%) and Peking University (67, 0.38%). Judging from the geographical location of these 10 active institutions, they were mainly distributed in China (3), the USA (2), the Netherlands (2), the UK (1), Japan (1) and Austria (1).
Secondly, this work also drew the institutional cooperation network diagram on this research field, which can be divided into three clusters (Figure 5a). The first cluster (red one, nine institutions) included the National Institute for Environmental Studies (Japan), the International Institute for Applied Systems Analysis (Austria), Wageningen University (Netherlands), Vrije University Amsterdam (Netherlands), the University of Utrecht (Netherlands), the Swiss Federal Institute of Technology (Switzerland), the University of Aberdeen (UK), the University of Exeter (UK) and the University of Leeds (UK); the first cluster was the largest one. The second cluster (green, eight institutions) included the University of California Berkeley (USA), the University of Florida (USA), Purdue University (USA), the University of Maryland (USA), the University of Illinois (USA), The University of Queensland (Australia), Concordia University Wisconsin (USA) and the United States Forest Service (USA); the second cluster was the second one. The third cluster (blue, six institutions) included Beijing Normal University (China), Peking University (China), Tsinghua University (China), the Chinese Academy of Sciences (China), Nanjing University (China) and the University of Chinese Academy of Sciences (China). Based on the total link strength, it was found that the Chinese Academy of Sciences, the University of Maryland and the International Institute for Applied Systems Analysis played an important role in this research field. Judging from the geographical location, the above institutions were mainly distributed in China (6), the USA (7), the UK (3), the Netherlands (3), Switzerland (1), Japan (1), Australia (1) and Austria (1). It was also found that the research institutions located in the EU, the USA and China had closer cooperation in their own countries/regions.
Thirdly, this work analyzed the institutional cooperation network diagram on LUCES research from the related “NSP” journals, which can be divided into three clusters (Figure 5b). The first cluster (red one, nine institutions) included Colorado State University (USA), the National Center for Atmospheric Research (USA), Princeton University (USA), NOAA (USA), the University of Aberdeen (UK), the University of Colorado (USA), the University of Leeds (UK), the University of Minnesota (USA) and the University of Oxford (UK). The second one (green cluster, nine institutions) included the Carnegie Institution for Science (USA), the Max Planck Institute of Biochemistry (Germany), Columbia University (USA), NASA (USA), the Swiss Federal Institute of Technology (Switzerland), the University of Exeter (UK), the University of Illinois (USA), Stanford University (USA) and the Woods Hole Research Center (USA). The third cluster (blue one, six institutions) included the Chinese Academy of Sciences (China), Tsinghua University (China), Peking University (China), the International Institute for Applied Systems Analysis (Austria), the University of California Irvine (USA) and the University of Maryland (USA). The results of this analysis showed that the University of Exeter, Princeton University, and the Chinese Academy of Sciences occupied a dominant position in this research field. Meanwhile, it was found that the research institutions located in the EU, the USA and China had closer cooperation in their own countries/regions.

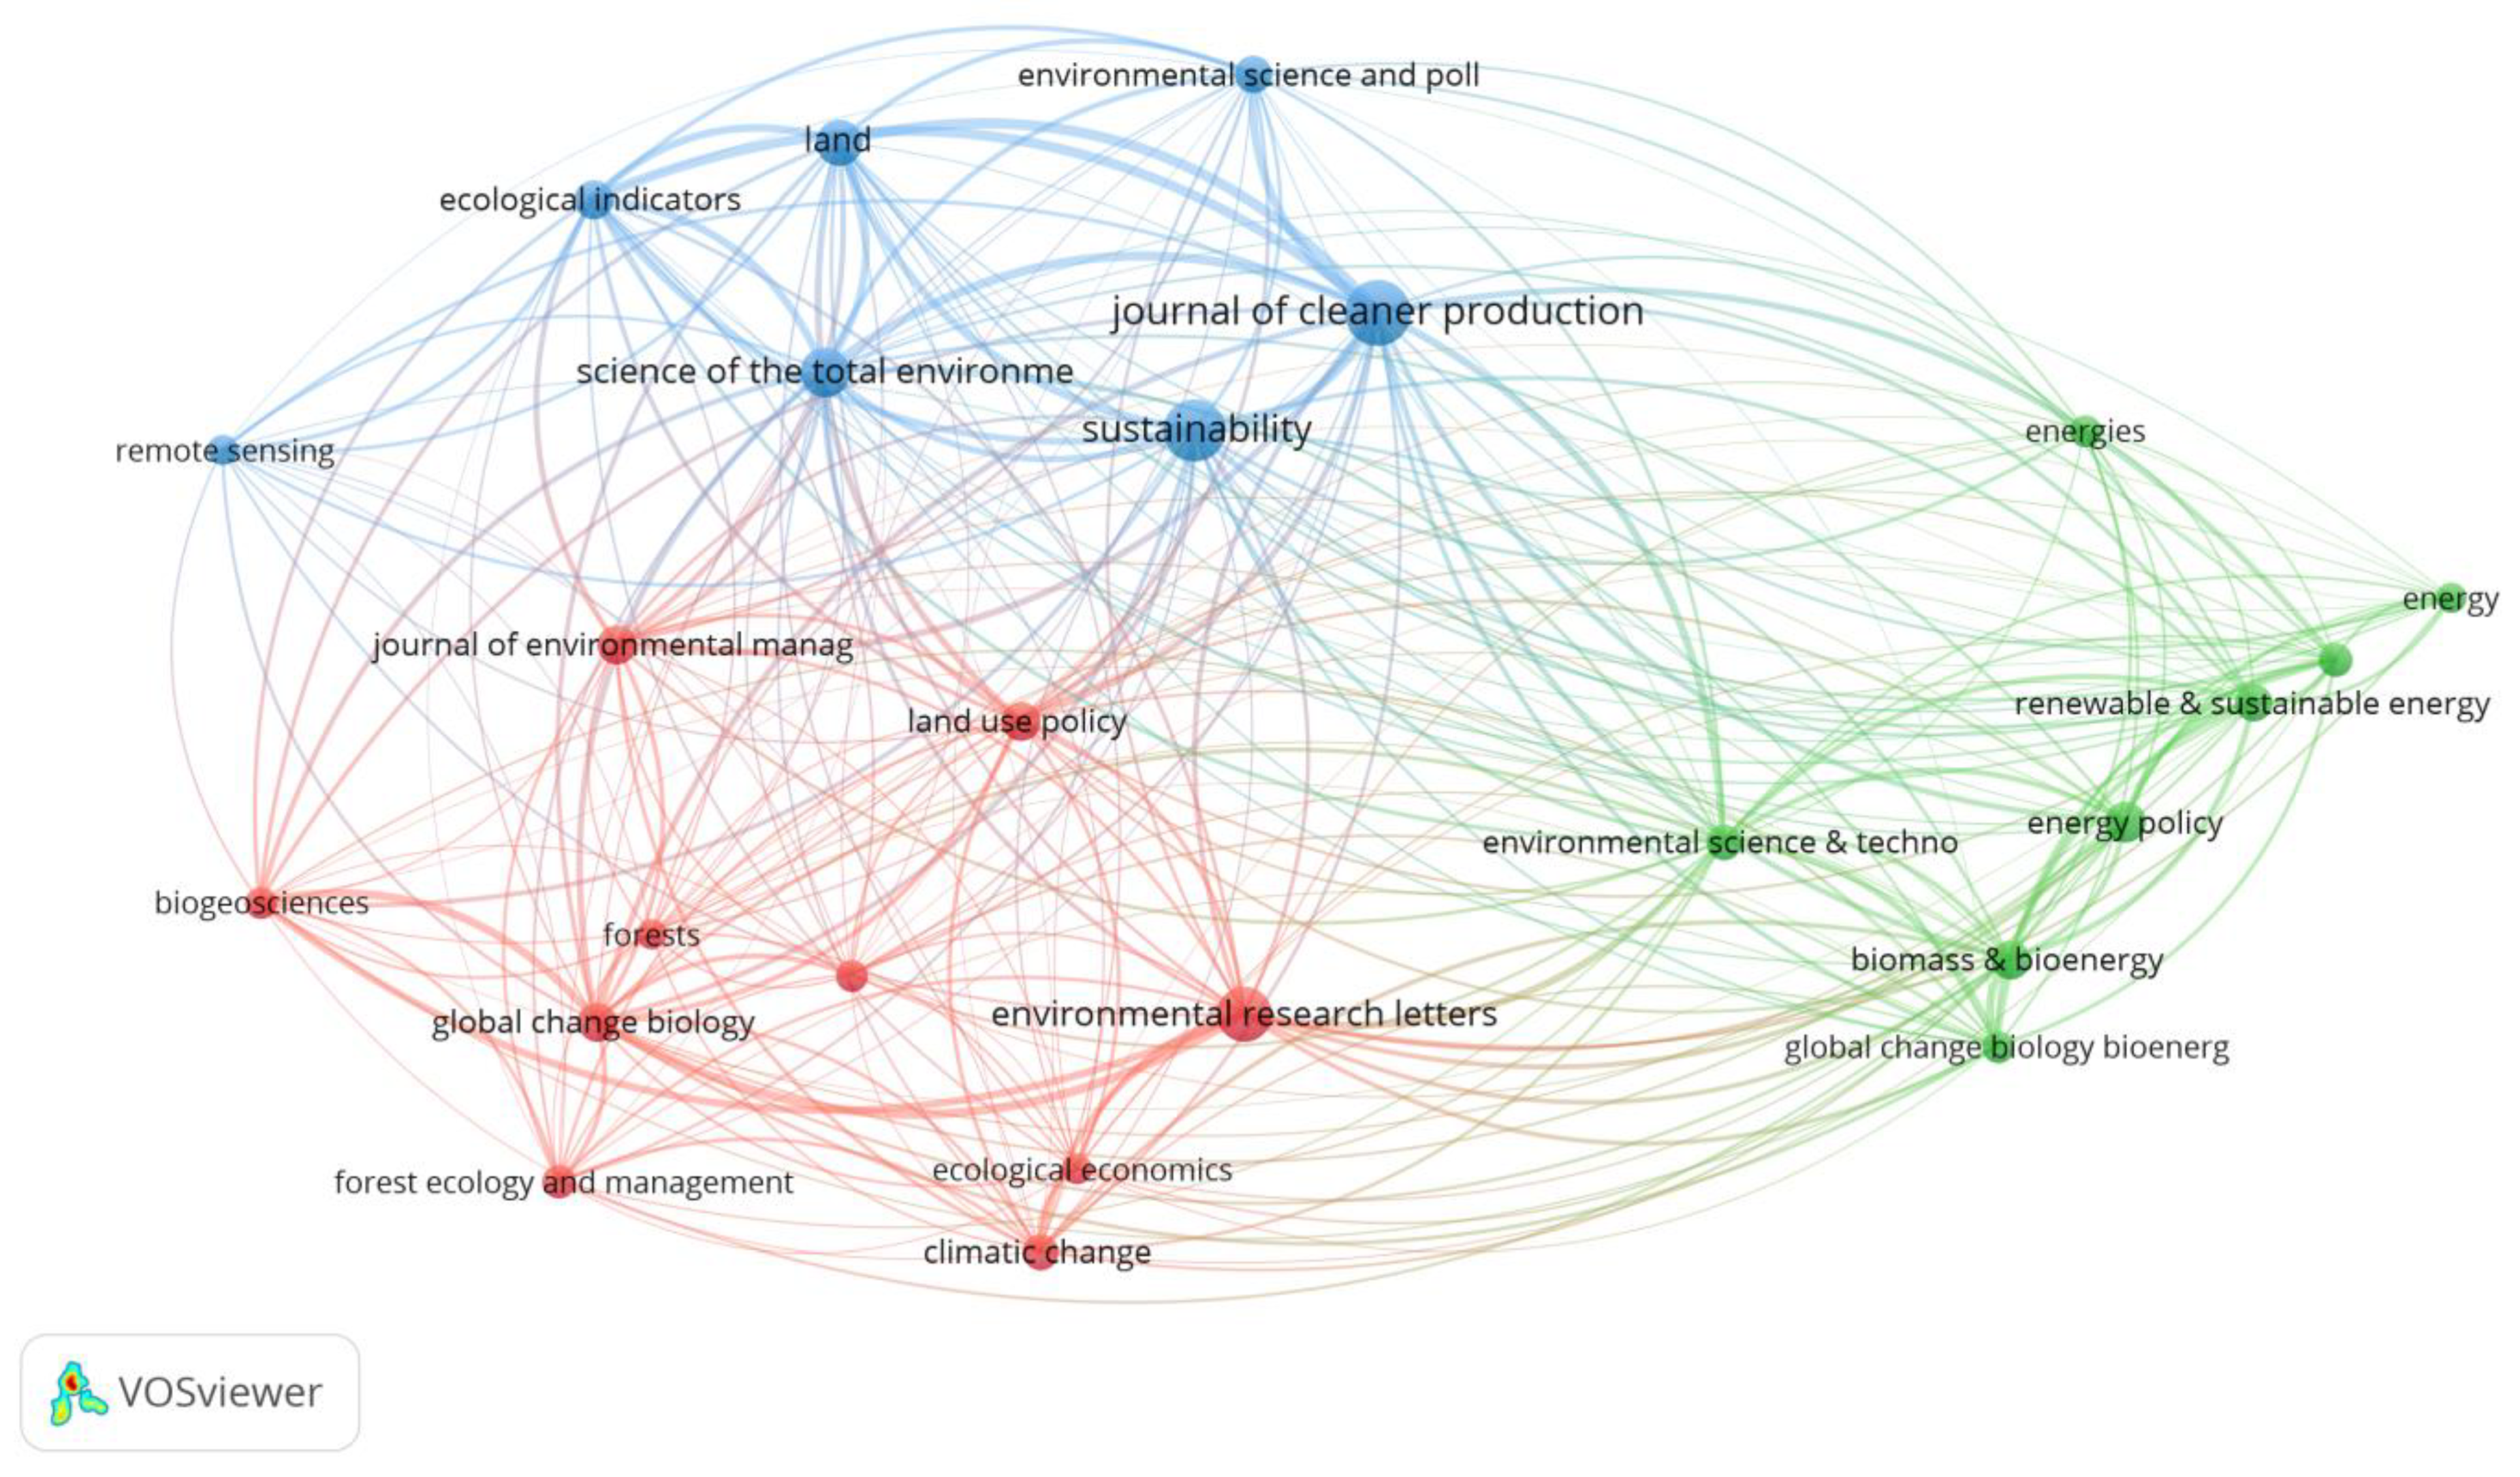
3.1.4. Distribution Characteristics of Journals

During the study period (1991–2023), there were 930 journals published articles on LUCES research (from the data from WoS platform). The top 10 active journals accounted for 22.51% of the total publications in this research filed (Table 2). There were 710 journals (which accounted for 23.98% of the total journals) that published ≥ 5 articles, which accounted for 81.08% of the total publications. The top 10 journals on LUCES research included the Journal of Cleaner Production (249, 4.07%), Sustainability (226, 3.70%), Environmental Research Letters (174, 2.84%), Science of The Total Environment (144, 2.35%), Land (127, 2.08%), Energy Policy (96, 1.57%), Global Change Biology (93, 1.52%), Journal of Environmental Management (90, 1.47%), Biomass & Bioenergy (89, 1.46%) and Land Use Policy (89, 1.46%). From the distribution of the top 10 productive journals, it was found that they were mainly distributed in the UK (6), Switzerland (2), the USA (1) and the Netherlands (1). From the 2022 IF, except for Land and Sustainability, all others were greater than 6.0; meanwhile, from the JCR, also except for Land and Sustainability in Q2, all others were in Q1.
This work drew the journal citation network diagram on LUCES research (Figure 6). It was found that there were four clusters in this research field, based on total link strength of cooperation network. Cluster 1 (red one, 10) included Environmental Research Letters, Agriculture Ecosystems & Environment, Global Change Biology, Land Use Policy, Biogeosciences, Forests, Forest Ecology and Management, Ecological Economics, Journal of Environmental Management and Climatic Change. Cluster 2 (green one, eight) included Energy Policy, Environmental Science & Technology, Biomass & Bioenergy, Renewable & Sustainable Energy, Applied Energy, Energies and Global Change Biology Bioenergy. Cluster 3 (blue one, seven) involved in Journal of Cleaner Production, Land, Science of the Total Environment, Sustainability, Ecological Indicators, Environmental Science and Pollution Research and Remote Sensing. On the whole, we found that Journal of Cleaner Production, Energy Policy, Sustainability and Environmental Research Letters were four journals with an important leading position in LUCES research, based on the total link strength.

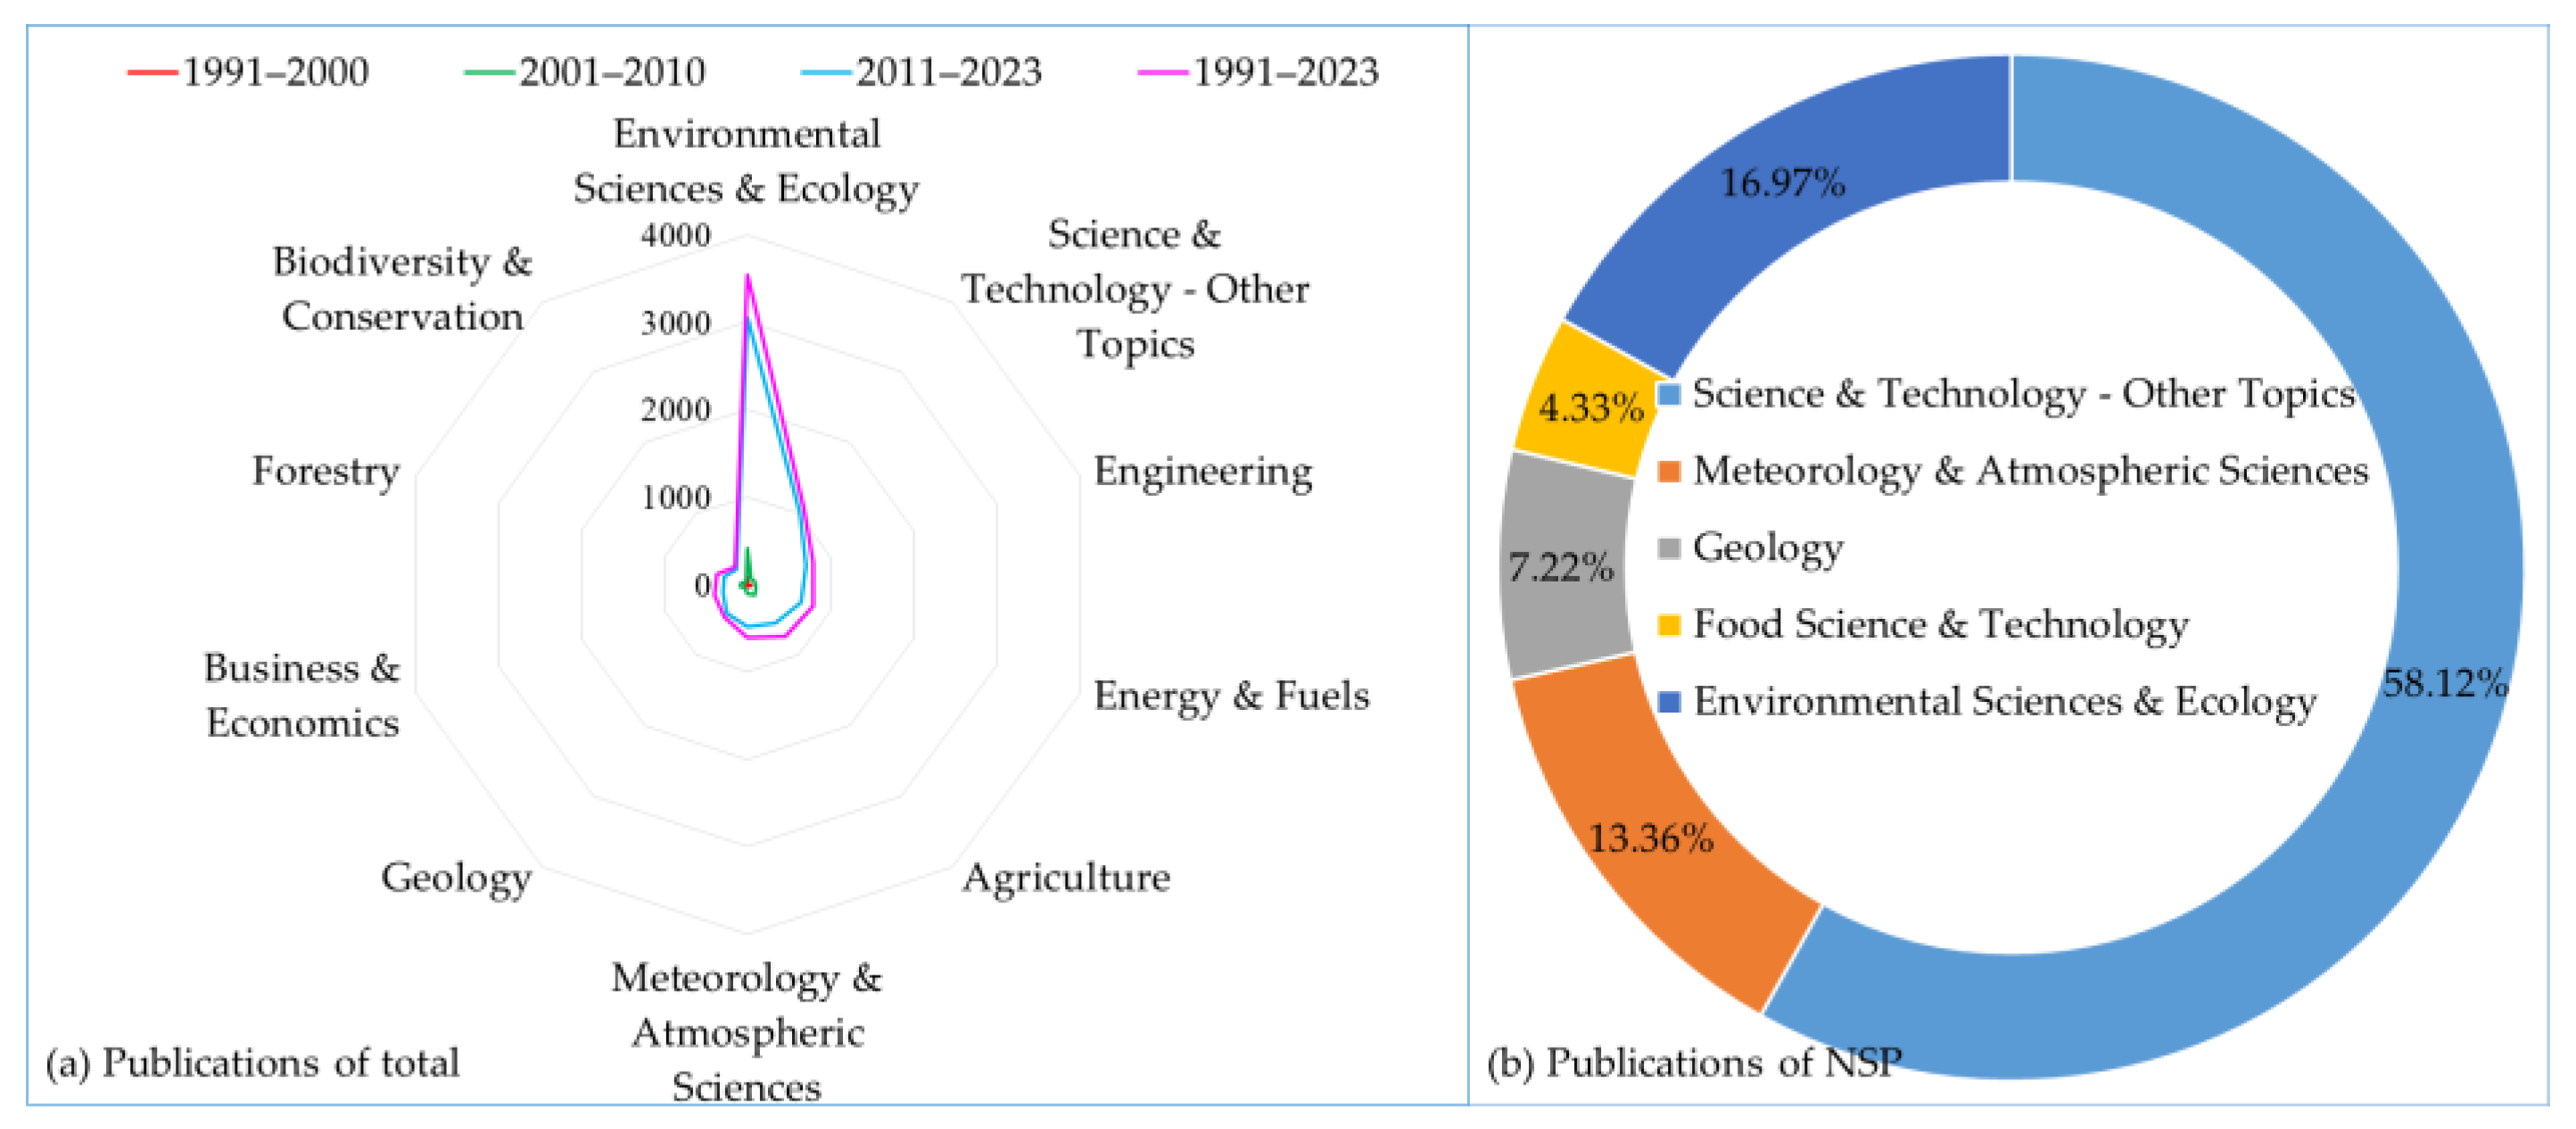
3.1.5. Characteristics of Subject Categories

Firstly, total publications in LUCES research were from 83 subject categories. As shown in Figure 7a, the top 10 subject categories were mainly focused on environmental sciences and ecology, science and technology—other topics, engineering, energy and fuels, agriculture, meteorology and atmospheric sciences, geology, business and economics and forestry, as well as biodiversity and conservation, from different periods. The articles related to the top 10 subject categories, which accounted for 82.34% of the total during 1991–2023. In addition, it pointed out that these subject categories, e.g., science and technology—other topics, engineering, environmental sciences and ecology, and environmental sciences and ecology, which related to LUCES research, increased the fastest, by 11.49, 7.45, 7.12 and 6.38 times compared to the period between 2011–2023 and 2001–2010, separately. Secondly, LUCES research from “NSP” were only from five subject categories, including science and technology—other topics, meteorology and atmospheric sciences, geology, food science and technology, as well as environmental sciences and ecology (Figure 7b). Overall, regardless of the subject categories from the total publications or from “NSP” publications, we found that science and technology—other topics, meteorology and atmospheric sciences, geology and environmental sciences and ecology were the main categories of LUCES research.

3.2. Research Hotspot Analysis

3.2.1. Analysis of Top 10 Highly Cited Papers

Highly cited scientific papers would reflect the quality and impact of the publications [36]. There were 151 highly cited papers on LUCES research according to the standards of Journal Citation Reports from the WoS platform. Among them, the publication time ranged from 2013 to 2023. The top 10 publication countries comprised the USA, China, the UK, the Netherlands, Germany, Australia, France, Switzerland, Japan and Norway. The top 10 journals included Nature, Earth System Science Data, Nature Climate Change, PNAS, Global Environmental Change—Human and Policy Dimensions, Nature Communications, Land Use Policy, Renewable & Sustainable Energy, Global Climate Change and Science Advances. The top 10 subject categories involved science and technology—other topics, environmental sciences ecology, meteorology and atmospheric sciences, geology, energy fuels, engineering, biodiversity conservation, food science and technology, geography and business economics; in addition, there were 51 papers that came from “NSP”.
Here, we selected the top 10 highly cited papers (Table 3) on LUCES research and analyzed their research contents as the focus of this study [13,14,15,37,38,39,40,41,42,43]. It was found that: (i) all top 10 highly cited articles had a citation frequency exceeding 898. The first one was cited 1439 times, which was published by Huang et al., (2016) in Nature Climate Change; it focused on the variation trends of carbon sequestration and the regional warming with dryland expansion [37]. The second one was cited 1433 times, which was published by Riahi et al., (2017) in Global Environmental Change—Human and Policy Dimensions; it was found that the nexus between energy, land use and GHG emissions based on the SSP (Shared Socioeconomic Pathways) mitigation scenarios [38]. The third one was cited 1324 times, which was published by Griscom et al., (2017) in PNAS; it was found that NCS (natural climate solutions) played an import role in stabilize warming to below 2 °C by 2030, alongside aggressive fossil fuel emissions reductions [39]. (ii) The top 10 highly cited papers analyzed the interrelationships between land use, climate change, carbon emission and carbon sink from different perspectives. The problem of carbon emission or sink caused by land use changes (dryland expansion, landscape changes caused by wildfires) in arid, semi-arid or temperate areas was worthy of attention, e.g., four of the top 10 cited papers focused on this question [13,37,40,41]. The quantitative analysis of carbon emission or carbon sinks has always been a research topic in the academic community, e.g., three of the top 10 cited papers focused on this question [14,15,42]. Liu et al., (2015) suggested that overestimation of China’s emissions in 2000–2013 may be larger than China’s estimated land carbon sink in 2000–2009 [15]. Global carbon budget pointed that the accurate assessment of carbon emission or sink was important to project future climate change [14,42]. Additionally, the other three of the top 10 cited papers mainly focused on the related determinants and carbon emission reduction measures, such as natural climate solution in the global carbon cycle [38,39,43]. (iii) It was interesting to find that there were no highly cited scientific papers published before 2013. This could indicate that the research on LUCES got popular attention after 2014. (iv) The related publications were mainly from the following journals, such as Earth System Science Data (3), Nature (2), Nature Climate Change (1), Science (1), PNAS (1), Global Environmental Change-Human and Policy Dimensions (1) and Journal of Advances in Modeling Earth Systems (1).

3.2.2. Keyword Cluster Analysis

There were 11,450 keywords in LUCES research. Out of them, 92.95% appeared once, twice, and three times, with 8680 (75.81%), 1202 (10.50%) and 515 (4.50%) keywords, respectively. Only 807 keywords (9.20%) appeared more than four times. Bibliometric analysis of keywords could represent the research frontiers, and the more frequently they appeared, the more they could reflected the research hotspots [44]. Bibliometric analysis on a co-occurrence network map of these most frequently occurring keywords (those which appeared 30 times) represented the research trends and frontiers [33]. Firstly, this work draws the keyword co-occurrence network map on LUCES research (Figure 8a). The results demonstrate that GHG, GHG emissions, carbon emissions, climate change and carbon sequestration were the core of different clusters. The first one (red cluster, 10) included GHG emissions, carbon footprint, life cycle assessment, renewable energy, sustainability, sustainable development, climate change mitigation, bioenergy, biofuels and biomass. The second one (green cluster, eight) included China, land use, carbon cycle, CO2 emission, carbon emissions, deforestation, remote sensing and urbanization. The third one (blue cluster, six) included afforestation, biodiversity, ecosystem services, carbon, carbon sequestration and land use change. The fourth one (yellow cluster, four) included GHG, carbon dioxide, nitrous oxide and methane. The fifth one (purple cluster, four) included climate change, mitigation and agriculture.
Secondly, this work also analyzed the keyword co-occurrence network map from “NSP” on LUCES research (Figure 8b). The results demonstrated that GHG, climate change, food security and agriculture were the core of different clusters. Cluster 1 (red, five) included agriculture, carbon sequestration and climate mitigation. Cluster 2 (green, three) included climate policy, agricultural intensification and GHG. Cluster 3 (blue, three) included carbon sink, climate change and climate impacts. Cluster 4 (yellow cluster, three) included deforestation, food security and reducing emissions from deforestation.

3.2.3. Analysis of Theme Evolution

Based on DDA v7 software, we created a keyword bubble diagram of LUCES research which could grasp the evolution track of related hot topics, as shown in Figure 9. According to the different time zone diagram, the LUCES research was divided into three stages: the first one, the early stage of LUCES research (1991–2000), is shown in Figure 9 (a). The overall number of articles at this stage was relatively small. By 2000, the annual publications in LUCES research began to exceed 20. The clustering hotspots included land use, carbon sequestration, deforestation, greenhouse gases, carbon dioxide, CO2 emissions, carbon, climate change, biomass and agriculture. For instance, Swisher presented a comprehensive methodology and analyzed the CO2 storage of forestry projects, early in 1991 [45]. During the initial stage of research, scholars mainly focused on the evaluation of land carbon emissions and carbon sink. The second one, the slow growth stage of LUCES research (2001–2010), is shown in Figure 9b. It was very interesting to find that the annual number of publications in LUCES research exceeded 200 for the first time, which was 208 in 2010. During 2001–2010, the problems of land-based carbon source and sink from a global or national perspective has been concerning [46,47]. On the other hand, the researchers pointed out that biomass fuels instead of fossil energy could help reduce GHG emissions [48,49,50]. The clustering themes include land use, land use changes, deforestation, greenhouse gases, greenhouse gas emissions, carbon, carbon sequestration, carbon dioxide, climate change and biofuels. The third one, the rapid growth period of LUCES research (2011–2023), is shown in Figure 9c. And during 2011–2023, the annual number of publications in LUCES research showed a rapid growth. Meanwhile, it was also interesting to find that the annual number exceeded 400 (449) for the first time in 2020. In this study period, scholars have focused on the carbon sink from land use in different ecosystems, such as forests, grasslands, etc. [5,51]. In the meantime, the research on land use carbon sources and sink (including CO2 or carbon emission, carbon sink and carbon sequestration) from multiple perspectives, such as ecosystem service value, sustainable development, as well as carbon neutrality, have received increased attention [52,53,54,55]. Especially after 2015 and 2019, the research on SDGs (Sustainable Development Goals) and carbon neutrality were in full swing. During the study period (1991–2023), the clustering themes included land use change, ecosystem services, sustainability, carbon sequestration, greenhouse gas emissions, carbon emissions, life cycle assessment, climate change, biofuels and agriculture.

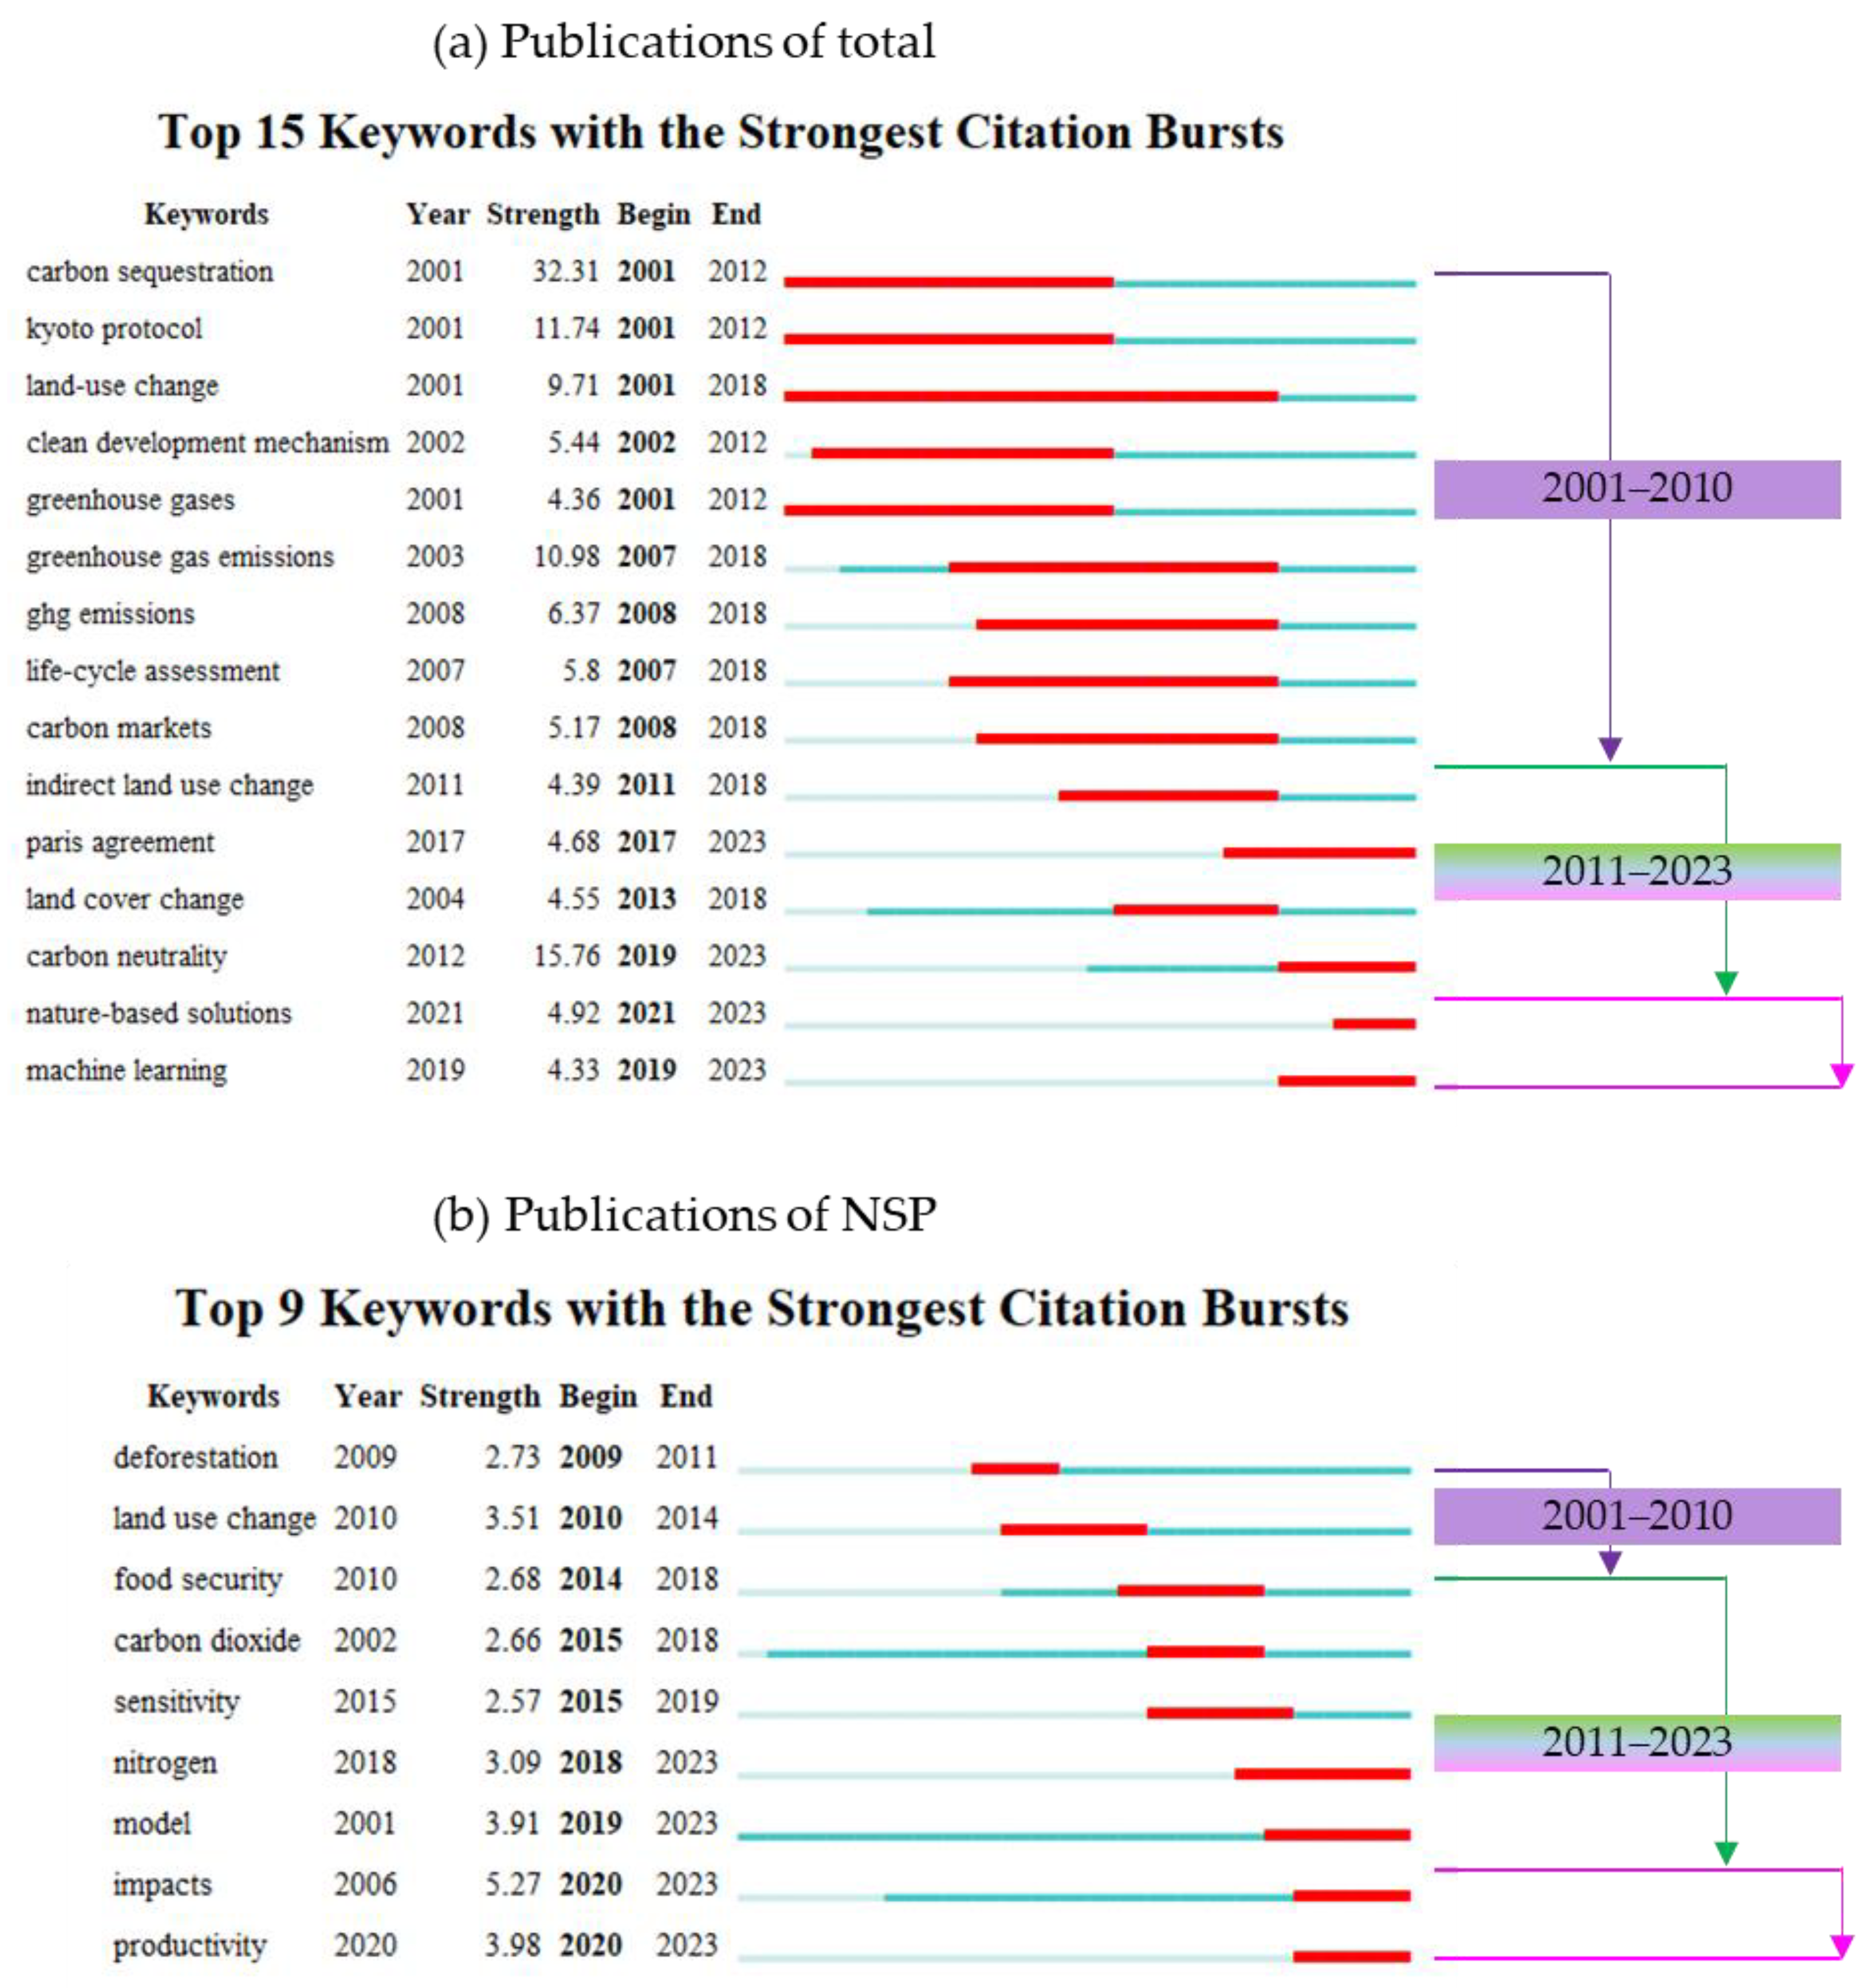
3.2.4. Research Frontier Analysis

Burst detection is helpful to understand the future research topics. The top 15 and top 9 keywords with the strongest citation bursts were analyzed in total publications, as well as in “NSP”, during 2001–2023 (the red line means the strongest bursts), respectively (Figure 10a,b). It was found that in total publications, beginning during 2001–2021 and ending during 2012–2023, the top 15 emergent words included carbon sequestration, Kyoto protocol, land-use change, clean development mechanism, greenhouse gases, greenhouse gas emissions, GHG emissions, life-cycle assessment and carbon markets, those emergent words appeared in the slow growth stage (2001–2010); indirect land use change, Paris agreement, land cover change, carbon neutrality, nature-based solutions and machine learning appeared in the rapid growth stage (2011–2023) (Figure 10a). In addition, it was found that in publications of “NSP”, beginning during 2009–2020 and ending during 2011–2023, the emergent words included deforestation and land use change, and only these two emergent words appeared in the slow growth stage (2001–2010); and food security, carbon dioxide, sensitivity, nitrogen, model, impacts and productivity emergent words appeared in the rapid growth stage (2011–2023) (Figure 10b).

4. Literature Review and Discussion

4.1. Research Progress

Firstly, the related literature was sorted out from the perspective of the definition and boundaries. From the comprehensive review, it was evident that there were different expressions and boundaries for land-based carbon emissions or carbon sink (here we took carbon storage or carbon sequestration and other similar concepts into the study of carbon sink) (Figure 11). For example, land-based CO2 emissions were emitted from agricultural land (e.g., agricultural inputs such as pesticides, fertilizers, agricultural film, diesel, machinery, irrigation, etc.; straw burning, such as rice, wheat and other straw burning, etc.; intestinal fermentation/fecal management, such as pigs, cattle, sheep, etc.; livestock and poultry, wildfire, etc.) and construction land (such as human greenhouse gas emissions of construction land which come from various productive activities and domestic activities, e.g., energy consumption, coal, oil, gas, etc.; garbage disposal, traffic exhaust emissions, human respiration, etc.) [8,9,10]. Land-based carbon sink came from sources such as crops (rice, wheat and other crops absorb carbon through photosynthesis, etc.; land-based carbon sink from crops varied in different regions, some of which were seasonal, even annual), garden land, forest, pastoral grassland and other agricultural land, etc. [11,12,13]. Although the above expressions were different, all of them referred to carbon emissions or sink generated using direct or indirect Land Use, Land-use Change and Forestry (LULUCF). Therefore, this study considered all of the above definitions and boundaries when formulating the retrieval formula of the research object. Reviewing the literature, this paper analyzed the basic progress in LUCES research. The main hotspots of LUCES research have shifted from solely considering carbon sink or carbon emissions to considering carbon neutrality.
Secondly, as presented above in Figure 10, it was generalized from the angle of elevation method. From the angle of land-use carbon emissions, the mainstream evaluation methods included IPCC’s Reference Approach (IPCC-RA, which was also known as IPCC’s inventory method) [14,15], input-output method (IOM) [16,17], material flow analysis (MFA) [18,19] and life cycle assessment (LCA) [20,21] (Figure 10). It could be directly assessing carbon emissions from agricultural and construction land using IPCC-RA [14]. Liu et al., (2015) referred to IPCC-RA to evaluate China’s carbon emissions, which indicated that the estimates of carbon emissions remain subject to large uncertainty [15]. The IOM was mainly applied to evaluate implied carbon emissions from macro statistics data or micro survey data in various countries and regions. Morán et al., (2007) developed an IOM to analyze carbon emissions from land transport, which could consider the production linkages and final demand between sectors and structure [16]. MFA research was based on “metabolism” research, which accounted for mass conservation as the accounting principle. [56]. Aryapratama et al., (2022) quantified wood product emissions by using MFA in Indonesia [19]. LCA, which is a systematic impact assessment tool, was widely used in carbon emissions calculation from the whole life cycle process of land-related industries [20]. Wu et al., (2013) evaluated GHG emissions during manure management system using LCA; it was pointed out that biochar and gasification of feedlot manure was a promising technique to reduce GHG emissions [20].
From the perspective of land use carbon sink, the mainstream evaluation methods included IPCC-RA [57,58], atmospheric inversions [22,23], terrestrial carbon model [24,25] and covariance measurement system [26,27]. For example, the main advantages of IPCC-RA are that it is simple, easy to understand and operate, and is widely used in global, national, city-level or other macro level calculations [57]. Meng et al., (2023) analyzed the spatio-temporal evolution characteristic of land carbon emissions using IPCC-RA [58]. Piao et al., (2018) analyzed the net land carbon sink by using atmospheric inversions and terrestrial carbon models, which helped to understand the trends of land carbon sink [23]. Potter et al., (2007) used an ecosystem carbon model to generate national maps of annual net primary production over the entire USA [24]. Berger et al., (2019) measured CO2 fluxes of contrasting savannas in semi-arid West Africa with eddy covariance towers [27]. It was found that the integration of multiple evaluated methods and the synthesis of multiple observation data were helpful to accurately evaluate land-based carbon sink [22,23,24,25,26].
Thirdly, it was discussed from the point of the related influence factors on LUCES research. From the angle of view in land use carbon emission, previous studies have analyzed the impacts from the demographic, economic, social, technological, policy and natural factors [59,60]. For instance, on a time scale, based on the theoretical basis of IPAT (impact, population, affluence, technology) [61] or KAYA [62], scholars further extended it to STIRPAT (stochastic impacts by regression on population, affluence and technology) [63], LMDI (logarithmic mean index method) [58] and other models [64,65], as well as mainly discussing the anthropogenic impacts (economic, social and demographic factors) on land use carbon emission [66]. From the spatial scale, scholars analyzed the spatial heterogeneity of the impact factors of land use carbon emission by using GWR (geographically weighted regression) [67,68], MGWR (multi-scale geographically weighted regression) [69,70] and spatial econometric models [71], etc. For example, Kang et al., (2023) pointed that construction land expansion did not monotonously increase carbon emissions, but it possibly changed with geographic location; the results described relationships between land use, carbon emissions and urban morphology, which enhanced our knowledge on this relationship and gave the scientific basis for policy-making [68]. Additionally, with the development of big data, some scholars have adopted machine learning methods for quantitatively analyzing the impact mechanism on land use carbon emission [55]. Overall, the research on the impact mechanism of carbon emissions was relatively early and the analytical methods were more mature, which provides important references for the study of relevant research on land use carbon emission.
From the perspective of land-used carbon sink, previous studies have analyzed the influencing factors, such as population, economic, technological, meteorology, climate change, ecosystem etc., combining them to the remote sensing data [54,72]. For example, based on the IPAT model, Marques et al., (2018) found that growth of population, as well as economic factors, have a great impact on land use carbon sequestration [54]. Liu et al., (2018) simulated carbon dynamics for different land use change scenarios using the CENTURY model, and reasonably evaluated the impact of land use intervention on carbon sequestration [55]. And some scholars have also constructed structural equation models to analyze the related impact factors, for example, the anthropogenic and climatic changes on potential carbon sequestration [73,74]. In general, scientific research has begun to focus on the converting of land use carbon sink into carbon sources. The existing studies mainly analyze the impact mechanism of land use sink by using remote sensing and modeling, which provided a theoretical basis for effectively identifying factors, aiming to reduce the conversion of land carbon sink into carbon sources [75,76].

4.2. Future Perspectives

Firstly, a scientific issue is to consider the systematic quantification of land-based carbon emission and sink from the perspective of carbon neutrality. During the research period from 1991 to 2013, multiple studies have shown that there were large uncertainties in the calculation of LUCES based on different methods. For instance, Wang 2022) proposed that there was an overestimation of land use carbon sink due to data processing uncertainties in Tibetan Plateau [77]. There was a great uncertainty in natural carbon sink due to the changes in anthropogenic environment (including climate), and future carbon sink potential would be less than the expected; the related viewpoints came from “10 new insights in climate science 2023/2024” [78]. Scholars proposed that there was uncertainty in estimating carbon emissions or sink-related land use. The reasons included: external factors’ influence (weather, climate, CO2 fertilization effect, etc.), data issues (imprecise data on land use carbon emission or sink) and method application [79,80]. Especially, the evaluation standards and calculation methods of different regions were not consistent, which could easily lead to errors when comparing them [81,82]. In view of the current research status of LUCES, it was urgent to pay attention to the scientific definition of the measurement boundary for both carbon source and sink (including carbon and non-carbon GHG emissions, such as CH4 and N2O) in the future from the system point of view, such as life cycle. Hence, future research could integrate multiple methods to improve the monitoring systems of land-based carbon emission and sink.
Accurate estimation of carbon emissions and sink are crucial for achieving global carbon neutrality [28]. The USA and EU have released relevant national strategies aiming to strengthen local GHG measurement and monitoring capabilities, to improve data on quantification of GHG emission sources and sink and to provide more comprehensive, detailed and timely data [83,84]. Based on the above research methods, scholars evaluated land use carbon emission or sink solely from the perspective of carbon sources or sink. Under the carbon neutrality framework, the scientific problems of how to integrate sources and sink, and evaluating them from macro and micro, from single factor to multi-factor need to be resolved. It is necessary to combine the above LUCES assessments to effectively measure land-based neutrality and provide data support to address low-carbon development at different levels. Hybrid models of land use carbon emission or sink were urgently needed to address local climate change governance.
Secondly, quantitative analysis on the impact factors of land-based carbon emission or sink was another scientific issue. Recent research has analyzed the influencing factors, differences, comparisons and mitigation policies regarding LUCES to understand its relationship to nature, resources, environment, society and technology [33,36]. Marvin et al., (2023) found that the implementation of nature-based climate solutions, such as forests, would contribute 85% of the carbon emission reductions [29]. Climate change had two types of impacts on land use change and carbon emissions. Direct impacts were due to change in climate and carbon fertilization, and indirect impacts were due to change in several land use and land management policies to address the climate change impact, such as promotion of climate smart agriculture [85], zero tillage [86] and the replacement of agrochemicals by biochar [87]. Therefore, further research should be comprehensive and cover all direct and indirect aspects to give a complete picture for policy formulations. Most of the existing studies have adopted qualitative analysis on the impact mechanism of LUCES, while the quantitative evaluation was relatively lacking. Zhang et al., (2022) proposed that carbon transfer from the land–ocean continuum was a key component of the carbon cycle, while its response to global change lacked quantification [88]. Ruehr et al., (2023) pointed out that understanding the driving processes of carbon sink was critical for the conservation, management and planning of ecosystem services, and suggested that it was necessary to quantify the intensity and driving factors of terrestrial carbon sink [89]. The existing research on the mechanism of carbon emission impact provides a scientific research for quantitative evaluation of carbon emission impact from the perspective of land use. However, due to the lack of micro-scale data availability, the effect and mechanism of multi-scale heterogeneity on LUCES needed to be further analyzed [33,64]. Hence, the scientific problem of LUCES mechanism quantification analysis based on the perspective of multi-scale space-time fusion need to be further improved. It will help to identify the influencing factors and provide theoretical supports for the scientific formulation of reasonable differentiated carbon neutrality policies, and focus on their synergistic effects of pollution and carbon reduction [89].
Thirdly, interdisciplinary research and collaborative governance were potential solutions for achieving land use carbon neutrality. Based on recent published articles, research frontiers were summarized into three aspects. The first one was the correlation and impact between ecosystem services and LUCES, and has become a research hotspot in multidisciplinary fields. For example, scholars used the InVEST (Integrated Valuation of Ecosystem Services and Trade-offs), PLUS (Patch-generating Land Use Simulation) model or others to quantify land use carbon stock of the past, present and future [60]. The second one was the relationship and mutual influence between extreme climate and LUCES. For instance, Van Der Woude et al., (2022) found that temperature extremes in 2022 reduced carbon absorption in European forests [90]; Bennett pointed out that extreme EI Niño has temporarily caused tropical forests in South America to lose their carbon sink capacity [91]. Protecting forests (e.g., preventing wildfires, reducing deforestation) was one of the defenses against climate change. The third one was that, under the vision of carbon neutrality, land carbon management needs to be researched urgently [30,31,92]. Gatti et al. suggested that the inadequate implementation of environmental policies led to an increase in carbon emissions from the Amazon rainforest [30]. Winkler et al. pointed out that land use changes led to a decrease of land carbon sink in Eastern Europe [31] and an increase in Australia [93,94]. Future research needs to solve the problem of land use emission reduction and sink increase from a systematic perspective.
Finally, the present work performed a bibliometric analysis and review on LUCES research. The characteristics and hotspots of LUCES research were analyzed, which could lead to new research frontiers. Meanwhile, this work also had some limitations which could be improved in the future. For example, the data source for this article was the WoS platform; future work could consider other data platforms, such as CNKI or Scopus. Meanwhile, the overall research development trend of LUCES was considered in the research review, and some details may inevitably be missed. In addition, according to the literature review, the four scientific issues discussed above are likely to be hot topics for future research. Subsequent studies will further track the relevant literature, and meta-analysis can be used for more detailed analysis of each point. Nevertheless, in general, this research can help readers understand and grasp the overall research on LUCES.

5. Conclusions

At present, LUCES research has received increased attention in the scientific community. By conducting a bibliometric analysis and review on LUCES research, this work provides a comprehensive macro understanding of this research area.
First of all, we found that recent LUCES research has a rapid and active growing trend, which was highly consistent with international and national action on climate change and carbon emission reduction policy developments. For example, especially after 2019 (many countries’ proposed date to achieve the goal of carbon neutralization), the related publications (during 2020–2023) in LUCES research increased significantly in terms of country or institutional distribution, which were mainly performed by the USA, China, and the UK. The USA dominated this research field in the early stage, and China gradually dominated this research field in the later stage. In addition, based on the total number of published articles, the top journals were Journal of Cleaner Production, Sustainability, Environmental Research Letters, Science of The Total Environment and Land. It was found that science and technology—other topics, meteorology and atmospheric sciences, geology, environmental sciences and ecology were common research disciplines.
Secondly, according to the analysis of top 10 highly cited papers, the hot topics mainly focused on the accelerated dryland expansion, land use, GHG emissions, climate and carbon cycle, global fire emissions, global carbon budget and CO2 sink. The keyword cluster analysis in LUCES research revealed that the main topics were concentrated around climate change, carbon sequestration, land use and GHG emission, as well as reducing emissions from deforestation. From the analysis of theme evolution, the clustering themes included land use change, ecosystem services, sustainability, carbon sequestration, greenhouse gas emissions, carbon emissions, life cycle assessment, climate change, biofuels and agriculture. Based on the research frontier analysis, food security, carbon dioxide, sensitivity, nitrogen, model, impacts and productivity were the emergent words in the rapid growth stage (2011–2023).
Thirdly, this work briefly describes the research progress and future perspectives of LUCES research, which could help to give a comprehensive macro understanding. On the one hand, this work sorted out the definition and boundary of LUCES, generalized the related evaluation methods, and discussed from the point of view of the related influence factors. On the other hand, this work discussed three key scientific issues: the systematic quantification of land-based carbon emissions and sink, quantitative analysis of the impact mechanism, and interdisciplinary research and collaborative governance as potential areas to intervene in achieving land use carbon neutrality.

Author Contributions

Conceptualization, L.L. and J.Q.; methodology, L.L., J.Q., F.G., T.N.M. and S.W.; software, L.L. and Z.Z.; validation, S.A. and R.W.; formal analysis, S.A. and Z.Z.; writing—original draft preparation, L.L. and J.Q.; writing—review and editing, F.G., T.N.M. and S.W. All authors have read and agreed to the published version of the manuscript.

Funding

This work was funded by the National Natural Science Foundation of China (42171300), 2023 Longyuan Youth Innovation and Entrepreneurship Talent (Individual) Project (2023LQGR44), Lanzhou Youth Science and Technology Talent Innovation Project (2023-QN-25), Research on Technology Support for Carbon Peak and Carbon Neutrality Strategy of Lanzhou Branch Chinese Academy of Science and the Special Project on Document Information Capacity Building of Chinese Academy of Sciences, Sub-project. We also appreciate the editors and the anonymous reviewers for their constructive comments and suggestions on this manuscript.

Data Availability Statement

Publications of LUCES research in this work were from Web of Science (https://webofscience.clarivate.cn/wos/woscc/basic-search), accessed on 30 December 2023.

Acknowledgments

The authors would like to thank the anonymous referees and the editors for their helpful suggestions on the earlier draft of our paper.

Conflicts of Interest

The authors declare no conflicts of interest.

References

  1. IEA (International Energy Agency). The Breakthrough Agenda Report 2022. 2022. Available online: https://iea.blob.core.windows.net/assets/49ae4839-90a9-4d88-92bc-371e2b24546a/THEBREAKTHROUGHAGENDAREPORT2022.pdf (accessed on 1 October 2023).
  2. Friedlingstein, P.; O’Sullivan, M.; Jones, M.W.; Andrew, R.M.; Bakker, D.C.E.; Hauck, J.; Landschützer, P.; Quéré, C.L.; Luijkx, I.T.; Peters, G.P.; et al. Global carbon budget 2023. Earth Syst. Sci. Data 2023, 15, 5301–5369. [Google Scholar] [CrossRef]
  3. U.S. Department of Agriculture’s Forest Service. USDA Forest Service Report Highlights Threats to Forest, Rangeland Health over the Next 50 Years. 2023. Available online: https://www.fs.usda.gov/sites/default/files/fs_media/fs_document/2020-RPA-Assessment.pdf (accessed on 2 December 2023).
  4. EEA (European Environment Agency). Trends and Projections in Europe 2022. 2022. Available online: https://www.eea.europa.eu/publications/trends-and-projections-in-europe-2022 (accessed on 1 October 2023).
  5. Yu, Z.; Ciais, P.; Piao, S.L.; Hougthon, R.A.; Lu, C.Q.; Tian, H.Q.; Agathokleous, E.; Kattel, R.R.; Sitch, S.; Goll, D.; et al. Forest expansion dominates China’s land carbon sink since 1980. Nat. Commun. 2022, 458, 1009–1013. [Google Scholar] [CrossRef] [PubMed]
  6. Futurearth; The Earth League; World Climate Research Programme. 10 New Insights in Climate Science 2022. 2022. Available online: https://10insightsclimate.science/wp-content/uploads/2022/11/10NICS-2022-Report_digital.pdf (accessed on 1 October 2023).
  7. IEA (International Energy Agency). Credible Pathways to 1.5 °C: Four Pillars for Action in the 2020s. 2023. Available online: https://iea.blob.core.windows.net/assets/ea6587a0-ea87-4a85-8385-6fa668447f02/Crediblepathwaysto1.5C-Fourpillarsforactioninthe2020s.pdf (accessed on 2 December 2023).
  8. Chen, W.X.; Gu, T.C.; Fang, C.L.; Zeng, J. Global urban low-carbon transitions: Multiscale relationship between urban land and carbon emissions. Environ. Impact Assess. Rev. 2023, 100, 107076. [Google Scholar] [CrossRef]
  9. Zhou, Y.; Chen, M.X.; Tang, Z.P.; Mei, Z. Urbanization, land use change, and carbon emissions: Quantitative assessments for city-level carbon emissions in Beijing-Tianjin-Hebei region. Sustain. Cities Soc. 2021, 66, 102701. [Google Scholar] [CrossRef]
  10. Lin, Q.W.; Zhang, L.; Qiu, B.K.; Zhao, Y.; Wei, C. Spatiotemporal analysis of land use patterns on carbon emissions in China. Land 2021, 10, 141. [Google Scholar] [CrossRef]
  11. Hill, J.; Nelson, E.; Tilman, D.; Tiffany, D. Environmental, economic, and energetic costs and benefits of biodiesel and ethanol biofuels. Proc. Natl. Acad. Sci. USA 2006, 103, 11206–11210. [Google Scholar] [CrossRef]
  12. Fargion, J.; Hill, J.; Tilman, D.; Polasky, S.; Hawthorne, P. Land clearing and the biofuel carbon debt. Science 2008, 319, 1235–1238. [Google Scholar] [CrossRef]
  13. Van Der Werf, G.R.; Randerson, J.T.; Giglio, L.; Van Leeuwen, T.T.; Chen, Y.; Rogers, B.M.; Mu, M.; Van Marle, M.J.E.; Morton, D.C.; Collatz, G.J.; et al. Global fire emissions estimates during 1997–2016. Earth Syst. Sci. Data 2017, 9, 697–720. [Google Scholar] [CrossRef]
  14. Quéré, C.L.; Andrew, R.M.; Canadell, J.G.; Sitch, S.; Korsbakken, J.I.; Peters, G.P.; Manning, A.C.; Boden, T.A.; Tans, P.P.; Houghton, R.A.; et al. Global carbon budget 2016. Earth Syst. Sci. Data 2016, 8, 605–649. [Google Scholar] [CrossRef]
  15. Liu, Z.; Guan, D.B.; Wei, W.; Davis, S.J.; Ciais, P.; Bai, J.; Peng, S.S.; Zhang, Q.; Hubacek, K.; Marland, G.; et al. Reduced carbon emission estimates from fossil fuel combustion and cement production in China. Nature 2015, 524, 335–338. [Google Scholar] [CrossRef]
  16. Morán, M.A.T.; González, P.R. Structural factors affecting land-transport CO2 emissions: A European comparison. Transport. Res. Part D-Transport. Environ. 2007, 12, 239–253. [Google Scholar] [CrossRef]
  17. Yang, H.C.; Ma, J.T.; Jiao, X.Y.; Shang, G.F.; Yan, H.M. Characteristics and driving mechanism of urban construction land expansion along with rapid urbanization and carbon neutrality in Beijing, China. Land 2023, 12, 1388. [Google Scholar] [CrossRef]
  18. Zhang, C.B.; Hu, M.M.; Dong, L.; Xiang, P.C.; Zhang, Q.; Wu, J.B.; Li, B.; Shi, S.Y. Co-benefits of urban concrete recycling on the mitigation of greenhouse gas emissions and land use change: A case in Chongqing metropolis, China. J. Clean. Prod. 2018, 201, 481–498. [Google Scholar] [CrossRef]
  19. Aryapratama, R.; Pauliuk, S. Life cycle carbon emissions of different land conversion and woody biomass utilization scenarios in Indonesia. Sci. Total Environ. 2022, 805, 150226. [Google Scholar] [CrossRef]
  20. Wu, H.J.; Hanna, M.A.; Jones, D.D. Life cycle assessment of greenhouse gas emissions of feedlot manure management practices: Land application versus gasification. Biomass Bioenergy 2013, 54, 260–266. [Google Scholar] [CrossRef]
  21. Levasseur, A.; Lesage, P.; Margni, M.; Brandão, M.; Samson, R. Assessing temporary carbon sequestration and storage projects through land use, land-use change and forestry: Comparison of dynamic life cycle assessment with ton-year approaches. Clim. Chang. 2012, 115, 759–776. [Google Scholar] [CrossRef]
  22. Pacala, S.W.; Hurtt, G.C.; Baker, D.; Peylin, P.; Houghton, R.A.; Birdsey, R.A.; Heath, L.; Sundquist, E.T.; Stallard, R.F.; Ciais, P.; et al. Consistent land- and atmosphere-based U.S. carbon sink estimates. Science 2001, 292, 2316–2320. [Google Scholar] [CrossRef] [PubMed]
  23. Piao, S.L.; Huang, M.T.; Liu, Z.; Wang, X.H.; Ciais, P.; Canadell, J.G.; Wang, K.; Bastos, A.; Friedlingstein, P.; Houghton, R.A.; et al. Lower land-use emissions responsible for increased net land carbon sink during the slow warming period. Nat. Geosci. 2018, 11, 739–743. [Google Scholar] [CrossRef]
  24. Potter, C.; Klooster, S.; Hiatt, S.; Fladeland, M.; Genovese, V.; Gross, R. Satellite-derived estimates of potential carbon sequestration through afforestation of agricultural lands in the United States. Clim. Chang. 2007, 80, 323–336. [Google Scholar] [CrossRef]
  25. Hoekman, S.K.; Broch, A. Environmental implications of higher ethanol production and use in the U.S.: A literature review. Part II—Biodiversity, land use change, GHG emissions, and sustainability. Renew. Sustain. Energy Rev. 2018, 81, 3159–3177. [Google Scholar] [CrossRef]
  26. Bristow, M.; Hutley, L.B.; Beringer, J.; Livesley, S.J.; Edwards, A.C.; Arndt, S.K. Quantifying the relative importance of greenhouse gas emissions from current and future savanna land use change across northern Australia. Biogeosciences 2016, 13, 6285–6303. [Google Scholar] [CrossRef]
  27. Berger, S.; Bliefernicht, J.; Linstädter, A.; Canak, K.; Guug, S.; Heinzeller, D.; Hingerl, L.; Mauder, M.; Neidl, F.; Quansah, E.; et al. The impact of rain events on CO2 emissions from contrasting land use systems in semi-arid West African savannas. Sci. Total Environ. 2019, 647, 1478–1489. [Google Scholar] [CrossRef] [PubMed]
  28. Zhong, J.T.; Zhang, X.Y.; Guo, L.F.; Wang, D.Y.; Miao, C.H.; Zhang, X.L. Ongoing CO2 monitoring verify CO2 emissions and sinks in China during 2018–2021. Sci. Bull. 2023, 68, 2467–2476. [Google Scholar] [CrossRef] [PubMed]
  29. Marvin, D.C.; Sleeter, B.M.; Cameron, R.; Nelson, E.; Plantinga, A.J. Natural climate solutions provide robust carbon mitigation capacity under future climate change scenarios. Sci. Rep. 2023, 13, 19008. [Google Scholar] [CrossRef] [PubMed]
  30. Gatti, L.V.; Cunha, C.L.; Marani, L.; Cassol, H.L.G.; Messias, C.G.; Arai, E.; Denning, S.; Soler, L.S.; Almeida, C.; Setzer, A.; et al. Increased Amazon carbon emissions mainly from decline in law enforcement. Nature 2023, 621, 318–323. [Google Scholar] [CrossRef] [PubMed]
  31. Winkler, K.; Yang, H.; Ganzenmüller, R.; Fuchs, R.; Ceccherini, G.; Duveiller, G.; Grassi, G.; Pongratz, J.; Bastos, A.; Dhvidenko, A.; et al. Changes in land use and management led to a decline in Eastern Europe’s terrestrial carbon sink. Commun. Earth Environ. 2023, 4, 237. [Google Scholar] [CrossRef]
  32. Guedes, G.B.; Paganin, L.B.Z.; Borsato, M. Bibliometric and systemic analysis on material flow mapping and industrial ecosystems. J. Ind. Integr. Manag. 2018, 3, 1850001. [Google Scholar] [CrossRef]
  33. Liu, L.N.; Qu, J.S.; Maraseni, T.N.; Niu, Y.B.; Zeng, J.J.; Zhang, L.H.; Xu, L. Household CO2 emissions: Current status and future perspectives. Int. J. Environ. Res. Public Health 2020, 17, 7077. [Google Scholar] [CrossRef]
  34. Xu, Y.; Yang, Y.P.; Chen, X.N.; Liu, Y.X.Y. Bibliometric analysis of global NDVI research trends from 1985 to 2021. Remote. Sens. 2022, 14, 3967. [Google Scholar] [CrossRef]
  35. Chen, C.M. CiteSpace II: Detecting and visualizing emerging trends and transient patterns in scientific literature. J. Am. Soc. Inf. Sci. Technol. 2005, 57, 359–377. [Google Scholar] [CrossRef]
  36. Souza, L.; Bueno, C. City information modelling as a support decision tool for planning and management of cities: A systematic literature review and bibliometric analysis. Build. Environ. 2022, 207, 108403. [Google Scholar] [CrossRef]
  37. Huang, J.P.; Yu, H.P.; Guan, X.D.; Wang, G.Y.; Guo, R.X. Accelerated dryland expansion under climate change. Nat. Clim. Chang. 2016, 6, 166–171. [Google Scholar] [CrossRef]
  38. Riahi, K.; Vuuren, D.P.; Kriegler, E.; Edmonds, J.; Neill, B.C.O.; Fujimori, S.; Bauer, N.; Calvin, K.; Dellink, R.; Fricko, O.; et al. The shared socioeconomic pathways and their energy, land use, and greenhouse gas emissions implications: An overview. Glob. Environ. Change Hum. Policy Dimens. 2017, 42, 153–168. [Google Scholar] [CrossRef]
  39. Griscom, B.; Adams, J.; Ellis, P.W.; Houghton, R.A.; Lomax, G.; Miteva, D.A.; Schlesinger, W.H.; Shoch, D.; Siikamäki, J.V.; Smith, P.; et al. Natural climate solutions. Proc. Natl. Acad. Sci. USA 2017, 114, 11645–11650. [Google Scholar] [CrossRef] [PubMed]
  40. Poulter, B.; Frank, D.; Ciais, P.; Myneni, R.B.; Andela, N.; Bi, J.; Broquet, G.; Canadell, J.G.; Chevallier, F.; Liu, Y.Y.; et al. Contribution of semi-arid ecosystems to interannual variability of the global carbon cycle. Nature 2014, 509, 600–603. [Google Scholar] [CrossRef] [PubMed]
  41. Ahlström, A.; Raupach, M.R.; Schurgers, G.; Smith, B.; Arneth, A.; Jung, M.; Reichstein, M.; Canadell, J.G.; Friedlingstein, P.; Jain, A.K.; et al. The dominant role of semi-arid ecosystems in the trend and variability of the land CO2 sink. Science 2015, 348, 895–899. [Google Scholar] [CrossRef] [PubMed]
  42. Friedlingstein, P.; Jones, M.W.; O’Sullivan, M.; Andrew, R.M.; Hauck, J.; Peters, G.P.; Peters, W.; Pongrazt, J.; Sitch, S.; Quéré, C.L.; et al. Global carbon budget 2019. Earth Syst. Sci. Data 2019, 11, 1783–1838. [Google Scholar] [CrossRef]
  43. Giorgetta, M.A.; Jungclaus, J.; Reick, C.H.; Legutke, S.; Bader, J.; Böttinger, M.; Brovkin, V.; Crueger, T.; Esch, M.; Fieg, K.; et al. Climate and carbon cycle changes from 1850 to 2100 in MPI-ESM simulations for the Coupled Model Intercomparison Project phase 5. J. Adv. Model. Earth. Syst. 2013, 3, 572–597. [Google Scholar] [CrossRef]
  44. Liu, L.N.; Zeng, J.J.; Wu, X.N.; Qu, J.S.; Li, X.M.; Zhang, J.; Han, J.Y. Review on eco-environment research in the Yellow River Basin: A bibliometric perspective. Int. J. Environ. Res. Public Health 2022, 19, 11986. [Google Scholar] [CrossRef]
  45. Swisher, J.N. Cost and performance of CO2 storage in forestry projects. Biomass Bioenergy 1991, 1, 317–328. [Google Scholar] [CrossRef]
  46. Le Quéré, C.; Raupach, M.R.; Canadell, J.G.; Marland, G.; Bopp, L.; Ciais, P.; Conway, T.J.; Doney, S.C.; Feely, R.A.; Foster, P.; et al. Trends in the sources and sinks of carbon dioxide. Nat. Geosci. 2009, 2, 831–836. [Google Scholar] [CrossRef]
  47. Piao, S.L.; Fang, J.Y.; Ciais, P.; Peylin, P.; Huang, Y.; Sitch, S.; Wang, T. The carbon balance of terrestrial ecosystems in China. Nature 2009, 458, 1009–1013. [Google Scholar] [CrossRef]
  48. Gonzalez-Salazar, M.A.; Venturini, M.; Poganietz, W.R.; Finkenrath, M.; Kirsten, T.; Acevedo, H.; Spina, P.G. A general modeling framework to evaluate energy, economy, land-use and GHG emissions nexus for bioenergy exploitation. Appl. Energy 2016, 178, 223–249. [Google Scholar] [CrossRef]
  49. Pereira, N.; Bonduki, Y.; Perdomo, M. Potential options to reduce GHG emissions in Venezuela. Appl. Energy 1997, 56, 265–286. [Google Scholar] [CrossRef]
  50. Searchinger, T.; Heimlich, R.; Honghton, R.A.; Dong, F.X.; Elobeid, A.; Fabiosa, J.; Tokgoz, S.; Hayes, D.; Yu, T.H. Use of U.S. Croplands for biofuels increases greenhouse gases through emissions from land-use change. Science 2009, 319, 1238–1240. [Google Scholar] [CrossRef]
  51. Pan, Y.; Birdsey, R.A.; Fang, J.Y.; Houghton, R.; Kauppi, P.E.; Kurz, W.A.; Phillips, O.L.; Shvidenko, A.; Lewis, S.; Canadell, J.G.; et al. A large and persistent carbon sink in the world’s forests. Science 2011, 333, 988–993. [Google Scholar] [CrossRef] [PubMed]
  52. Bhan, M.; Gingrich, S.; Roux, N.; Noë, J.L.; Kastner, T.; Matej, S.; Schwarzmueller, E.; Erb, K.H. Quantifying and attributing land use-induced carbon emissions to biomass consumption: A critical assessment of existing approaches. J. Environ. Manag. 2021, 286, 112228. [Google Scholar] [CrossRef] [PubMed]
  53. Wu, H.; Fang, S.M.; Zhang, C.; Hu, S.W.; Nang, D.; Yang, Y.Y. Exploring the impact of urban form on urban land use efficiency under low-carbon emission constraints: A case study in China’s Yellow River Basin. J. Environ. Manag. 2006, 311, 114866. [Google Scholar] [CrossRef] [PubMed]
  54. Marques, A.; Martins, I.S.; Kastner, T.; Plutzar, C.; Theurl, M.C.; Eisenmenger, N.; Huijbregts, M.A.J.; Wood, R.; Stadler, K.; Bruckner, M.; et al. Increasing impacts of land use on biodiversity and carbon sequestration driven by population and economic growth. Nat. Ecol. Evol. 2019, 3, 628–637. [Google Scholar] [CrossRef] [PubMed]
  55. Liu, W.G.; Yan, Y.; Wang, D.X.; Ma, W. Integrate carbon dynamics models for assessing the impact of land use intervention on carbon sequestration ecosystem service. Ecol. Indic. 2018, 91, 268–277. [Google Scholar] [CrossRef]
  56. Fischer-Kowalski, M. Society’s metabolism: The intellectual history of material flow analysis, Part I, 1860–1970. J. Ind. Ecol. 1998, 2, 61–78. [Google Scholar] [CrossRef]
  57. Saeki, T.; Patra, P.K. Implications of overestimated anthropogenic CO2 emissions on East Asian and global land CO2 flux inversion. Geosci. Lett. 2017, 4, 9. [Google Scholar] [CrossRef]
  58. Newell, J.P.; Vos, R.O. Accounting for forest carbon pool dynamics in product carbon footprints: Challenges and opportunities. Environ. Impact Assess. Rev. 2012, 37, 23–36. [Google Scholar] [CrossRef]
  59. Zhang, G.L.; Zhang, N.; Liao, W.M. How do population and land urbanization affect CO2 emissions under gravity center change? A spatial econometric analysis. J. Clean. Prod. 2018, 202, 510–523. [Google Scholar] [CrossRef]
  60. Wei, B.; Kasimu, A.; Reheman, R.; Zhang, X.L.; Zhao, Y.Y.; Aizizi, Y.; Liang, H.W. Spatiotemporal characteristics and prediction of carbon emissions/absorption from land use change in the urban agglomeration on the northern slope of the Tianshan Mountains. Ecol. Indic. 2023, 151, 110329. [Google Scholar] [CrossRef]
  61. Ehrlich, P.R.; Holdren, J.P. The impact of population growth. Science 1971, 171, 1212–1217. [Google Scholar] [CrossRef] [PubMed]
  62. Mahony, T.O. Decomposition of Ireland’s carbon emissions from 1990 to 2010: An extended kaya identity. Energy Policy 2013, 59, 573–581. [Google Scholar] [CrossRef]
  63. Liu, L.N.; Qu, J.S.; Clarke-Sather, A.; Maraseni, T.; Pang, J. Spatial variations and determinants of per capita household CO2 emissions (PHCEs) in China. Sustainability 2017, 9, 1277. [Google Scholar] [CrossRef]
  64. Liu, L.N.; Qu, J.S.; Zhang, Z.Q.; Zeng, J.; Wang, J.; Dong, L.; Pei, H.; Liao, Q. Assessment and determinants of per capita household CO2 emissions (PHCEs) based on capital city level in China. J. Geogr. Sci. 2018, 28, 1467–1484. [Google Scholar] [CrossRef]
  65. Qu, J.S.; Liu, L.N.; Zeng, J.J.; Zhang, Z.; Wang, J.; Pei, H.; Dong, L.; Liao, Q.; Maraseni, T. The impact of income on household CO2 emissions in China based on a large sample survey. Sci. Bull. 2019, 64, 351–353. [Google Scholar] [CrossRef]
  66. Liu, C.H.; Li, K.Q. Mapping the field: A bibliometric analysis of land use and carbon emissions (LUCE) research from 1987 to 2018. Libr. Hi Tech 2023, 12, 1220. [Google Scholar] [CrossRef]
  67. Wang, M.; Wang, Y.; Wu, Y.M.; Yue, X.L.; Wang, M.J.; Hu, P.P. Identifying the spatial heterogeneity in the effects of the construction land scale on carbon emissions: Case study of the Yangtze River Economic Belt, China. Environ. Res. 2022, 212, 113397. [Google Scholar] [CrossRef]
  68. Kang, T.T.; Wang, H.; He, Z.Y.; Liu, Z.Y.; Ren, Y.; Zhao, P.J. The effects of urban land use on energy-related CO2 emissions in China. Sci. Total Environ. 2023, 870, 161873. [Google Scholar] [CrossRef] [PubMed]
  69. Zhang, M.M.; Zhang, Z.Y.; Tong, B.; Ren, B.; Zhang, L.; Lin, X.H. Analysis of the coupling characteristics of land transfer and carbon emissions and its influencing factors: A case study of China. Front. Environ. Sci. 2023, 10, 1105552. [Google Scholar] [CrossRef]
  70. Qu, J.S.; Liu, L.N.; Zeng, J.J.; Maraseni, T.N.; Zhang, Z.Q. City-level determinants of household CO2 emissions per person: An empirical study based on a large survey in China. Land 2022, 11, 925. [Google Scholar] [CrossRef]
  71. Chakir, R.; De Cara, S.; Bruno, V. Price-induced changes in greenhouse gas emissions from agriculture, forestry, and other land use: A spatial panel econometric analysis. Rev. Économique 2017, 68, 471–490. [Google Scholar] [CrossRef]
  72. Lu, X.L.; Kicklighter, D.W.; Melillo, J.M.; Reilly, J.M.; Xu, L.Y. Land carbon sequestration within the conterminous United States: Regional- and state-level analyses. Biogeosciences 2015, 120, 379–398. [Google Scholar] [CrossRef]
  73. Guo, Y.X.; Boughton, E.; Qiu, J.X. Interactive effects of land-use intensity, grazing and fire on decomposition of subtropical seasonal wetlands. Ecol. Indic. 2021, 132, 108301. [Google Scholar] [CrossRef]
  74. Shirkey, G.; John, R.; Chen, J.Q.; Kolluru, V.; Amirkhiz, R.G.; Marquart-Pyatt, S.T.; Cooper, L.T.; Collins, M. Land cover change and socioecological influences on terrestrial carbon production in an agroecosystem. Landsc. Ecol. 2023, 38, 3845–3867. [Google Scholar] [CrossRef]
  75. Turner, D.P.; Ritts, W.D.; Yang, Z.Q.; Kennedy, R.E.; Cohen, W.B.; Duane, M.V.; Thornton, P.E.; Law, B.E. Decadal trends in net ecosystem production and net ecosystem carbon balance for a regional socioecological system. For. Ecol. Manag. 2011, 262, 1318–1325. [Google Scholar] [CrossRef]
  76. Ye, X.; Chuai, X.W. Carbon sinks/sources’ spatiotemporal evolution in China and its response to built-up land expansion. J. Environ. Manag. 2022, 321, 115863. [Google Scholar] [CrossRef]
  77. Wang, Y.Y.; Ding, Z.Y.; Ma, Y.M. Data processing uncertainties may lead to an overestimation of the land carbon sink of the Tibetan Plateau. Proc. Natl. Acad. Sci. USA 2022, 119, e2202343119. [Google Scholar] [CrossRef]
  78. Futurearth; The Earth League; World Climate Research Programme. 10 New Insights in Climate Science 2023/2024. 2023. Available online: https://10insightsclimate.science/ (accessed on 2 December 2023).
  79. Krcmar, E.; Stennes, B.; Kooten, G.C.V.; Vertinsky, I. Carbon sequestration and land management under uncertainty. Eur. J. Oper. Res. 2001, 135, 616–629. [Google Scholar] [CrossRef]
  80. Schimel, D.S.; House, J.I.; Hibbard, K.A.; Bousquet, P.; Ciais, P.; Peylin, P.; Braswell, B.H.; Apps, M.J.; Baker, D.; Bondeau, A.; et al. Recent patterns and mechanisms of carbon exchange by terrestrial ecosystems. Nature 2001, 414, 169–172. [Google Scholar] [CrossRef]
  81. Wang, Y.L.; Tian, X.J.; Chevallier, F.; Johnson, M.S.; Philip, S.; Baker, D.F.; Schuh, A.E.; Deng, F.; Zhang, X.Y.; Zhang, L. Constraining China’s land carbon sink from emerging satellite CO2 observations: Progress and challenges. Glob. Chang. Biol. 2022, 28, 6838–6846. [Google Scholar] [CrossRef]
  82. Janssens, I.A.; Freibauer, A.; Ciais, P.; Smith, P.; Nabuurs, G.J.; Schlamadinger, B.; Hutjes, R.W.A.; Ceulemans, R.; Schulze, E.D.; Valentini, R.; et al. Europe’s terrestrial biosphere absorbs 7 to 12% of European anthropogenic CO2 emissions. Science 2003, 300, 1538–1542. [Google Scholar] [CrossRef] [PubMed]
  83. The White House. National Strategy to Advance an Integrated U.S. Greenhouse Gas Measurement, Monitoring, and Information System. 2023. Available online: https://www.whitehouse.gov/wp-content/uploads/2023/11/NationalGHGMMISStrategy-2023.pdf (accessed on 2 December 2023).
  84. Presented by the Greenhouse Gas Monitoring & Measurement Interagency Working Group. Federal Strategy to Advance Greenhouse Gas Emissions Measurement and Monitoring for the Agriculture and Forest Sectors. 2023. Available online: https://www.usda.gov/sites/default/files/documents/Draft-Federal-Ag-and-Forest-MMRV-Strategy.pdf (accessed on 2 December 2023).
  85. Maraseni, T.N.; An-Vo, D.A.; Mushtaq, S.; Reardon-Smith, K. Carbon smart agriculture: An integrated regional approach offers significant potential to increase profit and resource use efficiency, and reduce emissions. J. Clean. Prod. 2021, 282, 124555. [Google Scholar] [CrossRef]
  86. Maraseni, T.N.; Cockfield, G. Does the adoption of zero tillage reduce greenhouse gas emissions? An assessment for the grains industry in Australia. Agric. Syst. 2011, 104, 451–458. [Google Scholar] [CrossRef]
  87. Dumortier, J.; Dokoohaki, H.; Elobeid, A.; Hayes, D.; Laird, D.; Miguez, F.E. Global land-use and carbon emission implications from biochar application to cropland in the United States. J. Clean. Prod. 2020, 258, 120684. [Google Scholar] [CrossRef]
  88. Zhang, H.C.; Lauerwald, R.; Ciais, P.; Oost, K.V.; Guenet, B.; Regnier, P. Global changes alter the amount and composition of land carbon deliveries to European rivers and seas. Nat. Rev. Earth Environ. 2022, 3, 245. [Google Scholar] [CrossRef]
  89. Ruehr, S.; Keenan, T.F.; Williams, C.; Zhou, Y.; Lu, X.C.; Bastos, A.; Canadell, J.G.; Prentice, I.C.; Sitch, S.; Terrer, C. Evidence and attribution of the enhanced land carbon sink. Nat. Rev. Earth Environ. 2023, 4, 518–534. [Google Scholar] [CrossRef]
  90. Van Der Woude, A.M.; Peters, W.; Joetzjer, E.; Lafont, S.; Koren, G.; Ciais, P.; Ramonet, M.; Xu, Y.D.; Bastos, A.; Botía, S.; et al. Temperature extremes of 2022 reduced carbon uptake by forests in Europe. Nat. Commun. 2023, 14, 6218. [Google Scholar] [CrossRef] [PubMed]
  91. Bennett, A.C.; De Sousa, T.R.; Monteagudo-Mendoza, A.; Esquivel-Muelbert, A.; Morandi, P.S.; De Souza, F.C.; Castro, W.; Duque, L.F.; Llampazo, G.F.; Dos Santos, R.M.; et al. Sensitivity of South American tropical forests to an extreme climate anomaly. Nat. Clim. Chang. 2023, 13, 967–974. [Google Scholar] [CrossRef]
  92. Hu, W.B.; Li, Z.F.; Chen, D.L.; Zhu, Z.Y.; Peng, X.T.; Liu, Y.B.; Liao, D.M.; Zhao, K. Unlocking the potential of collaborative innovation to narrow the inter-city urban land green use efficiency gap: Empirical study on 19 urban agglomerations in China. Environ. Impact Assess. Rev. 2024, 104, 107341. [Google Scholar] [CrossRef]
  93. Maraseni, T.N.; Cockfield, G. Crops, cows or timber? Including carbon values in land use choices. Agric. Ecosyst. Environ. 2011, 140, 280–288. [Google Scholar] [CrossRef]
  94. Maraseni, T.N.; Cockfield, G.; Apan, A. A comparison of greenhouse gas emissions from inputs into farm enterprises in Southeast Queensland, Australia. J. Environ. Sci. Health Part A 2007, 42, 11–18. [Google Scholar] [CrossRef]
Figure 1. The framework of this study’s analysis process.
Land 13 00279 g001
Figure 2. Number of publications in LUCES research from 1991 to 2023.
Land 13 00279 g002
Figure 3. Number of publications in LUCES research by top 10 countries.
Land 13 00279 g003
Figure 4. The national cooperation network on LUCES research. (a) Publications of total; (b) publications of “NSP”.
Land 13 00279 g004
Figure 5. The institutional cooperation network on LUCES research. (a) Publications of total; (b) publications of “NSP”.
Land 13 00279 g005
Figure 6. The journal citation network on LUCES research.
Land 13 00279 g006
Figure 7. Top 10 research categories of LUCES research. (a) Publications of total; (b) of “NSP”.
Land 13 00279 g007
Figure 8. Keyword co-occurrence network map in LUCES research. (a) Total publications during 1991–2023; (b) publications of “NSP” during 1991–2023.
Land 13 00279 g008
Figure 9. The keyword bubble diagram of LUCES research in different periods. Top 10 keywords during (a) 1991–2000; (b) 2001–2010; and (c) 2011–2023.
Land 13 00279 g009
Figure 10. Top keywords with the strongest citation bursts in LUCES research. (a) Total publications during 2001–2023; (b) publications of “NSP” during 2001–2023.
Land 13 00279 g010
Figure 11. Summary of LUCES research from the following aspects: definition and boundary, evaluation method and influence mechanism.
Land 13 00279 g011
Table 1. Top 10 productive institutions in LUCES research.
RankInstitutionsCountryNumberRatio (%)
1Chinese Academy of SciencesChina3862.19
2Wageningen UniversityNetherlands1120.64
3Beijing Normal UniversityChina1010.57
4International Institute for Applied Systems AnalysisAustria920.52
5University of MarylandUSA920.52
6National Institute for Environmental StudiesJapan760.43
7University of ExeterUK730.41
8Utrecht UniversityNetherlands730.41
9United States Forest ServiceUSA700.40
10Peking UniversityChina670.38
Table 2. Top 10 productive journals in LUCES research.
RankJournalsNumberRatio (%)2022 IFJCRCountry
1Journal of Cleaner Production2494.0711.1Q1USA
2Sustainability2263.703.9Q2Switzerland
3Environmental Research Letters1742.846.7Q1UK
4Science of the Total Environment1442.359.8Q1Netherlands
5Land1272.083.9Q2Switzerland
6Energy Policy961.579.0Q1UK
7Global Change Biology931.5211.6Q1UK
8Journal of Environmental Management901.478.7Q1UK
9Biomass & Bioenergy891.466.0Q2UK
10Land Use Policy891.467.1Q1UK
Table 3. Top 10 highly cited scientific papers in LUCES research.
No.TitleFirst AuthorJournal SourceYearTimes
1Accelerated dryland expansion under climate changeHuang, JianpingNature Climate Change20161439
2The Shared Socioeconomic Pathways and their energy, land use, and greenhouse gas emissions implications: An overviewRiahi, KeywanGlobal Environmental Change-Human and Policy Dimensions20171433
3Natural climate solutionsGriscom, Bronson W.PNAS20171324
4Climate and carbon cycle changes from 1850 to 2100 in MPI-ESM simulations for the Coupled Model Intercomparison Project phase 5Giorgetta, Marco A.Journal of Advances in Modeling Earth Systems20131119
5Global fire emissions estimates during 1997–2016van der Werf, Guido R.Earth System Science Data20171029
6Reduced carbon emission estimates from fossil fuel combustion and cement production in ChinaLiu, ZhuNature20151022
7Global Carbon Budget 2016Le Quéré, CorinneEarth System Science Data2016943
8Contribution of semi-arid ecosystems to interannual variability of the global carbon cycle Poulter, BenjaminNature2014935
9Global Carbon Budget 2019Friedlingstein, PierreEarth System Science Data2019922
10The dominant role of semi-arid ecosystems in the trend and variability of the land CO2 sink Ahlstrom, AndersScience2015898
Disclaimer/Publisher’s Note: The statements, opinions and data contained in all publications are solely those of the individual author(s) and contributor(s) and not of MDPI and/or the editor(s). MDPI and/or the editor(s) disclaim responsibility for any injury to people or property resulting from any ideas, methods, instructions or products referred to in the content.

