Article

Spatiotemporal Patterns and Coupling Coordination Analysis of Multiscale Social–Economic–Ecological Effects in Ecologically Vulnerable Areas Based on Multi-Source Data: A Case Study of the Tuha Region, Xinjiang Province

1
College of Earth Sciences, Guilin University of Technology, Guilin 541004, China
2
Technology and Engineering Center for Space Utilization, Chinese Academy of Sciences, Beijing 100094, China
3
Institute of Aerospace Information Innovation, Chinese Academy of Sciences, Beijing 100094, China
4
School of Computer Science and Engineering, Guilin Institute of Aerospace Industry, Guilin 541004, China
5
School of Surveying and Geoinformation Engineering, East China University of Technology, Nanchang 330013, China
*
Author to whom correspondence should be addressed.
Land 2024, 13(3), 282; https://doi.org/10.3390/land13030282
Submission received: 23 January 2024 / Revised: 21 February 2024 / Accepted: 22 February 2024 / Published: 24 February 2024

Abstract

:
Ecologically fragile areas are confronted with the contradiction between economic development and ecological protection, especially in the Tuha region (Turpan and Hami), where the extremely vulnerable ecological environment limits local sustainable development. To address this, this study utilizes POI (Point of Interest) data, land use, and socioeconomic statistical data to achieve spatial quantification of indicators on a kilometer grid scale, constructing a multi-factor, multi-dimensional evaluation system for the socioeconomic and ecological effects of sustainable development based on SDGs (Sustainable Development Goals). The entropy method, comprehensive evaluation method, coupling coordination degree model, and geographical detector method are used to analyze the coupling relationships between systems at different scales and the factors influencing the system’s coupling coordination degree. The results indicate that from 2010 to 2020, the economic, social, and ecological systems of the Tuha region, as well as their comprehensive scores, exhibited spatial similarity. The economic system showed an upward trend, the social system displayed an inverted U-shaped trend of rising then declining, while the ecological system presented a U-shaped trend of declining then increasing. At the county scale, the coupling coordination degree closely approximates the trend of the comprehensive coordination index, showing a continuous upward trajectory. Compared with Turpan city, Hami city, especially Yizhou district, exhibits the best development in coupling coordination degree, while the growth in coupling coordination degree is most significant in Gaochang district. The main factors influencing the degree of coupling coordination are grain production and GDP (gross domestic product). This study provides a new perspective on the quantification of sustainable development indicators, which is of great significance for balancing economic and social development with ecological protection and promoting the coupled and coordinated development of society, economy, and ecology in ecologically fragile areas.

1. Introduction

Ecologically fragile areas refer to those regions where, due to harsh natural conditions or the impact of human activities, the ecological environment is highly susceptible to damage, biodiversity loss is severe, and the functionality of ecosystems significantly deteriorates. The characteristics of ecologically fragile areas include an ecological balance that is easily disrupted. Once damaged, their recovery process is slow and fraught with difficulties [1,2]. China has one of the largest distributions of ecologically fragile areas of all countries worldwide, as well as the largest number of fragile ecological types and the most obvious manifestations of ecological fragility [3,4,5]. Since the 18th National Congress of the People’s Republic of China, the construction of an ecological civilization has been adopted as the basis for the sustainable development of the Chinese nation, and many pioneering works have been implemented, particularly in ecologically fragile areas such as arid and semiarid areas; furthermore, investment in ecological environmental protection has increased. According to the National Ecologically Fragile Areas Protection Plan Outline issued by the Environmental Protection Bureau, eight typical ecologically fragile areas in China cover 21 provinces and cities [5]. These areas, which are widely distributed and large, are mostly located in areas where economic and social development are lagging. The conflict between economic and social development and ecological environment construction in these areas has become a significant problem restricting local development; ecologically fragile areas have presented major challenges. Academic research on the coordinated development of these three systems in ecologically fragile areas has grown [5]. Tuha region is located in the eastern part of Xinjiang, characterized by its unique geographical, environmental, and socioeconomic features, and its potential value in addressing broader regional and even global issues. The geographical and environmental conditions of the Tuha region are representative. The Tuha region is one of the driest areas in the world, characterized by an extremely arid climate, with little rainfall, a mountain–basin structure, an annual average precipitation of only about 20 mm, and an evaporation rate exceeding 3000 mm. At the same time, the ecosystem in this region is extremely fragile. The climate within the basin is dry, and vegetation is sparse, making it particularly sensitive to natural variations and human activities. Human activities such as overgrazing, land development, and irrational utilization of water resources could have a serious impact on the ecological balance of this area. Issues such as soil salinization and water scarcity provide important case studies for research on ecological restoration, sustainable management, and the protection of fragile ecosystems [6,7]. Therefore, the Tuha region, as a research area, is chosen not only for its unique geographical and environmental conditions but also for the specific environmental and socioeconomic issues it faces, as well as the universality and importance of these issues on a global scale. Research on the Tuha region can provide important strategies and solutions for addressing challenges faced by globally fragile ecological areas and also make contributions to global issues such as sustainable development. Ecology, society, and the economy are interrelated, and the degree of coordinated development among them directly affects the overall development level of a region. Therefore, an in-depth study of the social, economic, and ecological effects of the Tuha region and the degree of their coordinated development is imperative.
Ecosystem services (ESs) refer to the direct and indirect benefits that natural ecosystems provide to human society. This concept highlights the close connection between human well-being and healthy ecosystems [8]. By assessing and quantifying certain services, we can better manage and protect natural resources, achieving sustainable development for human society [9,10,11]. Currently, models for evaluating ESs primarily include CASA (Carnegie–Ames–Stanford Approach), RULSE (Revised Universal Soil Loss Equation), SWAT (Soil and Water Assessment Tool), SolVES (Soil and Water Assessment Tool), and InVEST (Integrated Valuation of Ecosystem Services and Tradeoffs), among others [12]. Particularly, the InVEST 3.12.1 model, as standalone open-source software, is widely adopted in the field of ESs assessment due to its user-friendly interface, low data requirements, and powerful visualization capabilities [13,14,15]. However, research on the InVEST model’s application in ecosystem services assessment has been mainly focused on the central and eastern parts of China, with insufficient attention to ecologically fragile areas; in particular, research on the Tuha region in Xinjiang is very limited. The Tuha region is not only a key part of the national energy strategy but also has been facing an increasing number of ecological and environmental challenges over the past 30 years due to rapid economic and social development. Therefore, assessing the ecosystem services in the Tuha region is indispensable. The connection between ecosystem services and the economy is crucial for achieving sustainable development. These services directly or indirectly support economic activities such as agriculture, forestry, fisheries, and tourism. They not only provide raw materials for production but also ensure the natural stability required during the production process, and are closely related to human well-being and health. Recognizing and assessing these services in the economic decision-making process is of great significance for promoting sustainable development in regions [16].
In September 2015, the United Nations adopted the “2030 Agenda for Sustainable Development”, which established 17 goals, 169 targets, and 232 indicators [17,18,19], aimed at guiding global development over the next 15 years. It also calls for global data support and indicator monitoring [20,21]. Scholars have developed localized indicators based on the SDGs to monitor and assess the progress of achieving sustainable development [22,23]. Due to the complexity of the SDG indicator system, monitoring and evaluation pose challenges, especially since statistical data struggle to reflect regional details and spatial differences, nor can they accurately represent their distribution in space. Consequently, the United Nations emphasizes the importance of geographic information in the evaluation of SDGs and has initiated efforts to promote multi-level research and applications [24]. Domestic scholars have attempted to calculate and rate SDG indicators by combining geospatial and statistical data [25]. However, research on the quantitative assessment of ecologically fragile areas oriented toward SDGs is still lacking. Therefore, by integrating multi-source data, it is possible to break the limitations of SDG indicators confined by administrative boundaries. This approach involves spatially quantifying localized SDG indicators at a kilometer grid scale, ultimately achieving the geographic spatial visualization of each indicator. Through this process, a localized SDG sustainable development indicator system can be constructed.
When exploring paths to sustainable development, the coupled and coordinated development of society, economy, and ecology becomes increasingly important. A localized indicator system based on the SDGs provides a concrete framework for a deeper investigation into this coupled and coordinated development. Many scholars have assessed regional sustainability from various perspectives using different evaluation systems, such as the PSR (Pressure–State–Response) framework, ecological footprint, Human Development Index, and green GDP [26,27,28,29]. However, ecology, society, and economy are inseparable entities, and there is a lack of comprehensive research on these three aspects and their combined effects. The Tuha region, as an ecologically fragile area and an important energy base, urgently needs to assess the degree of coupled and coordinated development of its socioeconomic and ecological effects in the context of rapid economic growth and escalating environmental issues to support the national strategy for the development of the western regions. Currently, comprehensive research on the Tuha region is insufficient, and its coupled development status and influencing factors require further in-depth analysis.
Coupled coordination refers to the phenomenon in which two or more systems, under each other’s constant self or external interaction, reach a certain level of synergy [30,31,32]. The coupled coordination relationship in coordinated regional development has been a hot topic of research for scholars in China and worldwide; related research has achieved many results. In recent years, research on the interrelationship between the ecological environment and society and the economy has gradually shifted from qualitative analysis to quantitative analysis [33]. Foreign scholars have studied the coupling relationship between the ecological environment and economic development by applying the Environmental Kuznets Curve (EKC) [34,35] and the Pressure–State–Response (PSR) model [36]. Moreover, the relationship between ecological environmental protection and socioeconomic development has been explored via input–output models and GEE (Google Earth Engine) models, and the study area has been dominated by small-scale units such as industrial zones, villages, and cities [37,38]. Ecological, economic, resource-based, and societal perspectives [39,40] have been adopted by domestic scholars to construct theories and modeling methods that utilize quantitative evaluation [41]; these include comprehensive indicator evaluation methods [42], ecological footprint methods [43], energy value analysis methods [44], and material flow analysis methods [45]. In terms of research methodology, the coupled coordination degree model in physics is the most dominant and widely recognized research method [46]. The selection of evaluation indicators has gradually evolved from single indicators to composite indicators [47]. Study area scales have considered the whole country [48], key regions [49,50], provinces [51], urban agglomerations [52,53], and watersheds [54]. However, few studies have applied the SDG framework to the measurement of coupled social–economic–ecological coordination; comparative empirical studies at the grid scale and county scale are lacking. Furthermore, research on further integrating the spatial and temporal changes and multiscale characteristics of coupled coordination among society, economy, and ecology subsystems based on the SDGs is lacking; this type of research is explicitly needed to support spatial planning [55]. Current research on coupled coordination development has focused mostly on the spatial and temporal distributions and evolutionary characteristics of coupling relationships [56]. However, few studies have further explored the influencing factors behind these relationships and their driving mechanisms, and even fewer studies have examined the factors influencing changes in the degree of coupling coordination among the three socioeconomic and ecological dimensions in different regions.
Therefore, to fill the above research gaps, this study used the Tuha region as the study area and, based on the InVEST model, first explored the changes in the spatiotemporal patterns of ecosystem services in a typical ecologically fragile area (the Tuha region). On this basis, a set of localized social–economic–ecological effect evaluation systems based on the SDGs was constructed using the SDGs as a framework and based on the regional characteristics of the Tuha region. By combining land use data, POI data, and other multisource data, geographic information was used to address the difficulties associated with SDG data monitoring, and the scale of the data was more finely identified, allowing us to overcome the administrative boundaries of SDG indicators. We innovatively simulated the SDG indicators of social, economic, and ecological systems at the spatial quantification of kilometer grid scale and completed the geospatial visualization of each indicator. We also developed ideas and methods for data refinement. On this basis, the entropy weight method, comprehensive evaluation method, and coupled coordination degree model were used to explore the spatiotemporal change process of the sustainable development level of the Tuha region from 2010 to 2020 and to compare and analyze the different changes at the grid scale and county scale. Finally, the GeoDetector model was used to study the extent of the influence of different factors on the degree of coupled social–economic–ecological coordination in the Tuha region to better reflect the regional differences. This study provides new quantitative ideas for SDGs with the help of geospatial information and new research ideas for sustainable development. Moreover, this study aims to comprehensively respond to the social, economic, and ecological development conditions of the Tuha region. By leveraging geospatial information, it provides a new quantitative approach for the Sustainable Development Goals, offering fresh research perspectives for sustainable development. It not only enhances the scientific validity of the indicators but also improves the representativeness of the results. This lays a scientific foundation for evaluating the implementation of regional ecological construction and socioeconomic planning policies and provides a theoretical basis for exploring the coupling coordination development model.

2. Materials and Methods

2.1. Study Area

The Tuha region (41°18′~43°43′ N, 86°40′~96°04′ E), under the jurisdiction of “two districts and four counties”, is the collective name for Turpan city (including Gaochang district, Shanshan county, and Toksun county) and Hami city (including Yizhou district, Barkol Kazak Autonomous county, and Yiwu county). The Tuha region is located in the eastern part of Xinjiang province and is surrounded by mountains; moreover, it contains the ancient Silk Road and serves as an important hub connecting Xinjiang with the mainland [57]. The region has a total area of approximately 207,000 km2 (as shown in Figure 1). The Tuha region has a dry climate, sparse vegetation, and an extreme lack of water resources. Its average annual precipitation is approximately 20 mm and evaporation is greater than 3000 mm. It also experiences severe land desertification and has an extremely fragile ecological environment. The Tuha region faces challenges not only from natural conditions but also from human activities such as overgrazing, improper land development, and irrational use of water resources. These issues are not limited to the Tuha region but are common problems faced by many ecologically fragile areas globally. Therefore, as a research subject, the Tuha region can provide valuable information on the ecosystem functions, coupling and coordination capabilities, and impacts of human activities in fragile ecological areas. It can also offer references and lessons for ecological protection and sustainable development in similar environments worldwide.

2.2. Data Sources and Preprocessing

The data used in this study included three periods of land use raster data (30 m spatial resolution) from 2010, 2015, and 2020; meteorological data, including monthly precipitation, air temperature, and potential evapotranspiration datasets; soil data; DEM (Digital Elevation Model) data; and POI data obtained through the Gaode Map Crawler. Statistical data, such as GDP and food production data, were obtained from the Xinjiang Statistical Yearbook, Turpan Statistical Yearbook, and Hami Statistical Yearbook. These raster data were processed uniformly in ArcGIS 10.8 with a resolution of 30 m. The coordinate system for all spatial data was uniformly distributed as WGS_1984_UTM_zone_46N (Table 1).

2.3. Methods

2.3.1. Land Use Changes

The land use transfer matrix can be used to analyze the direction and area of conversion of one land use type or cover structure to another land use type or cover structure type [58]. The ecological environment in the Tuha region is fragile, and land resources are scarce. Rational and effective monitoring and management of land use changes are crucial for protecting the ecological environment, promoting economic development, and achieving regional sustainable development. The formula is as follows:
A i j = A 11 A 1 n A n 1 A n n
where A i is the land area of category i before the transfer, A j is the land area of category j after the transfer, and n is the number of land use types.

2.3.2. Ecosystem Services Evaluation

More than 80% of the land in the Turpan oasis has moderate vulnerability, nearly 14% of the land has severe vulnerability, and the ecological vulnerability inside the oasis is significantly lower than that outside the oasis [59]. The continuous deterioration of the ecosystem in the Tuha region poses a significant threat to its social, economic, and ecological coordinated sustainable development. The InVEST model, through its modules for water yield (WY) [60], soil conservation (SC) [61], carbon storage (CS) [62], and habitat quality (HQ) [63], can conduct a comprehensive assessment of ecosystem services (Table 2). This assessment helps in deeply understanding the current state of ecosystem services in the Tuha region and their potential contributions to regional development, providing important support for formulating scientific ecological protection and resource management policies. Consequently, the assessment guides the sustainable management of the Tuha region, ensuring its long-term coordinated development in social, economic, and ecological aspects.

2.3.3. Construction of the Social–Economic–Ecological System Evaluation Index System Based on the SDGs

1.
Deconstruction of social–economic–ecological system indicators
This study combined the Tuha region’s own development foundation with the concept of coordinated development based on the SDG framework system, referring to the “Opinions of the Central Committee of the Communist Party of China and the State Council on Accelerating the Advancement of the Construction of Ecological Civilization” and the “Five-Year” Planning Outline of the Turpan and Hami regions, as well as synthesizing the relevant research literature and applying entropy weighting to determine the weights and make comparisons. The data that could not be accessed in the indicator system were replaced; several special indicators that could be used in the Tuha region were screened out. From social, economic, and ecological perspectives, 9 SDGs were selected, comprising a total of 27 sub-indicators, to deconstruct the sustainable development goal indicator system for the social–economic–ecological system of the Tuha area (see Table 3).
2.
Entropy weight method
In this study, we adopted the entropy weighting method for the assignment of indicator weights [27]:
X i = X i X min X max X min   ( positive   indicators )
X i = X max X i X max X min   ( negative   indicators )
where X i represents the normalized value, X max and X min represent the maximum and minimum values of the indicator data, respectively, and i represents the number of indicator data points;
Z ij = X i
P ij = Z ij / i = 1 k Z ij
M j = 1 lnk i = 1 k P ij ln P ij
w j = 1 M j j = 1 m 1 M j ( j = 1 , 2 , , m )
where Z i j denotes the value of the indicator weight coefficient, P ij is the unitless result of the indicator, M j is the entropy value of the jth indicator, and w j denotes the weight: 0 ≪ w j ≪ 1 and satisfies j = 1 q w j = 1 .
3.
Comprehensive evaluation methodology
F(x), G(y), and R(m) denote the comprehensive evaluation values of society, economy, and ecosystem, respectively [64].
F ( x ) = i = 1 p a x i
G ( y ) = i = 1 q b y i
R m = i = 1 n c m i
p, q, and n denote the number of indicators of the three systems; a, b, and c denote the corresponding weights of the indicators; and x i , y i , and m i denote the normalized values of each indicator of the system.

2.3.4. Gridded Simulation of the Indicator System Based on Geographic Information

In this study, to overcome the limitations of previous studies based on administrative boundaries, we integrated socioeconomic statistics, land use data, and basic geographic data; carried out quantitative spatial simulations of each SDG indicator in a socioeconomic–ecological system at the kilometer grid scale; and constructed geospatial visualizations of each indicator. The 1 km × 1 km grid was selected as the minimum evaluation unit, and the grid was assigned values through the GIS grid model, which was ultimately transformed into the raster data expression form of the kilometer grid to visualize the 27 indicators. The Tuha region, characterized by its complex geographic environment and rich natural resources, underscores the crucial role of ecological preservation and the integrated, coordinated development of socioeconomics for regional sustainability. Through the gridded simulation of the geographic information indicator system, spatial data for the Tuha area can be obtained, effectively simulating and analyzing the distribution of various indicators within the region. This provides valuable references for the sustainable development of the Tuha area. The study area included a total of 205,455 grids, and all the data were unified in the WGS_1984_UTM_zone_46N coordinate system. Due to the relatively large number of indicator systems, the following is a brief list of 2 methods for spatialized representation of indicators.
4.
GDP
Since statistical data are limited by the boundaries of administrative districts, it is difficult to depict the development status of the region in a finer way, and the currently available data about GDP are mainly derived from statistical data; therefore, to realize the spatialized expression of GDP, we combined POI data, statistical data, and land use data and used the ArcGIS platform to express the gross product of the primary, secondary, and tertiary industries with spatial accuracy. The specific formula is as follows:
GDP i = A i + B i + C i
where G D P i is the gross domestic product and A i , B i , and C i are the gross domestic products of the primary, secondary, and tertiary industries, respectively.
5.
Grain production
In this study, the statistical data were combined with the use of land; the specific formula is expressed as follows:
R i = L i × Q j
i = 1 n R i j = 1 m Q j = 0
where R i is the grain yield of each grid, L i is the proportion of cultivated area, Q j is the grain yield statistic, n is the number of grids, and m is the number of districts.

2.3.5. Coupled Coordination Degree Models

C = ( 27   f x g y z m [ f x + g y + z m ] 3 ) 1 k
where k is a moderating coefficient, C denotes the degree of ecological–socioeconomic system coupling in the Tuha region, with a range of [0, 1], and a larger C value indicates a better degree of coupling [65]. Because of the complex interaction and development relationship between the systems, the coupling degree alone cannot truly reflect the synergistic relationship between each subsystem in the system and the overall system. To overcome the shortcomings of the C value, a model for measuring the degree of coupling and coordination between the ecological environment and economic development was introduced [66]:
D = C × T
T = α F x + β G y + γ Z m
where D is the degree of coupling coordination and T is a comprehensive coordination index. α, β, and γ are the pending weights, and α + β + γ = 1. In this study, α = β = γ =1/3, thus,
T = f x + g y + z m 3
According to the magnitude of the coupling coordination degree, the coordination type was divided into three major categories and seven subcategories; the specific classification criteria are shown in Table 4.

2.3.6. Geodetector

Geodetector is a novel spatial statistical method developed by Wang et al. to detect spatial heterogeneity and quantify the effects of various drivers [67]. In this study, we used geodetectors to quantitatively identify the degree of action of each influencing factor to compare the effects on the coupled social–economic–ecological coordination value (q) and to analyze the factors affecting the degree of coupled coordination. Its expression is as follows:
q = 1 h = 1 L N h σ h 2 N σ 2
where q is the spatial heterogeneity of the influencing factor, the value of which ranges from [0, 1]; a larger value indicates that the independent variable X is more capable of explaining the dependent variable Y; h = 1, 2…i denotes the level of the independent variable X; N h and N denote the hth level and the number of all levels, respectively; and σ h 2 denotes the sum of the variance in the values of the hth level and the dependent variable Y.

3. Results

3.1. Analysis of Spatial and Temporal Changes in Land Use in the Tuha Region, 2010–2020

Figure 2 illustrates the land use changes in the Tuha region from 2010 to 2020. Observations show that unutilized land was the main land type in the region, accounting for more than 80%, followed by grassland, accounting for approximately 18%. The areas of urban and rural industrial and mining land were relatively small and were mainly distributed in the oasis plain area. Figure 2 shows that grassland, unutilized land, and meadows have experienced decreasing trends over the past 10 years. These values were 0.13%, 0.22%, and 2.54%, respectively, with forestland decreasing most significantly; the area of cultivated land increased and then decreased, with a maximum in 2015 and a minimum in 2020; and watersheds and urban and rural industrial and mining land increased, with urban and rural industrial and mining land increasing the most, at 77.6% and 44,600 square kilometers. With the economic development of the Tuha region, many types of land conversions occurred; unutilized land was the primary source of land transformed into urban and rural industrial land, followed by grassland; forestland was transformed the least; and the degree of comprehensive land use in the Tuha region in the 10-year period reached 0.27%, which is low. This situation developed because human activities are mainly concentrated in the oasis plain area, resulting in significant land conflicts, and the landform types are mainly Gobi Desert and bare land, which are difficult to fully utilize.

3.2. Analysis of Temporal and Spatial Changes in Ecosystem Services in the Tuha Region, 2010–2020

SDG 6 (Ensure availability and sustainable management of water and sanitation) and SDG 15 (Protect, restore, and promote sustainable use of terrestrial ecosystems) provide important guidance for the assessment of ecosystem services such as water yield, habitat quality, soil retention, and carbon storage using the InVEST model.

3.2.1. Water Production

Changes in surface water yield are highly important for human survival and ecological stability and are directly related to surface runoff, soil properties, and vegetation growth. The results of this study showed a decreasing trend in water production in the Tuha region from 2010 to 2020 (Figure 3). In 2010, water production peaked at an average of 13.97 mm, while in 2015, the average was 13.51 mm; finally, in 2020, it dropped to 8.81 mm. The amount of water produced is influenced by a combination of topographic, geomorphological, climatic, and hydrological factors, which are influenced mainly by precipitation and potential evapotranspiration. Potential evapotranspiration is strong within the Tuha region, with potential evapotranspiration values of 3244.80 mm, 1083.35 mm, and 1115.61 mm occurring between 2010 and 2020. Lower precipitation and higher potential evapotranspiration resulted in significant differences in water production over time. In terms of spatial distribution, the areas with high water production values are mainly located in the oasis area of the Tuha region, southern Barkol, northeastern Yizhou district, western Yiwu county, and northern Gaochang district areas. In contrast, there is almost no water production in other desert Gobi Desert areas.

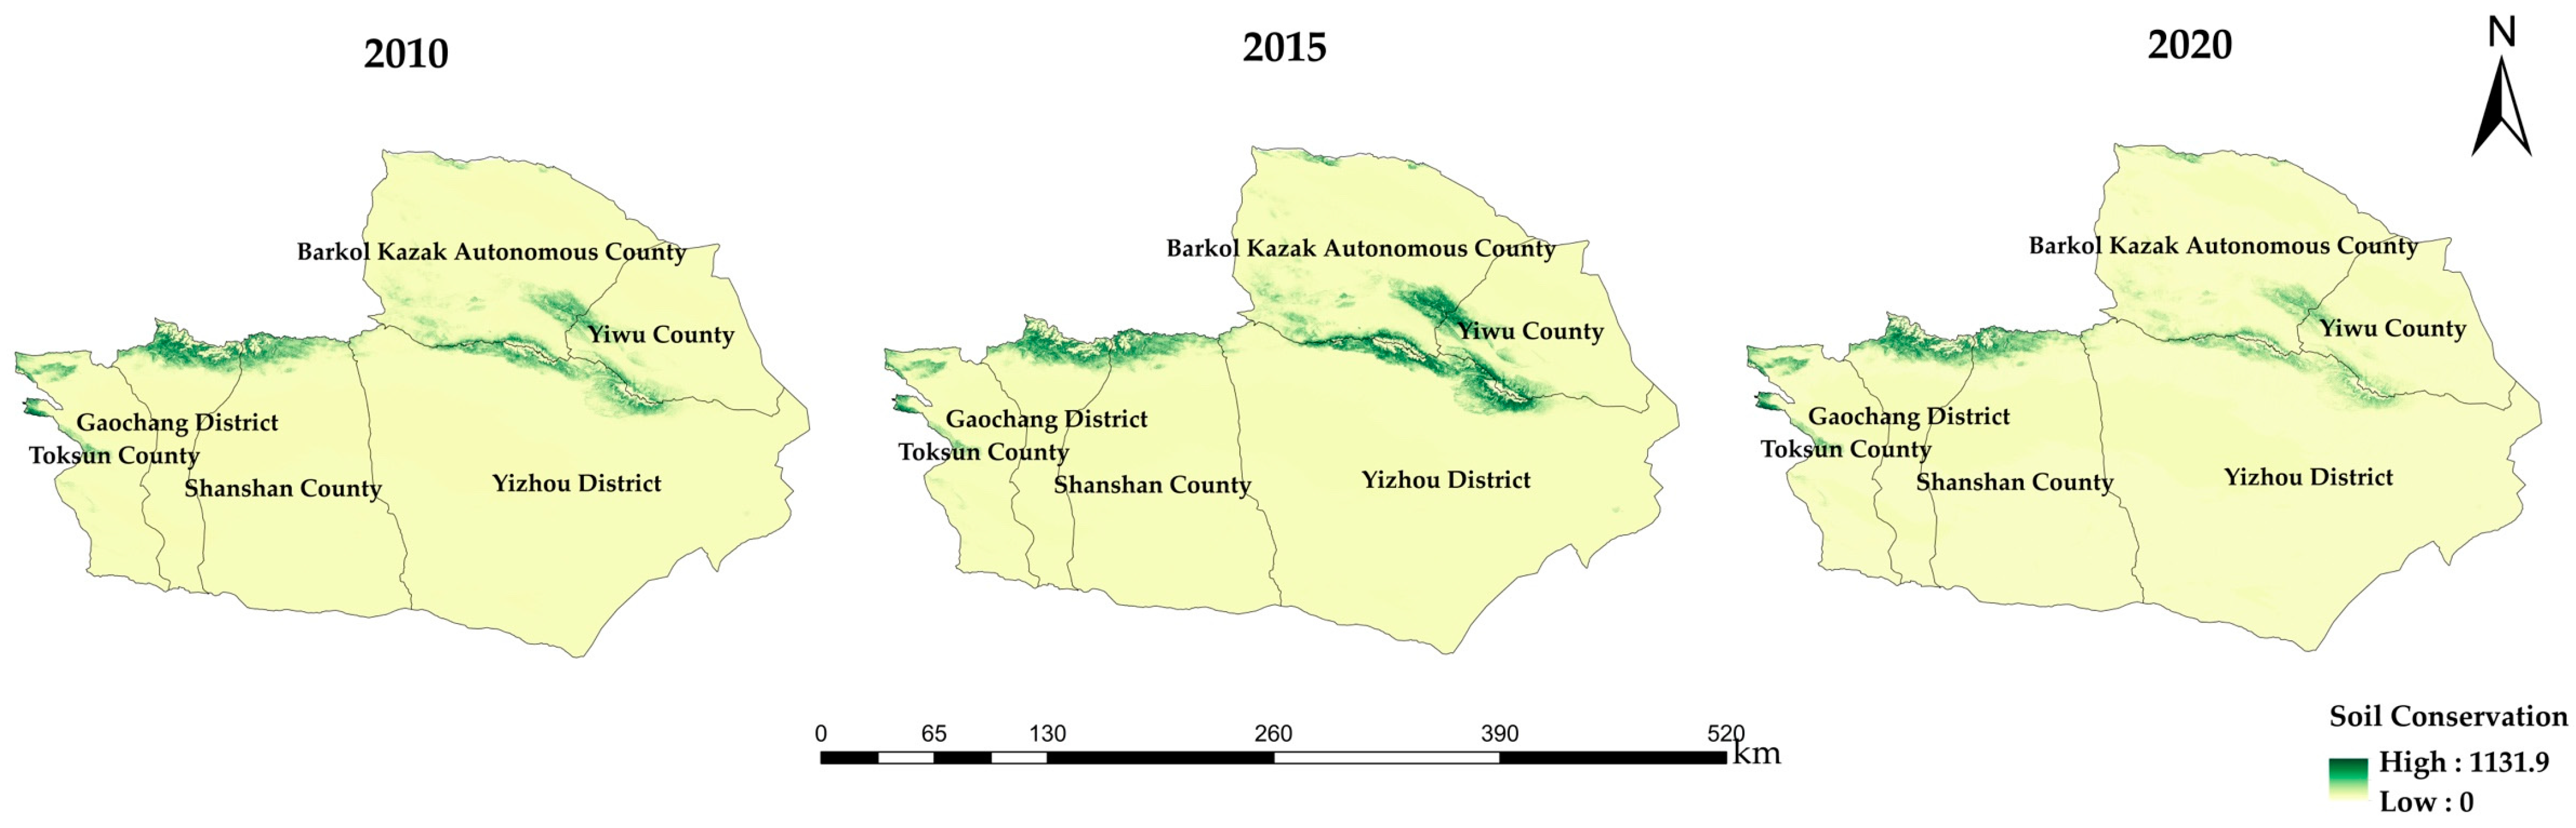
3.2.2. Soil Conservation

By simulating the amount of soil retained, we can intuitively and clearly understand the soil erosion situation in the Tuha area, which is highly important for effectively protecting and improving soil and water resources and giving full play to the economic and social benefits of soil and water resources. During the ten years from 2010 to 2020, soil retention in the Tuha region experienced an increasing and then a decreasing trend of 5.2 × 10⁸ t, 7.3 × 10⁸ t, and 4.08 × 10⁸ t, respectively. The average soil retention during this period was 5.53 × 10⁸ t, and Figure 4 shows that the highest value also exhibited an increasing and then decreasing trend. During the period from 2010 to 2015, the grassland land type in the Tuha region increased annually, while the unutilized land type decreased annually. For some soil erosion and desertification areas, priority measures for returning farmland to forest and grassland were implemented, and unutilized land was actively developed; thus, soil conservation showed an upward trend. However, between 2015 and 2020, the growth of urban and rural industrial and mining construction land was more significant, occupying the original forest land, grassland, and arable land, etc., resulting in a downward trend in soil retention from 2010 to 2020. In terms of spatial distribution, areas with high soil retention are located mainly on both sides of the Tian Shan range and in the southern part of Barkol. These areas have high vegetation cover and thus show strong soil retention capacity.

3.2.3. Carbon Stocks

The results of the present study showed that the carbon stocks in the Tuha region were 112.4 × 10⁸ t, 12.5 × 10⁸ t, and 12.1 × 10⁸ t in the last ten years, which in general did not significantly change (Figure 5). The areas with higher carbon sequestration were mainly located in the southern part of the Tianshan mountains as well as in the Barkol area in the northern part of the Tianshan mountains. The reason for this phenomenon is that these areas have more cultivated and forested land, which significantly enhances carbon fixation. In contrast, desert areas and bare land surfaces have lower carbon density, and watersheds have zero carbon density.

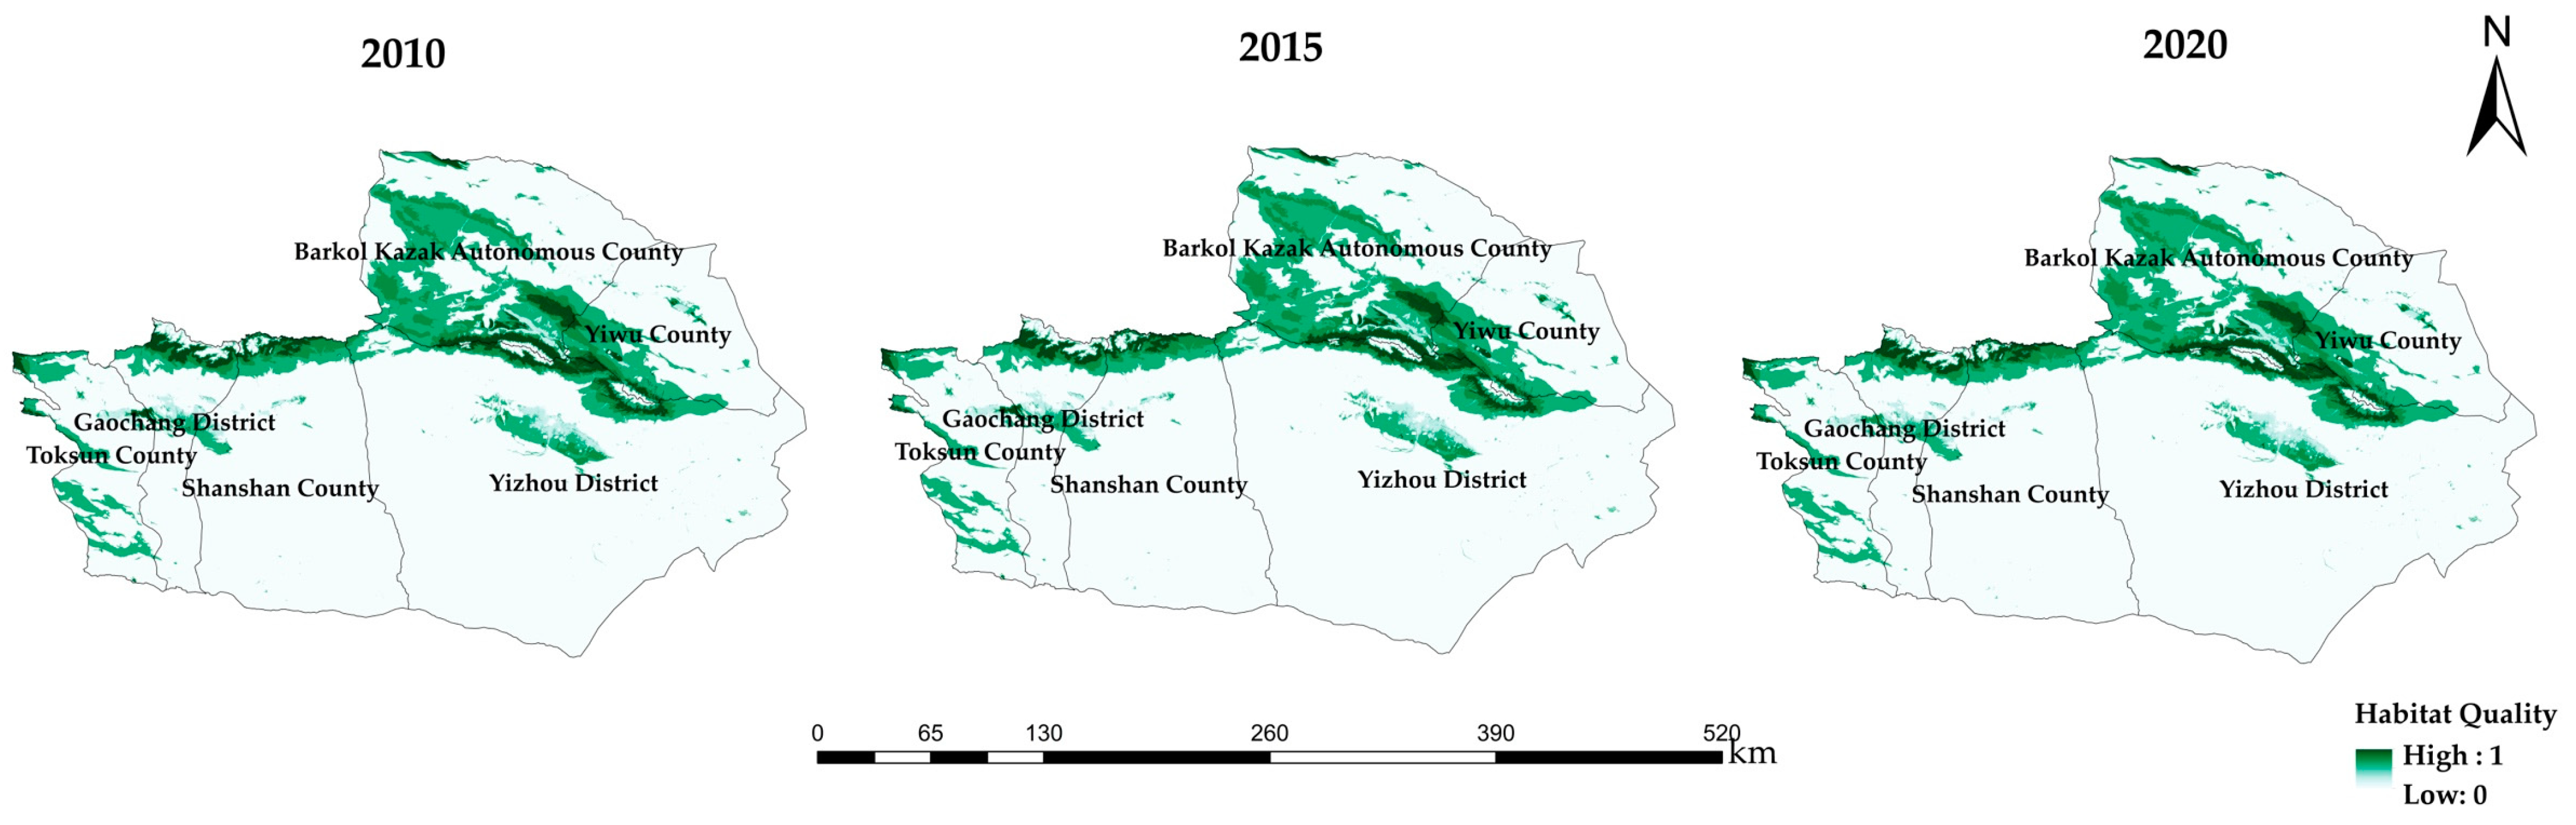
3.2.4. Habitat Quality

As shown in Figure 6, the areas with high habitat quality are mainly distributed in the Barkol area in the northern part of the Tianshan mountains and the northern part of Turpan. These areas have good ecological conditions and are the oasis areas of the Tuha region; thus, the habitat quality is relatively high, and the increase in the types of grassland and cultivated land has led to a gradual increase in the number of areas with good habitat quality. And the large area of the Gobi Desert and bare ground in the Tuha region has resulted in the poorest habitat quality in these areas.

3.3. Analysis of the Evolution of the Spatiotemporal Pattern of the Social–Economic–Ecological System in the Tuha Region, 2010–2020

3.3.1. Analysis of Spatial Evolution Patterns of Social–Economic–Ecological Systems at the Grid Scale

To analyze in depth the spatial distribution and evolution patterns of the three major sustainable development systems in the Tuha region, we chose to analyze the combined economic, social, and ecosystem scores as well as the combined system scores of the three systems in 2010, 2015, and 2020. As shown in Figure 7, the spatial distributions of economic, social, and ecological systems as well as the composite scores of the three systems were similar from 2010 to 2020; the composite scores of the social system were generally lower than those of the economic system and the ecological system, which suggests that the development of the social aspect in the sustainable development of the study area is lagging behind relatively little. Therefore, we recommend strengthening the construction of basic social services to promote the sustainable development of the study area.
The economic system score increased from 0.62 in 2010 to 0.71 in 2020, indicating that the economy of the study area overall is experiencing sustainable development. The high-value areas are mainly in the central part of Turpan Gaochang district; the northeastern part of Hami Yizhou district also had a relatively high economic system composite score compared with that of other places. The social system had an inverted U-shaped trend of increasing and then decreasing; this trend is related to the introduction of the Turfan and Hami planning policies, which led to an increase in the development of the social system for a certain period. However, it remained at a low level in relation to the economy and the ecosystem. The highest and lowest values of the ecosystem score exhibited U-shaped trends of decreasing and then increasing, with the highest value of 0.78 in 2010 and the lowest value decreasing from 0.02 in 2010 to 0.03 in 2020. This situation occurred mainly because, during the period of 2010–2020, relevant government policies at all levels were proposed that protected the ecological environment while developing the economy. The areas with the highest values are mainly concentrated in the mountainous areas in northern Turpan city, the western part of Yiwu county in Hami city, and Barkol county, where there are many forested and grassy areas; therefore, the comprehensive ecosystem scores are higher. The low-value areas are mainly desert areas in the southern region.
The evaluation scores of the systems were combined, and the maximum value of the combined system composite score increased from 2010 to 2020, from 0.53 in 2010 to 0.61 in 2020. Despite the decline in the intermediate period, this value was still greater than that in 2010, indicating that there is still room for improvement in the comprehensive development of the Tuha region. Overall, the high-value areas are mainly concentrated near farmland oasis areas and mountainous areas, such as the northern part of Turpan, the central part of Gaochang district, the northeastern part of Yizhou district in Hami, and the southern part of Yiwu county, while the low-value areas are mainly distributed in the southern desert areas.

3.3.2. Analysis of the Temporal Evolution of Social–Economic–Ecological Systems at the County Scale

As shown in Figure 8, the economic development of the districts and counties in the Tuha region has shown a continuous upward trend over the past 10 years. The economic development of Yizhou district has been relatively rapid; in 2010, the comprehensive score of the economic system of Yizhou district was 0.29, which rose to 0.61 in 2015; and in 2020, it reached 0.78, which was much greater than that of other districts and counties. This trend has been largely driven by the rapid development of industry, minerals, and energy in the Ijaw region under the policy plan, which has contributed to the rapid economic uplift of the region. In contrast, the economic development of Toksun and Barkol counties is slower than that of the other counties, which is consistent with the spatial results. The Tuha region has been maintaining a steady economic growth trend, which is closely related to the high attention paid to the national policy, the regional strategic planning, and the geographic location of the transportation fortress, which have combined to promote the growth of the regional economy over the past 10 years.
In 2010, the region with the worst development in the social system was Yiwu County, with a composite value of only 0.12, and the region with the highest development in Yizhou District, with a value of 0.49. Turpan’s Torsun County and Gaochang District, as well as Hami Barkol County and Yizhou District, had higher combined social development values in 2015 than in 2020. This result is consistent with the inverted U-shaped trend in the development of social systems at the spatial grid scale. Between 2010 and 2015, health care resources, in addition to education resources, increased each year, and the quality of life of the population gradually improved. As a result, the overall score for the development of the social system showed an upward trend. Between 2015 and 2020, governments at all levels attached great importance to the coordinated and sustainable development of ecology, society, and the economy; social development continued to rise, and the ecological situation gradually improved. However, social development was slower than the development of these two systems and trended downward during this period.
Between 2010 and 2020, the ecosystem composite score of Barkol county changed only slightly and was much greater than that of the other districts and counties, a result of the large area of grassland in the county, which made the region ecologically sound. On the other hand, the ecosystems of Yiwu county and Yizhou district showed a gradual decreasing trend. Yizhou district decreased from 0.62 in 2010 to 0.58 in 2015 and then to 0.40 in 2020 due to the severe industrial pollution brought about by the rapid development of the economy and industry in Yizhou district, which is dominated by low-coverage grasslands and less ecological land. Thus, the ecological composite scores gradually decreased. During this period, the Turpan government focused on economic development and ecosystem protection at all levels; thus, the ecosystem function of Gaochang district gradually improved. The ecosystem functions of Shanshan and Toksun counties also improved after 2015.
At the county scale, the comprehensive systematic evaluation scores of most regions showed an upward trend from year to year. Barkol and Yiwu counties showed a U-shaped trend of increasing and then decreasing, albeit with a relatively small decrease. Among them, the maximum value of Hami Yizhou district and Turpan Gaochang district in 2010, 2015, and 2020 was 0.61, and the lowest value of the three-year average was in Hami Yiwu county.

3.4. Characterization of Temporal and Spatial Changes in Coupled Social–Economic–Ecological System Coordination in the Tuha Region, 2010–2020

3.4.1. Analysis of the Degree of Coordination of Social–Economic–Ecological Coupling at the Grid Scale

In this study, the coupling coordination development of the Tuha region was studied in depth by comparing the grid scale and county scale. Figure 9 shows that the spatial distribution characteristics of the coupling coordination degree of the Tuha region in 2010, 2015, and 2020 were basically the same. As unutilized land occupies a large proportion of the Tuha region, the coupling coordination degree of these regions generally indicates a type of serious disorder. In terms of spatial evolutionary trends, the mildly dysfunctional types were distributed mainly in the northwestern region of Barkol; however, with the implementation of government policies, the mildly dysfunctional types gradually evolved toward the endangered dysfunctional types, indicating that coupling coordination was moving toward coordinated development. The northern part of Turpan showed a staggered distribution of imminent dislocations and was barely coordinated in 2010, with a marked increase in the barely coordinated type in 2015, while maintaining a relatively stable trend in 2020. The distribution of intermediate-level coordination was relatively small in 2010, but the type of intermediate-level coordination increased significantly in the northeastern part of Hami Yizhou district and the southern part of Barkol county in 2015 and remained essentially stable in 2020. This situation indicates that the coupled and coordinated development of these areas between economic, social, and ecological systems has been optimized. Since the southern part of the Turpan region and the southern part of the Yizhou district are mostly bare land, these areas have typically been in a state of severe dislocation in the last 10 years.
Overall, the primary and intermediate coordination stages of the coupled coordinated development degree were mainly found in the central regions with intensive human activities and better economic and social development. Transitional areas between near-disorder and barely coordinated areas are located mainly in the northern area of Turpan, while areas transitioning between mildly disoriented and near-disorder areas are located mainly in Barkol county, Hami, indicating that local governments have supported the gradual progression of regional development toward coordinated development. Severe dislocation still accounted for a large proportion of the total area in 2010, 2015, and 2020, which was strongly related to the uneven utilization of land resources in the Tuha region. To realize the coordinated development of the ecological environment and socioeconomic system, the development potential of land use needs to be further explored in the future, and the utilization efficiency of land resources needs to be improved.

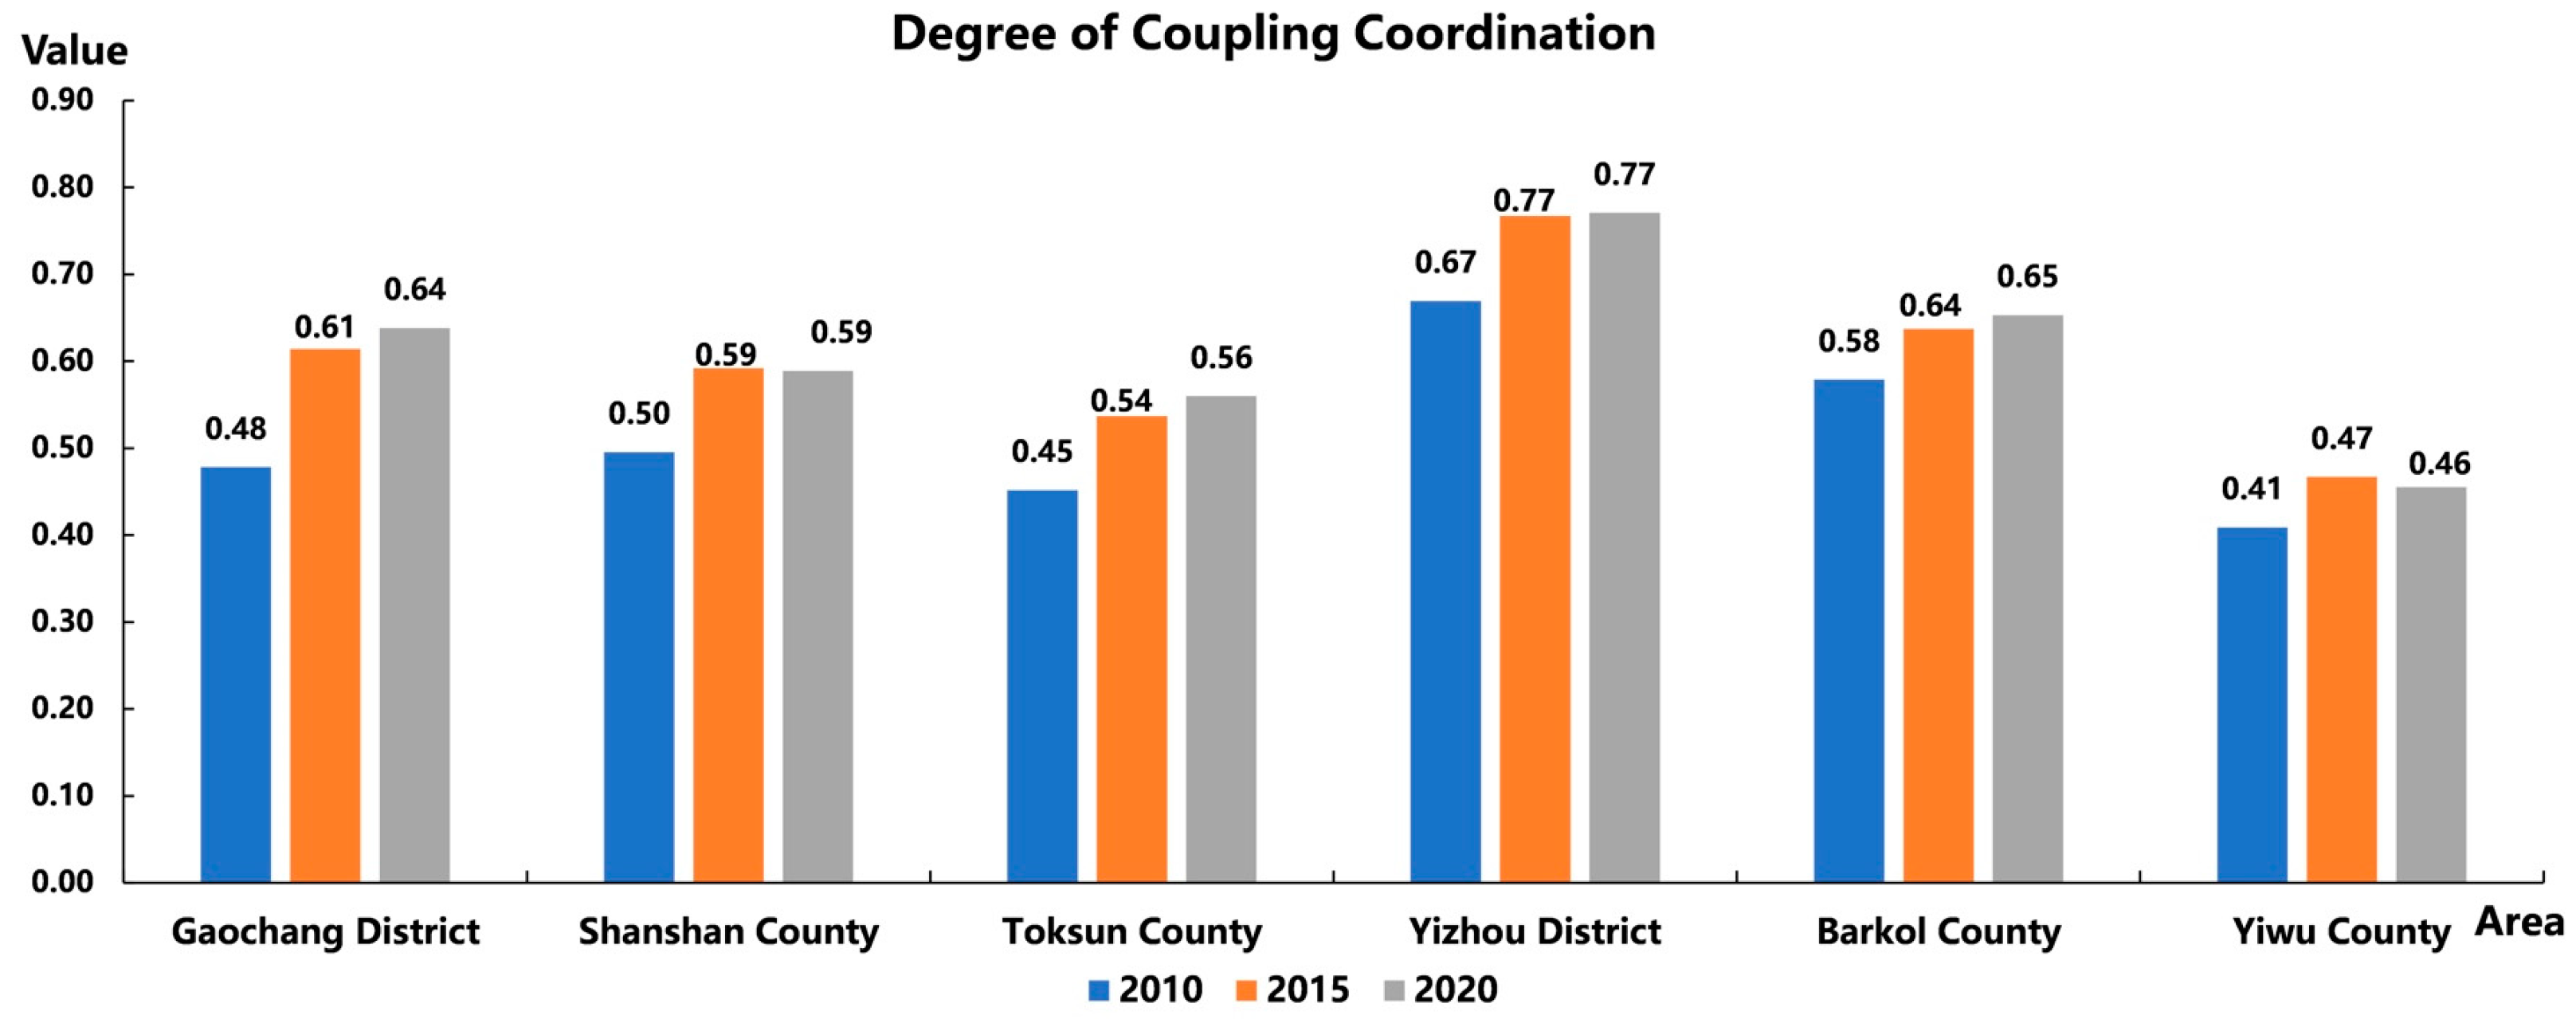
3.4.2. Analysis of the Degree of Coupling Coordination in the Tuha Region

During the period from 2010 to 2020, the coupling degree of coordinated development in the Tuha region was relatively high, with the score basically fluctuating around 1, indicating a strong correlation between the three major systems of economy, society, and ecology in Turpan and Hami and an overall relatively smooth trend of coordinated development (Figure 10). In addition, the composite coordination index showed a gradual increase, which was similar to the change curve of the coupling coordination degree; both showed a continuous growth trend. Between 2010 and 2015, the degree of coordinated development of Turpan city and Hami city increased more significantly, while between 2015 and 2020, the increase was smaller. Overall, the coupling coordination degrees of both Turpan city and Hami city increased, but the degree of coordinated development of Hami city was greater than that of Turpan city.
To further analyze the changes in the degree of coupled and coordinated development at the county level, a map of the trend of changes in the degree of coupled and coordinated development of the districts and counties in the Tuha region from 2010 to 2020 was drawn (Figure 11).
As shown in the figure, there was a general upward trend in the degree of coupling coordination among the districts and counties during the study period, from 0.41–0.67 in 2010 to 0.46–0.77 in 2020, and the gap between districts and counties decreased. Yiwu county in Hami city showed an increasing and then a decreasing trend, but the decrease was smaller.
According to the classification criteria in the previous section, Yizhou district has the highest degree of coupling coordination among the districts and counties; this area gradually changed from primary to intermediate coordination and remained stable, with the degree of coupling coordination ranging from 0.67 to 0.777. This is because Yizhou district, as the central area of Hami city, has the strongest coordination among all aspects in the three dimensions of economy, society, and ecology. Turpan city’s Gaochang district, which grew from a state of near-dislocation in 2010 to primary coordination in 2015 and remained stable in 2020, had the most and fastest growth in coupling coordination, from 0.48 in 2010 to 0.64 in 2020, an increase of 33.48%. This indicates that during the study period, the Gaochang district gave more attention to sustainable and coordinated development and took active measures to promote the balanced development of the sustainable development subsystem. Shanshan and Toksun counties in Turpan city changed from near-dislocation to barely coordinated, and Barkol county in Hami city changed from barely coordinated to primary coordinated, while the degree of coupled coordination in Yiwu county grew more slowly and remained at the stage of near-dislocation. Further efforts are needed to promote the coordinated development of the economy, society, and ecology, which is also consistent with the results of the spatial analysis of coupled coordination at the grid scale in the previous section.

3.5. Exploration of the Main Control Factors of the Coupled Social–Economic–Ecological Coordination System

To further study the driving factors of the coupled socioeconomic–ecological coordination degree, this study synthesized representative ecological, social, and economic driving factors from previous related studies based on the consideration of data availability and comprehensively analyzed the factors influencing the coupled coordination from four aspects, namely, surface characteristics, climatic characteristics, demographic and economic aspects, and social development. These factors include the following: surface environment indicators, including elevation (X1) and topographic relief (slope) (X2); climatic characteristics, including rainfall (X3), average annual temperature (X4), and evapotranspiration (X5); demographic characteristics, including population density (X6), GDP (X7), and total consumer goods (X8); and social development indicators, including proportion of land used for construction (X9), rate of urbanization (X10), food production (X11), and cultivated land area (X12).
First, the rasterization of each dataset and the use of the natural breakpoint method of each driving factor for grading were roughly divided into six levels. In this paper, the detection of spatial points, the generation of uniform coverage of more than 8000 points randomly distributed in the Tuha area, and the extraction of various data points to the point elements are described to complete the analysis of the driving forces of geodetectors. The results of factor detection are shown in Figure 12; each driver factor passed the significance test at the 0.05 confidence level. In terms of the influence of each driver factor on the degree of coupling coordination, the demographic and economic indicators and social development indicators have more significant influences on the degree of coupling coordination than do the indicators of the surface environment and climate characteristics. Among them, food production had the highest influence, reaching 0.891, followed by GDP, which is closely related to human activities; temperature, precipitation, and elevation had relatively small influences on the degree of coupling coordination. This is mainly because the Tuha region is characterized by aridity, low rainfall, and a mountain–basin structure, resulting in little change in temperature and precipitation. The natural factor that has the greatest influence on the coupling coordination degree is evapotranspiration, which is related to the fact that the Tuha region is an extremely arid region in China, with an average annual precipitation of only approximately 20 mm but evapotranspiration of more than 3000 mm and a dry climate in the basin. Through interaction detection, we found that the factors showed a two-factor enhancement or nonlinear enhancement trend after interaction. This finding suggests that the coupled and coordinated spatiotemporal differentiation pattern of the socioeconomic–ecological system in the Tuha region is the result of the joint action of multiple factors.

4. Discussion

4.1. Construction of a Social–Economic–Ecological Evaluation System Based on the SDGs

The SDG indicator system, with its characteristics of systematicity, authority, and universality, guides the objectives and quantitative research of sustainable development and is widely used to assess the social, economic, and ecological development levels of various regions. Scholars attempt to use the SDG goals, targets, and indicators to assess the social, economic, and ecological levels of different regions. For example, He Jiajun evaluated the development status of the Guangdong–Hong Kong–Macao Greater Bay Area by selecting 13 first-level SDG goals from three aspects: economic development, social inclusion, and environmental protection [68]. Gan Lu constructed a sustainable development indicator system for the Chengdu–Chongqing twin-city economic circle from three aspects: society, economy, and environment, corresponding to 11 goals including SDG 1, SDG 2, etc. [69]. Ai Xiaoping constructed sustainable urbanization indicator systems for Jilin province at both the provincial and city levels from four aspects: economy, society, resources, and environment, corresponding to 13 goals such as SDG 1, SDG 2, etc. Ma Shangjing built a sustainable development indicator system for the Yangtze River Delta region aimed at SDGs and Beautiful China from four aspects: population, economy, society, and environment, also detailing it down to the third-level indicators of SDGs, such as SDG 8.1.1, etc. [70]. It is evident that research on the SDG indicator system extensively encompasses an all-round evaluation involving economic, social, and environmental aspects from the perspective of sustainable development. Drawing on the experience of predecessors, our research, based on the three major frameworks of the SDGs and combined with the development foundation of the Tuha region, adheres to principles of scientific rigor, comprehensiveness, and feasibility, constructing an evaluation system suitable for the social–economic–ecological system of the Tuha region.
Among them, SDG 1 and SDG 2 are aimed at eradicating poverty and hunger, which are the key factors limiting human development; we chose to use “GDP” as the embodiment of SDG 1 and “food production” as the key indicators of SDG 2. SDG 3 emphasizes the importance of ensuring healthy lifestyles; in this study, “hospital beds per 10,000 population”, “health technicians per 10,000 population”, and “health care expenditure” were selected as indicators of good health and well-being, accounting for the actual situation and the feasibility of obtaining data. SDG 4 focuses on inclusive and equitable quality education and we chose “fiscal expenditure on education” as the expression of this goal. SDG 6 calls for the provision of clean water and sanitation and we chose the ecosystem services “quantity of water produced” and “effective irrigated area of farmland” as the reflections of this goal. SDG 8 emphasizes economic growth and decent employment and we reflected the economic growth and decent employment requirements of SDG 8 through indicators such as “GDP per capita” and “ratio of primary industry GDP to GDP”. SDG 12 focuses on sustainable consumption and production and we used “total retail sales of consumer goods” as the target. SDG 15 mainly emphasizes the protection of terrestrial ecosystems and we chose “habitat quality”, “soil conservation”, and “carbon storage” as the specific embodiments of this goal. Finally, to promote high-quality, high-efficiency and green agricultural development in the Tuha basin, the ecological civilization construction of “Beautiful China” and rural revitalization must be practiced; therefore, we took indicators such as “fertilizer application in rural areas” and “number of heads of livestock at the end of the year” as the embodiment of SDG 2.3 sustainable agriculture, while “local financial revenue” was used to represent the target of SDG 17.1, improving tax collection and financial revenue. In selecting these indicators, not only were the government planning documents of the Tuha region referenced, but also indicators rooted in the region’s local characteristics, such as the number of livestock at year-end, were considered.

4.2. Gridded Simulation of Indicator Systems Based on Geographic Information

The 2030 Sustainable Development Goals encompass 17 main goals, 169 detailed targets, and 232 specific indicators, with about two-thirds of the SDG indicators lacking official authoritative data support, and more than 60 indicators do not have recognized methods of calculation. Facing such a vast indicator system, leveraging geographical data for quantification provides essential support for the SDGs. Compared with traditional statistical data, Geographic Information Systems (GISs) demonstrate an integrated view of economic, social, and ecological data. Therefore, the United Nations has emphasized the critical role of geographic information in the assessment and monitoring of SDGs, initiating a broad range of research and applications. Since 2019, led by Guo Huadong, the Chinese Academy of Sciences has released a series of reports titled “Big Earth Data in Support of the Sustainable Development Goals” (editions 2019, 2020, and 2021). These reports have showcased the potential and prospects of big Earth data technology and methodologies in monitoring and evaluating Sustainable Development Goals, effectively bridging gaps in data and methodology within the international community. Chen Jun and colleagues’ research, starting from a geospatial perspective and combining statistical with geospatial data, have calculated and assessed the SDG indicators for Deqing county. This is the first case of implementing SDG indicator calculations in China, marking significant progress in the localization and spatialization of SDG indicators [22]. On 5 November 2021, China successfully launched the SDGSAT-1 satellite, a scientific satellite specifically designed to serve the United Nations 2030 Agenda for Sustainable Development. This indicates that the development of SDG indicator grid data has become a trend.
So, this study breaks the tradition of the previous research based on administrative boundaries, the use of POI data and statistical data, land use data, and other multi-source data. We deconstructed the indicators of the spatialization of simulation one by one to a 1 km × 1 km kilometer grid as the smallest evaluation unit for the expression of the geospatial visualization of the indicators. The GIS grid model was used to assign values to the grids, and the final kilometer grid raster data were formed and used as a gridded database of socioeconomic–ecosystem evaluation indicators in the Tuha region. The social–economic–ecological evaluation index system was constructed from the perspective of the grid, and the establishment of each index was designed to provide services for the comprehensive evaluation of the system to better show the development status of the system. This approach provides valuable references for the Tuha region to achieve sustainable development more effectively.

4.3. Spatial and Temporal Variations in the Coordination of Systems and Coupling at Multiple Scales in the Tuha Region

At the grid scale, the social, economic, and ecological systems as well as the composite scores of the three systems in the study area exhibited similar spatial distribution characteristics from 2010 to 2020. The scores for the economic system showed an increasing trend, the social system showed an “inverted U” trend, and the scores for the ecosystem showed a U-shaped trend. The composite scores for the social system were generally lower than those for the economic and ecological subsystems, suggesting that the Tuha region is lagging behind in the development of social aspects. The composite system scores for social, economic, and ecological systems showed an upward trend throughout the period. Overall, the Tuha region demonstrated room for improvement in terms of comprehensive development, especially in the southern desert region. At the county scale, the economic development of the districts and counties in the Tuha region experienced a continuous upward trend during the past 10 years, with the economic development of the Yizhou district far exceeding that of the other districts and counties; this change was driven mainly by the rapid development of industry, minerals, and energy under the policy plan. In contrast, the economic development of Toksun and Barkol counties was slower than that of the other counties, which was consistent with the spatial results (Figure 7). At the county scale, the comprehensive system scores of most areas increased annually, but Barkol and Yiwu counties exhibited a U-shaped trend of first increasing and then decreasing.
The coupling coordination degree of the Tuha region in 2010, 2015, and 2020 exhibited consistent spatial distribution characteristics. The large area of unutilized land led to a generally serious dislocation in the region, with mild dislocation in the northwestern part of Barkol. With the promotion of government policies, dislocations gradually evolved to the verge of dislocation, and the degree of coupling coordination gradually increased. During the period from 2010 to 2020, the three major social, economic, and ecological systems of Turpan city and Hami city exhibited strong correlations, and the overall performance exhibited a smooth and coordinated development trend. The change curves of the comprehensive coordination index and the coupling coordination degree were similar, and both showed a continuous growth trend. The degree of coupled and coordinated development of Turpan city and Hami city as well as the districts and counties gradually increased, but Hami city was better compared with Turpan city, with the highest coupled and coordinated development occurring in Yizhou district of Hami city, and Gaochang district in Turpan city had the highest growth in coupling coordination.
Like many other studies, when analyzing the influencing factors, we found that the indicators of the population economic and social development category had a more significant influence on the coupling coordination degree than did the indicators of the surface environment and climate characteristics category; in addition, the grain output and GDP were the most important factors, while the influences of temperature, precipitation, and elevation were relatively small. The reason for this difference is that the characteristics of the Tuha region limited changes in temperature and precipitation, while the population distribution in the Tuha region is uneven; the population is mostly concentrated in the oasis region, human activities are more intense, grain production is greater, and the ecological environment is under greater pressure. These factors affect the development of society, the economy, and ecology. Additionally, in 2021, Turpan’s GDP was ranked 173rd in the country, and Hami’s GDP was ranked 274th. The regional GDP also directly affects the living standards of local people, which affects the coupled and coordinated development of society, economy, and ecology in the Tuha region; these findings are also consistent with the results of some related studies in ecologically fragile areas.
In summary, compared with socioeconomic statistical data obtained based on administrative divisions, grid-scale data can more intricately display and reflect the details and spatial differences within a region, more accurately revealing the actual spatial distribution. When discussing coupling coordination, grid-scale data can also more effectively demonstrate spatial differences compared with provincial or municipal scales.

4.4. Responses and Recommendations

Based on the conclusions of the aforementioned studies, and considering the unique environment of the ecologically fragile Tuha region, this paper provides recommendations for the SDG (Sustainable Development Goal) indicator system. These suggestions aim to serve as a reference for formulating sustainable development strategies for the Tuha region, promoting the coupled and coordinated development of its social, economic, and ecological systems, and making a positive contribution to achieving the United Nations Sustainable Development Goals.
(1) Adapt to local conditions, optimize and adjust the industrial structure, and increase efforts in technological innovation
Enhance Water Resource Management Efficiency (SDG 6): given the scarcity of water resources in the Tuha basin, it is essential to strengthen the rational allocation and efficient use of water resources, promote water-saving technologies and recycling water systems, and ensure the sustainable utilization of water resources. Promote Sustainable Agriculture (SDG 2): develop ecological farming practices that are adapted to the local environment, reduce the use of chemical fertilizers and pesticides, implement soil and water conservation farming methods, and enhance the sustainability and resilience of agricultural production. Promote the Use of Clean Energy (SDG 7): considering the Tuha region’s abundant solar and wind energy resources, vigorously develop and utilize these clean energy sources to reduce dependence on fossil fuels and lower greenhouse gas emissions. Strengthen Ecosystem Protection (SDG 15): protect and restore the natural ecosystems of the Tuha region, including grasslands, wetlands, and deserts, and take measures to prevent overgrazing, land degradation, and loss of biodiversity. Address Climate Change (SDG 13): establish and improve the climate change monitoring and adaptation mechanisms in the Tuha basin, enhance the capacity to respond to extreme climate events, and mitigate the impact of climate change on the local socioeconomic and ecological systems. Promote Sustainable Local Economic Development (SDG 8): develop eco-tourism, green energy, and other sustainable industries to create new economic growth points, while simultaneously protecting and utilizing the unique natural and cultural resources of the Tuha region. Governments can guide the development of industries with local characteristics, adjust and optimize the spatial layout of leading industries, and build a modern industrial system tailored to local conditions.
(2) Increase social infrastructure development and enhancement of coupled and coordinated development capacity
With respect to the degree of coupled social–economic–ecological coordinated development in the Tuha region, the combined score of the social system is lower than the combined score of the economy and the ecosystem, which indicates that in sustainable development, the relevant departments should give more attention to the development of the social system, increase the construction of social infrastructures, and provide public infrastructures that are more convenient for daily life; such initiatives can improve the degree of coupled and coordinated development in the Tuha region.

4.5. Innovations and Limitations

With innovative means, this study starts from the connotation of sustainable development based on the SDG framework and utilizes land use data, POI data, and other multivariate data to realize quantitative fine spatial expression of statistical data, thus providing a unique idea and method for data refinement processing. There are few comparative studies on the degree of coupling coordination at the grid scale and county scale. This paper quantitatively evaluates the degree of coupling coordination and the development level of each system at the grid scale and county scale in the Tuha region based on the constructed index system and carries out a comparative analysis between the two to address the lack of multiscale studies on the social–economic–ecological system in the Tuha region. These findings provide important insights into the realization of high-quality development in the Tuha region. This study has several limitations. The scale of the study area could be further refined to the township scale for a comparative study. Although there are certain shortcomings, the application of this method in the first experimental study can be regarded as an attempt and breakthrough in spatially processing statistical data. These limitations did not significantly impact the overall results of this study.

5. Conclusions

In this study, we established a social–economic–ecological evaluation system for the Tuha area based on the SDG framework, taking into account the local characteristics of the area. This system includes nine SDG goals and 27 specific evaluation indicators. Using spatial grid simulation methods, we conducted a quantitative analysis of the social–economic–ecological system of the Tuha area at both grid and county scales. Furthermore, we employed the entropy weight method, comprehensive evaluation method, and a coupling coordination degree model to calculate the system’s coupling and coordination degree. The model is capable of comprehensively reflecting the development trends in various aspects of the Tuha area, thus meeting the assessment needs for the coupled and coordinated development of social, ecological, and economic aspects in ecologically fragile areas. Finally, by analyzing the main factors affecting the system’s coupling and coordination degree through the geographical detector, we provided valuable references for the better sustainable development of the Tuha area. The following main conclusions were drawn:
(1) The spatial grid simulation method can better reflect the regional spatial distribution characteristics. In the Tuha region, the spatial distribution features of the social, economic, and ecological systems, as well as the composite indicators of the system, are similar. The overall economic system shows an upward trend, the social system exhibits a reverse U-shaped trend of first rising and then declining, and the ecological system presents a U-shaped trend of first declining and then rising. The composite scores of the social system are generally lower than those of the economic and ecological systems, indicating that the integrated development of the economic and ecological aspects is slightly superior to the social evaluation. The social infrastructure has not been adequately secured, indicating significant room for improvement.
(2) The coupling degree of the social, economic, and ecological systems in the Tuha region is generally high and shows a trend of gradual increase, rising from 0.41–0.67 in 2010 to 0.46–0.77 in 2020, with the gap between different districts narrowing. Among them, the Yizhou district, as the central area of Hami city, exhibits the strongest coupling and coordination among the economic, social, and ecological dimensions, making it the region with the best coupling coordination degree in the Tuha area. Furthermore, the coupling coordination degree of the Gaochang district in Turpan city grew by 33.48% from 2010 to 2020, marking it as the area with the most significant and fastest growth. This remarkable increase is closely associated with measures taken in the past decade to balance the development of various systems in the Gaochang district. Nevertheless, the study period still saw a considerable proportion of severe imbalance stages, which is largely related to the uneven use of land resources in the Tuha region. To achieve coordinated development of the ecological environment and socioeconomic systems, it will be necessary to further explore the development potential of land use and improve the efficiency of land resource utilization in the future.
(3) In this study, we discovered that demographic–economic indicators and social development indicators significantly impact the degree of coupling and coordination. Notably, grain production has the highest impact, reaching 0.862, followed by GDP. These factors are closely related to human activities. Throughout the research, we also observed that the stages of primary and intermediate coordination in coupled development predominantly occur in central areas with intense human activity and better socioeconomic development. These findings underscore the crucial role of human activities in regional development.
Through this comprehensive analysis, we have not only unveiled the complexity of interactions among the systems in the region but also provided a valuable scientific basis for future research and management of ecologically fragile areas.

Author Contributions

Conceptualization, Y.K. and Q.Z.; methodology, Y.K.; software, Y.K., S.C., J.H., X.S. and X.Z.; validation, Y.K., K.Z., Q.Z. and S.C.; formal analysis, Q.Z.; data curation, Y.K. and Z.Q.; writing—original draft preparation, Y.K.; writing—review and editing, Y.K., K.Z., Q.Z. and S.C.; supervision, Q.Z. All authors have read and agreed to the published version of the manuscript.

Funding

This research was funded by the Third Xinjiang Comprehensive Scientific Research Project on Comprehensive Evaluation and Sustainable Utilization of Land Resources in the Turpan–Hami basin (2022xjkk1105) and the CAS Strategic Priority Research Program (XDA19030402).

Data Availability Statement

No new data were created or analyzed in this study. Data sharing is not applicable to this article.

Acknowledgments

This study was supported by the project “the Third Xinjiang Comprehensive Scientific Research Project on Comprehensive Evaluation and Sustainable Utilization of Land Resources in Turpan–Hami basin (2022xjkk1105)” and “the CAS Strategic Priority Research Program (XDA19030402)”, for which we are thankful. We also extend our special thanks to the anonymous reviewers for their valuable comments and thorough review of our manuscript. Their professional advice has greatly enhanced the quality of our research, resulting in significant improvements in the paper.

Conflicts of Interest

The authors declare no conflicts of interest.

References

  1. Reader, M.O.; Eppinga, M.B.; de Boer, H.J.; Damm, A.; Petchey, O.L.; Santos, M.J. The relationship between ecosystem services and human modification displays decoupling across global delta systems. Commun. Earth Envrion. 2022, 3, 102. [Google Scholar] [CrossRef]
  2. Wei, C.; Zeng, J.; Wang, J.; Jiang, X.; You, Y.; Wang, L.; Zhang, Y.; Liao, Z.; Su, K. Assessing the Impact of Climate and Human Activities on Ecosystem Services in the Loess Plateau Ecological Screen, China. Remote Sens. 2023, 15, 4717. [Google Scholar] [CrossRef]
  3. Hong, W.; Jiang, R.; Yang, C.; Zhang, F.; Su, M.; Liao, Q. Establishing an ecological vulnerability assessment indicator system for spatial recognition and management of ecologically vulnerable areas in highly urbanized regions: A case study of Shenzhen, China. Ecol. Indic. 2016, 69, 540–547. [Google Scholar] [CrossRef]
  4. Pan, J.; Wei, S.; Li, Z. Spatiotemporal pattern of trade-offs and synergistic relationships among multiple ecosystem services in an arid inland river basin in NW China. Ecol. Indic. 2020, 114, 106345. [Google Scholar] [CrossRef]
  5. Liu, J.; Zou, C.; Gao, J.; Ma, S.; Wang, W.; Wu, K.; Liu, Y. Location determination of ecologically vulnerable regions in China. Biodivers. Sci. 2015, 23, 725–732. [Google Scholar] [CrossRef]
  6. Matnuri, A.; Eziz, M.; Turgun, M.; Li, X. Hyperspectral estimation of heavy metal pb concentration in vineyard soil in Turpan Basin. Remote Sens. Technol. Appl. 2021, 36, 362–371. [Google Scholar] [CrossRef]
  7. Ma, Z.; Mao, X.; Ding, Z.; Gao, H.; Huang, T.; Tian, H.; Guo, Q. Residual levels in air, soil and soil-air exchange of organochlorine pesticides in Hami region of Xinjiang and its potential ecological risk. Huan Jing Ke Xue 2013, 34, 1120–1128. [Google Scholar] [CrossRef]
  8. Perrings, C.; Naeem, S.; Ahrestani, F.; Bunker, D.E.; Burkill, P.; Canziani, G.; Elmqvist, T.; Ferrati, R.; Fuhrman, J.; Jaksic, F. Ecosystem services for 2020. Science 2010, 330, 323–324. [Google Scholar] [CrossRef]
  9. Egoh, B.; Reyers, B.; Rouget, M.; Richardson, D.M.; Le Maitre, D.C.; van Jaarsveld, A.S. Mapping ecosystem services for planning and management. Agric. Ecosyst. Environ. 2008, 127, 135–140. [Google Scholar] [CrossRef]
  10. HF, Z. Spatial scale characteristics of ecosystem services. Chin. J. Appl. Ecol. 2007, 26, 1432–1437. [Google Scholar]
  11. Zhang, S.; Bai, X.; Wang, S.; Qin, L.; Tian, Y.; Luo, G.; Li, Y. Ecosystem services evaluation of typical rocky desertification areas based on InVEST model—A case study at Qinglong Country, Guizhou Provice. J. Earth Envrion. 2014, 5, 328–338. [Google Scholar] [CrossRef]
  12. Xiao, Y.; Ouyang, Z.; Xu, W.; Xiao, Y.; Zheng, H.; Xian, C. Optimizing hotspot areas for ecological planning and management based on biodiversity and ecosystem services. Chin. Geogr. Sci. 2016, 26, 256–269. [Google Scholar] [CrossRef]
  13. Li, W.; Geng, J.; Bao, J.; Lin, W.; Wu, Z.; Fan, S. Analysis of spatial and temporal variations in ecosystem service functions and drivers in Anxi county based on the InVEST model. Sustainability 2023, 15, 10153. [Google Scholar] [CrossRef]
  14. Fan, L.; Cai, T.; Wen, Q.; Han, J.; Wang, S.; Wang, J.; Yin, C. Scenario simulation of land use change and carbon storage response in Henan Province, China: 1990–2050. Ecol. Indic. 2023, 154, 110660. [Google Scholar] [CrossRef]
  15. Li, X.; Huang, C.; Jin, H.; Han, Y.; Kang, S.; Liu, J.; Cai, H.; Hu, T.; Yang, G.; Yu, H. Spatio-temporal patterns of carbon storage derived using the InVEST model in Heilongjiang Province, Northeast China. Front. Earth Sci. 2022, 10, 846456. [Google Scholar] [CrossRef]
  16. Bateman, I.J.; Mace, G.M.; Fezzi, C.; Atkinson, G.; Turner, R.K. Economic analysis for ecosystem service assessments. In Valuing Ecosystem Services; Edward Elgar Publishing: Cheltenham, UK, 2014; pp. 23–77. [Google Scholar] [CrossRef]
  17. Rosati, F.; Faria, L.G. Addressing the SDGs in sustainability reports: The relationship with institutional factors. J. Clean. Prod. 2019, 215, 1312–1326. [Google Scholar] [CrossRef]
  18. Allen, C.; Nejdawi, R.; El-Baba, J.; Hamati, K.; Metternicht, G.; Wiedmann, T. Indicator-based assessments of progress towards the sustainable development goals (SDGs): A case study from the Arab region. Sustain. Sci. 2017, 12, 975–989. [Google Scholar] [CrossRef]
  19. Jianwen, Z. Following the Charter of the United Nations: The Basic Guarantee for the Realization of the Right to Development——From the Perspective of Transforming Our World: The 2030 Agenda for Sustainable Development. J. Hum. Rights 2016, 15, 485–508. [Google Scholar] [CrossRef]
  20. Guha, J.; Chakrabarti, B. Achieving the Sustainable Development Goals (SDGs) through decentralisation and the role of local governments: A systematic review. Commonw. J. Local Gov. 2019. [Google Scholar] [CrossRef]
  21. Schmidt-Traub, G.; Kroll, C.; Teksoz, K.; Durand-Delacre, D.; Sachs, J.D. National baselines for the Sustainable Development Goals assessed in the SDG Index and Dashboards. Nat. Geosci. 2017, 10, 547–555. [Google Scholar] [CrossRef]
  22. Chen, J.; Peng, S.; Zhao, X.; Ge, Y.; Li, Z. Measuring regional progress towards SDGs by combining geospatial and statistical information. Acta Geod. Cartogr. Sin. 2019, 48, 473–479. [Google Scholar] [CrossRef]
  23. Xian, Z.; Ba, Y.; Cheng, J. Relevance study on United Nations 2030 sustainable development goal (SDG) indicators and the policies. Stat. Res. 2021, 38, 4–14. [Google Scholar] [CrossRef]
  24. Scott, G.; Rajabifard, A. Sustainable development and geospatial information: A strategic framework for integrating a global policy agenda into national geospatial capabilities. Geo-Spat. Inf. Sci. 2017, 20, 59–76. [Google Scholar] [CrossRef]
  25. Chen, J.; Ren, H.; Geng, W.; Peng, S.; Ye, F. Quantitative Measurement and Monitoring Sustainable Development Goals (SDGs) with Geospatial Information. Geomat. World 2018, 25, 1–7. [Google Scholar]
  26. Yi, W.; Jiangmin, W.; Hanxiao, M.; Yan, G. Spatial pattern and influencing factors of coupling coordination degree between ecological vulnerability and comprehensive economic level in Gansu Province. J. Environ. Eng. Technol. 2023, 13, 808–816. [Google Scholar] [CrossRef]
  27. Jiang, L.; Bai, L.; Wu, Y. Coupling and coordinating degrees of provincial economy, resources and environment in China. J. Nat. Resour. 2017, 32, 788–799. [Google Scholar] [CrossRef]
  28. Han, Z.; Zhao, Y.; Yan, X.; Zhong, J. Coupling coordination mechanism and spatial-temporal relationship between gross ecosystem product and regional economy: A case study of Dalian. Econ. Geogr. 2020, 40, 1–10. [Google Scholar] [CrossRef]
  29. Mingtao, Y.; Jiajun, Q.; Meng, Q.; Qiankun, Z.; Dong, H. Measurement of coupling and coordination of socio-economic and ecological environment in rural villages of the Yellow River basin and analysis of influencing factors. Bull. Surv. Mapp. 2022, 101–105, 116. [Google Scholar] [CrossRef]
  30. Hao, Z.; Wang, Y. Evaluation of socio-economic-ecological environmental benefits of urban renewal projects based on the coupling coordination degree. Environ. Sci. Pollut. Res. 2023, 30, 56946–56968. [Google Scholar] [CrossRef]
  31. Xu, C.; Qian, C.; Yang, W.; Li, B.; Kong, L.; Kong, F. Spatiotemporal pattern of urban-rural integration development and its driving mechanism analysis in Hangzhou Bay urban agglomeration. Int. J. Environ. Res. Public Health 2022, 19, 8390. [Google Scholar] [CrossRef]
  32. Liu, F.; Wang, C.; Luo, M.; Zhou, S.; Liu, C. An investigation of the coupling coordination of a regional agricultural economics-ecology-society composite based on a data-driven approach. Ecol. Indic. 2022, 143, 109363. [Google Scholar] [CrossRef]
  33. Ye, S.; Ge, Y.; Xu, S.; Ma, X. Measurement and prediction of coupling coordination level of economic development, social stability and ecological environment in Qinghai—Thoughts on sustainable societal safety. Sustainability 2022, 14, 10515. [Google Scholar] [CrossRef]
  34. Wang, Y.; Zhang, C.; Lu, A.; Li, L.; He, Y.; ToJo, J.; Zhu, X. A disaggregated analysis of the environmental Kuznets curve for industrial CO2 emissions in China. Appl. Energy 2017, 190, 172–180. [Google Scholar] [CrossRef]
  35. Li, J.; Hou, L.; Tang, L. Relationship between air quality and economic growth in key areas of air pollution control in China based on the Environmental Kuznets Curve. Acta Ecol. Sin. 2021, 41, 8845–8859. [Google Scholar] [CrossRef]
  36. Levrel, H.; Kerbiriou, C.; Couvet, D.; Weber, J. OECD pressure–state–response indicators for managing biodiversity: A realistic perspective for a French biosphere reserve. Biodivers. Conserv. 2009, 18, 1719–1732. [Google Scholar] [CrossRef]
  37. Hein, L.; van Koppen, C.K.; van Ierland, E.C.; Leidekker, J. Temporal scales, ecosystem dynamics, stakeholders and the valuation of ecosystems services. Ecosyst. Serv. 2016, 21, 109–119. [Google Scholar] [CrossRef]
  38. Sherrouse, B.C.; Clement, J.M.; Semmens, D.J. A GIS application for assessing, mapping, and quantifying the social values of ecosystem services. Appl. Geogr. 2011, 31, 748–760. [Google Scholar] [CrossRef]
  39. Jiang, X.; Yang, Q.; Geng, Q.; Wang, X.; Liu, J. Spatial-temporal differentiation and driving mechanism of coordinated development of ecological-economic-society systems in the yangtze river economic belt. Resour. Environ. Yangtze Basin 2019, 27, 8–11. [Google Scholar] [CrossRef]
  40. Zhu, Y.; Yao, S. The coordinated development of environment and economy based on the change of ecosystem service value in Shaanxi province. Acta Ecol. Sin. 2021, 41, 3331–3342. [Google Scholar] [CrossRef]
  41. Zhou, T.; Chen, W.; Li, J.; Liang, J. Spatial relationship between human activities and habitat quality in Shennongjia Forest Region from 1995 to 2015. Acta Ecol. Sin. 2021, 41, 6134–6145. [Google Scholar] [CrossRef]
  42. Gai, M.; Wang, X.; Qi, C. Spatiotemporal evolution and influencing factors of ecological civilization construction in China. Complexity 2020, 2020. [Google Scholar] [CrossRef]
  43. Liu, C.; Yang, M. An empirical analysis of dynamic changes in ecological sustainability and its relationship with urbanization in a coastal city: The case of Xiamen in China. J. Clean. Prod. 2020, 256, 120482. [Google Scholar] [CrossRef]
  44. Lu, C.; Li, S.; Liu, J.; Xu, K. Coupling Coordination and Dynamic Response Analysis of New-Type Urbanization, Urban Infrastructure and Urban Environment— A Case Study of the Jiaodong Economic Circle. Int. J. Environ. Res. Public Health 2022, 19, 14909. [Google Scholar] [CrossRef]
  45. Lin, Y.; Peng, C.; Chen, P.; Zhang, M. Conflict or synergy? Analysis of economic-social-infrastructure-ecological resilience and their coupling coordination in the Yangtze River economic Belt, China. Ecol. Indic. 2022, 142, 109194. [Google Scholar] [CrossRef]
  46. Cui, D.; Bu, X.; Xu, Z.; Li, G.; Wu, D. Comprehensive evaluation and impact mechanism of high-quality development of China’s resource-based cities. Acta Geogr. Sin. 2021, 76, 2489–2503. [Google Scholar] [CrossRef]
  47. Wei, W.; Shi, P.; Wei, X.; Zhou, J.; Xie, B. Evaluation of the coordinated development of economy and eco-environmental systems and spatial evolution in China. Acta Ecol. Sin. 2018, 38, 2636–2648. [Google Scholar] [CrossRef]
  48. Jiang, W.; Wu, J. Spatio-temporal evolution of habitat quality in Guangdong-Hong Kong-Macao Greater Bay Area based on regional GDP and population spatial distribution. Acta Ecol. Sin. 2021, 41, 1747–1757. [Google Scholar] [CrossRef]
  49. Wang, S.; Cui, Z.; Lin, J.; Xie, J.; Su, K. The coupling relationship between urbanization and ecological resilience in the Pearl River Delta. J. Geogr. Sci. 2022, 32, 44–64. [Google Scholar] [CrossRef]
  50. Fang, C.; Zhou, C.; Gu, C.; Chen, L.; Li, S. Theoretical analysis of interactive coupled effects between urbanization and eco-environment in mega-urban agglomerations. Acta Geogr. Sin. 2016, 71, 531–550. [Google Scholar] [CrossRef]
  51. Fang, C. Theoretical foundation and patterns of coordinated development of the Beijing-Tianjin-Hebei urban agglomeration. Prog. Geogr. 2017, 36, 15–24. [Google Scholar] [CrossRef]
  52. Ouyang, X.; He, Q.; Zhu, X. Simulation of impacts of urban agglomeration land use change on ecosystem services value under multi-scenarios: Case study in Changsha-Zhuzhou-Xiangtan urban agglomeration. Econ. Geogr. 2020, 40, 93–102. [Google Scholar] [CrossRef]
  53. Yang, Z.; Tian, J.; Li, W.; Su, W.; Guo, R.; Liu, W. Spatio-temporal pattern and evolution trend of ecological environment quality in the Yellow River Basin. Acta Ecol. Sin. 2021, 41, 7627–7636. [Google Scholar] [CrossRef]
  54. Cui, D.; Chen, X.; Xue, Y.; Li, R.; Zeng, W. An integrated approach to investigate the relationship of coupling coordination between social economy and water environment on urban scale—A case study of Kunming. J. Environ. Manag. 2019, 234, 189–199. [Google Scholar] [CrossRef]
  55. Li, L.; Fan, Z.; Feng, W.; Yuxin, C.; Keyu, Q. Coupling coordination degree spatial analysis and driving factor between socio-economic and eco-environment in northern China. Ecol. Indic. 2022, 135, 108555. [Google Scholar] [CrossRef]
  56. Wang, L.; Wang, J.; Ding, J.; Li, X. Estimation and Spatiotemporal Evolution Analysis of Actual Evapotranspiration in Turpan and Hami Cities Based on Multi-Source Data. Remote Sens. 2023, 15, 2565. [Google Scholar] [CrossRef]
  57. Liu, Z.; Wang, J.; Ding, J.; Xie, X. Analysis of spatial–temporal evolution trends and influential factors of desert-oasis thermal environment in typical arid zone: The case of Turpan–Hami region. Ecol. Indic. 2023, 154, 110747. [Google Scholar] [CrossRef]
  58. Cui, X.; Guo, Y. Analysis on the spatio-temporal dynamic evolution of land use structure of western urban agglomerations in the past 40 years. J. Arid. Land Resour. Environ. 2022, 36, 16–24. [Google Scholar] [CrossRef]
  59. Pei, H.; Fang, S.; Qin, Z.; Hou, C. Method and application of ecological environment vulnerability evaluation in arid oasis—A case study of Turpan Oasis, Xinjiang. Geomat. Inf. Sci. Wuhan Univ. 2013, 38, 528–532. [Google Scholar] [CrossRef]
  60. Jie, X.; Yu, X.; Gaodi, X. Analysis on the spatio-temporal patterns of water conservation services in Beijing. J. Resour. Ecol. 2019, 10, 362–372. [Google Scholar] [CrossRef]
  61. Yangyang, W.; Yu, X.; Jie, X.; Gaodi, X.; Keyu, Q.; Jingya, L.; Yingnan, N.; Shuang, G.; Mengdong, H. Evaluation of Inner Mongolia Wind Erosion Prevention Service based on Land Use and the RWEQ Model. J. Resour. Ecol. 2022, 13, 763–774. [Google Scholar] [CrossRef]
  62. Wei, H.; Han, Q.; Yang, Y.; Li, L.; Liu, M. Spatial Heterogeneity of Watershed Ecosystem Health and Identification of Its Influencing Factors in a Mountain–Hill–Plain Region, Henan Province, China. Remote Sens. 2023, 15, 3751. [Google Scholar] [CrossRef]
  63. Dai, L.; Li, S.; Lewis, B.J.; Wu, J.; Yu, D.; Zhou, W.; Zhou, L.; Wu, S. The influence of land use change on the spatial–temporal variability of habitat quality between 1990 and 2010 in Northeast China. J. For. Res. 2019, 30, 2227–2236. [Google Scholar] [CrossRef]
  64. Wu, Q.; Xie, R.; Song, C. Research on the coordinated development of tourism, economy and environment in Guangdong Province. Ecol. Econ. 2021, 37, 140–146. [Google Scholar] [CrossRef]
  65. Yang, M.; Jiao, M.; Zhang, J. Coupling Coordination and Interactive Response Analysis of Ecological Environment and Urban Resilience in the Yangtze River Economic Belt. Int. J. Environ. Res. Public Health 2022, 19, 11988. [Google Scholar] [CrossRef]
  66. Xiao, Y.; Wang, R.; Wang, F.; Huang, H.; Wang, J. Investigation on spatial and temporal variation of coupling coordination between socioeconomic and ecological environment: A case study of the Loess Plateau, China. Ecol. Indic. 2022, 136, 108667. [Google Scholar] [CrossRef]
  67. Jinfeng, W.; Chengdong, X. Geodetector: Principle and prospective. Acta Geogr. Sin. 2017, 72, 116–134. [Google Scholar] [CrossRef]
  68. He, J. Sustainable Evaluation of Urban Agglomeration based on SustainableDevelopment Goals Indicator—A Case Study of Guangdong-HongkongMacao Greater Bay Area, China Society of Urban Planning, Chengdu Municipal People’s Government, Spatial Governance for High Quality Development. In Proceedings of the Annual Conference on Urban Planning in China 2021 (08 Urban Ecological Planning), Chengdu, China, 25 September 2021. [Google Scholar] [CrossRef]
  69. Gan, L. Quantitative Evaluation of SDGs Sustainable Development Framework of Chengdu-Chongqing Economic Circle. Master’s Thesis, Chongqing Normal University, Chongqing, China, 2021. [Google Scholar] [CrossRef]
  70. Ma, S. SDGs-oriented Land Use Evolution Model Construction and Scenario Simulation in the Yangtze River Delta. Master’s Thesis, Nanjing Normal University, Nanjing, China, 2022. [Google Scholar] [CrossRef]
Figure 1. Overview map of the study area. (a) Location of the Tuha region in China; (b) location of the Tuha region in Xinjiang; and (c) all districts and counties of the Tuha region.
Land 13 00282 g001
Figure 2. Spatial and temporal changes in land use types in the Tuha region, 2010–2020. (a) Land use types, 2010–2020; (b) transfer matrix of land use types, 2010–2020; and (c) changes in land type, 2010–2020.
Land 13 00282 g002
Figure 3. Spatial distribution of water production in the Tuha region, 2010–2020.
Land 13 00282 g003
Figure 4. Spatial distribution of soil retention in the Tuha region, 2010–2020.
Land 13 00282 g004
Figure 5. Spatial distribution of carbon stocks in the Tuha Region, 2010–2020.
Land 13 00282 g005
Figure 6. Spatial distribution of habitat quality in the Tuha region, 2010–2020.
Land 13 00282 g006
Figure 7. Spatial distribution of economic, social, and ecological systems at the grid scale in 2010, 2015, and 2020.
Land 13 00282 g007
Figure 8. County-scale composite score by district and county system.
Land 13 00282 g008
Figure 9. Spatial distribution of the coupling coordination level in the Tuha region at the grid scale.
Land 13 00282 g009
Figure 10. The trend of coupling coordination degree of Turpan and Hami.
Land 13 00282 g010
Figure 11. Trends in coupling coordination among districts and counties in the Tuha region.
Land 13 00282 g011
Figure 12. Driving factor detection results.
Land 13 00282 g012
Table 1. Data sources.
Data TypeData NameData YearResolutionData Sources
Basic DataLand use data2010–202030 mResource and Environmental Science Data Center of Chinese Academy of Sciences (http://www.resdc.cn, accessed on 15 June 2023)
Natural Environment DataDEM 202030 mGeospatial Data Cloud (http://www.gscloud.cn, accessed on 18 June 2023)
China Soil Database20201 kmWorld Soil Database (HWSD) (https://soilgrids.org, accessed on 22 June 2023)
Annual Precipitation2010–20201 kmNational Earth System Science Data Center (http://gre.geodata.cn, accessed on 28 June 2023)
Evapotranspiration2010–20201 kmNational Earth System Science Data Center (http://gre.geodata.cn, accessed on 28 June 2023)
Temperature2010–20201 kmNational Earth System Science Data Center (http://gre.geodata.cn, accessed on 28 June 2023)
Socioeconomic DataPopulation Density2010–20201 kmResource and Environmental Science Data Center of Chinese Academy of Sciences (http://www.resdc.cn, accessed on 15 September 2023)
GDP2010–2020Statistical dataXinjiang Statistical Yearbook, Turpan Statistical Yearbook, Hami Statistical Yearbook
Statistics on food production, etc.2010–2020Statistical dataXinjiang Statistical Yearbook, Turpan Statistical Yearbook, Hami Statistical Yearbook
POI 2010–2020\Gaode, Baidu
Table 2. Ecosystem services evaluation.
Ecosystem ServicesMethodCalculation Formula
WYAnnual water yield module of the InVEST model Y x = 1 AE T x P x × P x
SCSediment delivery ratio module of the InVEST model SC = R × K × LS ( 1 C × P )
CSCarbon storage and sequestration module of the InVEST model C = C above + C below + C soil + C dead
HQHabitat quality module of the InVEST model Q x j = H j 1 D xj z D xj z + K 2
Table 3. SDG-based social–economic–ecological system of ecosystem evaluation indicators and their weights.
TypeEvaluation IndicatorsCorresponding SDG IndicatorsTendWeights
Ecological indicatorsWYSDG 6.6 Protection and restoration of water-related ecosystems+0.282
SCSDG 15.3 Combating desertification and rehabilitating degraded land and soil+0.133
CSSDG 13.2 Integration of climate change initiatives into national policies, strategies, and planning+0.339
HQSDG 15.5 Implementation of urgent and significant action to reduce the degradation of natural habitats+0.187
Rural fertilizer applicationSDG 2.3 Sustainable agriculture0.058
Social indicatorsGrain productionSDG 2.4 Establishment of sustainable food production systems to increase productivity and yields+0.136
Total power of agricultural machinerySDG 2.a Increase in investment in facilities and technologies to enhance agricultural productivity+0.054
Number of head of livestock at the end of the yearSDG 2.3 Production per labor unit by size of agriculture/livestock/forestry enterprise+0.144
Total sown area of cropsSDG 2.3 Increasing agricultural productivity+0.089
Number of employees in the whole societySDG 8.5 Achieving full and productive employment+0.120
Number of hospital beds per 10,000 populationSDG 3.8 Characterization of the population’s ability to access effective health care and ensure health for all +0.075
Number of health technicians per 10,000 populationSDG 3.c Distribution of health workers+0.077
Health care financial expenditureSDG 3.b Total net ODA to medical research and basic health sectors+0.145
Education financial expenditureSDG 4.8 High-quality education+0.124
Cultivated land areaSDG 2.3 Sustainable agriculture+0.068
Effective irrigated area of farmlandSDG 6.4 Improving water use efficiency+0.069
Economic indicatorsGDPSDG 1.1 Poverty eradication+0.114
GDP per capitaSDG 8.4 Improving the quality of economic development+0.111
Ratio of primary industry GDP to GDPSDG 8.4 Improving the quality of economic development+0.061
Ratio of secondary industry GDP to GDPSDG 8.4 Improving the quality of economic development+0.030
Ratio of tertiary industry GDP to GDPSDG 8.4 Improving the quality of economic development+0.045
Total retail sales of consumer goodsSDG 12.2 Sustainable consumption and production patterns+0.138
Average salary of on-the-job workersSDG 8.5 Achieving full and productive employment+0.074
Investment in fixed assets of society as a wholeSDG 8.4 Improving the quality of economic development+0.140
Income of the local financesSDG 17.1 Improve tax collection and revenue collection+0.140
Total income of the rural economySDG 2.3 Gross income of small-scale food producers+0.080
Gross output value of the agriculture, forestry, animal husbandry, fishery industries, etc.SDG 2.3 Production per labor unit by size of agriculture/livestock/forestry enterprise+0.067
Table 4. Coupling harmonization classification table.
Developmental StageDegree of Coupling CoordinationType of Coupling
Dysfunctional stages of development 0 D < 0.3 Severe disorder
0.3 D < 0.39 Mild disorder
Transition phase 0.4 D < 0.49 On the verge of disorder
0.5 D < 0.59 Barely coordinated development
Harmonized development phase 0.6 D < 0.69 Primary coordinated development
0.7 D < 0.79 Intermediate coordinated development
0.8 D < 1 High-quality and coordinated development
Disclaimer/Publisher’s Note: The statements, opinions and data contained in all publications are solely those of the individual author(s) and contributor(s) and not of MDPI and/or the editor(s). MDPI and/or the editor(s) disclaim responsibility for any injury to people or property resulting from any ideas, methods, instructions or products referred to in the content.

