Abstract
The urban agglomeration in the middle reaches of the Yangtze River holds a crucial strategic position in China’s economic and social development landscape. Exploring the coordinated development effects within the digital economy and innovation in this area is conducive to promoting the development of the central region of China and the Yangtze River Economic Belt. This paper uses the 28 sample cities in urban agglomeration in the middle reaches of the Yangtze River as the study sample, and constructs a digital economy indicator system and an urban innovation efficiency indicator system. Based on the coupling coordination degree model, we use kernel density estimation, the Markov chain algorithm, and the Dagum Gini coefficient decomposition method to empirically investigate the dynamic trends in coupling coordination development between the digital economy and urban innovation efficiency from 2012 to 2021. The research results reveal an overall upward trend in the digital economy, innovation efficiency, and coupling coordination development stages. However, the upward trend is accompanied by the risk of recession. Moreover, there are significant differences between cities, as highlighted by the differences between Wuhan and other cities. In the light of the findings, it is recommended that government departments take measures, including being alert to the risk of regressive development, developing cities in a realistic manner, and drawing on the experiences of outstanding cities in development. This research can provide new insights and empirical references for government entities to take measures for a more coordinated development of the digital economy and innovation efficiency in the urban agglomeration in the middle reaches of the Yangtze River.
1. Introduction
Tapscott first proposed the concept of the digital economy (DE) [1]. With the rise of the wave of digitization, the DE, as a new economic form formed after the industrial economy, continues to attract the attention of all countries in the world [2]. The 20th CPC National Congress made the instruction to accelerate the construction of digital China, and the construction of digital China has become the necessary way to promote Chinese-style modernization in the digital era. As the primary driver of economic and social development, innovation has become the development engine and guiding force of the DE by promoting technology iteration. With the DE booming, the boundaries of the DE have expanded and digital technologies have been applied in more areas. The DE actively contributes to economic development by boosting consumption, creating employment opportunities, and innovating, while enabling the accelerated evolution of technological innovations [2,3]. It can be seen that there is an interconnected and mutually influential relation between the DE and innovation, which is crucial for economic and social realization of high-quality development.
The mutually reinforcing relationship between the DE and innovation is evidenced in the existing literature. Existing research on the impact of the DE on innovation can be summarized into the following two major aspects. From a macro perspective, the positive effects of the DE on innovation were proven by analyzing data from 29 countries [4], Chinese provinces [2,3], and Chinese prefecture-level cities [5]. From a micro perspective, by conducting empirical research on the relevant data of Chinese A-share listed companies and Chinese manufacturing listed companies, the significant promotion effect of the DE on enterprise innovation has been confirmed [6,7,8,9]. It follows that the DE is a driving force for innovation development of macro- and micro-agents. Existing literature on the impact of technological innovation on the DE focuses on studies of driving force and spatial variation. In terms of driving force, Chen et al. analyzed the data of 31 provinces in China; the results showed that strong technological innovation has driven the DE to a high level of development [10]. By analyzing the data of 171 listed companies in the field of DE, Yang et al. conducted a study on the enhancement mechanism of corporate competitiveness, and proposed that innovation, as a key contributing factor in the DE, significantly affected the competitiveness of companies in the field of DE [11]. In terms of spatial variation, scholars have conducted empirical studies based on Chinese provincial data, which show that innovation accelerates the development of the DE and that the intensity of this positive effect varies across regions [12,13]. An empirical study of China’s eight comprehensive economic regions reveals a similar result [14]. It can be seen that innovation is the basis and important driving force for the development of the DE. Innovation will accelerate the continued growth of the DE.
In addition, co-evolution within urban systems facilitates in-depth studies of urban development from temporal and spatial perspectives [15]. The research idea of evolution and development is of great significance in regional studies [16]. Scholars have also studied the coupling coordination evolution of the DE and innovation within different urban systems from the perspective of co-evolution. For example, Zhang et al. investigated the coupling and coordinated development between green science and innovation efficiency (IE) and the DE in various provinces of China [17]. Li and Feng examined the coupled coordination relation between innovation and DE development in the four strategic regions of China [18]. A great number of research methods have been utilized in the study of coupling and coordination relations, including methods such as kernel density estimation, Markov chain, and Dagum Gini coefficient decomposition [18,19].
In conclusion, the existing research content related to innovation and the DE mainly concerns evaluation measures, mutual unidirectional relations of the two, as well as the coupling coordination relation. In the study of the coupling coordination relation, the sample regions mainly focus on the provinces in China. However, the scope of the research is limited to provinces and strategic urban agglomeration; they care less about intermunicipal or inner cities in major urban agglomeration comparisons. Prefectural cities, as spatial subregions of the province and the urban agglomeration, play an important role in supporting the development of the provincial region. It is worthwhile to pay attention to the differences in the level of development between prefectural cities within major urban agglomeration.
The urban agglomeration in the middle reaches of the Yangtze River (UAMRYR), located in the central part of China, is one of the key regions of the Yangtze River Economic Belt, with a unique spatial geographic location and national strategic position, and it is a crucial region for the rise of the central region and the development of the Yangtze River Economic Belt [20]. Therefore, promoting the coordinated development of the UAMRYR is an inevitable requirement in the context of the national major regional development strategy. Since the implementation of the regional development strategy, the UAMRYR has seen a significant increase in its innovative strength and a steady improvement in the level of the DE. It not only provides a new spatial carrier for the improvement of IE, but also provides a new focus point for the high-quality development of the DE. IE synergizes the development of the DE, injecting new kinetic energy for the promotion of the integrated high-quality development of the UAMRYR [18].
However, compared with the other four large urban agglomerations in China, the development of the UAMRYR has been relatively slow, and there are significant developmental differences existing within the urban agglomerations [21]. Therefore, scientific evaluating and comprehensively analyzing the IE and DE development of the UAMRYR will help to clarify and solve the development dilemma of the UAMRYR, which is of great significance for the long-term high-quality development of the UAMRYR. In addition, it will also provide some experiences for the development of other similar regions in the world.
In this paper, we select 28 prefectural-level cities in the UAMRYR as the research objects and review the Statistical Yearbook to obtain the research data from 2012 to 2021. Based on the coupling coordination degree model of dual systems of IE and DE, we comprehensively apply kernel density estimation, the Markov chain algorithm, and the Dagum Gini coefficient decomposition method, to explore the specific performance, evolution logic, and difference paths of the coupling effect of IE and the DE in the UAMRYR. The research findings answer the fundamental question of innovation development of the representative urban agglomerations in the central region of China and provide a rationalized basis for development and precise policy inspiration for the further formation of the integrated and coordinated development pattern of the UAMRYR.
We try to make the following contributions:
- We establish comprehensive level evaluation index systems for IE and DE separately and measure and compare the IE and DE of the sample cities in the UAMRYR.
- We construct a coupling coordination degree (CCD) model between DE and IE of the 28 sample cities in the UAMRYR, calculate the CCD values of the sample cities for the period of 2012–2021, and analyze the fluctuating tendency.
- We describe and analyze the spatial and temporal distribution and evolution characteristics of the CCD values of the UAMRYR by using kernel density estimation, the Markov chain algorithm, and the Dagum Gini coefficient decomposition method and provide a scientific foundation for relevant departments to formulate policies to realizing differentiated development and integrated regional development of the UAMRYR.
2. Materials and Methods
2.1. Study Area
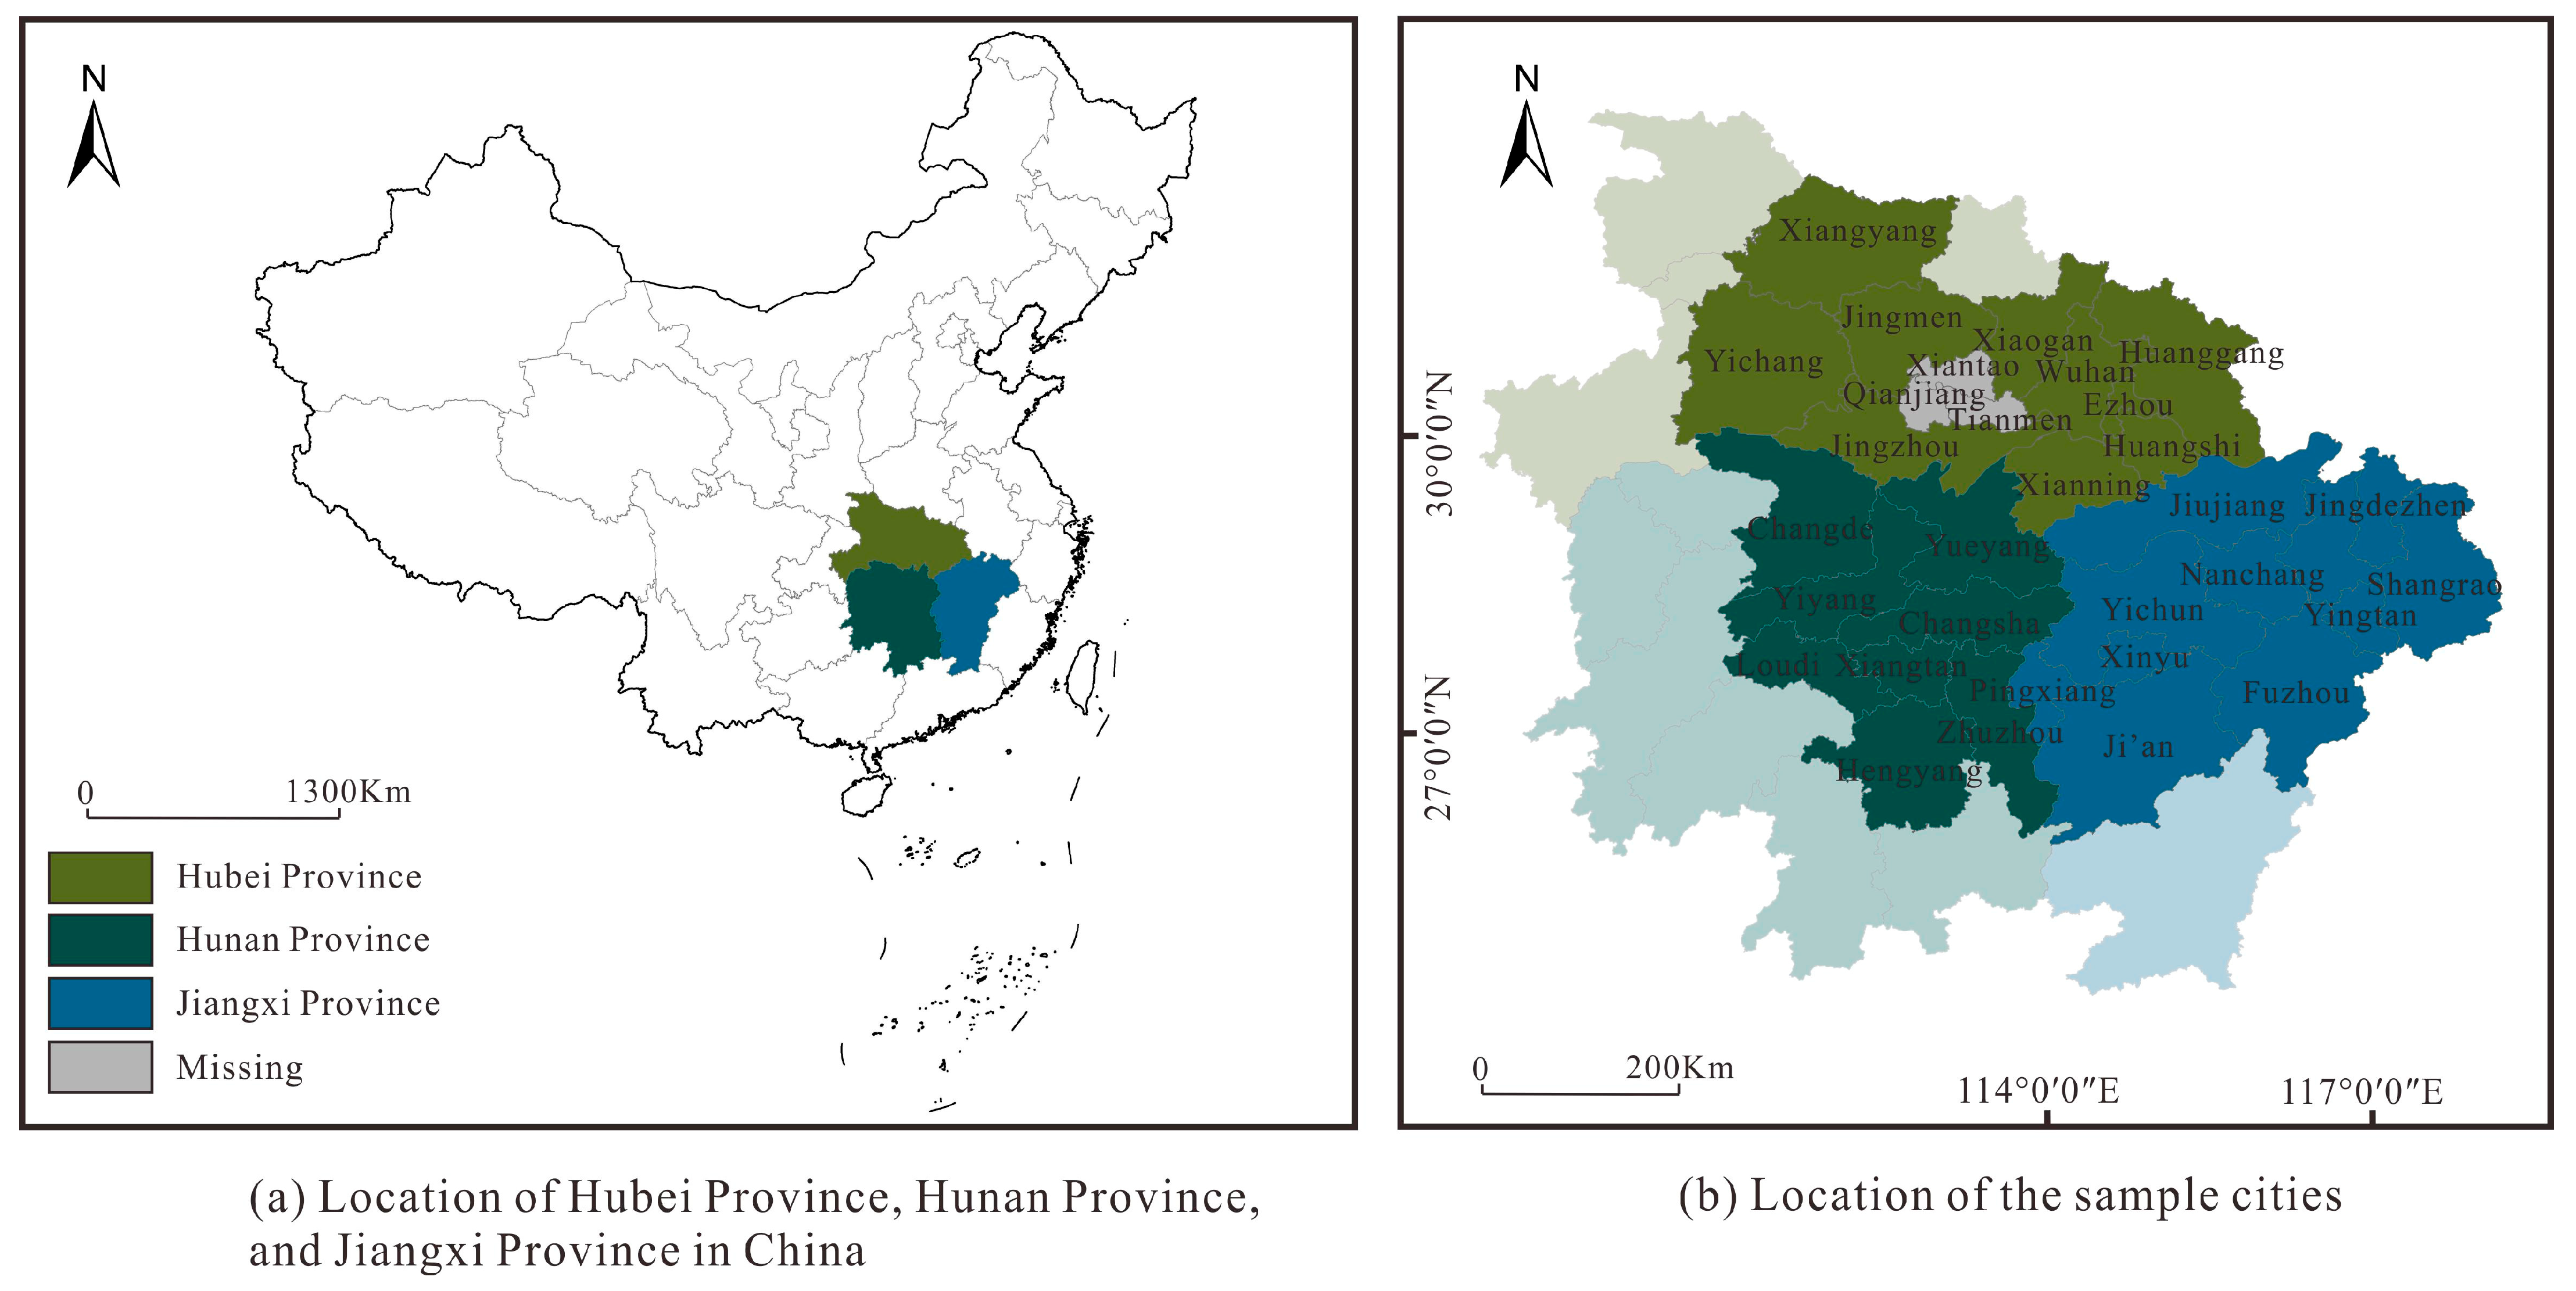
The UAMRYR is located in central China, spanning 3 provinces: Hubei Province, Hunan Province, and Jiangxi Province. Refer to Figure 1a for details. It consists of 31 cities, within a latitude range of 26°07′–32°10′ N and a longitude range of 110°15′–118°29′ E. Due to the absence of crucial data indicators, Xiantao, Qianjiang, and Tianmen are not included in the sample cities. In this paper, the remaining 28 cities are selected for the study. These 28 sample cities are grouped into three regions based on their locations: Hubei Province area, Hunan Province area, and Jiangxi Province area. Hubei Province area includes 10 sample cities: Wuhan, Huangshi, Yichang, Xiangyang, Ezhou, Jingmen, Xiaogan, Jingzhou, Huanggang, and Xianning. Hunan Province area includes 8 sample cities: Changsha, Zhuzhou, Xiangtan, Hengyang, Yueyang, Changde, Yiyang, and Loudi. Jiangxi Province area includes 10 sample cities: Nanchang, Jingdezhen, Pingxiang, Jiujiang, Xinyu, Yingtan, Ji’an, Yichun, Fuzhou, and Shangrao. Refer to Figure 1b for details.

Figure 1.
Study area.
2.2. Data Sources
This research examines panel data of the 28 sample cities from 2012 to 2021. The relevant data of the indicators are collected from the “China City Statistical Yearbook (2013–2022)”, “HUBEI Statistical Yearbook (2013–2022)”, “HUNAN Statistical Yearbook (2013–2022)”, “JIANGXI Statistical Yearbook (2013–2022)”, “Chinese Research Data Services”, “The Peking University Digital Financial Inclusion Index of China”, as well as provincial and municipal statistical bulletins on economic and social development [22].
2.3. Indicator Systems
2.3.1. Indicator System for the DE
In order to better measure the development level of the DE of the UAMRYR, we refer to the related research by Zhao et al. and Shi et al., develop a comprehensive index system of DE development under the principle of systematicity, scientificity, objectivity, and data availability [23,24].
Specific indicators are shown in Table 1, and the entropy method is used to determine the index layer weight.

Table 1.
Digital economy indicator system.
2.3.2. Indicator System of IE
Urban IE is deeply related to the city’s innovation performance, which largely reflects the ability of the urban innovation inputs to be transformed into innovation outputs, and is a key factor for the city to gain a competitive advantage [25].
In the existing literature, two primary dimensions to measuring IE are identified, which include inputs and outputs. Existing research often uses indicators such as personnel and funding to measure city innovation inputs, and selects indicators like patents to measure city innovation outputs [26,27,28]. Moreover, the IE of cities is calculated based on the input–output process.
In terms of input indicators, drawing on previous research by Fan et al., we select the number of employees engaged in scientific research and technical services as the personnel input indicator, and scientific expenditure as the financial input indicator [29].
In terms of output indicators, patents provide a fairly reliable measure of innovation [30,31]. Considering that the number of patent applications does not have an approval waiting period and is less affected by subjective human factors such as policies and approval departments, it can more accurately reflect the true level of innovation output [29,32]. In China, patents are categorized into three types: invention patents, utility model patents, and design patents [33]. Each type represents different levels of creativity and technicality [34]. Therefore, this paper selects the number of invention patent applications, the number of utility model patent applications, and the number of design patent applications as specific output indicators.
Using the aforementioned indicator system, we measure the IE of 28 sample cities in the UAMRYR from 2012 to 2021.
Specific indicators are shown in Table 2.
Table 2.
Innovation efficiency indicator system.
2.4. Methods
2.4.1. The Entropy Method
Existing research has mainly utilized the entropy method and principal component analysis to measure the level of the DE’s development [35,36,37,38]. Subjective weighting methods, such as principal component analysis, may create problems such as randomness due to human factors [35,39]. To avoid this problem, we follow the general practice in existing research [40,41] and employ the entropy method, a type of objective weighting method, to measure the DE development levels of the 28 sample cities in the UAMRYR from 2012 to 2021. To facilitate comparisons across different years, this paper follows the approach of Guan et al. by including a time variable in the model [42]. The steps are as follows:
(1) Given that various measurement indicators for the level of DE development differ in their dimensions, it is essential to ensure horizontal comparability by using the range method to standardize each indicator. The indicators we select are positive indicators, which can be calculated using the following formula:
where represents the value of the k-th indicator of the j-th sample city in i-th year.
(2) Data shifting of 0.00000001 is performed to prevent standardized data from having zero values:
(3) Calculate the proportion of the k-th indicator for the j-th sample city in i-th year:
where r represents the number of years, and n represents the number of sample cities.
(4) Calculate the information entropy and redundancy of the k-th indicator:
(5) Calculate the weight of the k-th indicator:
where m represents the number of indicators.
(6) Calculate the comprehensive score of indicators:
2.4.2. SBM-DEA Model
Existing research has mainly utilized Data Envelopment Analysis (DEA) and the entropy method to quantitatively measure and study regional innovation [26,43,44,45]. The Data Envelopment Analysis (DEA) method is a non-parametric approach for handling multiple decision-making units with multiple identical inputs and outputs [46]. This method has several advantages, such as no requirement of predicting parameters and weights, and no requirement of setting specific input–output functions [47]. To some extent, this method can mitigate the influence of subjective human factors [48,49]. Based on these advantages, it is widely used for assessing the relative efficiency of similar units [50].
However, the traditional DEA model based on radial and linear piecewise measures can lead to overestimating decision unit efficiency and can constrain efficient decision units to have efficiency values of 1 [51]. Tone (2002) proposed a non-radial DEA model—the Super-Efficiency DEA model based on slacks (SBM, slacks-based measure) [52]. This model fully considers the slackness issues of inputs and outputs, and distinguishes and ranks the efficiency values for efficient decision units [53,54,55].
Therefore, this paper selects the Super-Efficiency SBM-DEA model to measure the IE of the 28 sample cities in the UAMRYR from 2012 to 2021. Given that the evaluation of urban IE requires considering both input and output perspectives and most production units in reality operate under Variable Returns to Scale (VRS) conditions, this paper proposes constructing a non-oriented VRS Super-Efficiency SBM-DEA model. The model is set in the following formula:
In Equations (8) and (9), represents the super-efficiency value, where 1. m, s, and n represent the number of input indicators, output indicators, and decision units, respectively. is used to exclude a situation where the efficiency value of a decision unit is 1, preventing it from referencing its own frontier construction. represents the linear combination coefficients for all decision units. and refer to the i-th input indicator for the j-th and k-th decision units, respectively. Similarly, and refer to the r-th output indicator for the j-th and k-th decision units, respectively. and are the slack variables for the i-th input indicator and r-th output indicator, respectively.
2.4.3. Dual-System CCD Model
The concept of “coupling” originally stems from physics, revealing the processes of coordinated development, mutual cooperation, and influence between systems [56,57,58,59]. In this paper, we construct a CCD model for the two systems of IE and DE to accurately depict the interactive relationship between city IE and DE.
The formula is as follows:
In Equation (10), and represent the comprehensive values of IE and DE, respectively. C denotes the coupling degree between the two systems.
In Equation (11), T stands for the comprehensive coordination index, and and are the respective weights assigned to the systems. In this paper, IE and DE are of equal importance, hence assigning them equal weights, i.e., and .
In Equation (12), D represents the CCD value.
On this basis, utilizing the research findings of Yuan et al. [60] and Li and Feng [18], the CCD values are divided into four level, as shown in Table 3 below.
Table 3.
Classification of the coupling coordination degree values.
2.4.4. Kernel Density Estimation Method
Kernel density estimation (KDE) is a non-parametric estimation method that does not require a predefined function. It is better suited for estimating unknown distributions and can provide an intuitive representation of the dynamic evolution of measurement values for the research object [61,62]. Based on the advantages of the KDE method mentioned above, this paper uses the KDE method to estimate the distribution of the CCD values for each sample city from 2012 to 2021. Assuming f(x) is the distribution function for the set X, and the sample observations are independent and identically distributed, the formula at point x is defined as follows:
where n represents the number of sample cities, h is the bandwidth parameter, represents the mean of the observed values, and is the kernel function.
2.4.5. Markov Chain Algorithm
A Markov chain reveals the evolutionary trend of each type by constructing a state transfer matrix to calculate the probability distribution under the condition that the time and state are discrete [63,64]. In this paper, the Markov chain method is employed to study the transition probabilities between different coupling types of cities within the sample years in the 28 sample cities. Here are the specific details:
In Equation (14), represents the random variable X having a coupling coordination type of j at time t. The state of the random variable X at time t in the future is only influenced by the adjacent previous period. denotes the transition probability of a city’s coupling coordination state, shifting from the i-th type in year t − 1 to the j-th type in year t.
In Equation (15), represents the total number of occurrences of the i-th coupling coordination type. represents the number of occurrences in which the coupling coordination type changes from the i-th type to the j-th type.
2.4.6. Dagum Gini Coefficient Decomposition Method
Compared to Theil’s Index and the traditional Gini coefficient, the Dagum Gini coefficient effectively solves the problem of sample data cross-overlapping [63,64,65,66]. This approach has been widely adopted for characterizing and analyzing regional differences. In this paper, the sample cities are divided into the Hubei Province area, Hunan Province area, and Jiangxi Province area. The Dagum Gini coefficient for the CCD values of the sample cities are calculated from 2012 to 2021, and they are decomposed to analyze the differences between the areas. The formula is as follows.
where k represents the number of regional divisions, j and h represent different areas. n represents the total number of sample cities within each area, while and represent the number of sample cities within area j and area h, respectively. and represent the CCD values of sample city i in area j and sample city r in area h. represents the average CCD value.
Before decomposing the Dagum Gini coefficient, it is necessary to sort the means of the CCD values within the divided areas:
Dagum (1997) decomposed the overall Gini coefficient G into three components: Intra-Group Gini coefficient , Inter-Group Gini coefficient , and Transvariation Intensity , and the relationship between them satisfies [67]. The specific calculation formulas are as follows:
In Equation (18), represents the Gini coefficient in area j.
In Equation (19), represents the Intra-Group Gini coefficient.
In Equation (20), represents the Gini coefficient between area j and area h.
In Equation (21), represents the Inter-Group Gini coefficient.
In Equation (22), represents the Transvariation Intensity, where and for .
In Equations (23)–(25), represents the relative impact of the CCD values between area j and area h. represents the difference between CCD values between area j and area h, which is the mathematical expectation of the sum of all sample values where for area j and area h. represents the first moment of Transvariation Intensity, which is the mathematical expectation of the sum of all sample values where for area j and area h. and represent the cumulative density distribution functions for area j and area h.
3. Results
3.1. DE Development Status
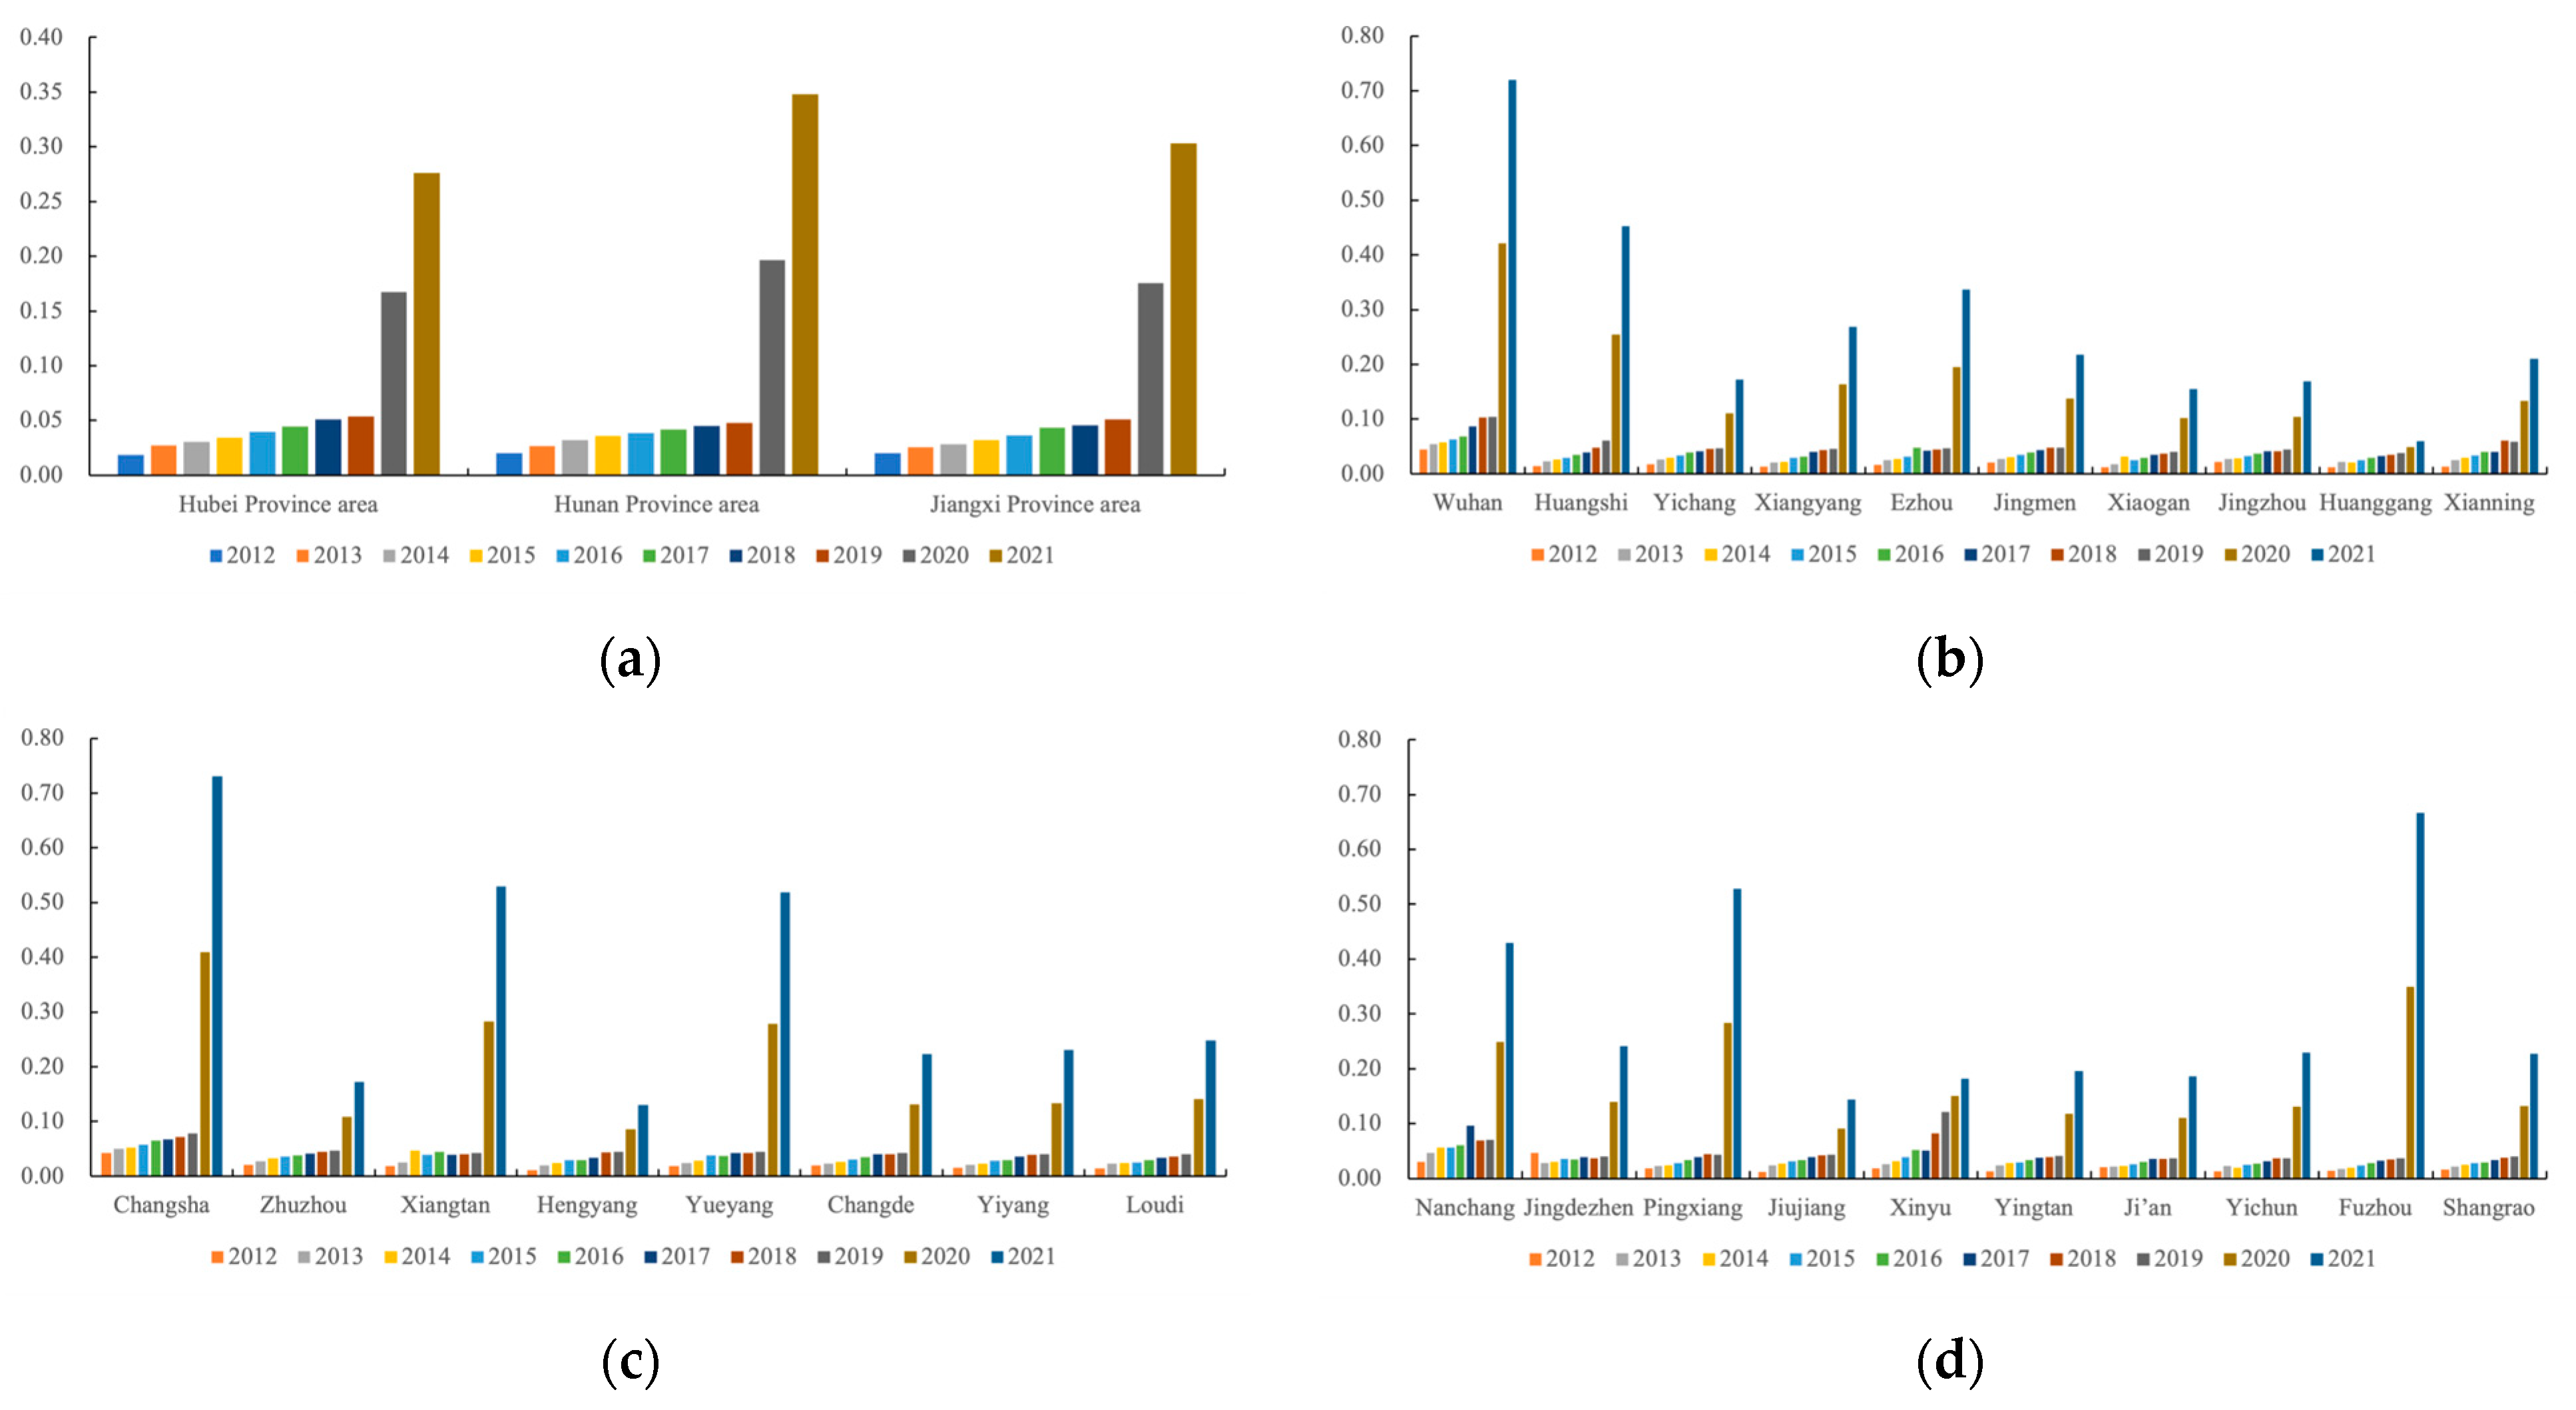
Figure 2 displays the DE development levels of the 28 sample cities in the UAMRYR from 2012 to 2021. Overall, from 2012 to 2021, the DE development levels of Hubei Province area, Hunan Province area, and Jiangxi Province area have been progressively improving. Starting in 2020, the impact of the COVID-19 pandemic accelerated the growth of the DE. Furthermore, when comparing these three areas, it was evident that their DE development trends have consistently shown synchronized growth. This information is illustrated in Figure 2a. Throughout the 2012–2021 period, provincial capital cities, including Wuhan, Changsha, and Nanchang, significantly outperformed other cities in terms of DE development. Among these provincial capital cities, Wuhan consistently maintained its leading position in DE development, aligning with the findings of the “2022 China Digital Economic Development Index”. This pattern is detailed in Figure 2b–d.
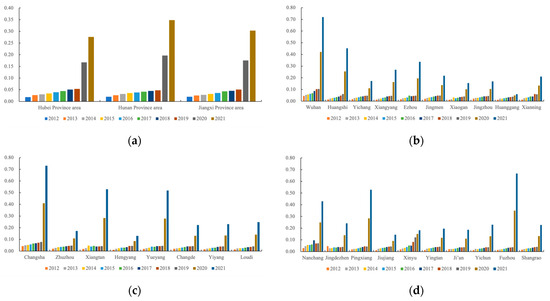
Figure 2.
The status of development of the digital economy from 2012 to 2021. (a) Mean. (b) The 10 sample cities in Hubei Province area. (c) The 8 sample cities in Hunan Province area. (d) The 10 sample cities in Jiangxi Province area.
3.2. IE Situation
Table 4 shows the IE of the 28 sample cities in the UAMRYR from 2012 to 2021. Overall, during 2012–2021, the IE trend experienced fluctuations. Compared to 2012, the IE in 2013 declined from 0.338 to 0.185. Then, the years from 2013 to 2019 witnessed a strong upward trend, increasing from 0.186 in 2013 to 0.512 in 2019. However, a noticeable decline occurred in 2020 and 2021 compared to previous years. The IE for 2020 and 2021 declined from 0.512 to 0.169 and 0.306, respectively. From a temporal perspective, there was a significant increase in the number of cities with effective efficiency. In 2018 and 2019, there were six sample cities each that achieved effective efficiency, and in 2017, five sample cities reached effective efficiency. This marked a significant increase compared to the two sample cities that achieved effective efficiency in 2016. During the sample period, Changsha maintained effective efficiency for three consecutive years, while Jiujiang, Fuzhou, and Wuhan achieved effective efficiency for two consecutive years. From a spatial perspective, there are development differences within the UAMRYR, and the development of the IE in Wuhan far exceeded that of other sample cities. Wuhan achieved effective efficiency for two years and maintained an efficiency level exceeding 0.5 for five years between 2012 and 2021, indicating relatively high overall IE compared to other sample cities. Over the ten-year sample period, several sample cities, apart from Wuhan, achieved effective efficiency in their innovation development processes. However, the number of times that they realized effective efficiency was much fewer than that of Wuhan. For example, cities such as Jingdezhen, Jiujiang, Xinyu, Shangrao, Changsha, and Loudi achieved effective efficiency for three years, while Yingtuan and Fuzhou achieved it for two years. Cities like Pingxiang, Yichun, Ezhou, Xiangtan, Changde, and Yiyang achieved effective efficiency for one year.
Table 4.
Innovation efficiency situation from 2012 to 2021.
3.3. Situation of the CCD Values
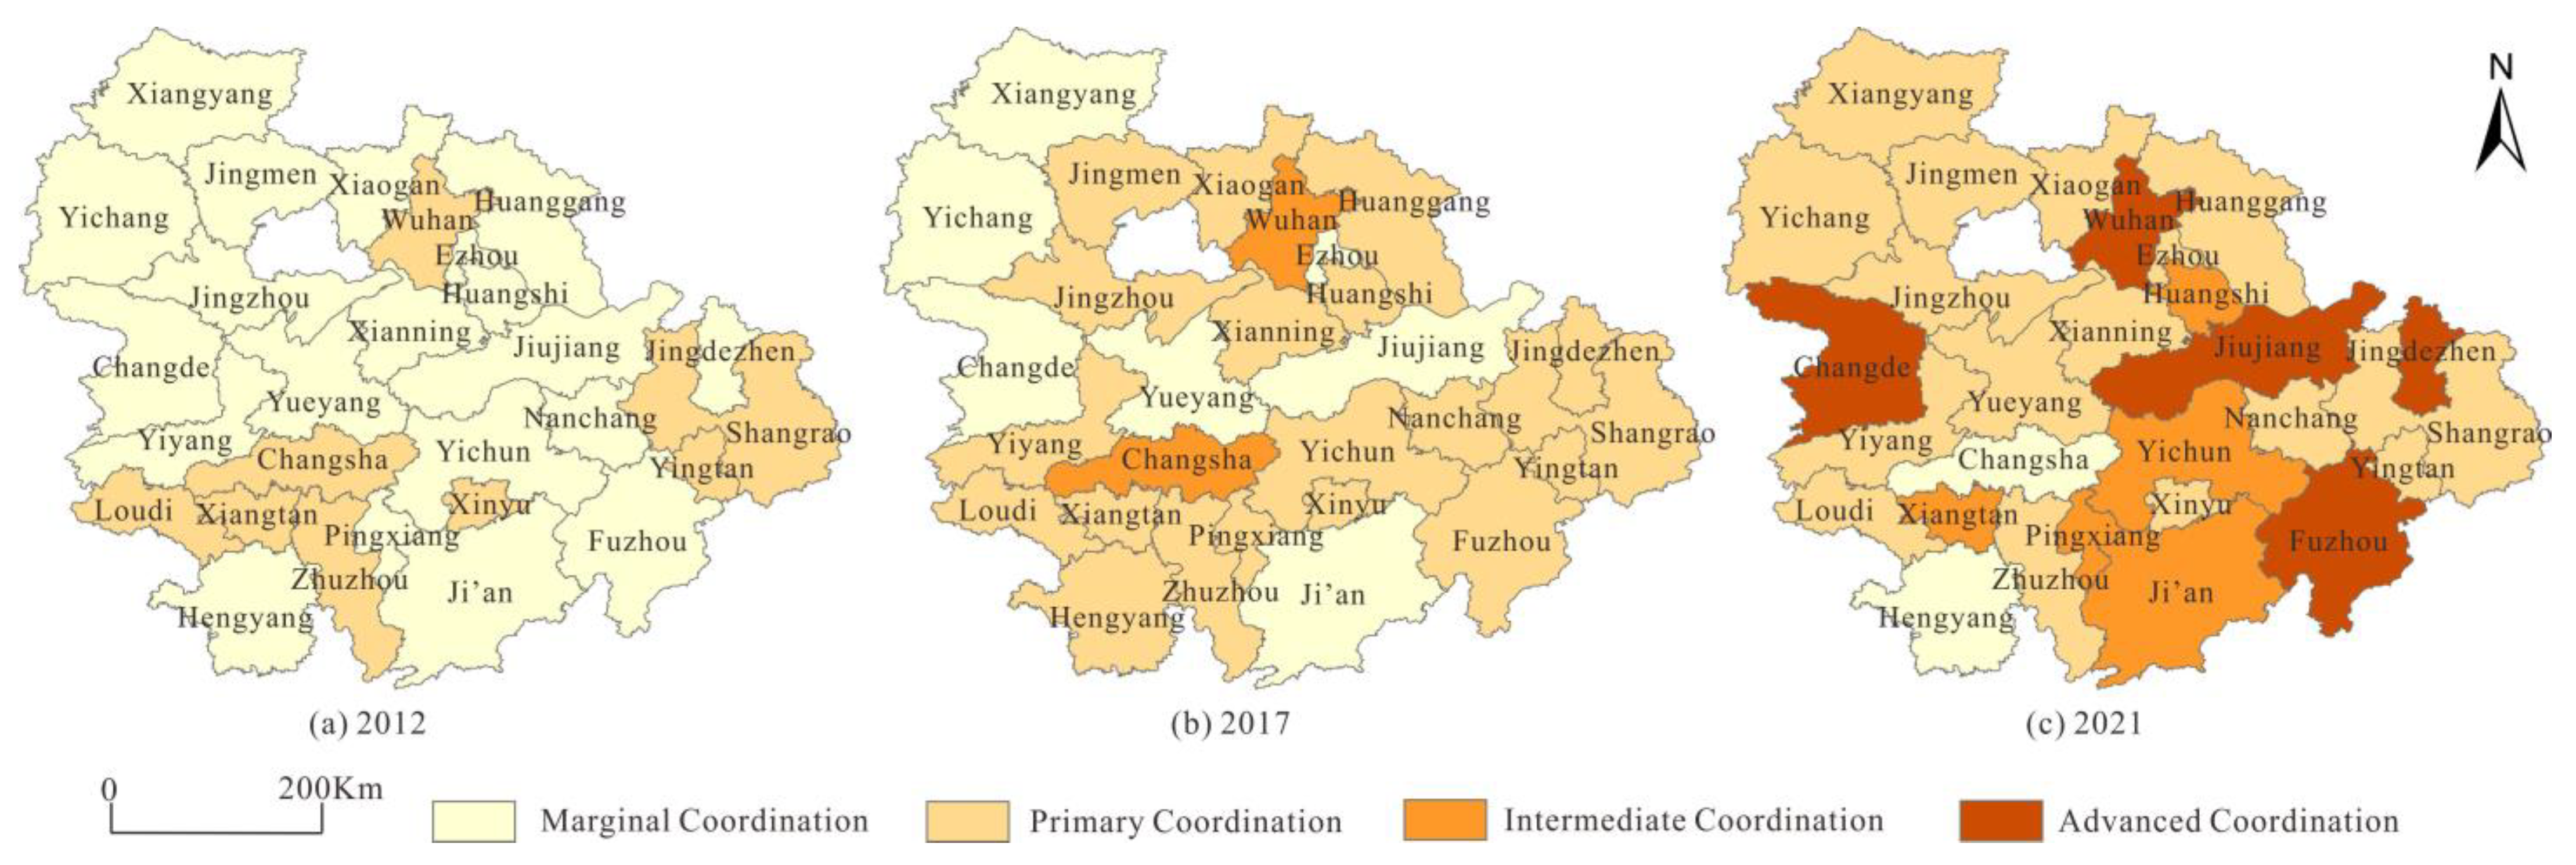
Figure 3 presents the spatial distribution and evolution of the CCD values for the 28 sample cities in the UAMRYR in 2012, 2017, and 2021. It can be observed that in 2012, the majority of the sample cities were in the marginal coordination stage. Only Wuhan, Changsha, Zhuzhou, Xiangtan, Loudi, Xinyu, Yingtan, and Shangrao were in the primary coordination phase. No sample cities achieved either the intermediate or advanced coordination stages. In 2017, compared to 2012, the number of sample cities in the marginal coordination phase decreased, and the number of sample cities in the primary coordination phase increased. Meanwhile, Wuhan and Changsha progressed to the intermediate coordination stage for the first time, yet none reached the advanced coordination stage. In 2021, with the exception of a very few sample cities that remained in the marginal coordination stage, the rest had entered various coordination states, with their coordination levels further improving. Wuhan, Changde, Jingdezhen, Jiujiang, and Fuzhou were already in the advanced coordination stage at this time.
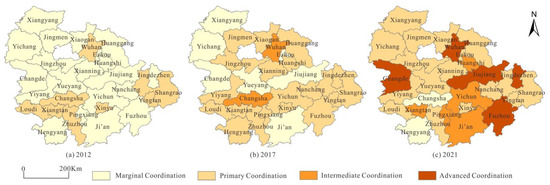
Figure 3.
Distribution and evolution of the coupling coordination degree values.
Further, Table 5 provides detailed information on the CCD values for each sample city. From an overall perspective, the coupling coordination level of the sample cities has been steadily improving from 2012 to 2021. Except for a slight decline in 2013 (0.257) compared to 2012 (0.265), there was a yearly growth trend throughout this period, which changed from preliminary coordination in 2012 (0.265) to primary coordination in 2021 (0.469). From a temporal perspective, the number of sample cities with high coordination levels has increased significantly. In 2012, all sample cities were in marginal and primary coordination stages. In 2017, Wuhan and Changsha became the first two sample cities to achieve intermediate coordination. In 2019, Wuhan became the first sample city to move to the advanced coordination stage. By 2021, only two sample cities remained in the marginal coordination stage, while the rest had all entered coordination phases. From a spatial perspective, the coupling coordination level varied among the sample cities over the sample period. Most sample cities, including Nanchang, Wuhan, and Changsha, have shown a progressive development trend with few exceptions. Some sample cities like Zhuzhou, Yichang, and Xiangyang maintained a stable level, barring a few years. In contrast, the sample cities like Yingtan and Changde showed fluctuating development levels. Significantly, Wuhan consistently exhibited a leading synergy level in comparison to other sample cities. While most sample cities were still in the marginal coordination stage from 2012–2016, Wuhan had already achieved primary coordination. Post-2017, Wuhan remained in the intermediate or advanced coordination stage and became the first city to reach an advanced coordination level in 2019.
Table 5.
The coupling coordination degree values from 2012 to 2021.
3.4. Dynamic Evolution Trend
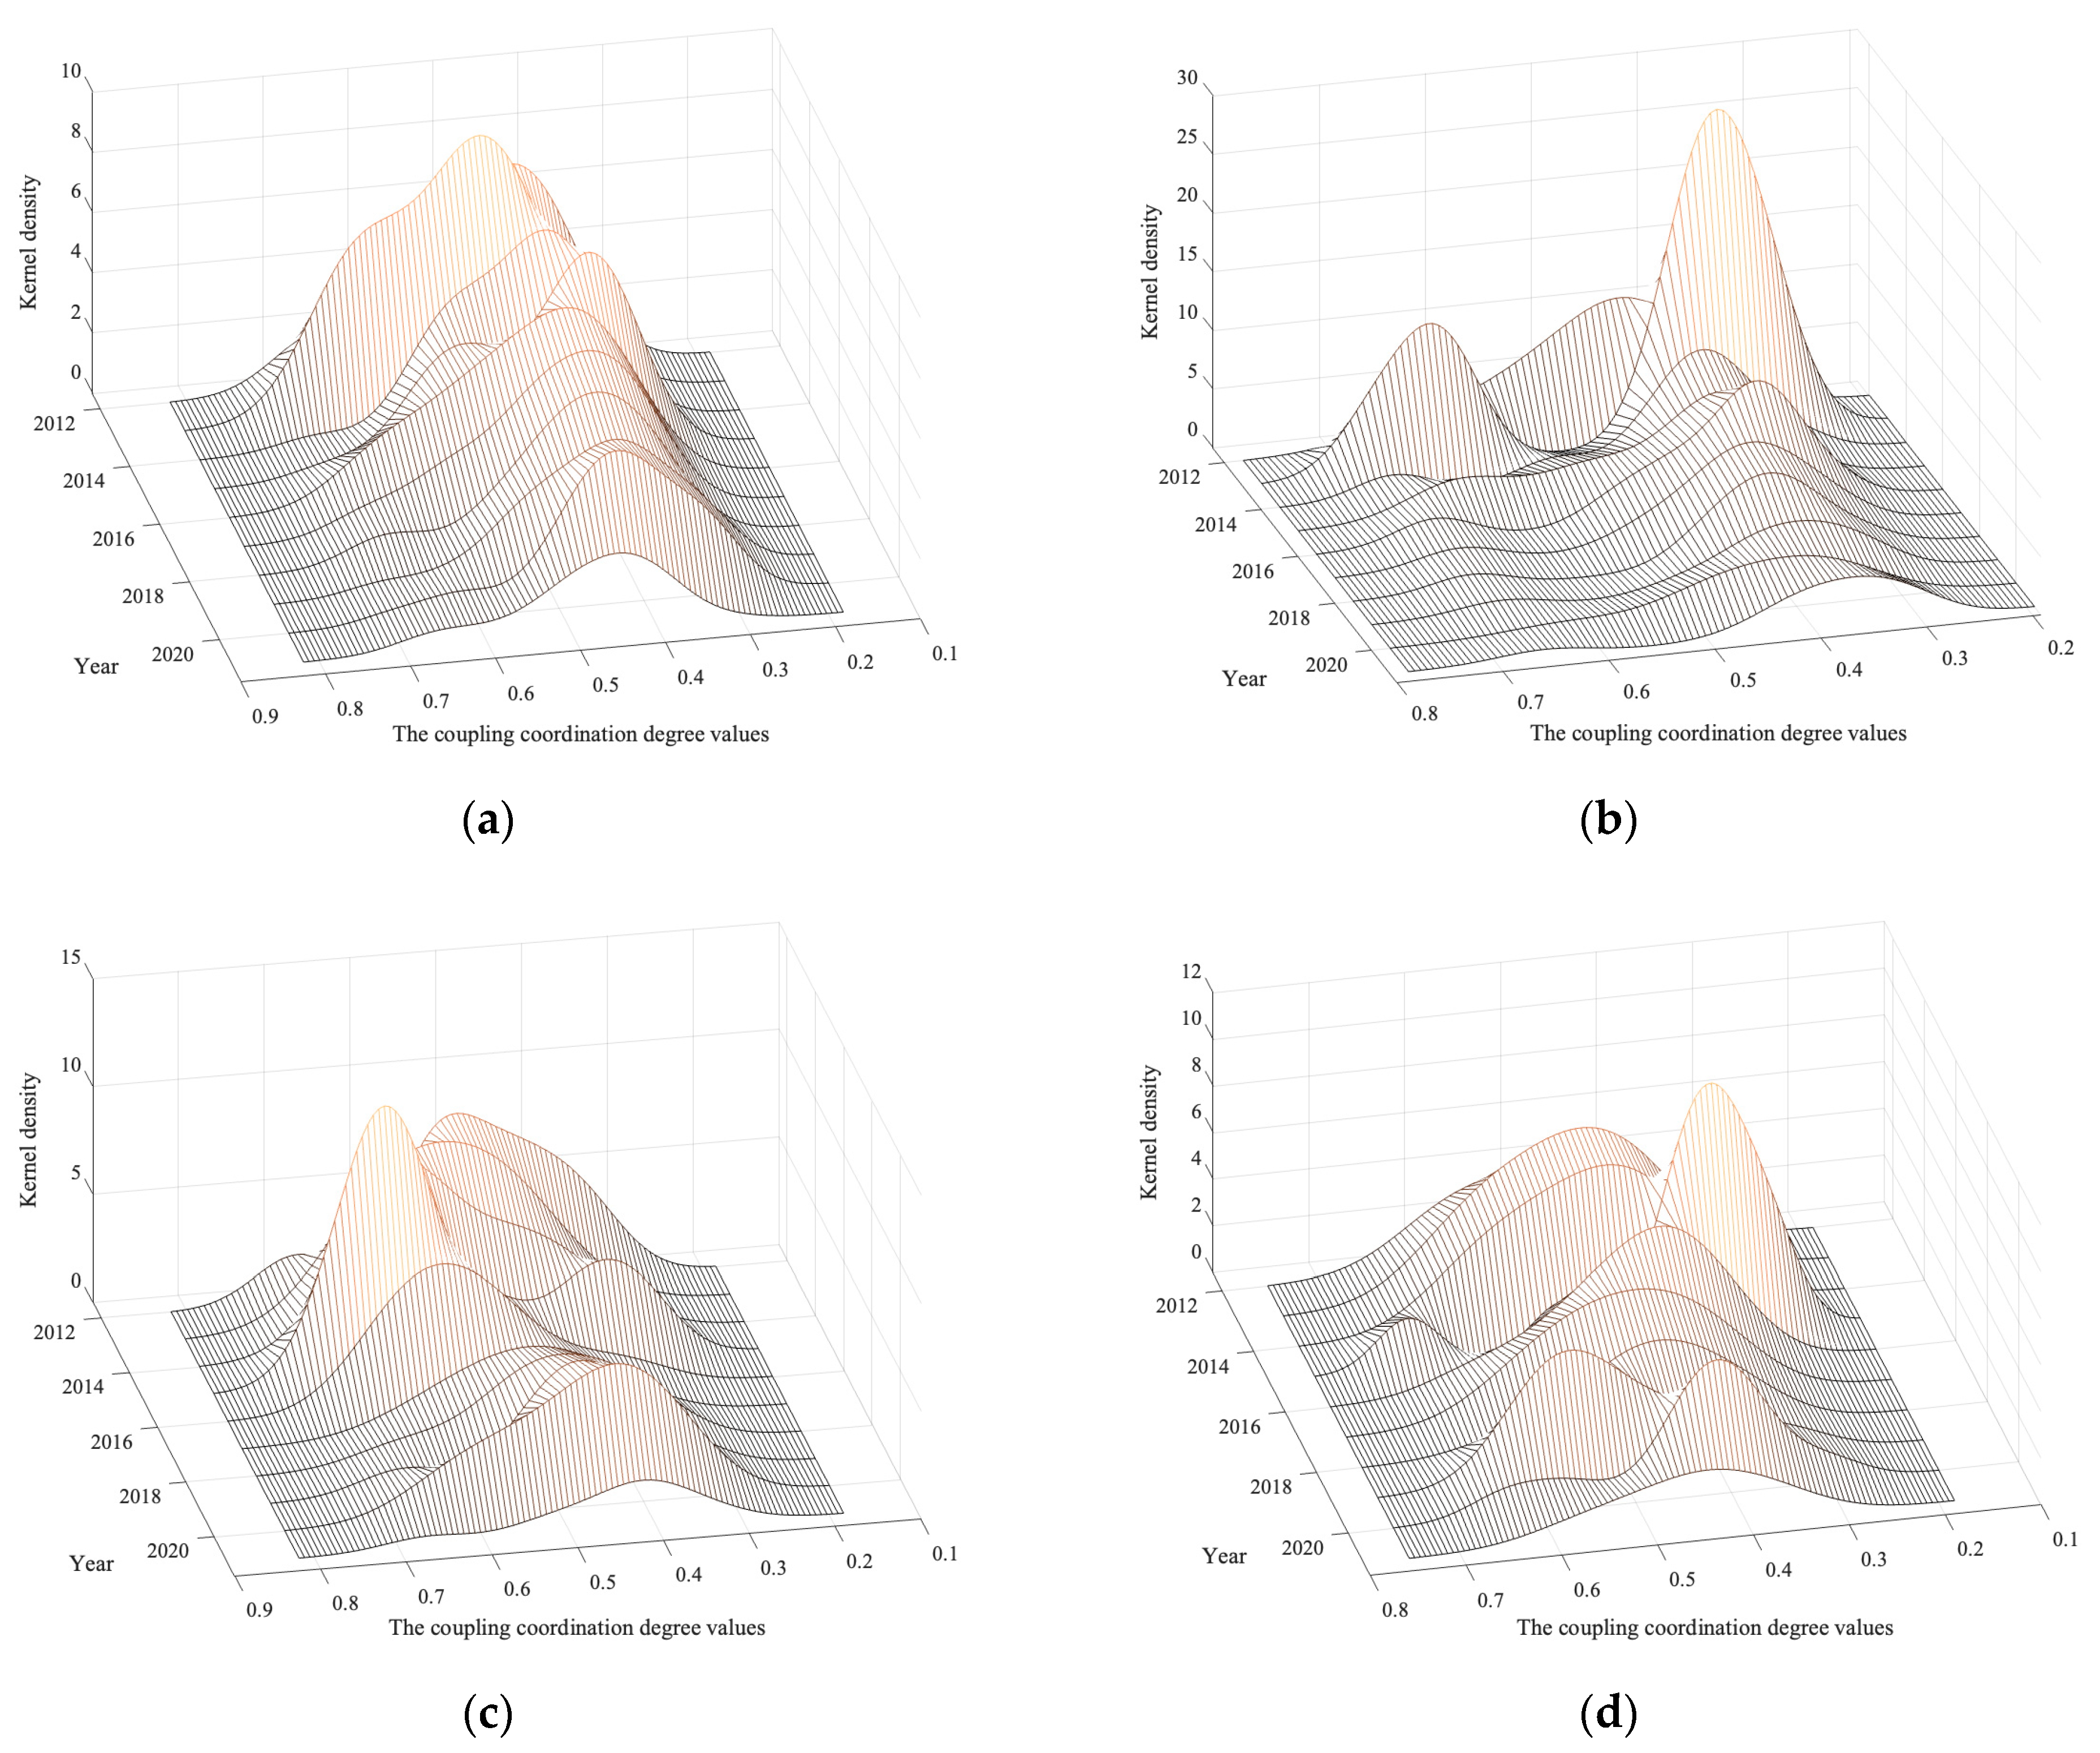
Figure 4 depicts the dynamic evolution trend of the CCD values for the 28 sample cities in the UAMRYR from 2012 to 2021. From an overall perspective, the CCD values have generally risen with some regional differentiation. During the sample period, the main peak shifted to the left, indicating that the overall coupling coordination level continuously progressed. At the same time, side peaks existed on the left side of the main peak, particularly in 2013, and the trailing phenomenon on both sides always existed, indicating an internal polarization phenomenon in the overall structure. The trend of the left trailing end gradually slowed down and became more apparent, while the right trailing end significantly weakened, indicating that the density of sample cities in the primary and intermediate coordination stage gradually increased. Refer to Figure 4a for details. From a diversity perspective, there were regional differences in the internal development. During the sample period, both the main peak and the side peak in the Hubei Province area always coexisted. However, as time went by, the height of the side peak gradually decreased, and the width between the main and side peaks narrowed. This suggests that even though the phenomenon of polarization persisted, its trend was mitigated over time, leading to a more concentrated overall coordination level. Refer to Figure 4b for details. Hunan Province area and Jiangxi Province area only showed side peaks in a few years, indicating that there were instances of development imbalances in some years. However, Hunan Province area and Jiangxi Province area had different main peak heights and positions, reflecting the disparities in the specific development status across different areas. Refer to Figure 4c,d for details.
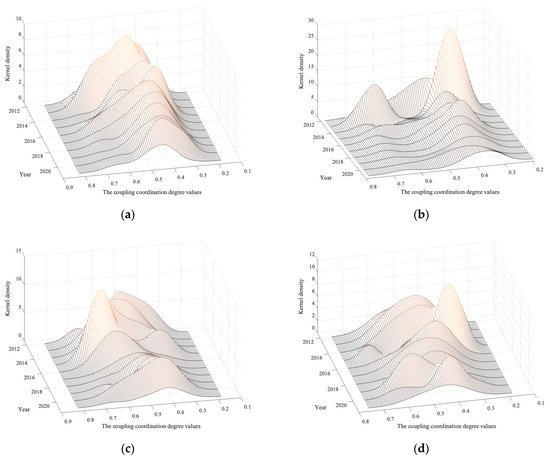
Figure 4.
Dynamic evolution of the coupling coordination degree values from 2012 to 2021. (a) Overall coupling coordination. (b) Hubei Province area coupling coordination. (c) Hunan Province area coupling coordination. (d) Jiangxi Province area coupling coordination.
3.5. Internal Transition Situation
Table 6 reflects the internal transition characteristics and dynamic transition information of the CCD stages of the 28 sample cities in the UAMRYR from 2012 to 2021 through the transition probability matrix, with a time span of 1 year. From the perspective of the stability of the CCD stages, the current CCD stages were likely to exhibit the characteristics of the last phase. The transition probability of the samples on the diagonal was much higher than that of the off-diagonal samples, indicating that various levels of the CCD were relatively stable, revealing a “club convergence” phenomenon. The sample cities that were originally at the marginal coordination stage, primary coordination stage, intermediate coordination stage, and advanced coordination stage had the probabilities of maintaining their current stages after 1 year at 73.39%, 82.71%, 37.5%, and 50%, respectively. Moreover, sample cities in the marginal coordination stage and primary coordination stage had a higher probability of maintaining their current levels than those in the intermediate coordination stage and advanced coordination stage. From the perspective of the CCD process, different CCD stages followed a gradual progression; transition phenomenon of the CCD stages almost only occurred between adjacent states. In the meantime, leapfrog transitions had an extremely low possibility, which were only observed from the primary coordination stage to the advanced coordination stage with the probability of 2.26%. From the perspective of the upward progress of the CCD stages, there was a significant difference in the probability of progression from different starting statuses. One year later, the probability of advancing from the intermediate coordination stage to the advanced coordination stage was the highest (37.5%). The next was progressing from the marginal coordination stage to the primary coordination stage (26.61%). The probability of moving from the primary coordination stage to the intermediate coordination stage was lower (6.77%), and the likelihood of direct leapfrog development from the primary coordination stage to the advanced coordination stage was the lowest (2.26%). From the perspective of the regressive progress of the CCD stages, the possibility of regression existed, which was directly proportional to the CCD level. One year later, the highest possibility (50%) was regressing from the advanced coordination stage to the intermediate coordination stage, followed by the possibility (25%) of moving from the intermediate coordination stage to the primary coordination stage. The probability of regressing from the primary coordination stage to the marginal coordination stage was the lowest (8.27%).
Table 6.
The transition probability matrix of the coupling coordination development stages.
3.6. Decomposition of Regional Differences
Table 7 describes the data of the overall, Intra-Group, and Inter-Group Gini coefficients and the Transvariation Intensity of the CCD values from 2012 to 2021. During the sample period, the overall Gini coefficient fluctuated, indicating the existence of differences in CCD statuses. Decomposing the overall Gini coefficient, it can be observed that the Inter-group Gini coefficient’s contribution rate to the overall Gini coefficient remained stable at around 30%. The contribution rate of the Transvariation Intensity to the overall Gini coefficient was the largest. However, it showed a decreasing trend, which counterbalanced the increasing contribution rate of Intra-Group Gini coefficient to the overall Gini coefficient. From the above trends, it can be inferred that in the initial phase of the sample period, areas with a higher CCD value also had cities with a lower CCD value, and vice versa. This phenomenon was quite prominent, indicating a certain degree of polarization. However, as time progressed, this polarization trend relatively weakened, with the gradually increasing differences between areas.
Table 7.
The overall Gini coefficient and its decomposition results.
4. Discussion
4.1. Overview of Findings
Accurately grasping the coupling and coordination relationship between DE development and IE can help accelerate the high-quality integrated development of the UAMRYR. Our study area is the 28 prefecture-level cities in UAMRYR, and firstly, we measured the level of DE development and IE in the region by using the entropy method and the SBM-DEA model, respectively. On the basis of this, we obtained the CCD values between the DE and IE of the sample cities in 2012–2021 by using the CCD Model, and further analyzed the spatial and temporal evolution situation by using kernel density estimation, the Markov chain algorithm, and the Dagum Gini coefficient decomposition method.
Our findings show that the DE in the UAMRYR showed a significant expansion trend during 2012–2021, especially in 2020 and 2021. The significant increase after 2020 was related to the COVID-19 pandemic. The enhancement of the DE in China’s central provinces during the COVID-19 pandemic was confirmed in a study by Xu et al. [68]. Provincial comparisons show that there was a balanced development among the three provinces. However, there was heterogeneity among cities. Wuhan, Changsha, and Nanchang, as provincial capitals, were significantly higher in the level of DE development than other non-provincial capitals, which is consistent with the findings of Ma and Li [69]. This discrepancy was attributed to a siphon effect, which is driven by the proximity of provincial capitals to other cities, where some of the DE growth might be the result of resources transferring from neighboring cities [70]. The development pattern of the DE in the UAMRYR is characterized by Wuhan as the core, supported by Changsha and Nanchang, ultimately leading numerous other cities to improve collectively [71].
In addition, the analysis results of our research also indicate that the development trend of the IE in the UAMRYR has shown fluctuations with localized improvements from 2012 to 2021. Since the Chinese government introduced the innovation-driven development strategy at the end of 2012, the IE has grown significantly. This trend corresponds with the fact that sample cities in the UAMRYR have been actively responding to the rise of the central area and emphasizing innovation during the 13th Five-Year Plan. Until 2020, IE declined due to the impact of the COVID-19 pandemic. Spatially, the UAMRYR exhibited a differential development pattern with ‘a core and multiple nodes’. Wuhan, as a core city, has a strong capacity for innovation, and leads the development of neighboring cities [21]. There were large gaps in IE between cities in the urban agglomerations, so polarization between provincial and non-provincial capitals emerged. This may be due to the fact that provincial capital cities have richer innovation resources and have accumulated a great deal of innovation experience, which continues to attract an inflow of talent and resources from neighboring cities, leading to a further increase in the innovation gap. In addition, the inequitable distribution of innovation resources by the government may also contribute to this phenomenon [72].
To summarize, there was a trend consistency between the DE and IE in the UAMRYR. From 2012 to 2021, the synergistic effect between IE and the DE has been strengthening over time. The promotion of the innovation-driven development strategy and the vigorous development of the DE have caused more and more regions to start to focus on the synergistic effect of the two elements. The continuous strengthening of concepts and introduction of policies for high-quality and overall coordinated development by the Chinese government has comprehensively led to an overall upward trend in CCD values. However, regional differences in the development of the CCD stages between cities were apparent. While the CCD values were increasing, regional differences were widening. This phenomenon may have been caused by various factors such as the level of urban economic development and urban openness when entering the digital and information era in 2012. Meanwhile, the growth of the CCD values was accompanied by the risk of development recession. Therefore, it is necessary to take into account regional differences in the development of cities, to learn from the advanced cities’ development experience, and to be vigilant against development recession.
4.2. Policy Implications
According to the above discussions, in order to achieve differentiated and integrated regional development, the following policy implications may be extracted.
First, follow objective development patterns and be vigilant to the phenomenon of development regression. The upward development of the CCD stages should follow objective development rules. It is essential to avoid a development pace that is too hasty and eager. While CCD stages continues to rise, it is crucial to always be alert to the accompanying regression in development. Based on consolidating the current development achievements, upward development should be achieved.
Second, combine regional development realities and implement differentiated development strategies. There are certain differences in DE development, IE, and the CCD development statuses during the development process. For cities with lower IE, efforts can be made by increasing personnel and financial inputs and encouraging and consolidating innovation output to enhance the input–output efficiency of innovative elements and increase the number of cities with effective efficiency. For regions with a lower level of DE development, measures such as promoting broadband network coverage in remote areas and accelerating the large-scale deployment and application of infrastructure in the information and communication field can be taken to inject vitality into the high-quality development of the DE. For the differentiation of the overall CCD development level, the differences caused by Transvariation Intensity will increase the complexity of policy design, which is necessary to treat cautiously. Adopting differential and targeted development strategies based on the actual conditions and the resource endowments of each region will be the path we must take to achieving high-quality coordinated development in the UAMRYR.
Finally, learn from Wuhan’s advanced experience and build a radiating development pattern. Wuhan’s performance in DE development, IE, and CCD development is far ahead of other cities in the research region. It is important to fully draw on Wuhan’s excellent development experience and technology. On the basis of breaking regional boundaries, we should speed up the formation of a new development pattern that radiates and permeates each other, enhance the development momentum of peripheral node cities, and achieve the integrated development of the DE and regional innovation in the UAMRYR.
4.3. Limitations and Future Research Directions
There are several limitations in our research. Firstly, the construction of the indicator systems is one of the limitations. With the in-depth study of the DE and IE, a wider range of dimensions can be used in the indicator system for further research. Secondly, the research methods adopted in this paper focus more on the description of the current situation, and lack in-depth research on the process mechanism. In the future, more driving factors can be further explored to explain the evolutionary mechanism of the coupling coordination phase. In addition, this paper selects the UAMRYR as research area, and lacks in-depth research on other countries and regions. Therefore, future research could extend the study area and categorize it according to regional heterogeneity to explore the differences in the coupling coordination stages between the DE and IE. Finally, this paper selects prefecture-level cities in the UAMRYR as the research samples, and in the future, subregions of prefecture-level cities can be selected for in-depth research. We believe these limitations can be addressed in future research.
5. Conclusions
Based on the panel data of 28 sample cities in the UAMRYR from 2012 to 2021, this paper uses the entropy method to assess the DE development levels of these cities and constructs the SBM-DEA model to calculate their IE. Then we adopt a dual-system CCD model and examine the dynamic evolution trend and the regional differences by utilizing the kernel density estimation, Markov chain algorithm, and the Dagum Gini coefficient decomposition method. The main research findings of this paper are as follows.
First, the UAMRYR is generally developing in a positive and upward direction. From 2012 to 2021, the development levels of DE have steadily increased and experienced rapid growth in 2020. IE shows strong growth from 2013 to 2019, with minor fluctuations in other years. The CCD stages have continuously improved, generally progressing from the marginal coordination phase to the primary coordination phase.
Second, positive development is gradual but comes with a probability of negative shift. The development process of the CCD follows the general development rule. The current development stage of most sample cities strongly depends on the foundation of the last year. The probability of upgrading varies depending on the foundation, but there is rarely a leapfrogging development process. As the CCD stage continuously progresses to a higher phase, the likelihood of regressive development increases accordingly.
Third, there are widespread regional differences. From 2012 to 2021, provincial capital cities have far surpassed non-provincial capital cities in terms of DE development levels. The number of sample cities achieving effective efficiency is significantly lower than those not achieving it. There are polarized differences in the process of CCD development, mainly resulting from Transvariation Intensity. Additionally, the impact of the Inter-Group Gini coefficient has been intensifying, and the differences within the areas of Hubei Province area, Hunan Province area, and Jiangxi Province area have contributed stably to the overall difference.
Finally, Wuhan stands out as the leading core of the development of the UAMRYR. Wuhan’s DE level, IE, and CCD development situation are all at the forefront of the research area, serving as the development center to guide regional coordinated growth.
In summary, the high-quality development of the UAMRYR is of great significance to China’s economic and social development. At the same time, the development of this region provides valuable experiences for the development of other regions in the world. In the future, further research such as the exploration of indicator dimensions, the exploration of mechanisms, the exploration of neighboring urban agglomerations, and the exploration of subregions of prefectural-level cities will contribute to the high-quality development of the UAMRYR.
Author Contributions
Conceptualization, M.J. and G.Z.; methodology, M.J.; software, M.J.; validation, M.J., S.Y. and G.Z.; formal analysis, M.J.; investigation, M.J.; data curation, M.J.; writing—original draft preparation, M.J.; writing—review and editing, M.J. and G.Z.; visualization, M.J.; supervision, S.Y. and G.Z.; project administration, S.Y.; funding acquisition, S.Y. All authors have read and agreed to the published version of the manuscript.
Funding
This research was funded by the National Social Science Fund of China (grant number 20FGLB038).
Data Availability Statement
The data presented in this study are available on request from the first and corresponding author.
Acknowledgments
The authors would like to acknowledge all of the reviewers and editors.
Conflicts of Interest
The authors declare no conflicts of interest.
References
- Tapscott, D. The digital Economy: Promise and Peril in the Age of Networked Intelligence; MCGRAW-HILL: New York, NY, USA, 1996; pp. 2–8. [Google Scholar]
- Xu, J.; Li, W. Study on the impact of digital economy on innovation output based on dynamic panel data model. Eur. J. Innov. Manag. 2023. [Google Scholar] [CrossRef]
- Wang, P.; Cen, C. Does digital economy development promote innovation efficiency? A spatial econometric approach for Chinese regions. Technol. Anal. Strateg. Manag. 2022. [Google Scholar] [CrossRef]
- Nagy, S.; Somosi, M.V. The relationship between social innovation and digital economy and society. Reg. Stat. 2022, 12, 3–29. [Google Scholar] [CrossRef]
- Luo, S.; Yimamu, N.; Li, Y.; Wu, H.; Irfan, M.; Hao, Y. Digitalization and sustainable development: How could digital economy development improve green innovation in China? Bus. Strategy Environ. 2023, 32, 1847–1871. [Google Scholar] [CrossRef]
- Liu, J.; Chen, Y.; Liang, F.H. The effects of digital economy on breakthrough innovations: Evidence from Chinese listed companies. Technol. Forecast. Soc. Chang. 2023, 196, 122866. [Google Scholar] [CrossRef]
- Li, Q.; Chen, H.; Chen, Y.; Xiao, T.; Wang, L. Digital economy, financing constraints, and corporate innovation. Pac.-Basin Financ. J. 2023, 80, 102081. [Google Scholar] [CrossRef]
- Wu, Q.; Qalati, S.A.; Hussain, R.Y.; Irshad, H.; Tajeddini, K.; Siddique, F.; Gamage, T.C. The effects of enterprises’ attention to digital economy on innovation and cost control: Evidence from A-stock market of China. J. Innov. Knowl. 2023, 8, 100415. [Google Scholar] [CrossRef]
- Wang, Q.; Wei, Y. Research on the influence of digital economy on technological innovation: Evidence from manufacturing enterprises in China. Sustainability 2023, 15, 4995. [Google Scholar] [CrossRef]
- Chen, S.; Li, Q.; Lei, B.; Wang, N. Configurational analysis of the driving paths of Chinese digital economy based on the technology-organization-environment framework. Sage Open 2021, 11, 21582440211054500. [Google Scholar] [CrossRef]
- Yang, J.; Zhou, L.; Qu, Y.; Jin, X.; Fang, S. Mechanism of innovation and standardization driving company competitiveness in the digital economy. J. Bus. Econ. Manag. 2023, 24, 54–73. [Google Scholar] [CrossRef]
- Shang, X.; Niu, H. Analysis of the spatiotemporal evolution and driving factors of China’s digital economy development based on Esda and Gm-gwr model. Sustainability 2023, 15, 11970. [Google Scholar] [CrossRef]
- Luo, R.; Zhou, N. Dynamic evolution, spatial differences, and driving factors of China’s provincial digital economy. Sustainability 2022, 14, 9376. [Google Scholar] [CrossRef]
- Li, Z.; Li, Z. Research on the spatial distribution pattern and influencing factors of digital economy development in China. IEEE Access 2021, 9, 63094–63106. [Google Scholar] [CrossRef]
- Raimbault, J. Unveiling co-evolutionary patterns in systems of cities: A systematic exploration of the SimpopNet model. Theor. Models Urban. 2020, 261–278. [Google Scholar] [CrossRef]
- Simandan, D. Competition, delays, and coevolution in markets and politics. Geoforum 2019, 98, 15–24. [Google Scholar] [CrossRef]
- Zhang, M.; Chen, X.; Yang, G. Coupling coordination degree and influencing factors of green science and technology innovation efficiency and digital economy level: Evidence from provincial panel data in China. Front. Environ. Sci. 2023, 11, 1104078. [Google Scholar] [CrossRef]
- Li, S.; Feng, H. Spatio-temporal differences and their causes of dynamic coupling between technological innovation and high-quality development of digital economy: Based on four major strategic regions in China. Contemp. Econ. Manag. 2023, 45, 41–50. (In Chinese) [Google Scholar] [CrossRef]
- Zhang, Y.; Hong, X.; Wang, Y. Study on the coupled and coordinated development and evolution of digital economy and green technology innovation. Sustainability 2023, 15, 8063. [Google Scholar] [CrossRef]
- Wang, T.; Li, H. Have regional coordinated development policies promoted urban carbon emission efficiency?-The evidence from the Urban Agglomerations in the Middle Reaches of the Yangtze River. Environ. Sci. Pollut. Res. 2023, 30, 39618–39636. [Google Scholar] [CrossRef] [PubMed]
- Liu, L.; Luo, J.; Xiao, X.; Hu, B.; Qi, S.; Lin, H.; Zu, X. Spatio-temporal evolution of urban innovation networks: A case study of the Urban Agglomeration in the Middle Reaches of the Yangtze River, China. Land 2022, 11, 597. [Google Scholar] [CrossRef]
- Guo, F.; Wang, J.; Wang, F.; Kong, T.; Zhang, X.; Cheng, Z. Measuring China’s digital financial inclusion: Index compilation and spatial characteritics. China Econ. Q. 2020, 19, 1401–1418. (In Chinese) [Google Scholar] [CrossRef]
- Zhao, T.; Zhang, Z.; Liang, S. Digital economy, entrepreneurship, and high-quality economic development: Empirical evidence from urban China. J. Manag. World 2020, 36, 65–76. (In Chinese) [Google Scholar] [CrossRef]
- Shi, Y.; Zhang, T.; Jiang, Y. Digital economy, technological innovation and urban resilience. Sustainability 2023, 15, 9250. [Google Scholar] [CrossRef]
- Chen, K.; Guan, J. Measuring the efficiency of China’s regional innovation systems: Application of network data envelopment analysis (DEA). Reg. Stud. 2012, 46, 355–377. [Google Scholar] [CrossRef]
- Ke, H.; Dai, S.; Yu, H. Spatial effect of innovation efficiency on ecological footprint: City-level empirical evidence from China. Environ. Technol. Innov. 2021, 22, 101536. [Google Scholar] [CrossRef]
- Fan, F.; Du, D.; Wang, X. The measure and characteristics of spatial-temporal evolution of China’s science and technology resource allocation efficiency. J. Geogr. Sci. 2014, 24, 492–508. [Google Scholar] [CrossRef]
- Kou, M.; Chen, K.; Wang, S.; Shao, Y. Measuring efficiencies of multi-period and multi-division systems associated with DEA: An application to OECD countries’ national innovation systems. Expert Syst. Appl. 2016, 46, 494–510. [Google Scholar] [CrossRef]
- Fan, F.; Lian, H.; Wang, S. Can regional collaborative innovation improve innovation efficiency? An empirical study of Chinese cities. Growth Change 2020, 51, 440–463. [Google Scholar] [CrossRef]
- Acs, Z.; Anselin, L.; Varga, A. Patents and innovation counts as measures of regional production of new knowledge. Research Policy 2002, 31, 1069–1085. [Google Scholar] [CrossRef]
- Kontolaimou, A.; Giotopoulos, I.; Tsakanikas, A. A typology of European countries based on innovation efficiency and technology gaps: The role of early-stage entrepreneurship. Econ. Model. 2016, 52, 477–484. [Google Scholar] [CrossRef]
- Lin, B.; Luan, R. Do government subsidies promote efficiency in technological innovation of China’s photovoltaic enterprises? J. Clean. Prod. 2020, 254, 120108. [Google Scholar] [CrossRef]
- Wang, Y.; Pan, J.; Pei, R.; Yi, B.; Yang, G. Assessing the technological innovation efficiency of China’s high-tech industries with a two-stage network DEA approach. Socio-Econ. Plan. Sci. 2020, 71, 100810. [Google Scholar] [CrossRef]
- Zhang, L. The knowledge spillover effects of FDI on the productivity and efficiency of research activities in China. China Econ. Rev. 2017, 42, 1–14. [Google Scholar] [CrossRef]
- Chen, Y.; Xu, S.; Lyulyov, O.; Pimonenko, T. China’s digital economy development: Incentives and challenges. Technol. Econ. Dev. Econ. 2023, 29, 518–538. [Google Scholar] [CrossRef]
- Zha, Q.; Huang, C.; Kumari, S. The impact of digital economy development on carbon emissions—Based on the Yangtze River Delta Urban Agglomeration. Front. Environ. Sci. 2022, 10, 1028750. [Google Scholar] [CrossRef]
- Sun, X.; Jiang, K.; Cui, Z.; Xu, J.; Zhao, X. Exploring the impact of the digital economy on green total factor productivity in China: A spatial econometric perspective. Front. Environ. Sci. 2023, 10, 1097944. [Google Scholar] [CrossRef]
- Wang, L.; Sun, Y.; Xv, D. Study on the spatial characteristics of the digital economy on urban carbon emissions. Environ. Sci. Pollut. Res. 2023, 30, 80261–80278. [Google Scholar] [CrossRef]
- Yang, S.; Wang, C.; Zhang, H.; Lu, T.; Yi, Y. Environmental regulation, firms’ bargaining power, and firms’ total factor productivity: Evidence from China. Environ. Sci. Pollut. Res. 2022, 29, 9341–9353. [Google Scholar] [CrossRef]
- Luo, W.; Tang, G.; Yang, P.; Jia, C.; Yang, R. Examining digital economy’s role in urban green development: A study of the Yangtze River Delta Region. J. Knowl. Econ. 2023. [Google Scholar] [CrossRef]
- Zhu, Z.; Liu, B.; Yu, Z.; Cao, J. Effects of the digital economy on carbon emissions: Evidence from China. Int. J. Environ. Res. Public Health 2022, 19, 9450. [Google Scholar] [CrossRef]
- Guan, H.; Guo, B.; Zhang, J. Study on the impact of the digital economy on the upgrading of industrial structures-empirical analysis based on cities in China. Sustainability 2022, 14, 11378. [Google Scholar] [CrossRef]
- Liu, C.; Gao, X.; Ma, W.; Chen, X. Research on regional differences and influencing factors of green technology innovation efficiency of China’s high-tech industry. J. Comput. Appl. Math. 2020, 369, 112597. [Google Scholar] [CrossRef]
- Yuan, X.; Wei, F.; Li, H.; An, Y. Analysis of the coupling coordination and spatiotemporal evolution of high-tech industrial technological innovation and regional economic development. Complexity 2022, 2022, 3076336. [Google Scholar] [CrossRef]
- Han, X.; Fu, L.; Lv, C.; Peng, J. Measurement and spatio-temporal heterogeneity analysis of the coupling coordinated development among the digital economy, technological innovation and ecological environment. Ecol. Indic. 2023, 151, 110325. [Google Scholar] [CrossRef]
- Toloo, M.; Keshavarz, E.; Hatami-Marbini, A. Selecting data envelopment analysis models: A data-driven application to EU countries. Omega-Int. J. Manag. Sci. 2021, 101, 102248. [Google Scholar] [CrossRef]
- Dyckhoff, H.; Allen, K. Measuring ecological efficiency with data envelopment analysis (DEA). Eur. J. Oper. Res. 2001, 132, 312–325. [Google Scholar] [CrossRef]
- Tian, N.; Tang, S.; Che, A.; Wu, P. Measuring regional transport sustainability using super-efficiency SBM-DEA with weighting preference. J. Clean. Prod. 2020, 242, 118474. [Google Scholar] [CrossRef]
- Fang, Z.; Razzaq, A.; Mohsin, M.; Irfan, M. Spatial spillovers and threshold effects of internet development and entrepreneurship on green innovation efficiency in China. Technol. Soc. 2022, 68, 101844. [Google Scholar] [CrossRef]
- Nitkiewicz, T.; Pachura, P.; Reid, N. An appraisal of regional intellectual capital performance using Data Envelopment Analysis. Appl. Geogr. 2014, 53, 246–257. [Google Scholar] [CrossRef]
- Wei, J.; Lei, Y.; Yao, H.; Ge, J.; Wu, S.; Liu, L. Estimation and influencing factors of agricultural water efficiency in the Yellow River Basin, China. J. Clean. Prod. 2021, 308, 127249. [Google Scholar] [CrossRef]
- Tone, K. A slacks-based measure of super-efficiency in data envelopment analysis. Eur. J. Oper. Res. 2002, 143, 32–41. [Google Scholar] [CrossRef]
- Tang, K.; Qiu, Y.; Zhou, D. Does command-and-control regulation promote green innovation performance? Evidence from China’s industrial enterprises. Sci. Total Environ. 2020, 712, 136362. [Google Scholar] [CrossRef] [PubMed]
- Zhong, K.; Wang, Y.; Pei, J.; Tang, S.; Han, Z. Super efficiency SBM-DEA and neural network for performance evaluation. Inf. Process. Manag. 2021, 58, 102728. [Google Scholar] [CrossRef]
- Zhou, Y.; Liu, W.; Lv, X.; Chen, X.; Shen, M. Investigating interior driving factors and cross-industrial linkages of carbon emission efficiency in China’s construction industry: Based on Super-SBM DEA and GVAR model. J. Clean. Prod. 2019, 241, 118322. [Google Scholar] [CrossRef]
- Xing, L.; Xue, M.; Hu, M. Dynamic simulation and assessment of the coupling coordination degree of the economy-resource-environment system: Case of Wuhan City in China. J. Environ. Manag. 2019, 230, 474–487. [Google Scholar] [CrossRef]
- He, J.; Wang, S.; Liu, Y.; Ma, H.; Liu, Q. Examining the relationship between urbanization and the eco-environment using a coupling analysis: Case study of Shanghai, China. Ecol. Indic. 2017, 77, 185–193. [Google Scholar] [CrossRef]
- Li, Y.; Li, Y.; Zhou, Y.; Shi, Y.; Zhu, X. Investigation of a coupling model of coordination between urbanization and the environment. J. Environ. Manag. 2012, 98, 127–133. [Google Scholar] [CrossRef]
- Li, J.; Sun, W.; Li, M.; Meng, L. Coupling coordination degree of production, living and ecological spaces and its influencing factors in the Yellow River Basin. J. Clean. Prod. 2021, 298, 126803. [Google Scholar] [CrossRef]
- Yuan, K.; Hu, B.; Li, X.; Niu, T.; Zhang, L. Exploration of coupling effects in the digital economy and eco-economic system resilience in urban areas: Case study of the Beijing-Tianjin-Hebei Urban Agglomeration. Sustainability 2023, 15, 7258. [Google Scholar] [CrossRef]
- Shi, C.; Zeng, X.; Yu, Q.; Shen, J.; Li, A. Dynamic evaluation and spatiotemporal evolution of China’s industrial water use efficiency considering undesirable output. Environ. Sci. Pollut. Res. 2021, 28, 20839–20853. [Google Scholar] [CrossRef]
- Kuang, B.; Lu, X.; Zhou, M.; Chen, D. Provincial cultivated land use efficiency in China: Empirical analysis based on the SBM-DEA model with carbon emissions considered. Technol. Forecast. Soc. Chang. 2020, 151, 119874. [Google Scholar] [CrossRef]
- Lv, C.; Bian, B.; Lee, C.; He, Z. Regional gap and the trend of green finance development in China. Energy Econ. 2021, 102, 105476. [Google Scholar] [CrossRef]
- Wen, H.; Liang, W.; Lee, C. China’s progress toward sustainable development in pursuit of carbon neutrality: Regional differences and dynamic evolution. Environ. Impact Assess. Rev. 2023, 98, 106959. [Google Scholar] [CrossRef]
- Zhang, L.; Ma, X.; Ock, Y.; Qing, L. Research on regional differences and influencing factors of Chinese industrial green technology innovation efficiency based on Dagum Gini Coefficient decomposition. Land 2022, 11, 122. [Google Scholar] [CrossRef]
- Lu, X.; Kuang, B.; Li, J. Regional difference decomposition and policy implications of China’s urban land use efficiency under the environmental restriction. Habitat Int. 2018, 77, 32–39. [Google Scholar] [CrossRef]
- Dagum, C. A new approach to the decomposition of the Gini income inequality ratio. Empir. Econ. 1997, 22, 515–531. [Google Scholar] [CrossRef]
- Xu, A.; Qian, F.; Pai, C.; Yu, N.; Zhou, P. The impact of COVID-19 epidemic on the development of the digital economy of China- Based on the data of 31 provinces in China. Front. Public Health 2022, 9, 778671. [Google Scholar] [CrossRef]
- Ma, J.; Li, Z. Measuring China’s urban digital economy. Natl. Account. Rev. 2023, 4, 329–361. [Google Scholar] [CrossRef]
- Wang, B.; Yang, Z. Research on the Mechanism of the Impact of the Structure of the Digital Economy on the Resilience of the Regional Economy. Gansu Soc. Sci. 2024, 1–14. Available online: https://kns.cnki.net/kcms2/article/abstract?v=Fhes7GDiHN1i2DGjs0XZEF27-_h_X9JxSuCGupj6no7lSoZd79AhSVc7sJY2zTCDEYv_NV_lD1ME0e9kEdDvxLjjjOEJ5OFL8PR_NzlEEFGNI58BcDhyXCHS9ENhYyMehiyR9-6IrbQ=&uniplatform=NZKPT&language=CHS (accessed on 23 February 2024). (In Chinese).
- Qian, S.; Fanghua, T.; Yong, T. An economic tie network-structure analysis of Urban Agglomeration in the Middle Reaches of Changjiang River based on SNA. J. Geogr. Sci. 2015, 25, 739–755. [Google Scholar] [CrossRef]
- Wang, X.; Wan, T.; Yang, Q.; Zhang, M.; Sun, Y. Research on innovation non-equilibrium of Chinese urban agglomeration based on SOM Neural Network. Sustainability 2021, 13, 9506. [Google Scholar] [CrossRef]
Disclaimer/Publisher’s Note: The statements, opinions and data contained in all publications are solely those of the individual author(s) and contributor(s) and not of MDPI and/or the editor(s). MDPI and/or the editor(s) disclaim responsibility for any injury to people or property resulting from any ideas, methods, instructions or products referred to in the content. |
© 2024 by the authors. Licensee MDPI, Basel, Switzerland. This article is an open access article distributed under the terms and conditions of the Creative Commons Attribution (CC BY) license (https://creativecommons.org/licenses/by/4.0/).