Article

Identifying and Mapping the Spatial Factors That Control Soil Erosion Changes in the Yellow River Basin of China

College of Natural Resources and Environment, Northwest A&F University, Xianyang 712100, China
*
Author to whom correspondence should be addressed.
Land 2024, 13(3), 344; https://doi.org/10.3390/land13030344
Submission received: 30 December 2023 / Revised: 25 February 2024 / Accepted: 1 March 2024 / Published: 8 March 2024

Abstract

:
The Yellow River Basin has been considered to have the most serious soil erosion in the world, and identifying and mapping the spatial controlling factors would be of great help in adopting targeting strategies for soil erosion prevention. This study used the Universal Soil Loss Equation (USLE) to estimate the spatial and temporal changes in soil erosion from 1985 to 2020 and analyzed the controlling factors. The results indicated that from 1985 to 2020, the average erosion modulus in the Yellow River Basin was 1160.97 t∙km−2∙yr−1, and the erosion modulus in the middle reach was significantly greater than in the lower and upper reaches. Changes in vegetation coverage, rainfall and land use controlled 38.95%, 40.87% and 9.21% of soil erosion changes, respectively. Among them, the area in which soil erosion was decreased due to increased vegetation coverage accounted for 70.77% of the area controlled by vegetation coverage, while the area in which soil erosion was increased due to increased rainfall accounted for 86.62% of the area controlled by rainfall. These results prove the effectiveness of vegetation restoration projects in controlling soil erosion in the Yellow River Basin, but more attention needs to be paid to the impact of rainfall on soil erosion in the future.

1. Introduction

Soil erosion poses a serious threat to the world’s land ecology system and has received widespread attention in recent years [1,2] because it not only decreases land productivity [3,4,5], but also destroys the environment for productive vegetation growth [6,7]. It has been reported that soil erosion has resulted in 85% of global land degradation, and resulted in a 17% decrease in food production [8]. Soil erosion is controlled by human activities and several natural factors [9]. Natural factors such as soil, landforms, climate, and vegetation are considered to be the basis of soil erosion occurrence; in particular, climate change significantly affects soil erosion. With the rapid enlargement of human living spaces and advances in the world economy and industry, increasingly intensive human activities have produced changes in soil erosion (weakening or intensifying). Therefore, identifying and mapping the spatial factors controlling soil erosion is helpful for targeting and adopting strategies for soil and water prevention.
The Yellow River Basin is the source region of Chinese agriculture, but the serious soil erosion in this region has been and remains a prominent environmental topic in China [10]. The severe destruction of the ecosystem and threats to food production and human security in relation to soil erosion in this area have aroused great concerns in recent decades. Yao et al. reported that the average sediment transport volume was 1.6 × 10⁹ t per year from 1919 to 1960 [11], and Guo et al. estimated that the highest sediment transport volume was 3.91 × 10⁹ t per year in 1933 [12]. In particular, the Loess Plateau is considered the worst soil erosion region in the earth because of its fragile ecosystem, erodible soil, concentrated rainstorms, dense gullies, and intensive agricultural activities [13]. Serious harm to land production and people’s survival has been caused by the severe soil erosion in this region. For example, soil erosion induced by floods in July 1958 [14], August 1982 and August–October 2003 [15] destroyed 2026.67, 1449.6, and 918.67 km2 of farmland. Therefore, quantitatively monitoring variations in soil erosion could lead a reduction in damage to food production.
The Chinese government has carried out a large number of measures because of the serious environmental degradation and threats to human life that have resulted from soil erosion since the founding of China. To prevent wind erosion and increase vegetation coverage at the spatial scale, the Three-North Shelterbelt Forest program was proposed at the beginning of the 1950s, and it has been executed since 1978 until the present [16]. Additionally, the “Grain for Green” project was implemented for vegetation coverage improvement to control soil erosion in the middle reach in 1999 [17]. The significant effects of those artificial vegetation measures have been achieved by consensus agreement. The vegetation coverage increased from about 30% in 1999 to nearly 60% in 2013 in the Loess Plateau [18], and forest coverage increased from 12.9% to 34.98% from 1977 to 2018 in the Three-North Shelterbelt region. Zhang reported that the vegetation coverage area of Shaanxi Province advanced 400 km to the north [19], and Chen et al. verified that the Earth has increased its green space by five percent, 25% of which was the result of increases that came from China [20].
In recent decades, climate change in this region has been a prominent research topic. The climate has become warmer and drier since the 1950s [21]. Zhao et al. estimated that the annual average temperature has increased by 0.03 °C every year, and the annual rainfall has decreased by 1.27 mm every year in the Loess Plateau [22]. These climate changes can explain part of the increase in soil erosion before 2000 in the study area, and this warming and drying trend has been proven to accelerate soil erosion [22]. Corresponding to the climate change trend, the increased soil erosion potential has been predicted by several researchers. Zhang and Liu estimated that soil erosion would increase by 2–81% in Changwu County under an increasing temperature scenario [23]. Li et al. reported that the runoff could increase significantly in May and August for October 2010–2039 under current farming conditions, and that annual soil erosion could increase by 37% to 170% [24]. In recent years, climate changes have shown to be more complex, and even as temperatures continued to increase, precipitation has shown an increasing trend in this region [25], increasing the uncertainty regarding the effects of climate changes on soil erosion.
Estimating the amount of soil loss can help one effectively monitor changes in soil erosion, and evaluate the benefits of prevention projects. Various models have been applied to soil loss estimation, such as the Universal Soil Loss Equation (USLE), the Water Erosion Prediction Project (WEPP), the Revised Universal Soil Loss Equation (RUSLE), and the Soil and Water Assessment Tool (SWAT) [26,27,28,29]. The USLE has been accepted worldwide due to its simple structure and ease of use [30,31,32]. The USLE has been extensively used in the upper and middle of the Yellow River [30], and in the Loess Plateau [33,34]. Researchers have also concluded that the increases in vegetation coverage in this region over time have dominated the decrease in soil erosion [35,36,37].
To date, the ecological protection of this region is closely related to the Chinese government ‘s national strategy. The great achievement of implementing ecological measures, as well as tremendous attempts to estimate soil loss using the USLE in local areas of the Yellow River Basin, have made it possible to monitor soil erosion changes over the past decades and to identify the spatial controlling factors. In the current research, we propose three questions: (1) How has soil erosion changed in recent decades? (2) Which factors control soil erosion changes? and (3) Where are the controlling factors spatially located within the YBR region? To answer these questions, we used the USLE to estimate the soil erosion modulus in the years 1985, 1990, 1995, 2000, 2005, 2010, 2015 and 2020 based on high-resolution spatial data. The changing trend of soil erosion was analyzed by the Mann–Kendall and Sen’s tests. Finally, a spatial analysis of the main factors controlling soil erosion was carried out using multiple regression analysis. The main purpose of this study was to estimate the trends in soil erosion change in the Yellow River Basin from 1985 to 2020 and identify the spatial distribution of its controlling factors. The advantage of this study is that it provides soil erosion data with a high spatial resolution (100 m), which greatly improves the data accuracy. In addition, this study also provides spatial distribution information on soil erosion control factors at the pixel scale, which can provide data support and a theoretical basis for accurately formulating soil and water conservation policy measures.

2. Materials and Methods

2.1. Study Area

The Yellow River is the second-largest river of China and flows through nine provinces (Figure 1). The Yellow River Basin covers a total area of 79.5 × 10⁴ km2, with a latitude ranging from 32°10′ to 41°50′ N and a longitude ranging from 95°53′ to 119°05′ E. The Yellow River Basin crosses the warm temperate, middle temperate, and plateau climate zones from the southeast to the northwest. The average annual precipitation is 458 mm, ranging from 200 to 650 mm in recent decades [38]. The annual average temperature ranges from −4 °C to 14 °C (http://www.yrcc.gov.cn/hhyl/hhgk/ (accessed on 20 September 2022)). The Yellow River Basin spans four landforms encompassing the Huanghuaihai Plain, the Loess Plateau, the Inner Mongolia Plateau, and the Qinghai–Tibet Plateau from east to west [39]. According to the hydrological and geographical characteristics of the study area, the entire basin is roughly composed of the upper, middle, and lower reaches (divided by the Toudaoguai and Huayuankou hydrological stations) with areas of 37.35 × 10⁴ km2, 35.61 × 10⁴ km2 and 2.34 × 10⁴ km2, respectively [38].

2.2. Data Collection and Pre-Processing

Meteorological data, land use, digital elevation model (DEM), soil erodibility, and vegetation coverage data were collected for use with the USLE. Daily precipitation data from 1983 to 2022 from 122 national meteorological stations within the Yellow River Basin were collected to calculate the rainfall erosivity factor (R) (http://data.cma.cn/ (accessed on 12 September 2023)). In order to reduce the impact of extreme rainfall on the calculation results, we used the average rainfall of five years to calculate the rainfall erosivity of the corresponding period (Table 1). Land use data with a spatial resolution of 30 m were collected to calculate the cover management factor (C) and the soil conservation practice factor (P) (https://www.resdc.cn (accessed on 16 September 2023)). DEM data with a spatial resolution of 30 m were collected to calculate the slope length and slope factor (LS) (https://www.gscloud.cn (accessed on 16 September 2023)). Soil erodibility factor (K) data with a spatial resolution of 30 m were collected from the address of (http://www.geodata.cn (accessed on 16 September 2023)). Landsat-FVC data with a spatial resolution of 100 m for eight periods from 1985 to 2020 were collected on the Google Earth Engine platform to calculate the cover management (C). Affected by the Landsat image quality (such as excessive cloud cover and the failure of the US Landsat-7), the FVC for each period was calculated using the average of multiple Landsat data for five years (Table 1). All of the datasets were resampled to 100 m.

2.3. Methods

2.3.1. USLE

The USLE (Formula (1)) was proposed by Wischmeier and Smith (1965) for analyzing observational data from more than 10,000 runoff communities in three states in the eastern United States over 30 years [29]:
A = R × K × LS × C × P
where A is the average soil erosion modulus (t∙hm−2∙yr−1); the other factors introduced in ‘Section 2.2’.
The rainfall erosivity of the region was calculated using Formulas (2) and (3), proposed for the investigation and evaluation of soil erosion [40]:
R ¯ k = 1 N i = 1 N j = 0 m α × P i , j , k 1.7265
R ¯ = k = 1 24 R ¯ k
where R ¯ k is the rainfall erosivity (MJ∙mm∙hm−2∙h−1∙yr−1) in half a month k; k = 1, 2, …, 24 means that a year is divided into 24 half months; α is a parameter equal to 0.3101 in the cold season (October–December, January–April) and equal to 0.3937 in the warm season (May–September); R ¯ is the annual average rainfall erodibility (MJ∙mm∙hm−2∙h−1∙yr−1); j = 0, …, m , and m are the number of erosive rainy days in the k-th half month of the i-th year (daily rainfall is required to be greater than or equal to 12 mm); i = 1, 2, …, N, and N are the year series from 1981 to 2018; and Pi,j,k is the erosive daily rainfall (mm) on the j-th day of the k-th half-month of the i-th year. The download link of K was shared in ‘Section 2.2’.
Since the terrain of the Yellow River Basin is complex and there are many steep slopes, we calculated the LS factor based on the steep-slope formulas proposed by Wischmeier (1978) [41] and Liu et al. (1994) (Formulas (4) and (5)) [42]. We calculated the LS factor of the Yellow River Basin using the LS factor calculation tool developed by Professor Yang’s team at Northwestern University [43].
S = 10.8 sin θ + 0.03                                                         θ < 5 ° 16.8 sin θ 0.50                                   5 ° θ < 10 ° 21.91 sin θ 0.96                                                   θ 10 °
L = λ / 22.1 m m = 0.2                                                                           θ < 1 ° m = 0.3                                                         1 ° θ < 3 ° m = 0.4                                                         3 ° θ < 5 ° m = 0.5                                                                         5 ° θ
where L is the slope length factor, S is the slope factor, λ is the slope length ( m ), and θ is the slope (°).
The C factor calculation formulas we used were established by Jiang et al. (1996) based on the observation data of forest and grassland plots and control bare plots at Ansai Station in Yan’an City, Shaanxi Province, and were suitable for forest and grassland on the Loess Plateau (Formulas (6) and (7)) [44]. C factors for other land uses were assigned according to studies on soil erosion by Chen (2019) [45] and Liu et al. (2020) [46] (Table 2).
C factors for other land uses were assigned with reference to the “Technical Guidelines for Dynamic Monitoring of Water and Soil Erosion of the Ministry of Water Resources of China”.
The C factor for grassland is calculated as follows:
C g = 1                                                                                                             V 5 % e x p 0.0418 V 5                                     V > 5 %
The C factor for the forest is calculated as follows:
C f = 1                                                                                                             V 5 % e x p 0.0085 V 5 1.5                             V > 5 %
where C is the cover management and V is the vegetation coverage (%).
P is difficult to determine with land use data [47]. The slope gradient mainly affects the accurate estimation of soil erosion from farmland in the study area [48]. Therefore, the P factor was calculated using Equation (8) [49]:
P = 0.2 + 0.03 × α
where α is the percentile slope gradient.
The soil erosion modulus was divided into six grades according to the soil erosion classification [50]. The six grades included slight, mild, moderate, intensive, extreme intensive, and severe for erosion rates of ≤1000, 1000–2500, 2500–5000, 5000–8000, 8000–15,000, and ≥15,000 t∙km−2∙yr−1, respectively.
To verify the accuracy of the soil erosion estimates obtained by the USLE, we selected 13 hydrological stations in the study area and obtained sediment discharge data from 1983 to 2022. The sediment discharge data from 1983 to 2001 were provided by Professor Liu of Beijing Normal University, and the sediment transport data from 2002 to 2022 came from the Yellow River Sediment Bulletin (http://www.yrcc.gov.cn/zwzc/gzgb/gb/nsgb/ (accessed on 22 September 2023)). These hydrological stations included four hydrological stations in the upper reach (three mainstream hydrological stations at Tangnaihai, Lanzhou, Tudaogai, and one tributary hydrological station at Hongqi), six hydrological stations in the middle reach (three mainstream hydrological stations at Longmen, Tongguan, Huayuankou, and three tributary hydrological stations at Zhangjiashan, Zhuangtou, Huaxian), and three mainstream hydrological stations in the lower reach (at Gaocun, Aishan, Lijin).

2.3.2. Identifying Spatial Pattern of Soil Erosion Temporal Change Trend and Its Controlling Factors

The spatial patterns of temporal trends were estimated using Sen’s slope estimator, and significance at the α = 0.05 level was determined using Mann–Kendall’s nonparametric test for a monotonic trend; the detailed formulations were described in [51,52,53].
Spatial and temporal variations in soil erosion are mainly caused by protection measures, climate, topography, soil, and vegetation coverage [54]. In the study area, the soil properties (K) and topography (LS) factors were relatively stable, so we gave more attention to the R, C, and P factors. These three factors represent the effects of rainfall (R), vegetation coverage (FVC), and land use (LU) on soil erosion. To compare the impact of these three factors on soil erosion, we established four scenarios, i.e., R, FVC, and LU were changed simultaneously (referred to as ALL), only FVC was changed (referred to as FVC), only R was changed (referred to as R), and only LU was changed (referred to as LU) during the research period. Finally, multiple regression analysis (Equation (9)) was used to identify the spatial factors that control the soil erosion changes in each grid.
y = a 1 × x 1 + a 2 × x 2 + a 3 × x 3 + b
where y is the ALL scenario; x1, x2 and x3 are the R scenario, FVC scenario, and LU scenario, respectively; a1, a2 and a3 are the coefficients of each factor; and b is the error term.

3. Results

3.1. Spatial Distribution of Soil Erosion in the Yellow River Basin

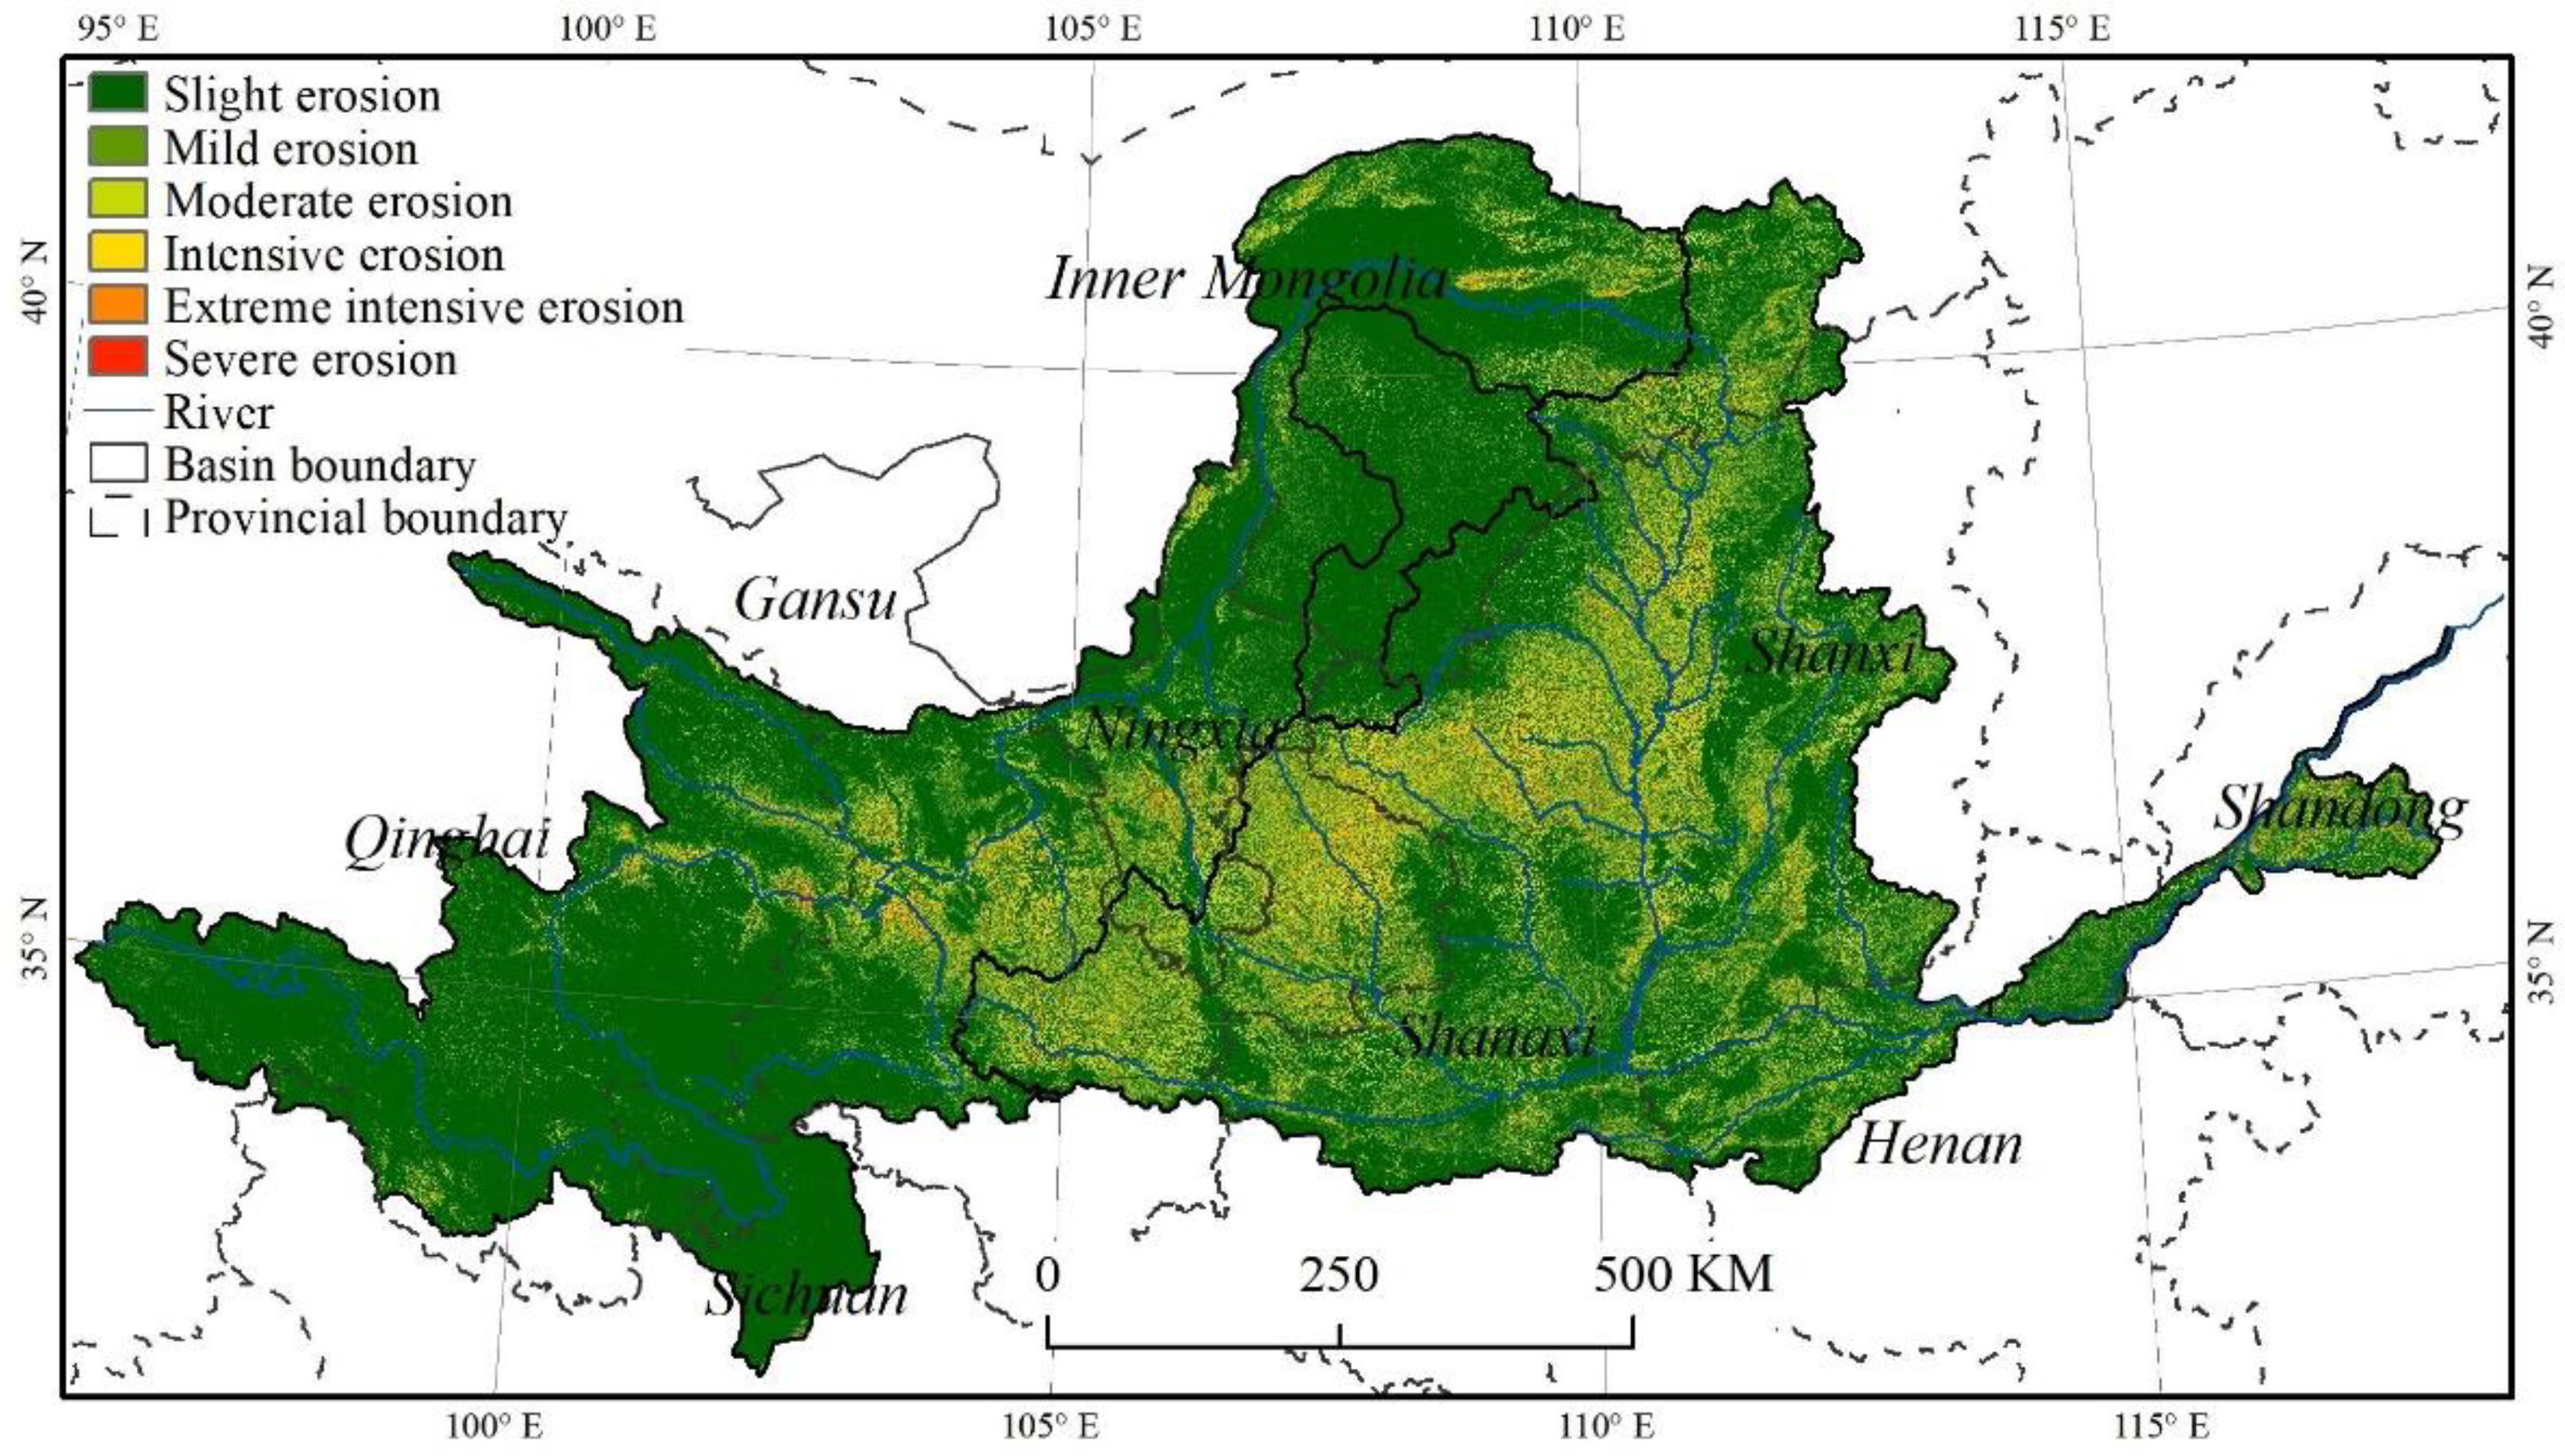
The average annual soil erosion modulus was 1160.97 t∙km−2∙yr−1 during the research period in this region (Table 3), and it was significantly greater in the middle reach (1717.34 t∙km−2∙yr−1) than in the lower (1268.59 t∙km−2∙yr−1) and upper (710.33 t∙km−2∙yr−1) reaches. Slight erosion was the dominant erosion intensity grade, accounting for 70.63% over the entire region, and was mainly located in the upper reach and the southeast portion of the middle reach. The mild erosion grade (accounting for 14.60% of the entire basin) was mainly located in Gansu Province in the upper reach, most areas of the middle reach, and near the estuary in the lower reach. The moderate, intensive, and extreme erosion grades accounted for 8.93%, 3.66%, and 1.89% of the total region, respectively, and were located in Gansu Province in the upper reach and the northwest part of the middle reach. Severe erosion only accounted for 0.29% and was mainly located in the northwest mountainous area in the middle reach (Figure 2).

3.2. Temporal and Spatial Variation Characteristics of Soil Erosion in the Yellow River Basin

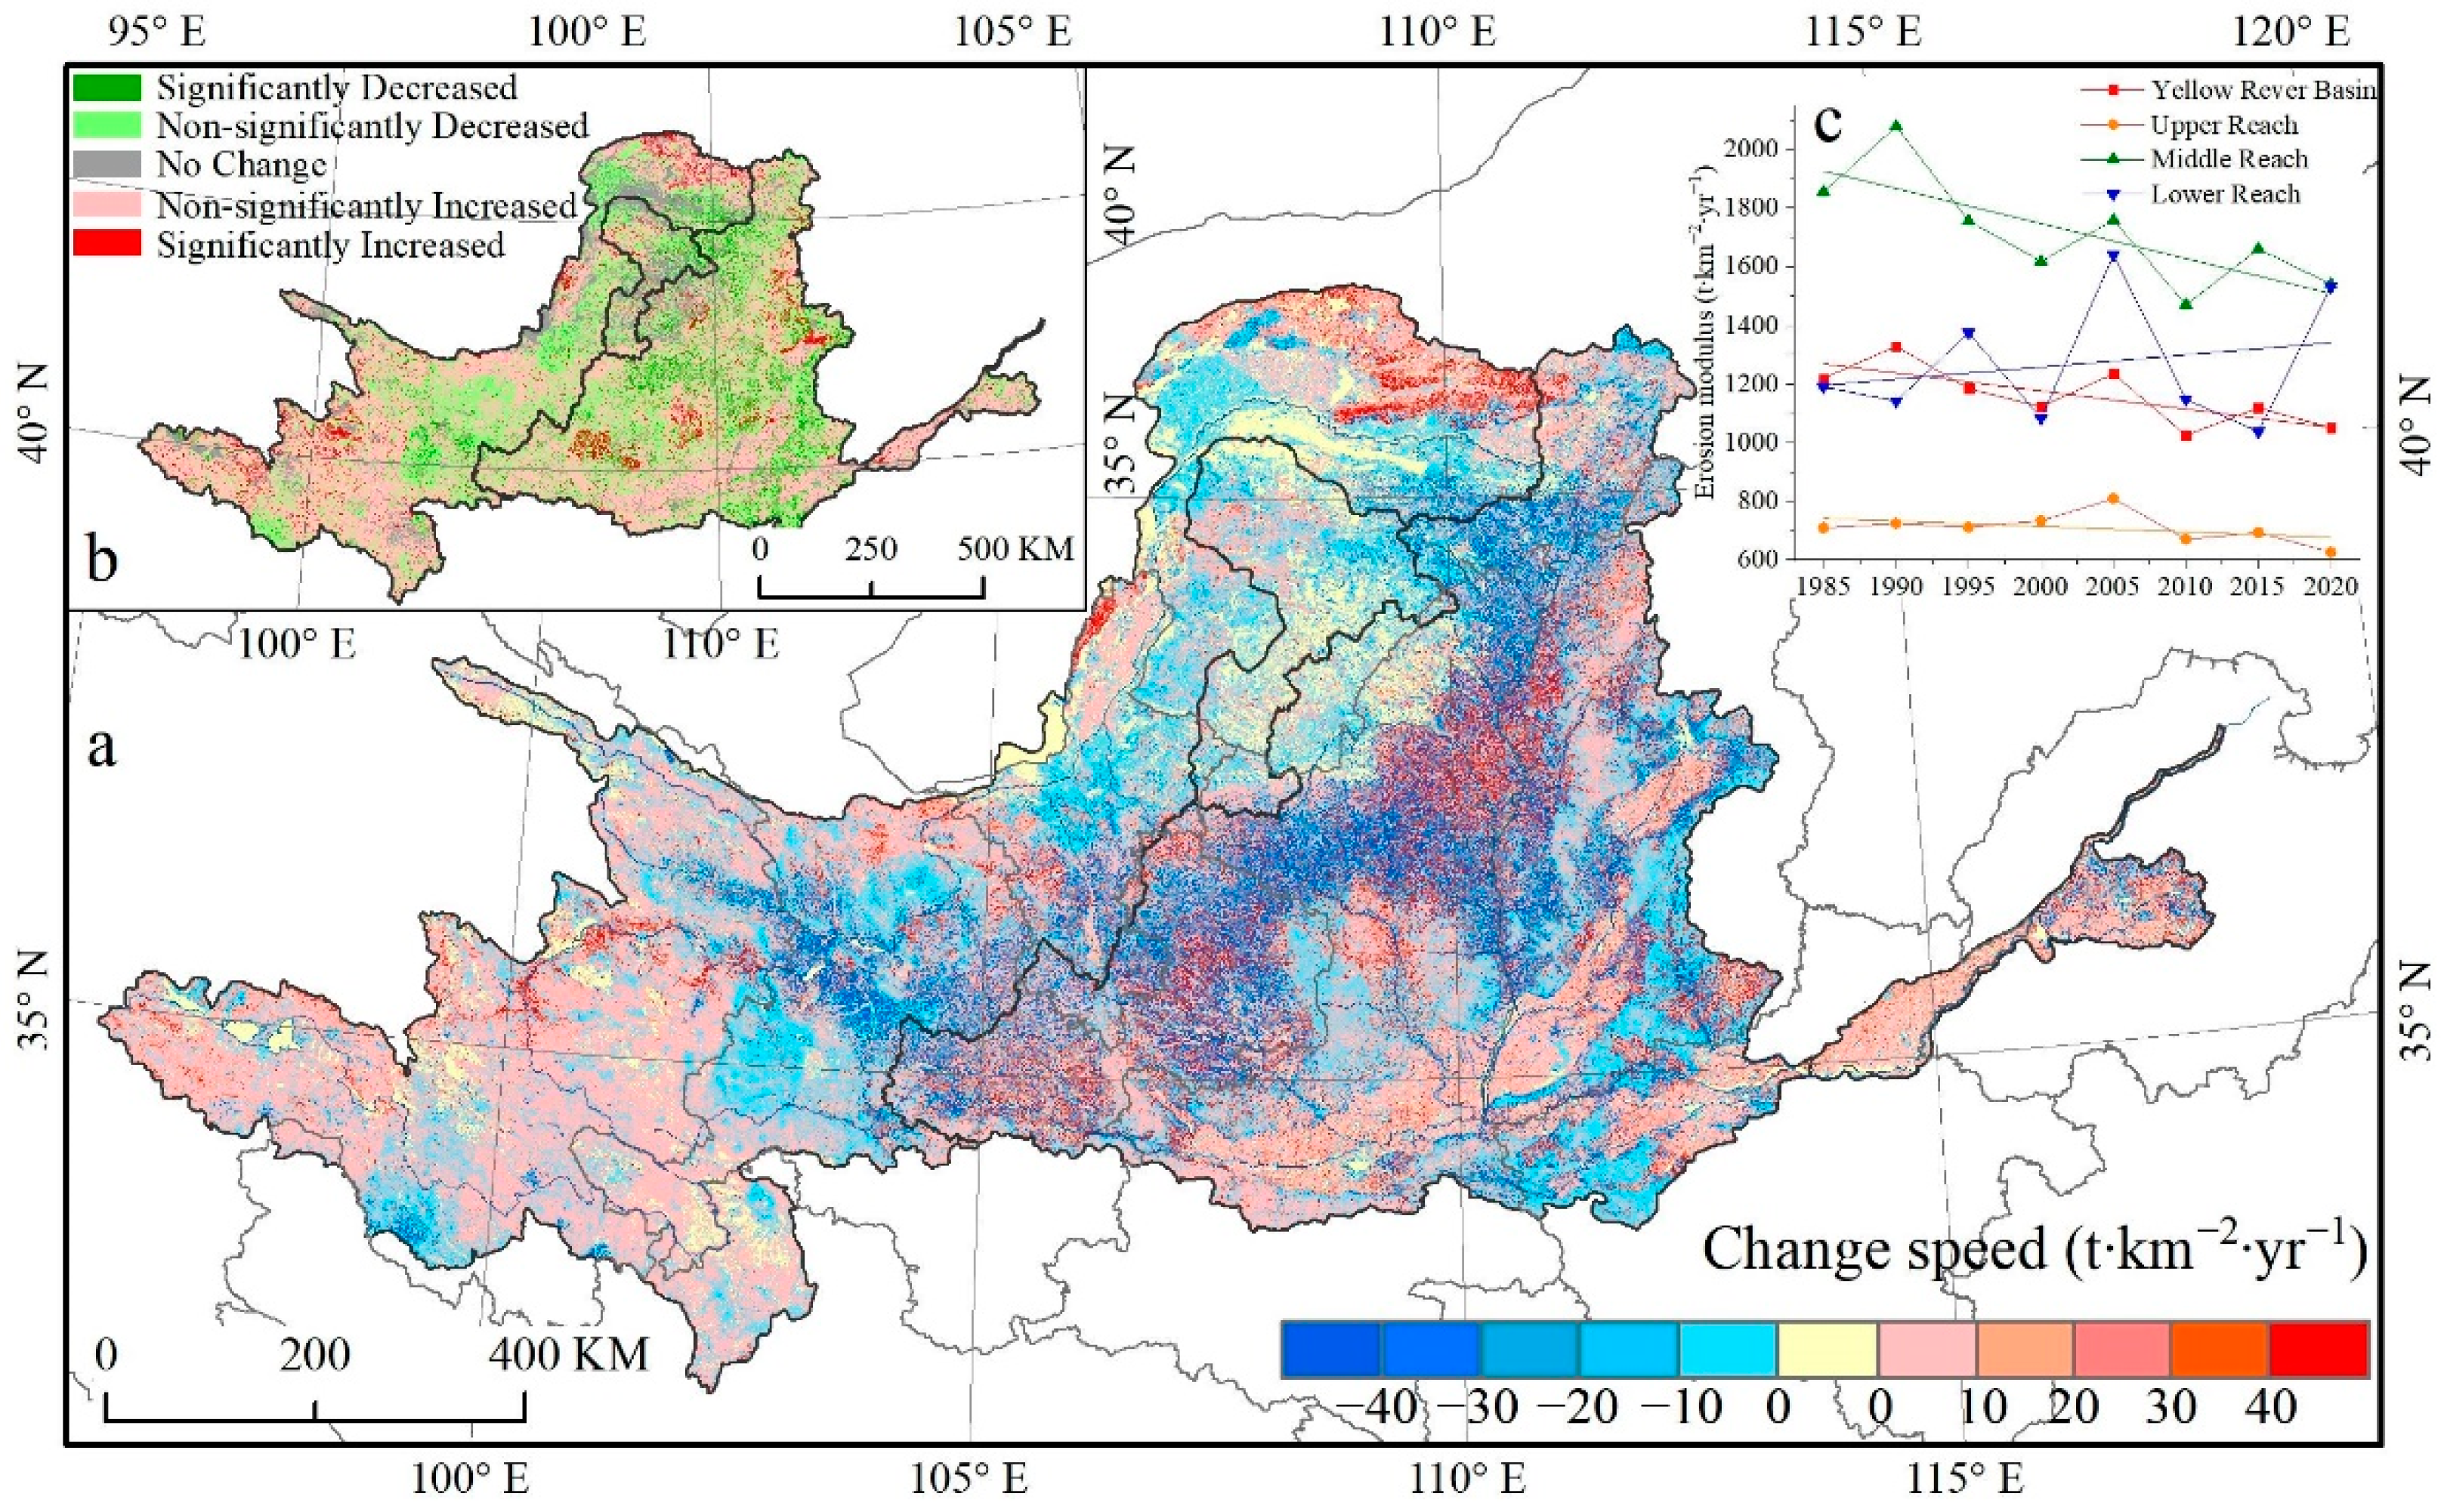
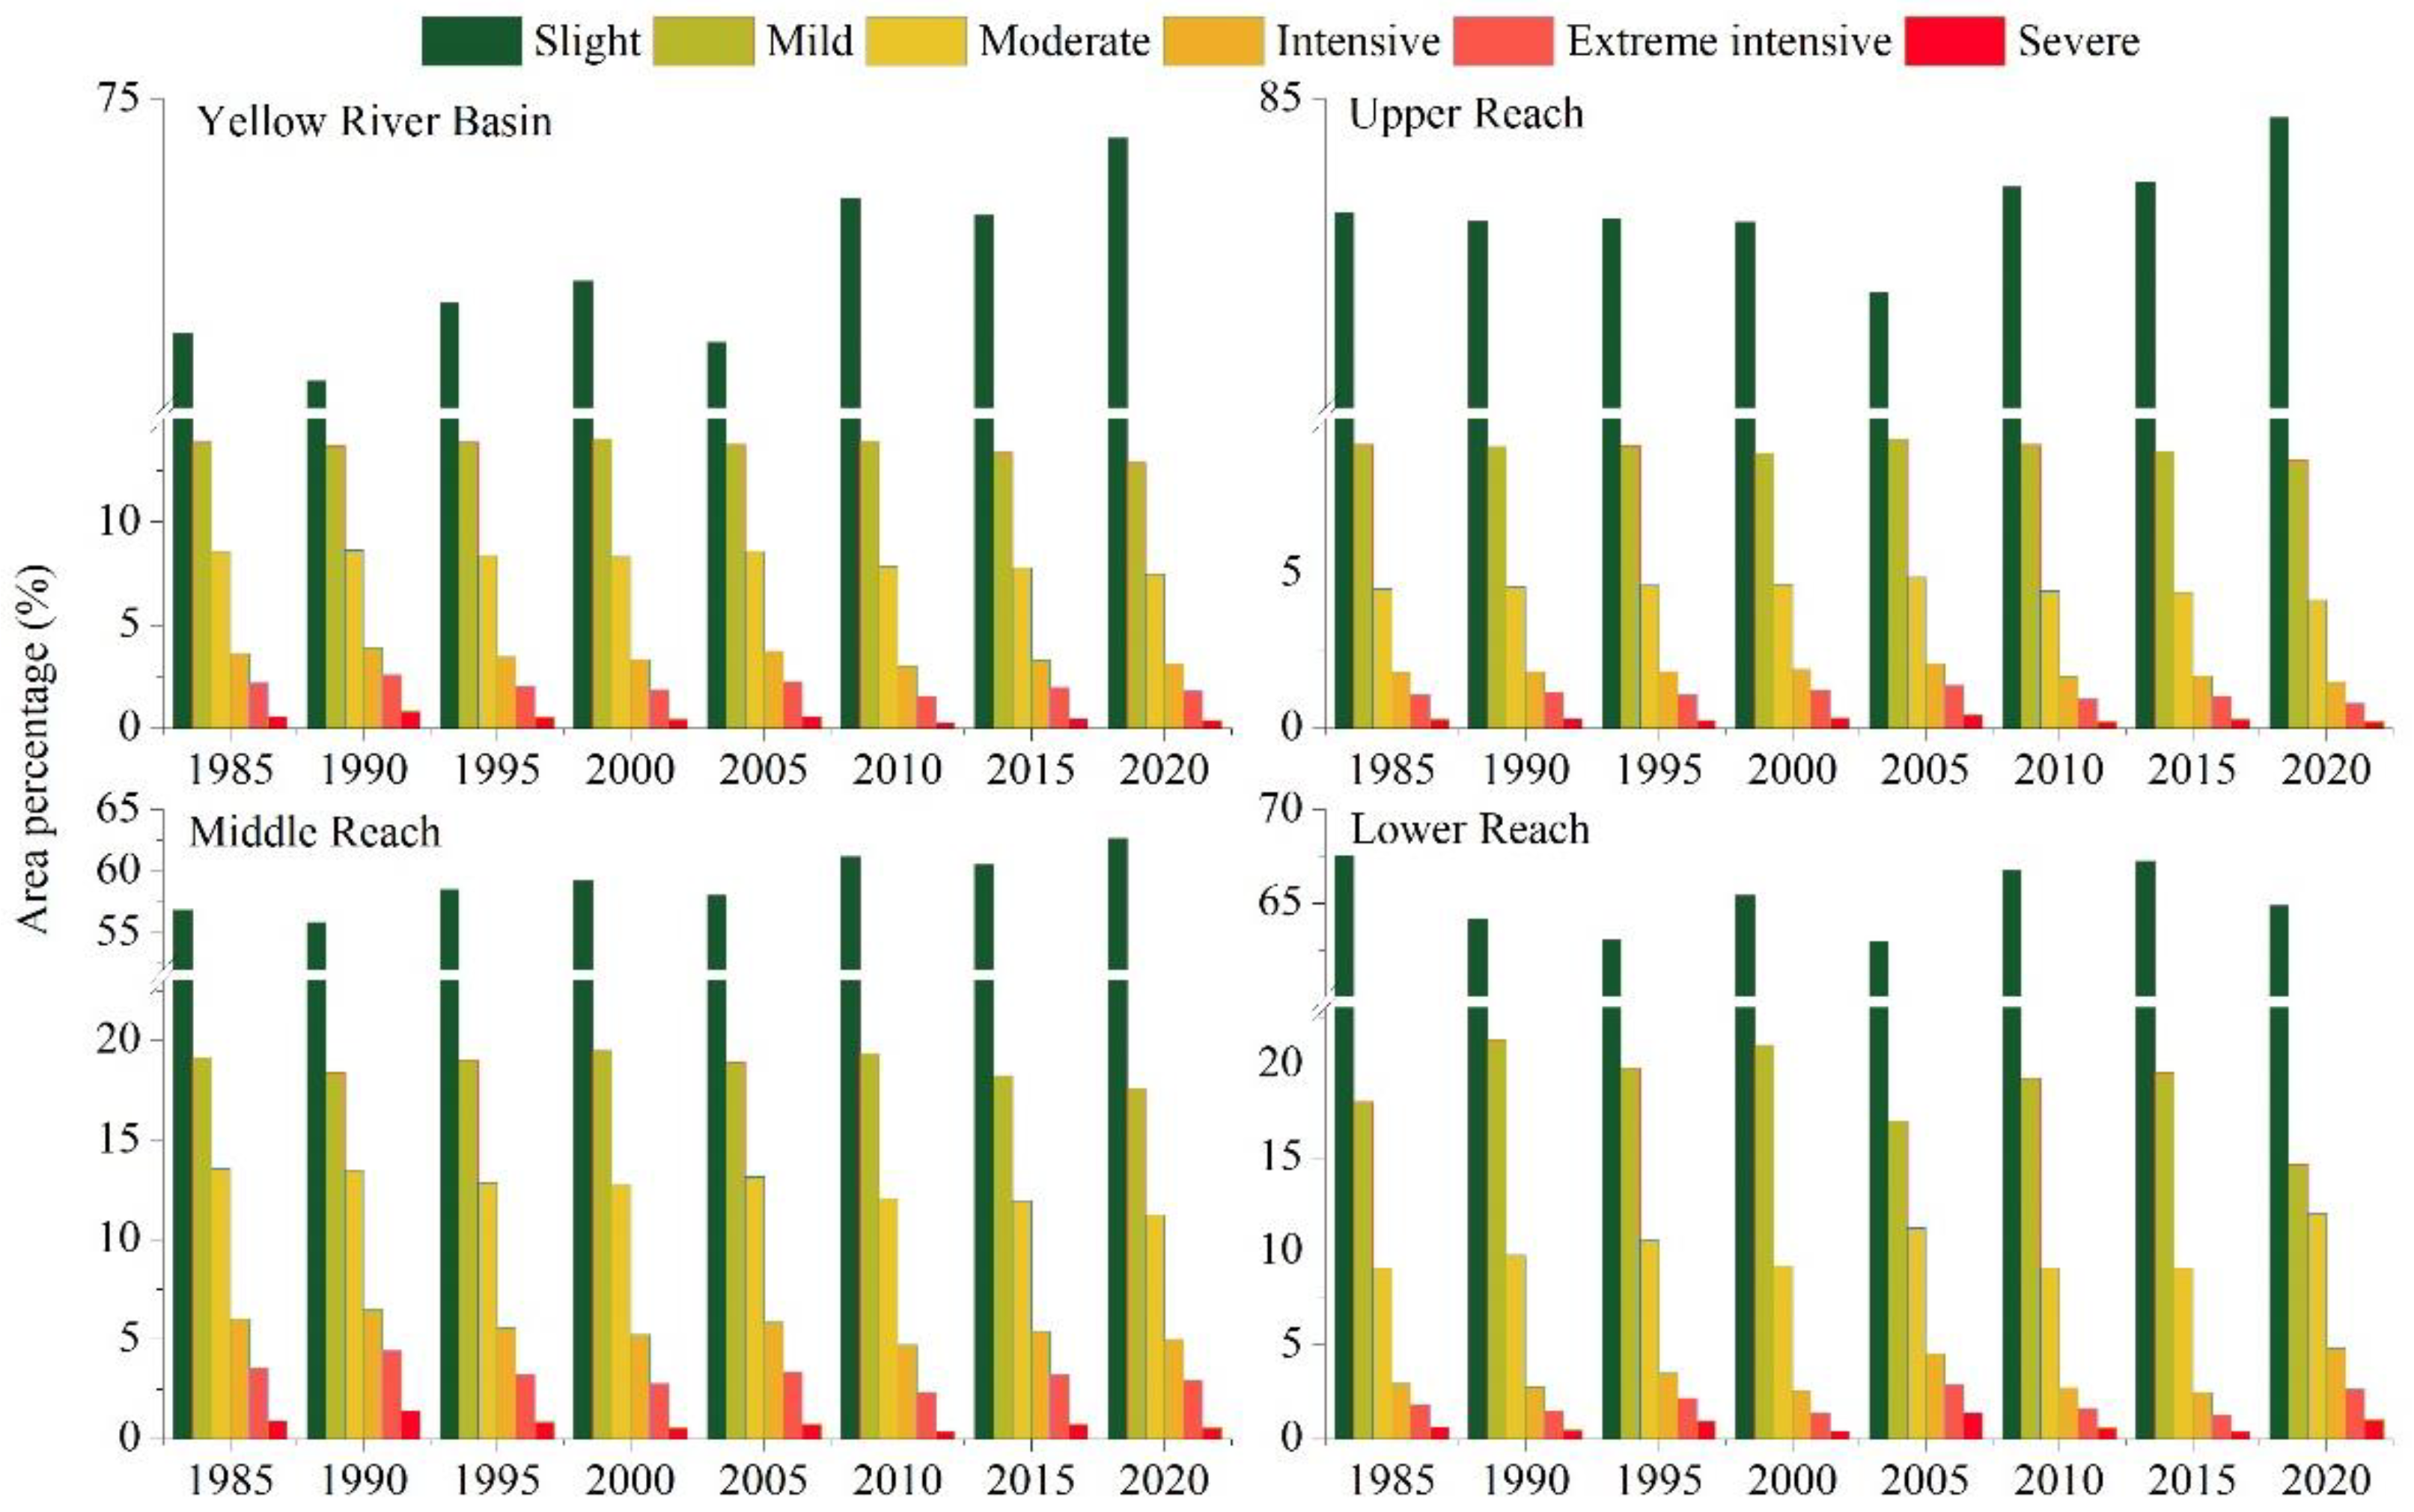
As shown in Figure 3 and Figure 4, soil erosion in the Yellow River Basin showed a significant decreasing trend (p < 0.05), with the average soil erosion modulus decreasing from 1219.74 t∙km−2∙yr−1 in 1985 to 1050.98 t∙km−2∙yr−1 in 2020. During the research period, significant differences were detected with different soil erosion grades: the area of slight soil erosion grades increased by 2.53 km2 (Figure 5), while the area of mild, moderate, intensive, extreme intensive, and severe erosion grades decreased by 0.77 × 10⁴ km2, 0.86 × 10⁴ km2, 0.42 × 10⁴ km2, 0.32 × 10⁴ km2, and 0.16×10⁴ km2, respectively.
The area with increasing soil erosion from 1985 to 2020 in the total basin (50.89%) was greater than the area with decreasing soil erosion (38.16%) (Figure 4). Specifically, 46.63% of the areas showed an insignificant increasing trend (p > 0.05), mainly distributed in the western and southeastern Yellow River Basin. Only a small portion of the middle reach (4.26%) exhibited a significant (p < 0.05) increase in the soil erosion modulus. In total, 30.93% of the areas showed an insignificant decreasing trend (p > 0.05), mainly distributed in the eastern middle reach and upper reach, while 7.22% of the areas, concentrated in the middle reach, showed a significant decreasing trend (p < 0.05). The soil erosion modulus changes in the Yellow River Basin were mainly 0–10 t∙km−2∙yr−1, accounting for 59.53% of the total area, including 36.27% of the increased soil erosion area and 23.26% of the decreased. In total, 12.17% of the areas in which the change in soil erosion modulus exceeded 40 t∙km−2∙yr−1, including 4.55% of the increased soil erosion areas and 7.62% of the decreased areas, were distributed in the middle reach.
Different change trends were detected for the different reaches of the study area during the research period. Soil erosion in the upper reach was the lowest in the entire region, with an insignificant decreasing trend (p > 0.05) during the study period. The areas of slight erosion increased by 0.57 × 10⁴ km2, while the areas of mild, moderate, intensive, extreme intensive and severe erosion decreased by 0.19 × 10⁴, 0.13 × 10⁴, 0.11 × 10⁴, 0.11 × 10⁴ km2 and 0.03 × 10⁴ km2, respectively. Soil erosion in the middle reach was the most serious in the entire region, showing a significant decreasing trend from 1985 to 2020 (p < 0.05). The areas of slight erosion increased by 2.07 × 10⁴ km2, while the areas of mild, moderate, intensive, extreme intensive and severe erosion decreased by 0.55 × 10⁴, 0.82 × 10⁴, 0.35 × 10⁴, 0.22 × 10⁴ and 0.13 × 10⁴ km2, respectively. Unlike the upper and middle reaches, soil erosion in the lower reach showed an insignificant increasing trend (p > 0.05), with the areas of slight and mild erosion decreasing in area by 0.06 × 10⁴ and 0.08 × 10⁴ km2, respectively, while the areas of moderate, intensive, extreme intensive and severe erosion increased in area by 0.07 × 10⁴, 0.04 × 10⁴, 0.02 × 10⁴, and 0.01 × 10⁴ km2, respectively.

3.3. Factors Controlling Spatial Changes in Soil Erosion

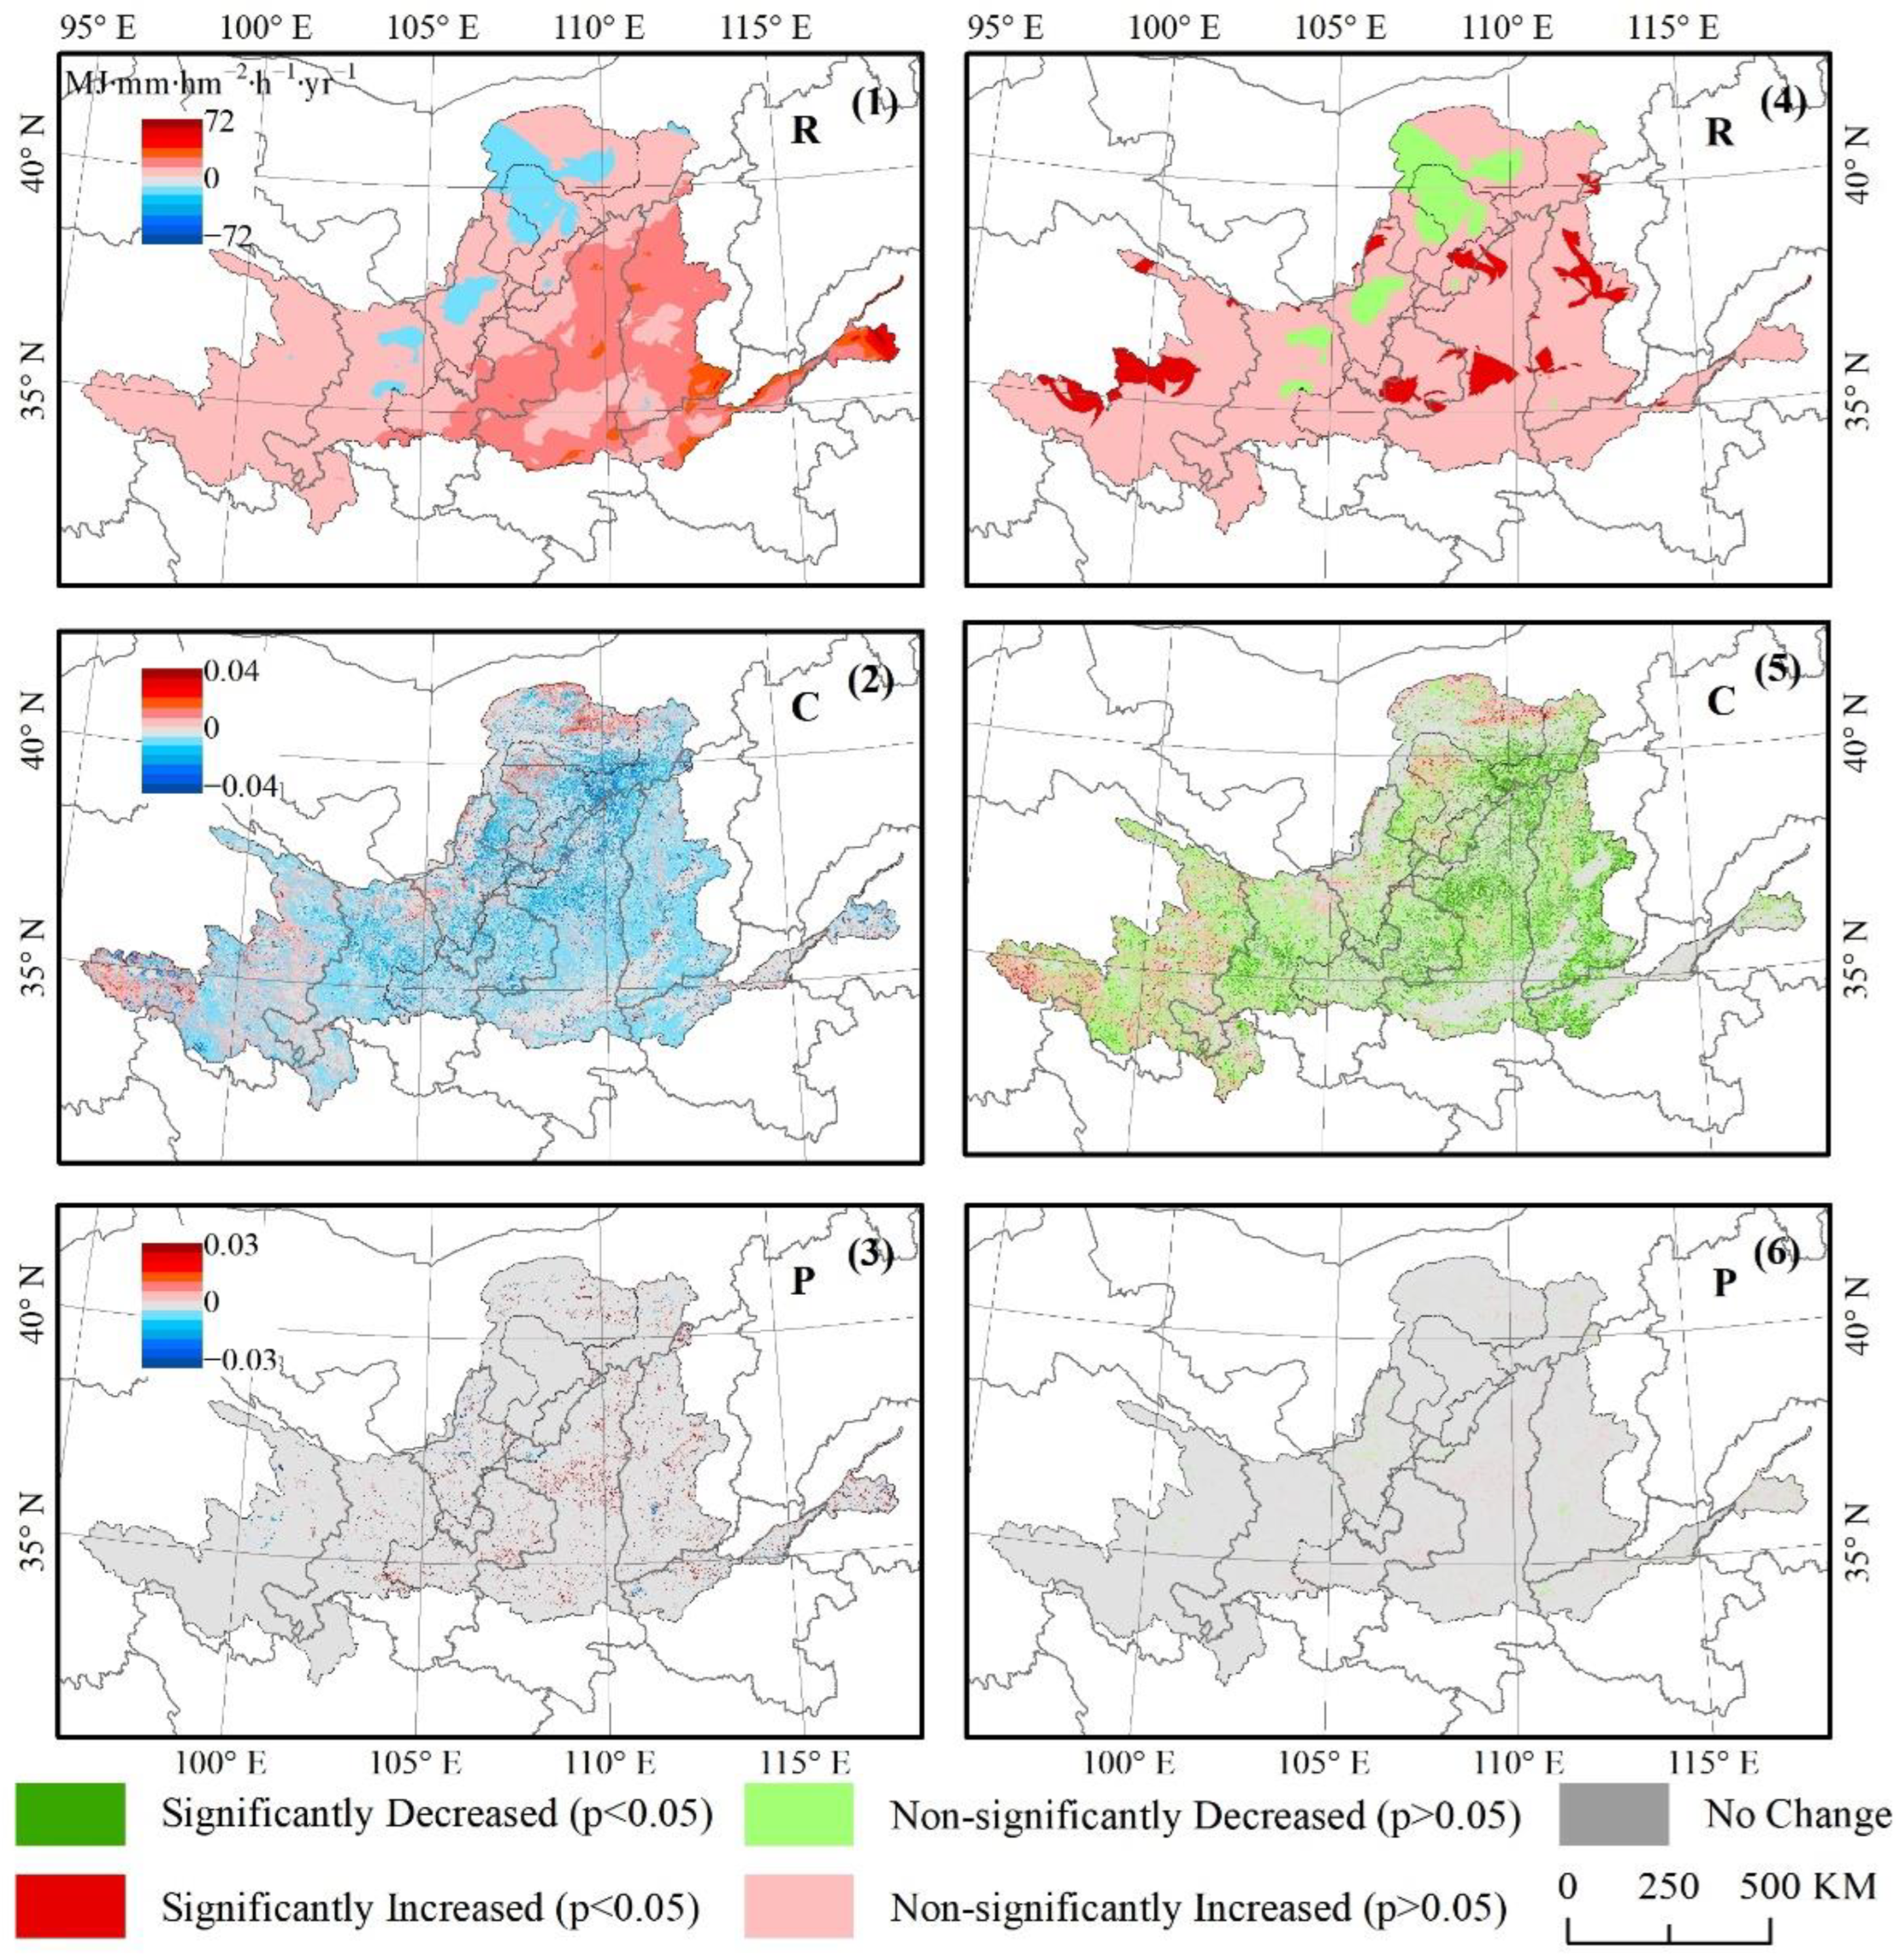
Assuming that the K, L, and S factors were stable during the research period in the study area, then the changes in soil erosion were determined by the R, C, and P factors. During the research period, 92.04% of the area showed an increasing trend for the R factor, of which 84.53% of the area increased non-significantly (p > 0.05) and only 7.51% of the area increased significantly (p < 0.05) (Figure 6). In contrast, 41.17% of the area showed a decreasing trend for the C factor, of which 30.06% of the area decreased non-significantly (p > 0.05) and 11.11% of the area decreased significantly (p < 0.05). The P factor did not change much during the research period.
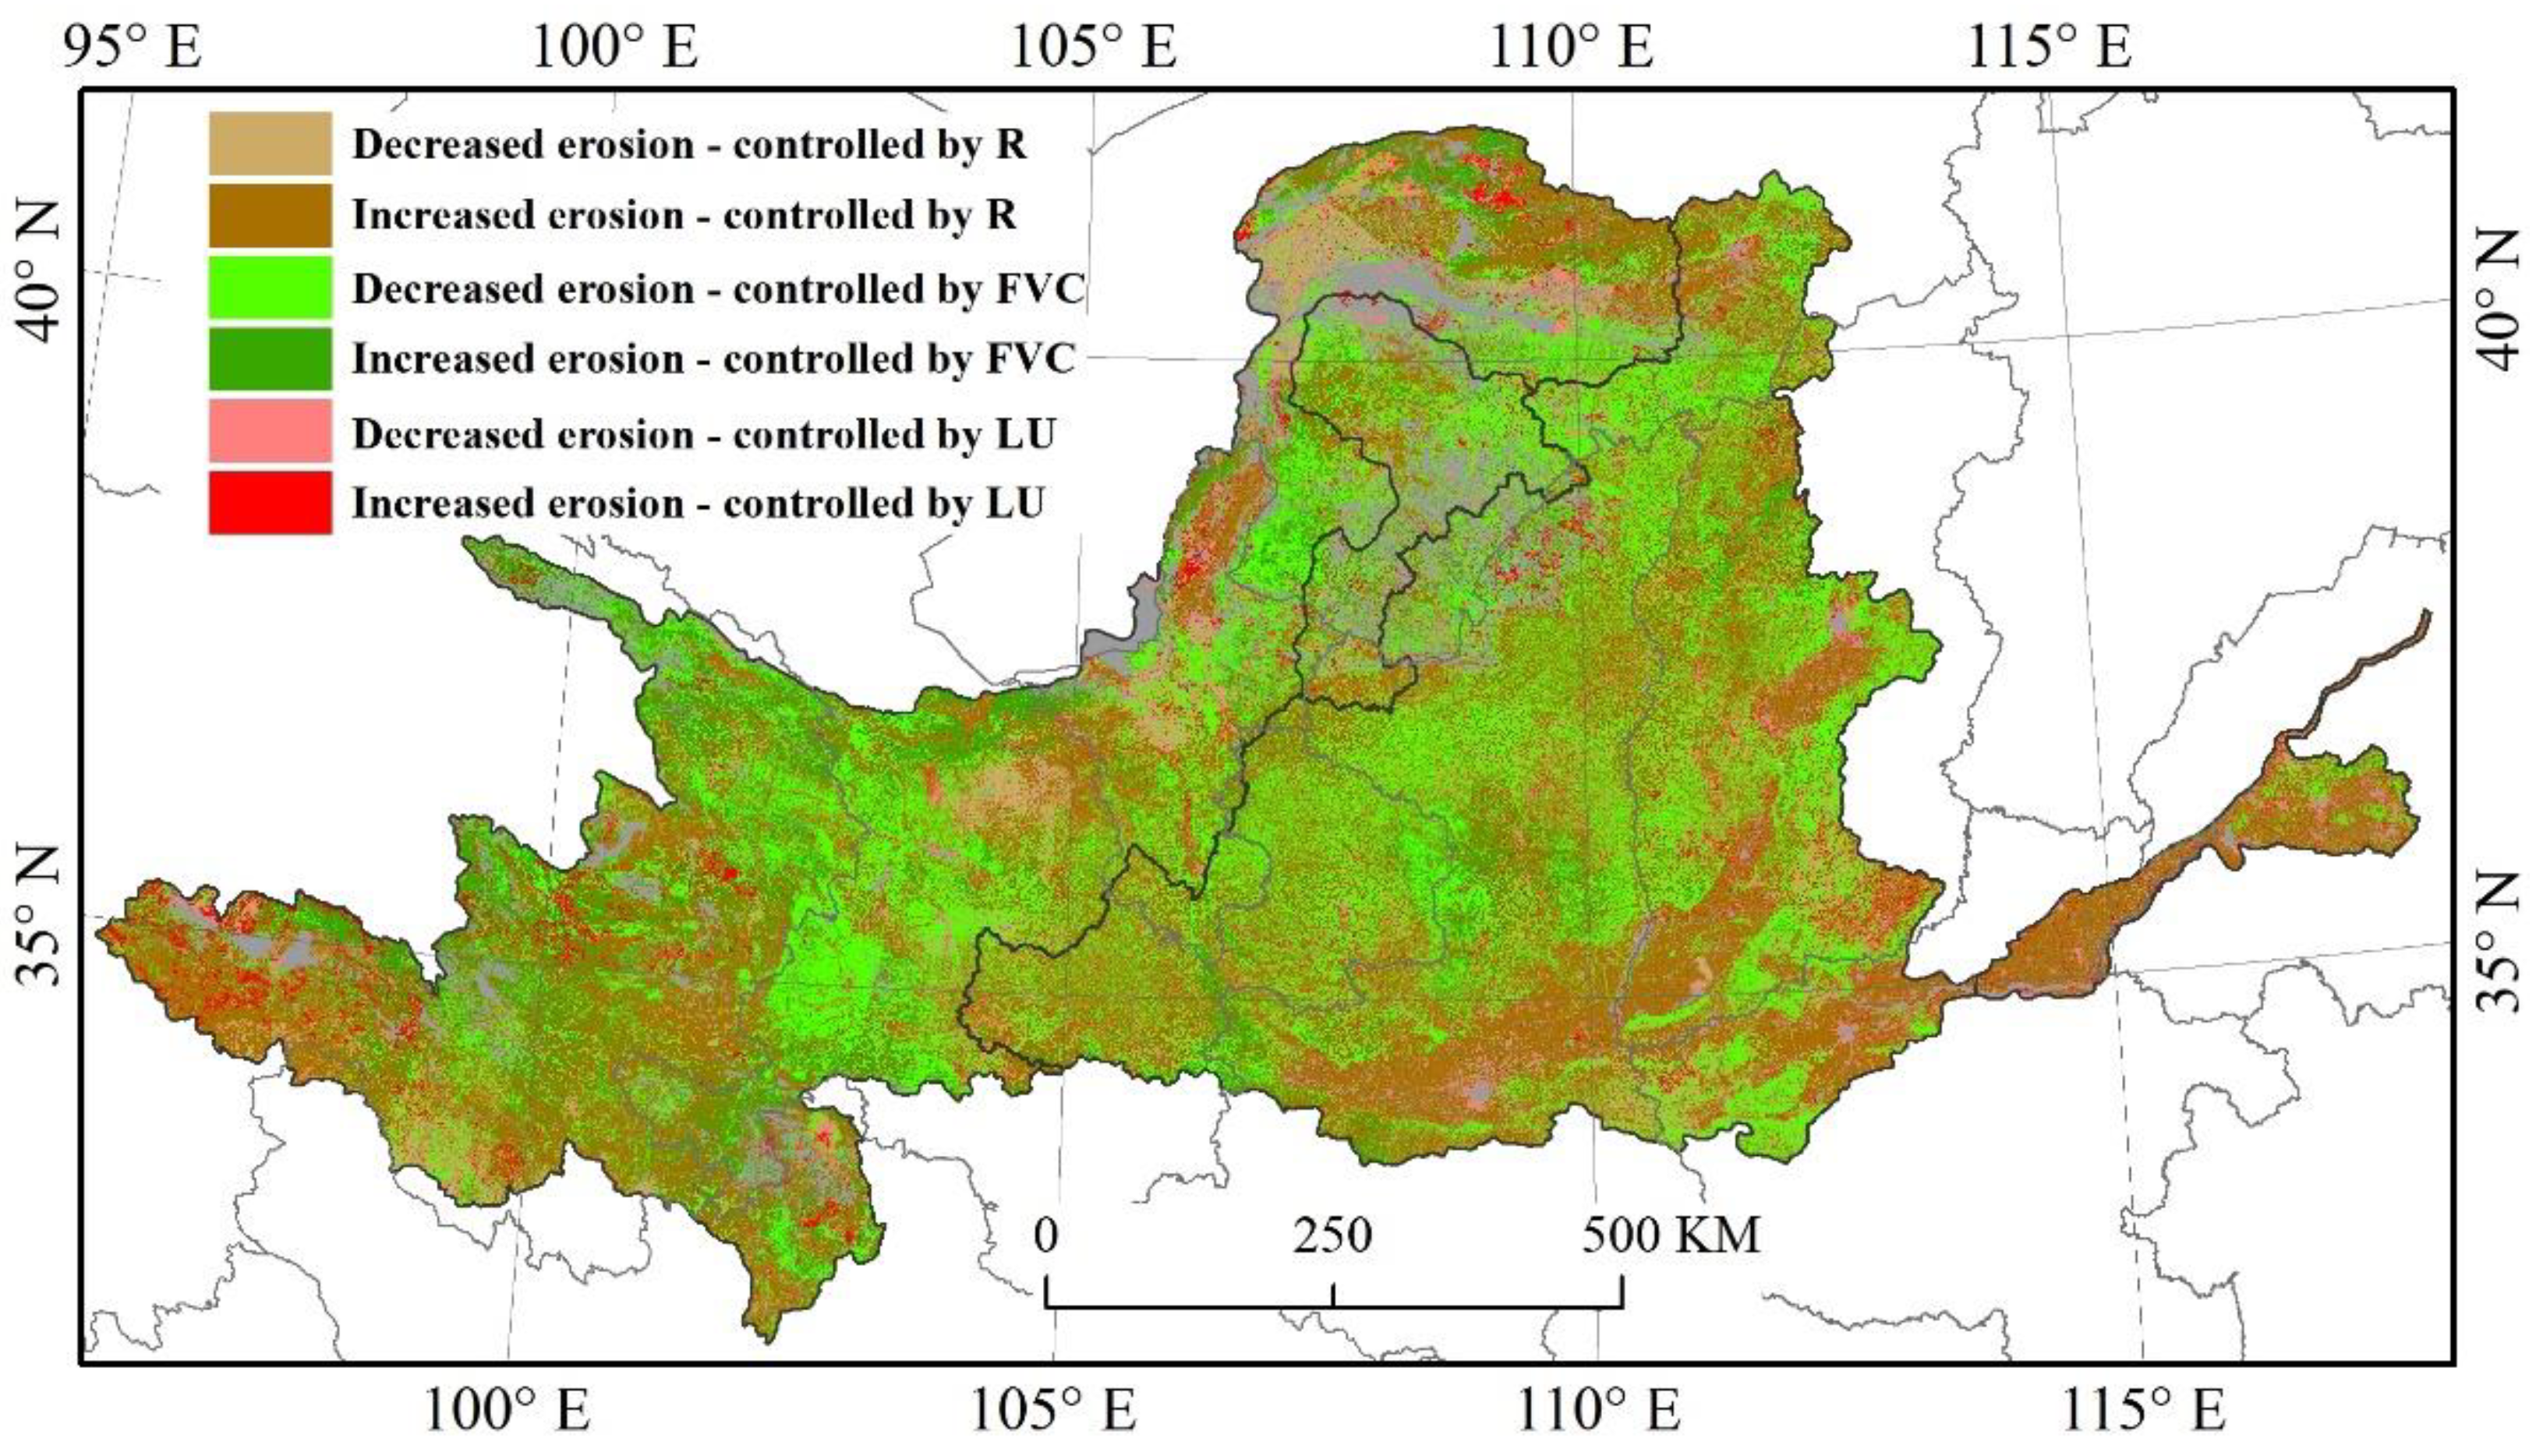
The areas controlled by FVC, R, and LU accounted for 38.95%, 40.87%, and 9.21% of the soil erosion changes, respectively, from 1985 to 2020 over the total Yellow River Basin (Figure 7). The area with soil erosion controlled by FVC was located in the upper and middle reaches, and 70.77% of this area had FVC that was negatively correlated with soil erosion modulus change, indicating that increased vegetation coverage played a key role in controlling soil erosion in the total region, especially in the middle reach. The area with soil erosion controlled by R was located in the northwest and southeast of the study area, and 86.62% of this area had R that was positively correlated with soil erosion change. The area with soil erosion controlled by LU was meanly located in the western area of the upper reach, with 55.60% showing a positive correlation and 44.40% showing a negative correlation; this shows that the impact of land use conversion on soil erosion is relatively complex.

4. Discussion

4.1. Uncertainty of the USLE

Regional soil erosion is determined by natural environmental conditions, soil and water conservation projects, and land use intensity. The natural environmental conditions, such as topography, climate, soil erodibility, and vegetation coverage, are considered the basis for soil erosion occurrence. Land use, especially agricultural production, is a soil surface disturbance process caused by intensive human activities such as plowing, planting, and harvesting that accelerate soil loss. The heterogeneous spatial variation of those factors and their interactions is a complex process of soil and water deposition and transportation [55]. Soil loss estimation is a valuable method for evaluating soil erosion intensity and for determining erosion control measures. Because the USLE attempts to consider all of the factors that affect erosion processes to estimate regional soil loss, the simulated soil modulus is the potential regional total soil erosion, not the actual amount of soil erosion, and the USLE is only concerned with soil water erosion but cannot simulate other soil erosion types such as wind erosion. In addition, the USLE cannot simulate the amount of soil deposition under complex terrain, so there are certain limitations in the use of USLE.
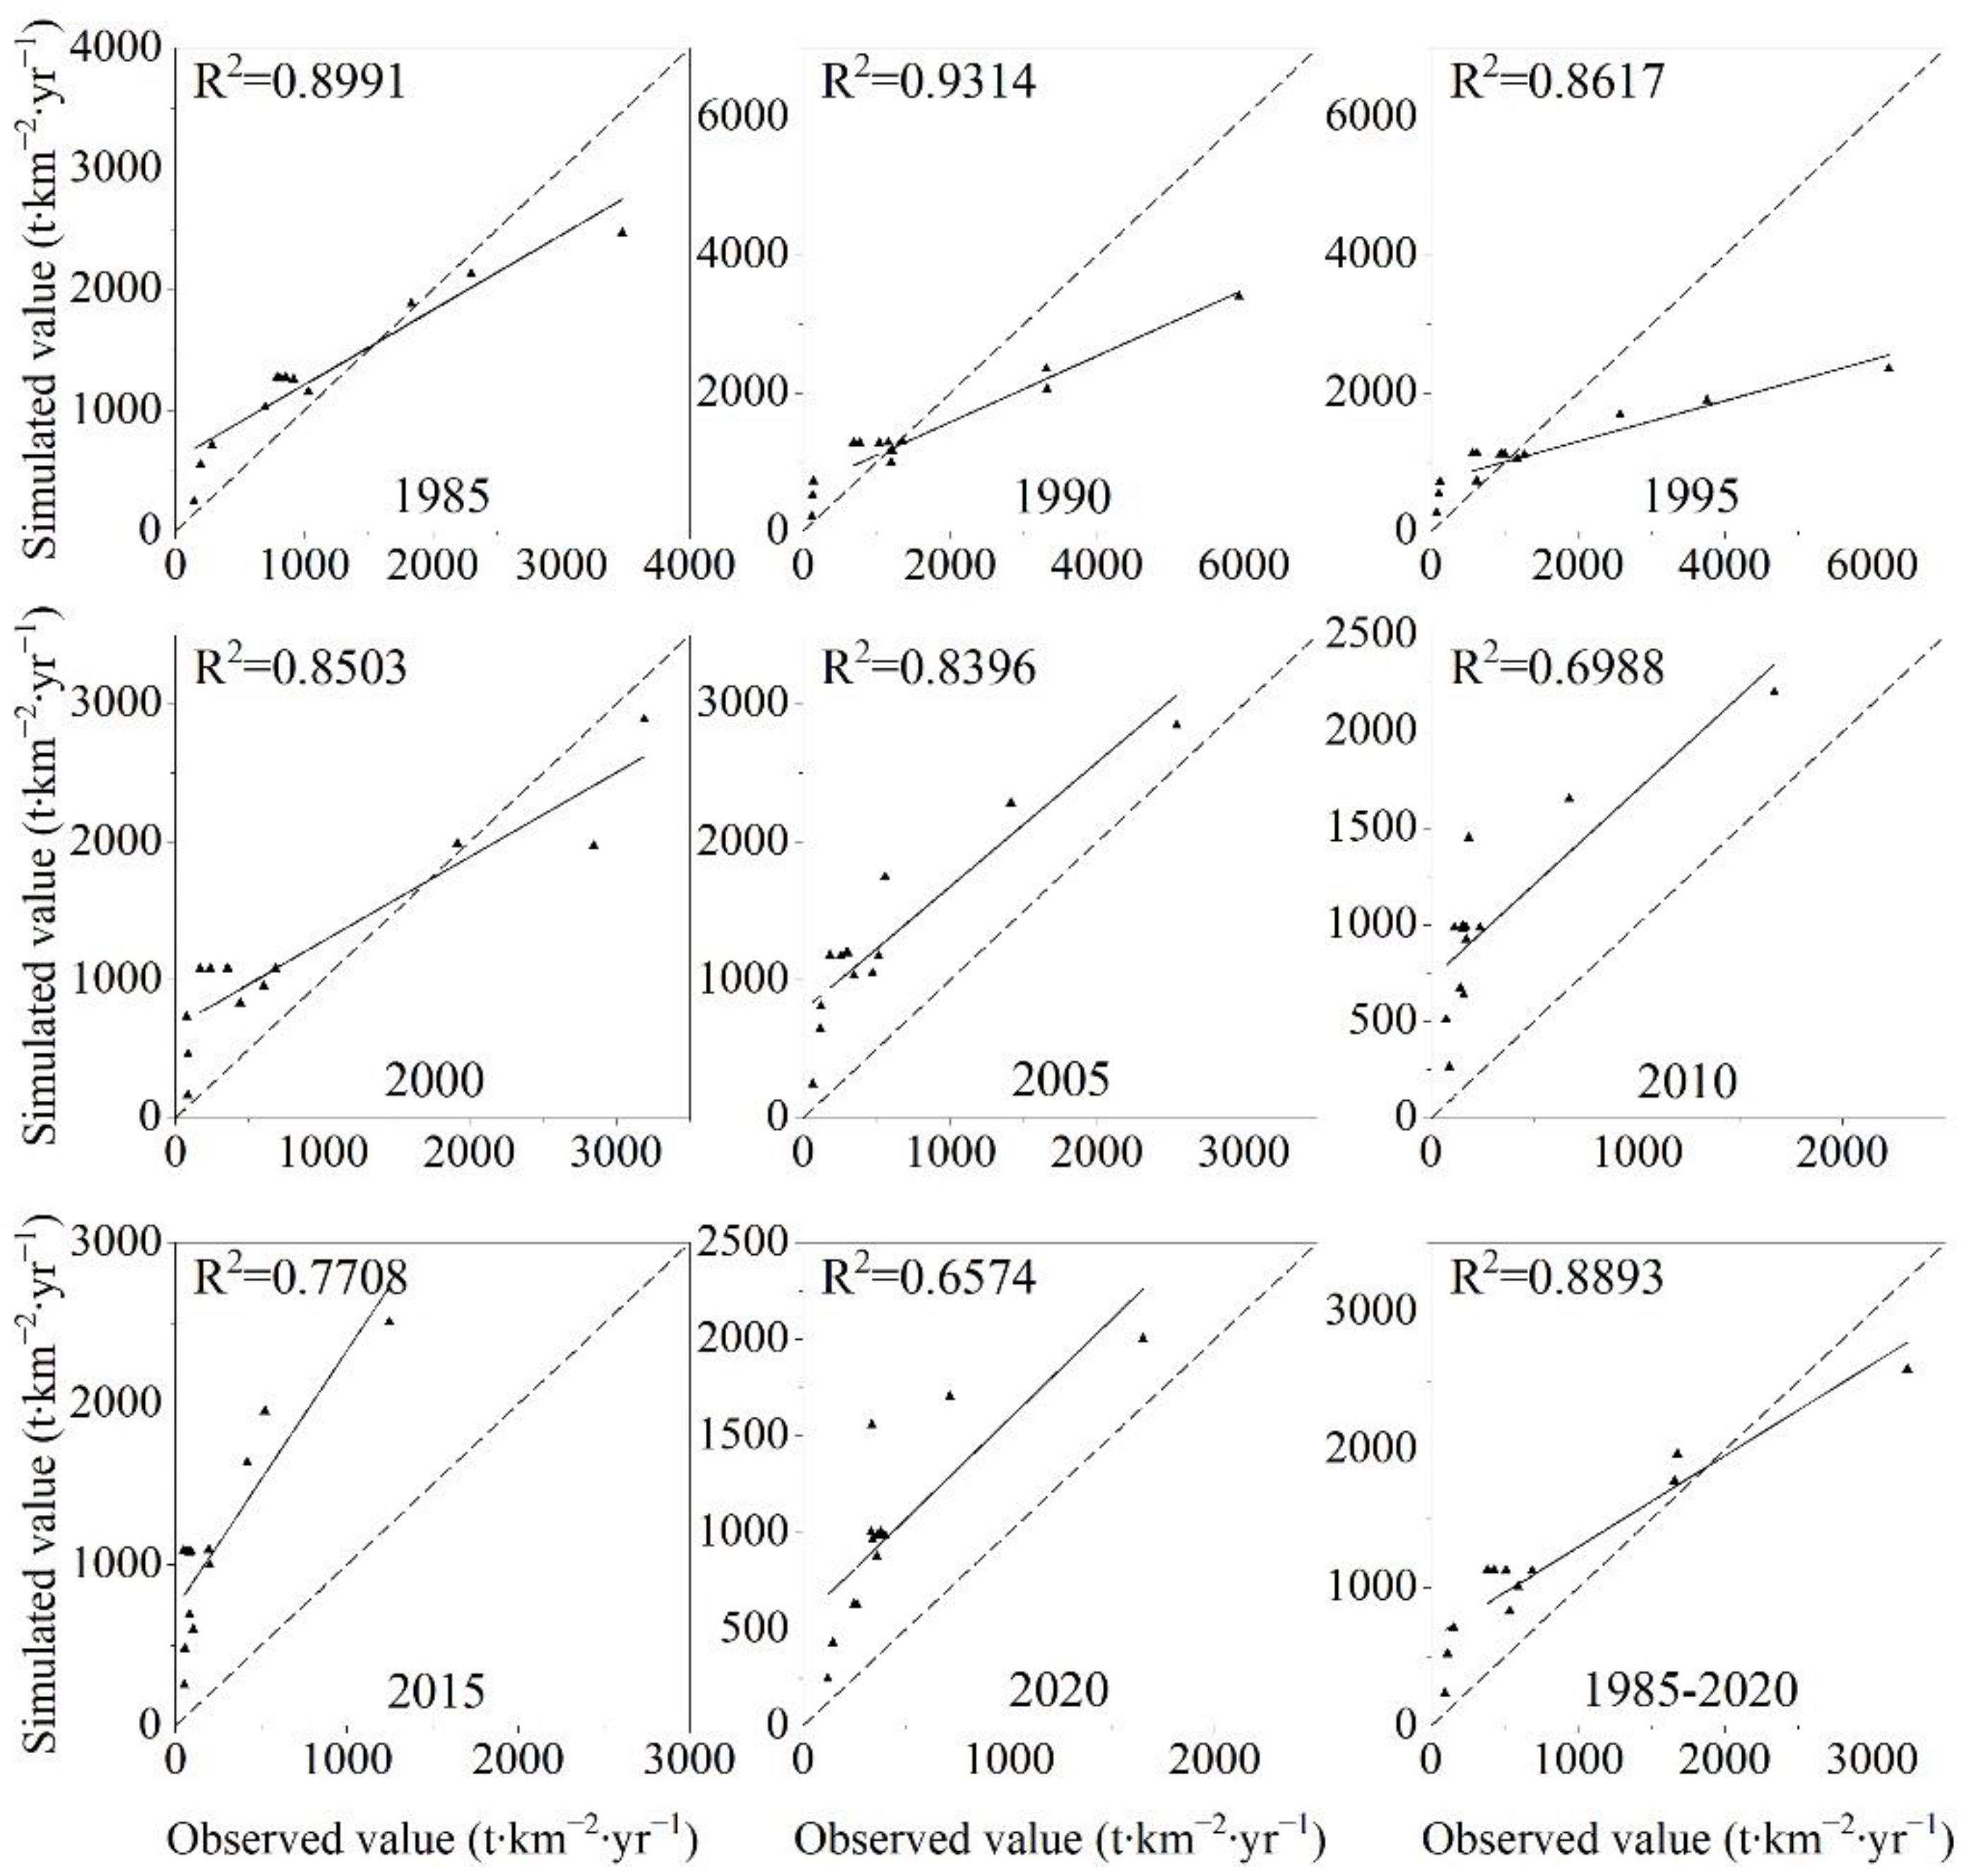
The implementation of soil and water conservation projects was another factor affecting the accuracy of the USLE in the past 30 years in this region. To control the serious regional soil erosion problem in the Yellow River Basin, the government of China not only implemented projects to increase vegetation coverage (such as aerial seeding in the Three-North Shelterbelt and landscape engineering in the Loess Plateau), but also implemented local soil and water conservation projects, and encouraged agricultural practices such as contour plowing. While these conservation practices greatly helped control soil erosion, their effectiveness was challenging to fully capture within the USLE. Firstly, the multitude of conservation practices undertaken in the Yellow River Basin, particularly terraces and silt dams, were not accurately represented in current spatial datasets. Despite the construction of approximately 5.50 × 10⁴ km2 of terraces and 58,422 silt dams by 2019 [56], these data were not fully integrated into the model. Secondly, alterations in the surface environment resulting from engineering measures and changes in vegetation led to increased soil deposition, a phenomenon not fully accounted for by the USLE. Consequently, our simulation results somewhat attenuated the beneficial impact of these protective measures. Although the uncertainty of the soil erosion modulus estimated was relatively high due to the above reasons, the soil erosion modulus simulated by the USLE from 1985 to 1995 was slightly smaller than the observed sediment values at each of the hydrological stations, but higher than the observed sediment values from 2000 to 2020. But the R2 values were relatively highly correlated with the data observed from the selected hydrological stations (0.6574–0.9314) (Figure 8). In particular, the average soil erosion modulus simulated by the USLE from 1985 to 2020 was close to the observed sediment values of each hydrological station, and the R2 reached 0.8893.

4.2. Spatial-Temporal Variation of Soil Erosion and Its Controlling Factors in the Yellow River Basin

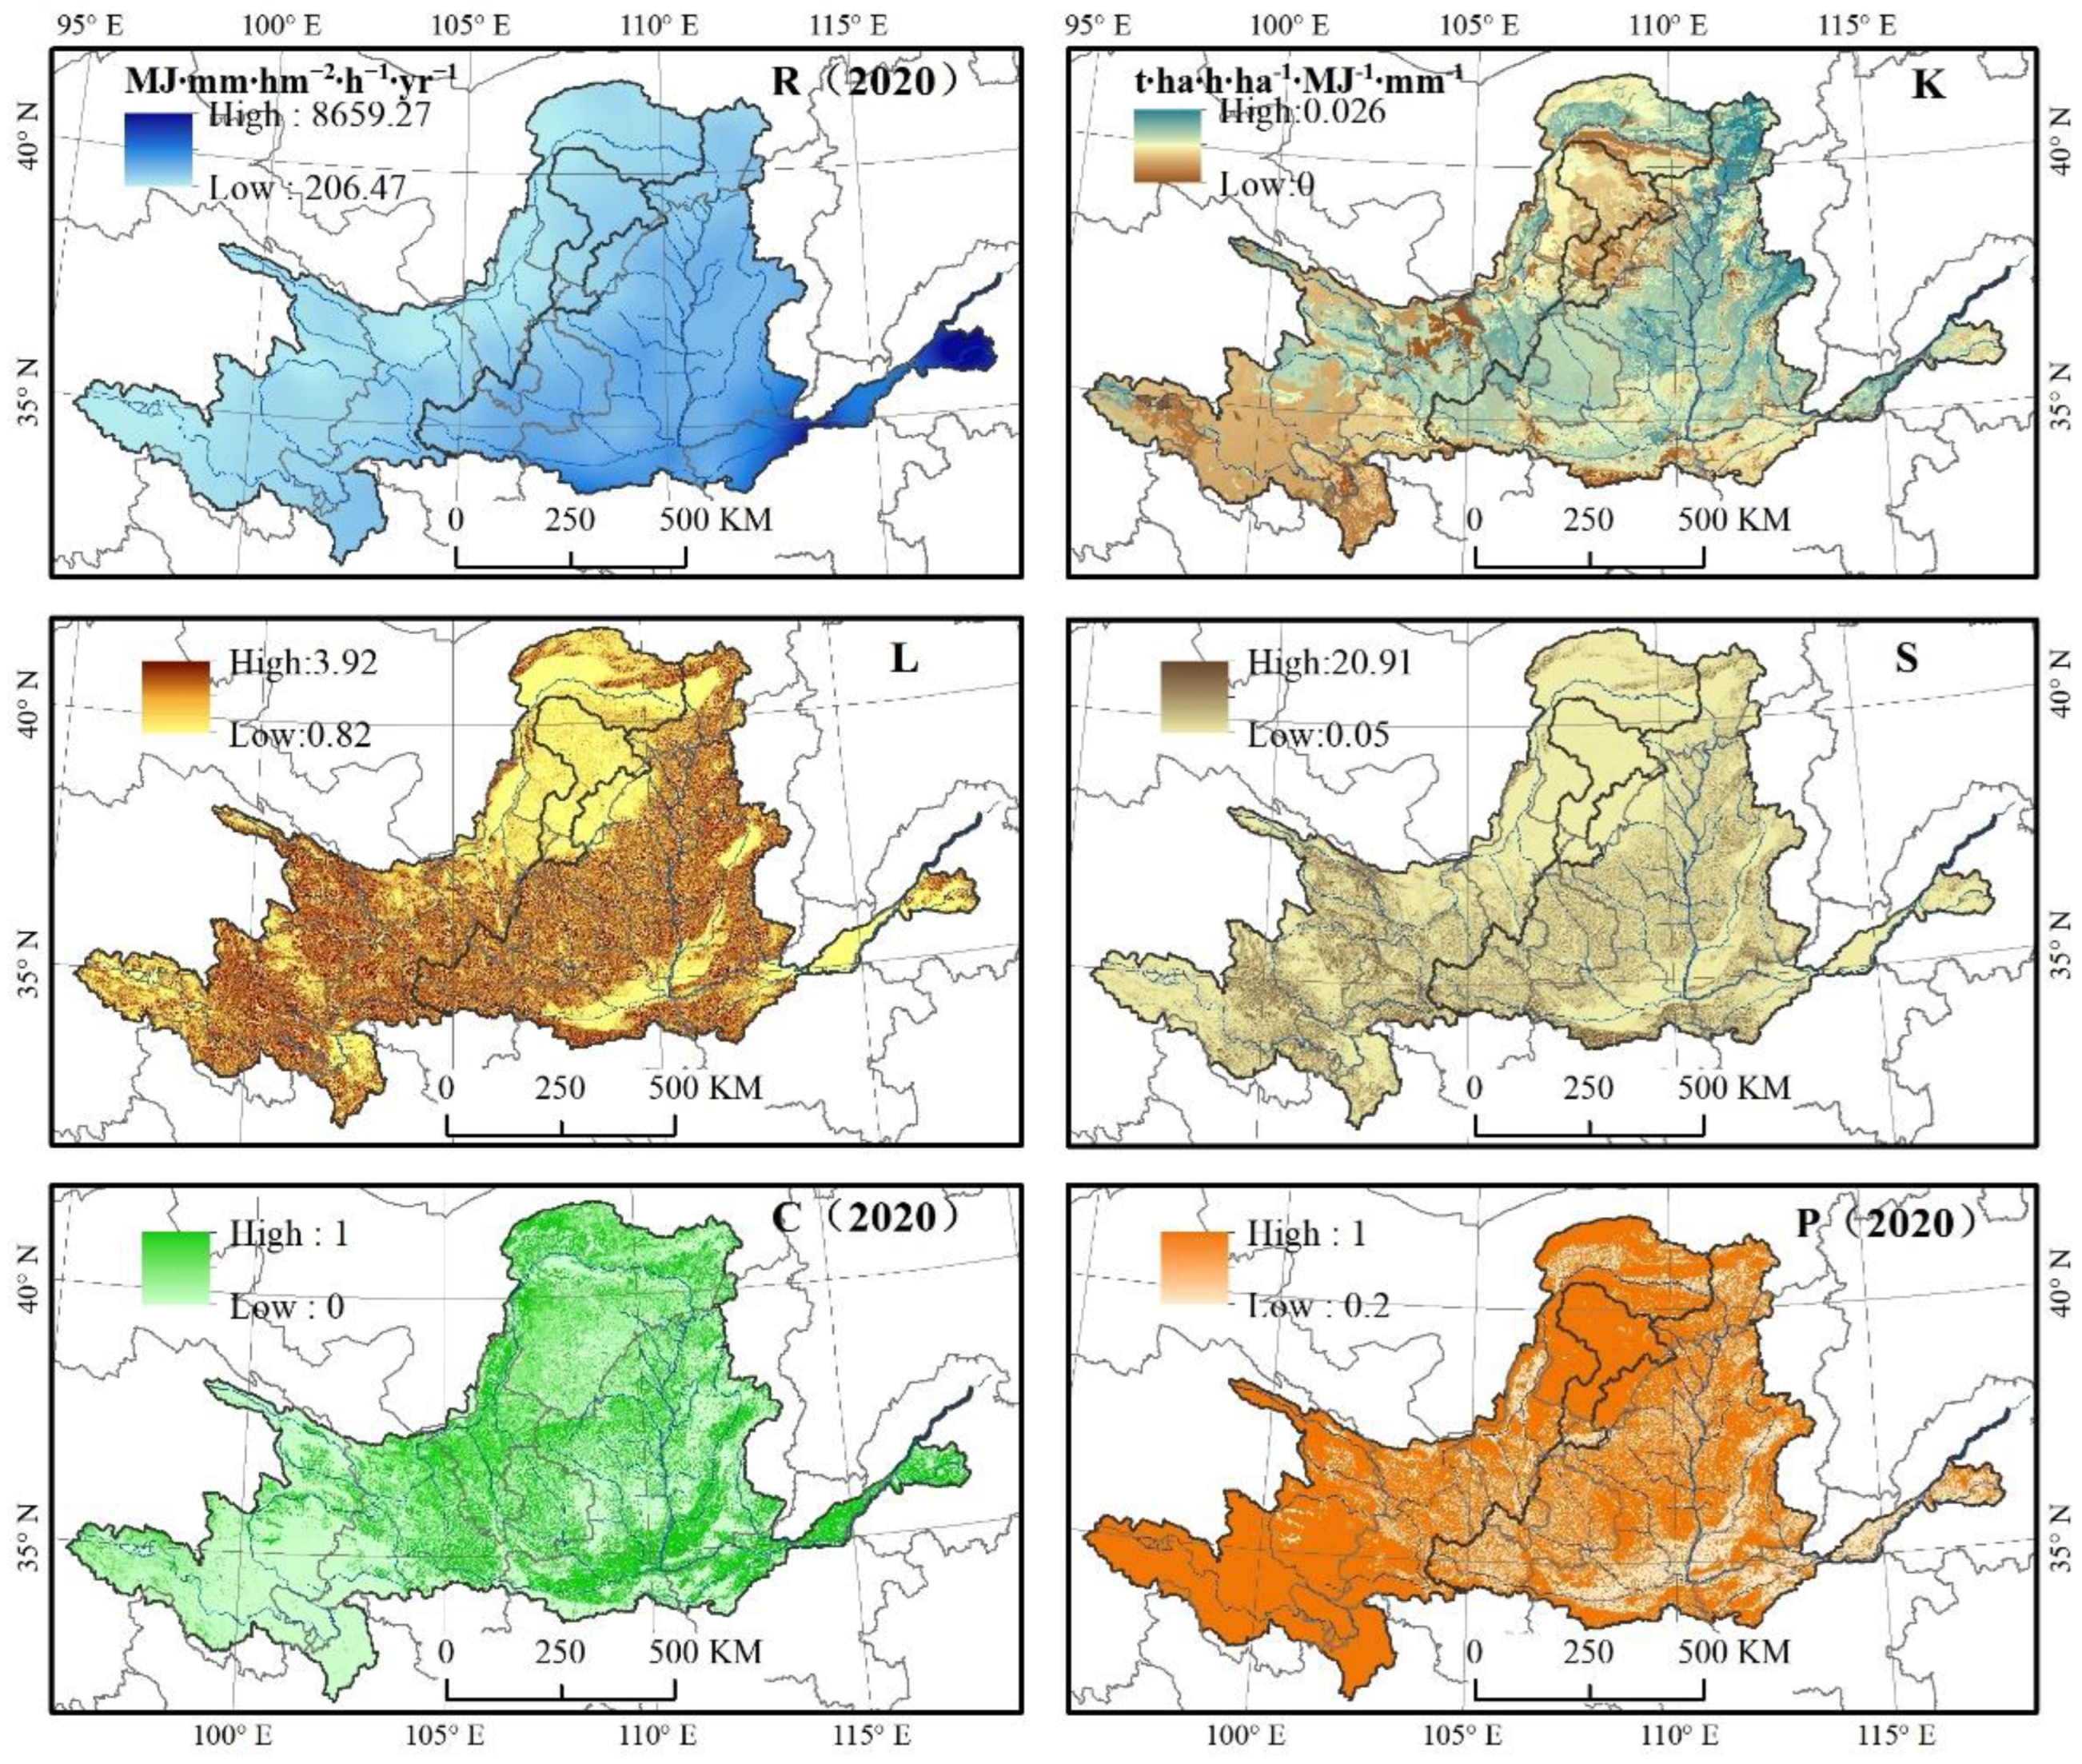
The spatial heterogeneity of factors that affect soil erosion (Figure 9) clearly showed higher rainfall erosivity coupled with the steep slope, broken terrain, and relatively poor vegetation coverage observed in the middle reach, resulting in the soil erosion in this region being significantly higher than that in other regions of China, and even in the world. From 1985 to 2020, the average annual soil erosion modulus was 1717.34 t∙km−2∙yr−1 in the middle reach, and this value is significantly greater than the values in several other regions around the world, such as 480 t∙km−2∙yr−1 in the Mississippi Basin [57].
The soil erosion was mostly affected by the R and C factors in the study area (rainfall and vegetation cover, respectively). To highlight the great impacts of the Grain for Green project, which has been implemented since 1999, on soil erosion, we divided the change trends observed (Figure 10) in the fractional vegetation coverage, rainfall erosivity, and soil erosion modulus into two periods (1985–2000 and 2000–2020). The results showed that vegetation coverage over the entire basin and in the upper and middle reaches has gradually increased, and that the increasing trend in the second period was greater than that in the first period. In contrast, vegetation coverage in the lower reach gradually decreased. In the second period, rainfall erosivity also showed an increasing trend, indicating that the climate in this region has changed in recent years.
Rainfall aggravates the occurrence of soil erosion by detaching soil particles [58,59] and reducing water infiltration into the soil [60]. In this study, the changes in rainfall-controlled soil erosion was 52.23%, and a positive correlation between rainfall and soil erosion was detected, implying the importance of rainfall on soil erosion in this region. Huo et al. reported that the quantity and type of rainfall significantly affects surface runoff and erosion [61]. Wang et al. reported that rainfall decreased by −0.88 mm/10 yr from 1950 to 2019 in the study area, while it has increased in the upper reach [62]. This fact can explain our finding that rainfall controlled most of the soil erosion changes in the upper reach (Figure 7). Rainfall types have received a great deal of attention regarding soil loss in recent years because of the increased frequency of extreme rainfall events. Short-duration and high-intensity precipitation has been considered an important reason for soil erosion [63] because of the powerful impact that raindrops have on the soil surface, damaging the soil structure [64]. Precipitation classified as “rainstorm” was the dominant rainfall type in the middle and upper reaches of the total basin [65]. Changing the micro-topography of sloping land is an effective way to decrease the soil loss caused by rainfall in the areas of this region in which erosion is controlled by rainfall. This can be achieved by implementing practices such as terracing, narrow terraces, and fish-scale pits.
Vegetation directly reduces soil loss by absorbing the impact of raindrops and thereby protecting the soil surface [66]. Additionally, the presence of vegetation combines the soil layer with the root system to reduce the runoff velocity and erosion capacity [67]. We found that soil erosion changes were controlled by vegetation in most areas of the middle reach (Figure 7). This result also confirmed the significant increase in vegetation coverage in recent decades in the middle reach. The operation of revegetation projects in this region has led to decreased soil loss accompanying increased vegetation coverage [68]. The benefits of these projects in reducing soil erosion have also led to improvements in ecosystem services, such as carbon sequestration and soil retention [69]. Ongoing revegetation projects in the future will be an effective measure for preventing soil erosion in this region. Several studies have reported that some revegetated areas, thanks to the development of vegetation coverage and regardless of topography and climate, exceeded the ecological carrying capacity threshold [70,71]. Therefore, the selection of vegetation types should consider not only the soil erosion but also the precipitation when restoring vegetation.
In this study, the land use changes determined using remote sensing image interpretation did not contribute greatly to soil erosion changes during the research period; this is because only small variations were detected among all the land use types (Table 4). This result appears to be inconsistent with the highly touted Grain for Green project that converted farmland into forest and grassland (i.e., land use changes). In reality, the contributions of the Grain for Green project to reducing soil erosion were the result of three factors. One factor was the increase in vegetation coverage that decreased the impact of raindrops. The second factor was the decrease in human activities from agricultural practices. The third factor was the strengthening of soil structure by plant roots. Therefore, the three factors controlling soil erosion identified in our research (vegetation, rainfall, and land use) were interrelated, and determining soil erosion prevention measures should comprehensively consider all three factors.

5. Conclusions

This research used the USLE, Mann–Kendall trend test and Sen’s slope estimator trend to analyze the changing trends and controlling factors of soil erosion in the Yellow River Basin from 1985 to 2020. We found that soil erosion in the Yellow River Basin, especially in the middle reach, decreased significantly during the study period. The identified controlling factors of soil erosion changes were mainly rainfall and vegetation coverage. Despite the fact that rainfall led to increased soil erosion over the entire region, the protection provided by vegetation coverage still substantially reduced soil erosion. These results prove the effectiveness of vegetation restoration projects in controlling soil erosion in the Yellow River Basin, especially in the middle reach. The methods and results of this study can provide a theoretical basis for the implementation of soil and water conservation practices in the Yellow River Basin and other regions.

Author Contributions

Conceptualization, J.G., L.Z. and J.Z.; methodology, J.G., J.S. and Y.Q.; software, J.G., J.S. and Y.T.; validation, J.G.; resources, J.G. and Y.Q.; data curation, J.G.; writing—original draft preparation, J.G.; writing—review and editing, J.G., Y.Q. and X.Y.; visualization, J.G.; funding acquisition, Y.Q. All authors have read and agreed to the published version of the manuscript.

Funding

The study was financially supported by the China National Science Fund Program (No. 42277310) and The Natural Science Basic Research Program of Shaanxi (No. 2022PT-28).

Institutional Review Board Statement

Not applicable.

Informed Consent Statement

Not applicable.

Data Availability Statement

The original contributions presented in the study are included in the article, further inquiries can be directed to the corresponding author.

Acknowledgments

Thank Researcher Baoyuan Liu for his sediment data of hydrological stations in the Yellow River Basin.

Conflicts of Interest

The authors declare that they have no known competing financial interests or personal relationships that could have influenced the work reported in this paper.

References

  1. Lal, R. Soil erosion and the global carbon budget. Environ. Int. 2003, 29, 437–450. [Google Scholar] [CrossRef]
  2. Pimentel, D.; Harvey, C.; Resosudarmo, P.; Sinclair, K.; Kurz, D.; McNair, M.; Crist, S.; Shpritz, L.; Fitton, L.; Saffouri, R.; et al. Environmental and Economic Costs of Soil Erosion and Conservation Benefits. Science 1995, 267, 1117–1123. [Google Scholar] [CrossRef]
  3. Lantican, M.A.; Guerra, L.C.; Bhuiyan, S.I. Impacts of soil erosion in the upper Manupali watershed on irrigated lowlands in the Philippines. Paddy Water Environ. 2003, 1, 19–26. [Google Scholar] [CrossRef]
  4. Marques, M.J.; Bienes, R.; Pérez-Rodríguez, R.; Jiménez, L. Soil degradation in central Spain due to sheet water erosion by low-intensity rainfall events. Earth Surf. Process. Landf. 2008, 33, 414–423. [Google Scholar] [CrossRef]
  5. Pimentel, D.; Kounang, N. Ecology of Soil Erosion in Ecosystems. Ecosystems 1998, 1, 416–426. [Google Scholar] [CrossRef]
  6. Lal, R.; Bruce, J.P. The potential of world cropland soils to sequester C and mitigate the greenhouse effect. Environ. Sci. Policy 1999, 2, 177–185. [Google Scholar] [CrossRef]
  7. Nearing, M.A.; Jetten, V.; Baffaut, C.; Cerdan, O.; Couturier, A.; Hernandez, M.; Le Bissonnais, Y.; Nichols, M.H.; Nunes, J.P.; Renschler, C.S.; et al. Modeling response of soil erosion and runoff to changes in precipitation and cover. Catena 2005, 61, 131–154. [Google Scholar] [CrossRef]
  8. Tang, Q.; Xu, Y.; Bennett, S.J.; Li, Y. Assessment of soil erosion using RUSLE and GIS: A case study of the Yangou watershed in the Loess Plateau, China. Environ. Earth Sci. 2015, 73, 1715–1724. [Google Scholar] [CrossRef]
  9. Jiang, C.; Zhang, H.; Zhang, Z.; Wang, D. Model-based assessment soil loss by wind and water erosion in China’s Loess Plateau: Dynamic change, conservation effectiveness, and strategies for sustainable restoration. Glob. Planet. Chang. 2019, 172, 396–413. [Google Scholar] [CrossRef]
  10. Ni, J.-R.; Li, X.-X.; Borthwick, A.G.L. Soil erosion assessment based on minimum polygons in the Yellow River basin, China. Geomorphology 2008, 93, 233–252. [Google Scholar] [CrossRef]
  11. Yao, W.; Ran, D.; Chen, J. Recent changes in runoff and sediment regimes and future projections in the Yellow River basin. Adv. Water Sci. 2013, 24, 607–616, (In Chinese with English abstract). [Google Scholar] [CrossRef]
  12. Liu, T.; Yuan, C. Study on soil erosion of the Yellow River Basin in Henan Province based on RUSLE model. J. N. China Univ. Water Resour. Electr. Power (Nat. Sci. Ed.) 2020, 41, 7–13, (In Chinese with English abstract). [Google Scholar] [CrossRef]
  13. Fu, B. Soil erosion and its control in the loess plateau of China. Soil Use Manag. 1989, 5, 76–82. [Google Scholar] [CrossRef]
  14. Ma, G. Records of the Yellow River Flood in 1958. Henan Leg. Dly. 2009, 15, 661–678. [Google Scholar]
  15. Hainan Daily. Yellow River Floods in History. 2007. Available online: https://news.sina.com.cn/c/2007-06-15/073912026626s.shtml (accessed on 10 February 2024).
  16. Chu, X.; Zhan, J.; Li, Z.; Zhang, F.; Qi, W. Assessment on Forest Carbon Sequestration in the Three-North Shelterbelt Program Region, China. J. Clean. Prod. 2019, 215, 382–389. [Google Scholar] [CrossRef]
  17. Chen, N.; Ma, T.; Zhang, X. Responses of soil erosion processes to land cover changes in the Loess Plateau of China: A case study on the Beiluo River basin. Catena 2016, 136, 118–127. [Google Scholar] [CrossRef]
  18. Yao, W. Development Opportunity and Sicentific Positioning of Soil and Water Conservation of the Yellow River in the New Era. Yellow River 2019, 41, 8446, (In Chinese with English abstract). [Google Scholar] [CrossRef]
  19. Zhang, W. A 40 years governance model for the construction of the Three North Shelterbelt System. In Green Monument; China Forestry Press: Beijing, China, 2018; (In Chinese with English abstract). [Google Scholar]
  20. Chen, C.; Park, T.; Wang, X.; Piao, S.; Xu, B.; Chaturvedi, R.K.; Fuchs, R.; Brovkin, V.; Ciais, P.; Fensholt, R.; et al. China and India lead in greening of the world through land-use management. Nat. Sustain. 2019, 2, 122–129. [Google Scholar] [CrossRef]
  21. Yao, Y.; Wang, Y.; Li, Y.; Zhang, X. Climate Warming and Drying and Its Environmental Effects in The Loess Plateau. Resour. Sci. 2005, 05, 146–152. [Google Scholar]
  22. Zhao, G.; Mu, X.; Wen, Z.; Wang, F.; Gao, P. Soil Erosion, Conservation, and Eco-Environment Changes in the Loess Plateau of china. Land Degrad. Dev. 2013, 24, 499–510. [Google Scholar] [CrossRef]
  23. Zhang, X.C.; Liu, W.Z. Simulating potential response of hydrology, soil erosion, and crop productivity to climate change in Changwu tableland region on the Loess Plateau of China. Agric. For. Meteorol. 2005, 131, 127–142. [Google Scholar] [CrossRef]
  24. Li, Z.; Liu, W.; Zhang, X.; Zheng, F. Response of Slope Erosion to Global Climate Change on the Loess Tableland. Bull. Soil Water Conserv. 2010, 30, 1–6, (In Chinese with English abstract). [Google Scholar] [CrossRef]
  25. Wang, S.; Zhao, G.; Wang, M. Characteristics of Climate Change in the Yellow River Basin from 1961 to 2020. Meteorol. Environ. Sci. 2021, 44, 1–8, (In Chinese with English abstract). [Google Scholar] [CrossRef]
  26. Foster, G.R.; Meyer, L.D. Transport of particles by shallow flow. Trans. Am. Soc. Agric. Eng. 1972, 19, 99–102. [Google Scholar]
  27. Renard, K.G.; Foster, G.R.; Weesies, G.A.; McCool, D.K.; Yoder, D.C. Predicting Soil Erosion by Water: A Guide to Conservation Planning with the Revised Universal Soil Loss Equation (RUSLE); Agricultural Handbook No. 703; USDA: Washington, DC, USA, 1997; p. 404. [Google Scholar]
  28. Williams, J.R.; Neitsch, S.L.; Arnold, J.G. Soil and Water Assessment Tool-User’s Manual; Black and Research Center, Texas Agricultural Experiment Station: College Station, TX, USA, 1999. [Google Scholar]
  29. Wischmeier, W.H.; Smith, D.D. Predicting Rainfall Erosion Losses from Cropland East of the Rocky Mountains; Agric. Handbook. No. 282; USDA: Washington, DC, USA, 1965. [Google Scholar]
  30. Zhu, M.; He, W.; Zhang, Q.; Xiong, Y.; Tan, S.; He, H. Spatial and Temporal Characteristics of Soil Conservation Service in the Area of the Upper and Middle of the Yellow River, China. Heliyon 2019, 5, e02985. [Google Scholar] [CrossRef]
  31. Makhdumi, W.; Shwetha, H.R.; Dwarakish, G.S. Soil Erosion in Diverse Agroecological Regions of India: A Comprehensive Review of Usle-Based Modelling. Environ. Monit. Assess. 2023, 195, 1112. [Google Scholar] [CrossRef]
  32. Wondrade, N. Integrated Use of Gis, Rs and Usle Model for Lulc Change Analysis and Soil Erosion Risk Mapping in the Lake Hawassa Watershed, Southern Ethiopia. Geocarto Int. 2023, 38, 2210106. [Google Scholar] [CrossRef]
  33. Tian, P.; Tian, X.; Geng, R.; Zhao, G.; Yang, L.; Mu, X.; Gao, P.; Sun, W.; Liu, Y. Response of Soil Erosion to Vegetation Restoration and Terracing on the Loess Plateau. Catena 2023, 227, 107103. [Google Scholar] [CrossRef]
  34. Schnitzer, S.; Seitz, F.; Eicker, A.; Güntner, A.; Wattenbach, M.; Menzel, A. Estimation of Soil Loss by Water Erosion in the Chinese Loess Plateau Using Universal Soil Loss Equation and Grace. Geophys. J. Int. 2013, 193, 1283–1290. [Google Scholar] [CrossRef]
  35. Ouyang, W.; Hao, F.; Skidmore, A.K.; Toxopeus, A.G. Soil erosion and sediment yield and their relationships with vegetation cover in upper stream of the Yellow River. Sci. Total Environ. 2010, 409, 396–403. [Google Scholar] [CrossRef]
  36. Sun, W.; Shao, Q.; Liu, J.; Zhai, J. Assessing the effects of land use and topography on soil erosion on the Loess Plateau in China. Catena 2014, 121, 151–163. [Google Scholar] [CrossRef]
  37. Zhang, X.; She, D.; Hou, M.; Wang, G.; Liu, Y. Understanding the influencing factors (precipitation variation, land use changes and check dams) and mechanisms controlling changes in the sediment load of a typical Loess watershed, China. Ecol. Eng. 2021, 163, 106198. [Google Scholar] [CrossRef]
  38. Wang, Y.; Niu, F.; Wu, Q.; Gao, Z. Assessing soil erosion and control factors by radiometric technique in the source region of the Yellow River, Tibetan Plateau. Quat. Res. 2014, 81, 538–544. [Google Scholar] [CrossRef]
  39. Xiao; Yang; Guo, B.; Lu, Y.; Zhang, R.; Zhang, D.; Zhen, X.; Chen, S.; Wu, H.; Wei, C.; et al. Spatial–temporal evolution patterns of soil erosion in the Yellow River Basin from 1990 to 2015: Impacts of natural factors and land use change. Geomat. Nat. Hazards Risk 2021, 12, 103–122. [Google Scholar] [CrossRef]
  40. Liu, B.; Guo, S.; Li, Z.; Xie, Y.; Zhang, K. Sampling Survey of Water Erosion in China. Soil And Water Conservation In China. Int. Soil Water Conserv. Res. 2013, 10, 26–34, (In Chinese with English abstract). [Google Scholar] [CrossRef]
  41. Wischmeier, W.H. Predicting Rainfall Erosion Losses: A Guide to Conservation Planning; United States Department of Agriculture, Science and Education Administration: Washington DC, USA, 1978; Volume 58, p. 26. [Google Scholar]
  42. Liu, B.Y.; Nearing, M.; Risse, L. Slope Gradient Effects on Soil Loss for Steep Slopes. Trans. ASAE 1994, 37, 1835–1840. [Google Scholar] [CrossRef]
  43. Zhang, H.; Yang, Q.; Liu, Q.; Guo, W.; Wang, C. Regional Slope Length and Slope Steepness Factor Extraction Algorithm Based on GIS. Comput. Eng. 2010, 36, 246–248, (In Chinese with English abstract). [Google Scholar]
  44. Jiang, Z.; Wang, Z.; Liu, Z. Quantitative Study on Spatial Variation of Soil Erosion in a Small Watershed in the Loess Hilly Region. J. Soil Eros. Soil Conserv. 1996, 1, 6308–6320, (In Chinese with English abstract). [Google Scholar] [CrossRef]
  45. Chen, H. Spatial and Temporal Changes of Soil Erosion and Its Driving Factors before and after the “Grain for Green” Project in the Loess Plateau. Ph. D. Thesis, Institute of Soil and Water Conservation, Northwest A&F University, Xianyang, China, 2019. [Google Scholar]
  46. Liu, B.; Xie, Y.; Li, Z.; Liang, Y.; Zhang, W.; Fu, S.; Guo, Q. The assessment of soil loss by water erosion in China. Int. Soil Water Conserv. Res. 2020, 8, 430–439. [Google Scholar] [CrossRef]
  47. Fu, B.J.; Zhao, W.W.; Chen, L.D.; Zhang, Q.J.; Lü, Y.H.; Gulinck, H.; Poesen, J. Assessment of soil erosion at large watershed scale using RUSLE and GIS: A case study in the Loess Plateau of China. Land Degrad. Dev. 2005, 16, 73–85. [Google Scholar] [CrossRef]
  48. Fu, B.; Liu, Y.; Lü, Y.; He, C.; Zeng, Y.; Wu, B. Assessing the soil erosion control service of ecosystems change in the Loess Plateau of China. Ecol. Complex. 2011, 8, 284–293. [Google Scholar] [CrossRef]
  49. Lufafa, A.; Tenywa, M.M.; Isabirye, M.; Majaliwa, M.J.G.; Woomer, P.L. Prediction of soil erosion in a Lake Victoria basin catchment using a GIS-based Universal Soil Loss model. Agric. Syst. 2003, 76, 883–894. [Google Scholar] [CrossRef]
  50. Ministry of Water Resources of the People’s Republic of China. SL190-2007; Soil Erosion Classification and Grading Standards. China Water Resources and Hydropower Press: Beijing, China, 2008; pp. 3–12. [Google Scholar]
  51. Mann, H.B. Non-parametric test against trend. Econometrika 1945, 13, 163–171. [Google Scholar] [CrossRef]
  52. Kendall, M.G. Rank Correlation Methods; Charles Griffin: London, UK, 1975; p. 202. [Google Scholar]
  53. Sen, P.K. Estimates of the Regression Coefficient Based on Kendall’s Tau. J. Am. Stat. Assoc. 1968, 63, 1379–1389. [Google Scholar] [CrossRef]
  54. Chappell, A.; Baldock, J.; Sanderman, J. The global significance of omitting soil erosion from soil organic carbon cycling schemes. Nat. Clim. Chang. 2016, 6, 187–191. [Google Scholar] [CrossRef]
  55. Ludwig, B.; Boiffin, J.; Chadoeuf, J.; Auzet, A.-V. Hydrological structure and erosion damage caused by concentrated flow in cultivated catchments. Catena 1995, 25, 227–252. [Google Scholar] [CrossRef]
  56. Wang, G.; Zhong, D.; Wu, B. Future trend of Yellow River sediment changes. China Water Resour. 2020, 01, 9–12+32, (In Chinese with English abstract). [Google Scholar]
  57. Smith, S.V.; Sleezer, R.O.; Renwick, W.H.; Buddemeier, R.W. Fates of Eroded Soil Organic Carbon: Mississippi Basin Case Study. Ecol. Appl. 2005, 15, 1929–1940. [Google Scholar] [CrossRef]
  58. Jomaa, S.; Barry, D.A.; Brovelli, A.; Heng, B.C.P.; Sander, G.C.; Parlange, J.Y.; Rose, C.W. Rain splash soil erosion estimation in the presence of rock fragments. Catena 2012, 92, 38–48. [Google Scholar] [CrossRef]
  59. Ryzak, M.; Bieganowski, A.; Polakowski, C. Effect of soil moisture content on the splash phenomenon reproducibility. PLoS ONE 2015, 10, e0119269. [Google Scholar] [CrossRef]
  60. Fernández-Raga, M.; Palencia, C.; Keesstra, S.; Jordán, A.; Fraile, R.; Angulo-Martínez, M.; Cerdà, A. Splash erosion: A review with unanswered questions. Earth-Sci. Rev. 2017, 171, 463–477. [Google Scholar] [CrossRef]
  61. Huo, J.; Yu, X.; Liu, C.; Chen, L.; Zheng, W.; Yang, Y.; Tang, Z. Effects of soil and water conservation management and rainfall types on runoff and soil loss for a sloping area in North China. Land Degrad. Dev. 2020, 31, 2117–2130. [Google Scholar] [CrossRef]
  62. Wang, J.; Shi, B.; Bai, T.; Yuan, Q. Spatio-temporal patterns of precipitation and its possible driving factors in the Yellow River Basin. J. Desert Res. 2022, 6, 94–102, (In Chinese with English abstract). [Google Scholar]
  63. Ziadat, F.M.; Taimeh, A.Y. Effect of Rainfall Intensity, Slope, Land Use and Antecedent Soil Moisture on Soil Erosion in an Arid Environment. Land Degrad. Dev. 2013, 24, 582–590. [Google Scholar] [CrossRef]
  64. Wang, B.; Steiner, J.; Zheng, F.; Gowda, P. Impact of rainfall pattern on interrill erosion process. Earth Surf. Process. Landf. 2017, 42, 1833–1846. [Google Scholar] [CrossRef]
  65. Xu, Z.; Zhang, S.; Yang, X. Water and sediment yield response to extreme rainfall events in a complex large river basin: A case study of the Yellow River Basin, China. J. Hydrol. 2021, 597, 126183. [Google Scholar] [CrossRef]
  66. Díaz-Raviña, M.; Martín, A.; Barreiro, A.; Lombao, A.; Iglesias, L.; Díaz-Fierros, F.; Carballas, T. Mulching and seeding treatments for post-fire soil stabilisation in NW Spain: Short-term effects and effectiveness. Geoderma 2012, 191, 31–39. [Google Scholar] [CrossRef]
  67. Goldman, S.J.; Jackson, K.; Bursztynsky, T.A. Erosion and Sediment Control Handbook; McGraw Hill Book Company: New York, NY, USA, 1986. [Google Scholar]
  68. Wen, X.; Zhen, L. Soil erosion control practices in the Chinese Loess Plateau: A systematic review. Environ. Dev. 2020, 34, 100493. [Google Scholar] [CrossRef]
  69. Yang, Q.; Liu, G.; Agostinho, F.; Giannetti, B.F.; Yang, Z. Assessment of ecological restoration projects under water limits: Finding a balance between nature and human needs. J. Environ. Manag. 2022, 311, 114849. [Google Scholar] [CrossRef]
  70. Liang, W.; Fu, B.; Wang, S.; Zhang, W.; Jin, Z.; Feng, X.; Yan, J.; Liu, Y.; Zhou, S. Quantification of the ecosystem carrying capacity on China’s Loess Plateau. Ecol. Indic. 2019, 101, 192–202. [Google Scholar] [CrossRef]
  71. Zhao, H.; He, H.; Wang, J.; Bai, C.; Zhang, C. Vegetation Restoration and Its Environmental Effects on the Loess Plateau. Sustainability 2018, 10, 4676. [Google Scholar] [CrossRef]
Figure 1. Geographical characteristics of the Yellow River Basin region.
Land 13 00344 g001
Figure 2. Average soil erosion intensity in the Yellow River Basin region from 1985 to 2020.
Land 13 00344 g002
Figure 3. Soil erosion intensity in the Yellow River Basin region from 1985 to 2020.
Land 13 00344 g003
Figure 4. Characteristics of soil erosion changes in the Yellow River Basin region (1985–2020): (a) Spatial distribution of soil erosion change rates; (b) Spatial distribution of significance of soil erosion changes; (c) Change trends of soil erosion modulus in different regions.
Land 13 00344 g004
Figure 5. Comparisons of area percentages for six different erosion grades in the Yellow River Basin from 1985 to 2020.
Land 13 00344 g005
Figure 6. Spatial–temporal change trends (13) and the significance of the changes (46) for R, C, and P factors in the USLE.
Land 13 00344 g006
Figure 7. Spatial distribution of the factors controlling changes in soil erosion in the Yellow River Basin region (1985–2020).
Land 13 00344 g007
Figure 8. Relationship between observed sediment and simulated erosion modulus.
Land 13 00344 g008
Figure 9. Spatial distribution of factors in the USLE that control soil erosion (2020).
Land 13 00344 g009
Figure 10. Change trends for fractional vegetation coverage (FVC), rainfall erosivity (R), and soil erosion modulus in the Yellow River Basin (1985–2020).
Land 13 00344 g010
Table 1. Years of daily precipitation and Landsat-FVC data for different research periods.
Research PeriodDaily Precipitation DataLandsat-FVC
TimeSatellite TypeTemporal
Resolution
19851983–19871986–1990Landsat-58 days
19901988–19921988–1992Landsat-5
19951993–19971993–1997Landsat-5
20001998–20021998–2002Landsat-5, Landsat-7
20052003–20072003–2007Landsat-5, Landsat-7
20102008–20122008–2012Landsat-5, Landsat-7
20152013–20172013–2017Landsat-8
20202018–20222018–2022Landsat-8
Table 2. Assignment table of C factors.
Land UseC
Farmland1
Water0
Construction land0
Other land useBare land is 1, other land use is 0
Table 3. Area and proportion of total Yellow River Basin area for six grades of soil erosion intensity averaged from 1985 to 2020.
Erosion IntensityArea (104 km2)Erosion Modulus (t∙km−2∙yr−1)Proportion of Area (%)
Slight erosion56.15182.1070.63
Mild erosion11.611625.0114.60
Moderate erosion7.103530.548.93
Intensive erosion2.916232.953.66
Extreme intensive erosion1.5010,307.121.89
Severe erosion0.2319,419.980.29
Total79.501160.97100
Table 4. Area of land use types in the Yellow River Basin region from 1985 to 2020 (104 km2).
YearFarmlandForestGrasslandWaterResidential AreaUnused Land
198520.9510.3638.201.461.586.95
199021.0210.3738.131.381.616.99
199521.039.8039.221.251.656.55
200021.2110.3637.961.331.756.89
200520.7810.6137.801.361.887.07
201020.5510.6538.351.342.346.27
201520.4710.6338.291.352.526.24
202019.9710.6938.471.422.856.10
Disclaimer/Publisher’s Note: The statements, opinions and data contained in all publications are solely those of the individual author(s) and contributor(s) and not of MDPI and/or the editor(s). MDPI and/or the editor(s) disclaim responsibility for any injury to people or property resulting from any ideas, methods, instructions or products referred to in the content.