
Identifying and Mapping the Spatial Factors That Control Soil Erosion Changes in the Yellow River Basin of China


Abstract
:1. Introduction
2. Materials and Methods
2.1. Study Area
2.2. Data Collection and Pre-Processing
2.3. Methods
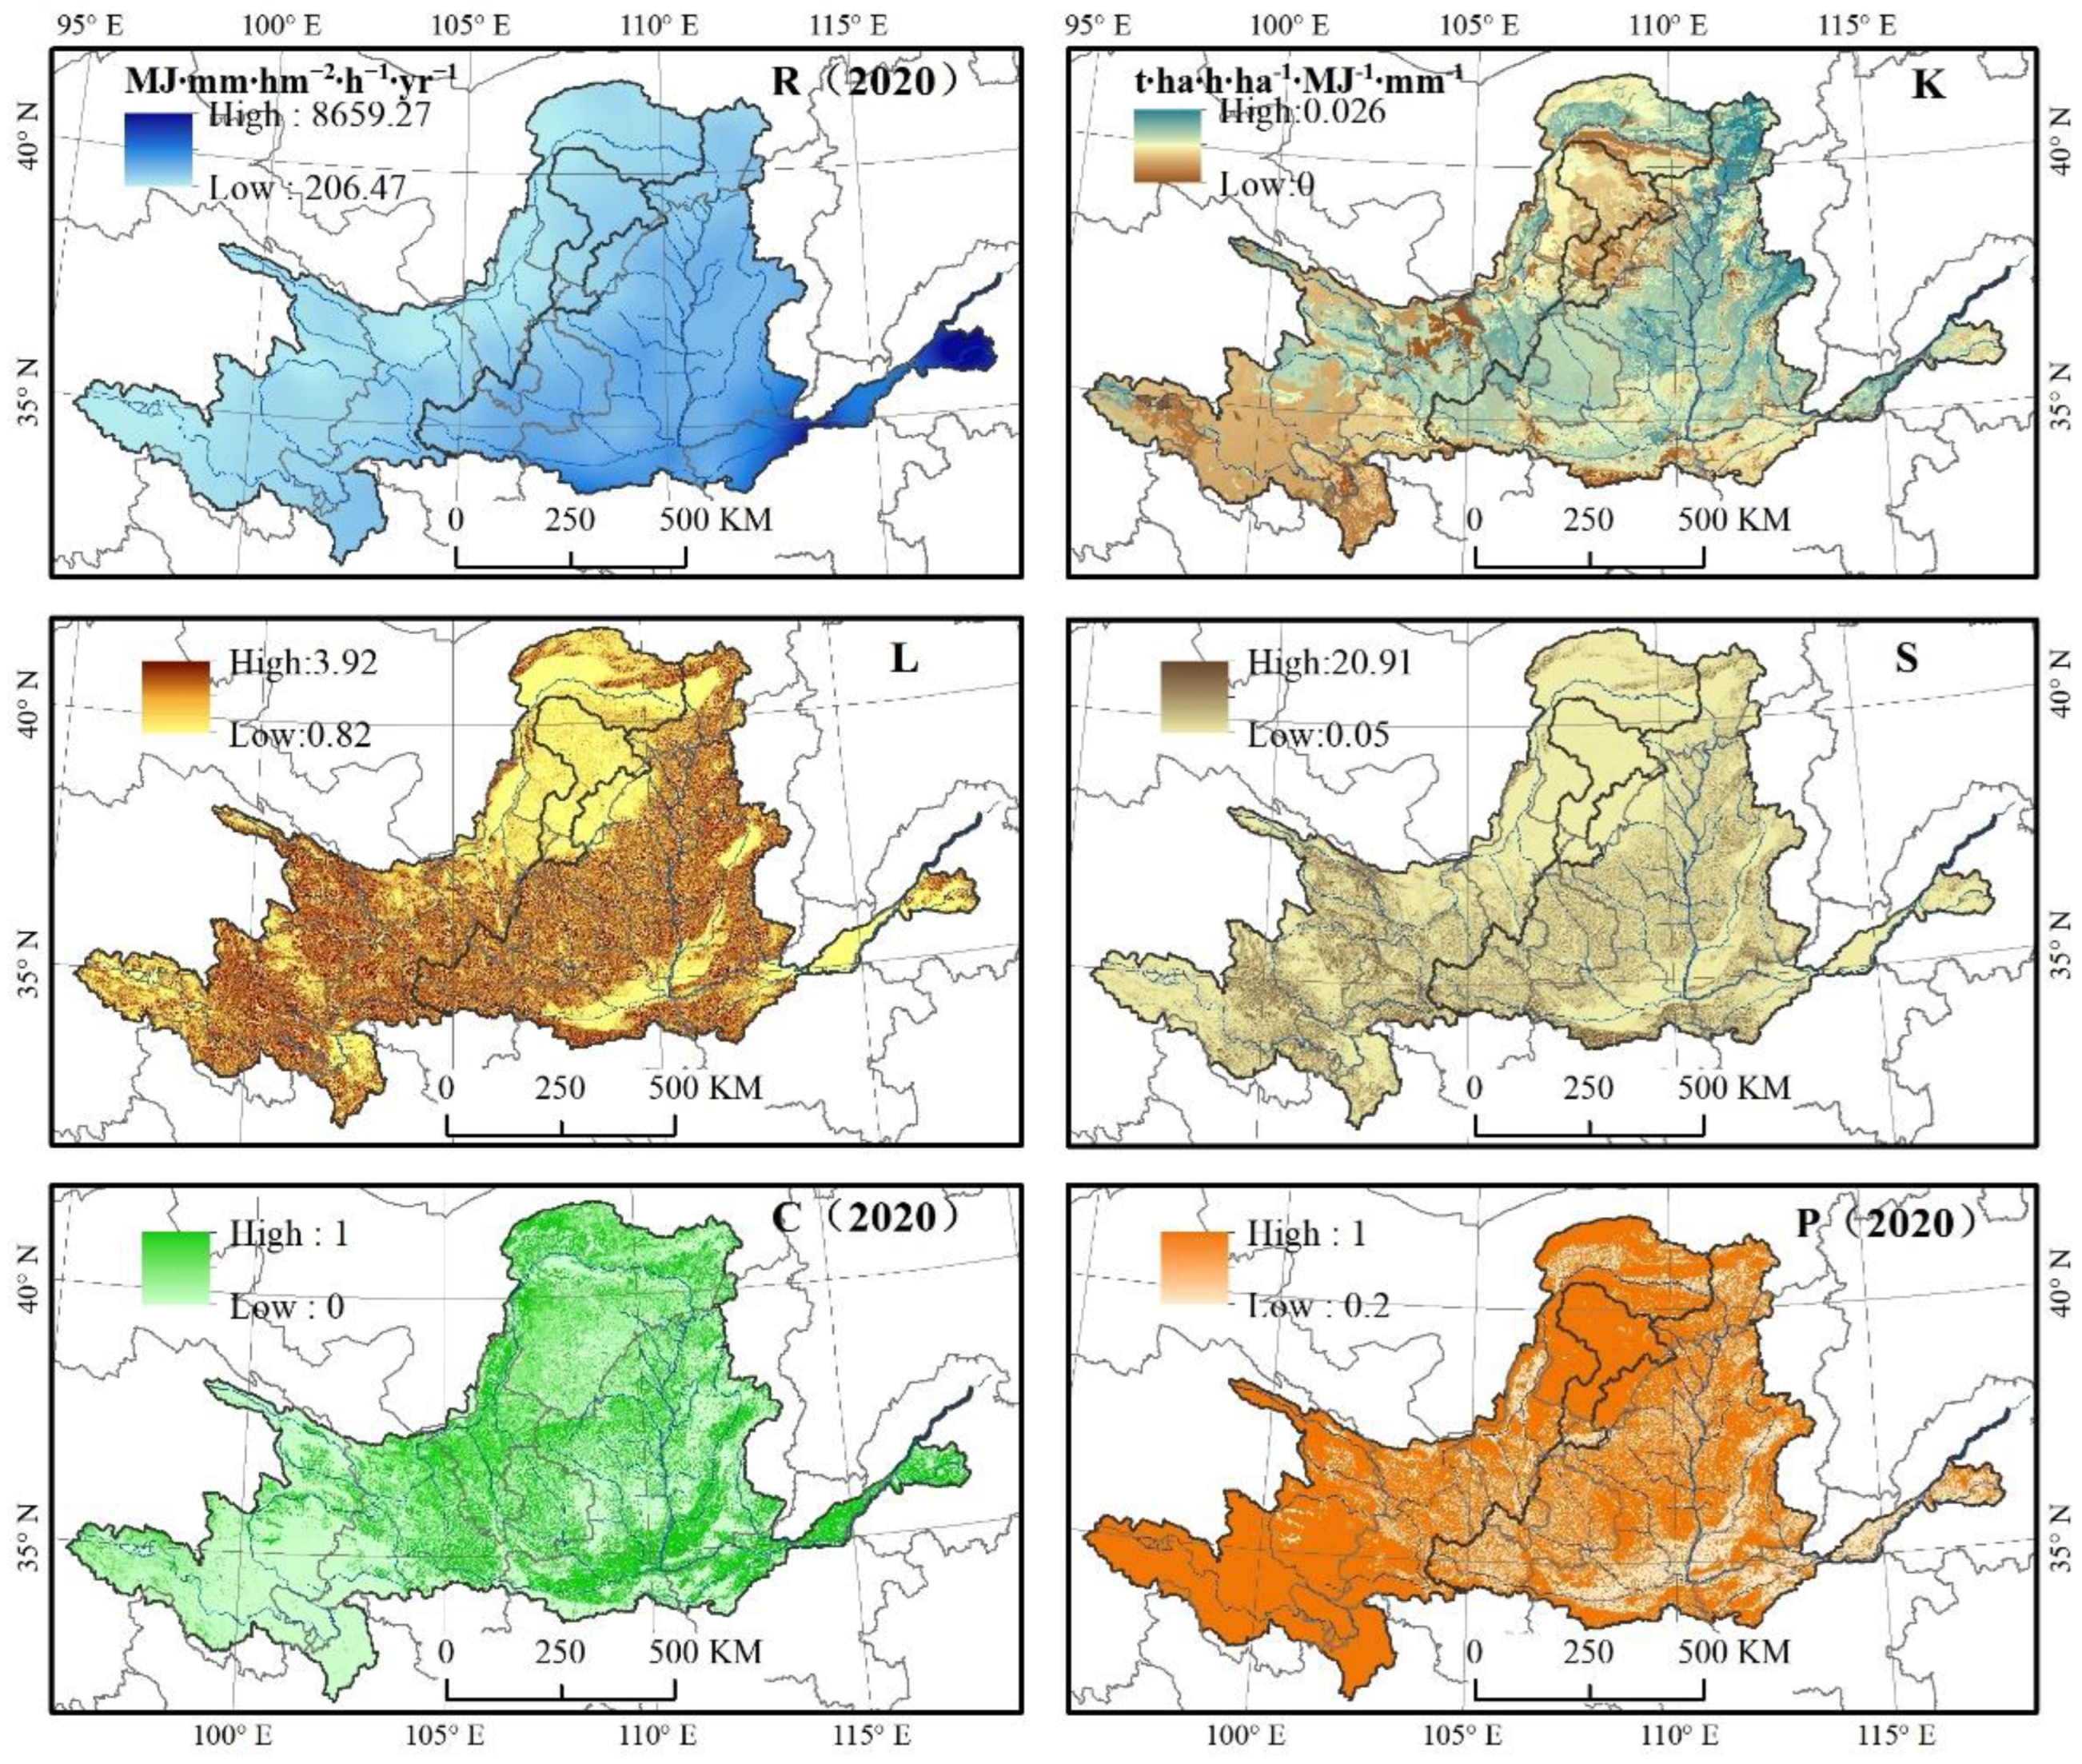
2.3.1. USLE
2.3.2. Identifying Spatial Pattern of Soil Erosion Temporal Change Trend and Its Controlling Factors
3. Results
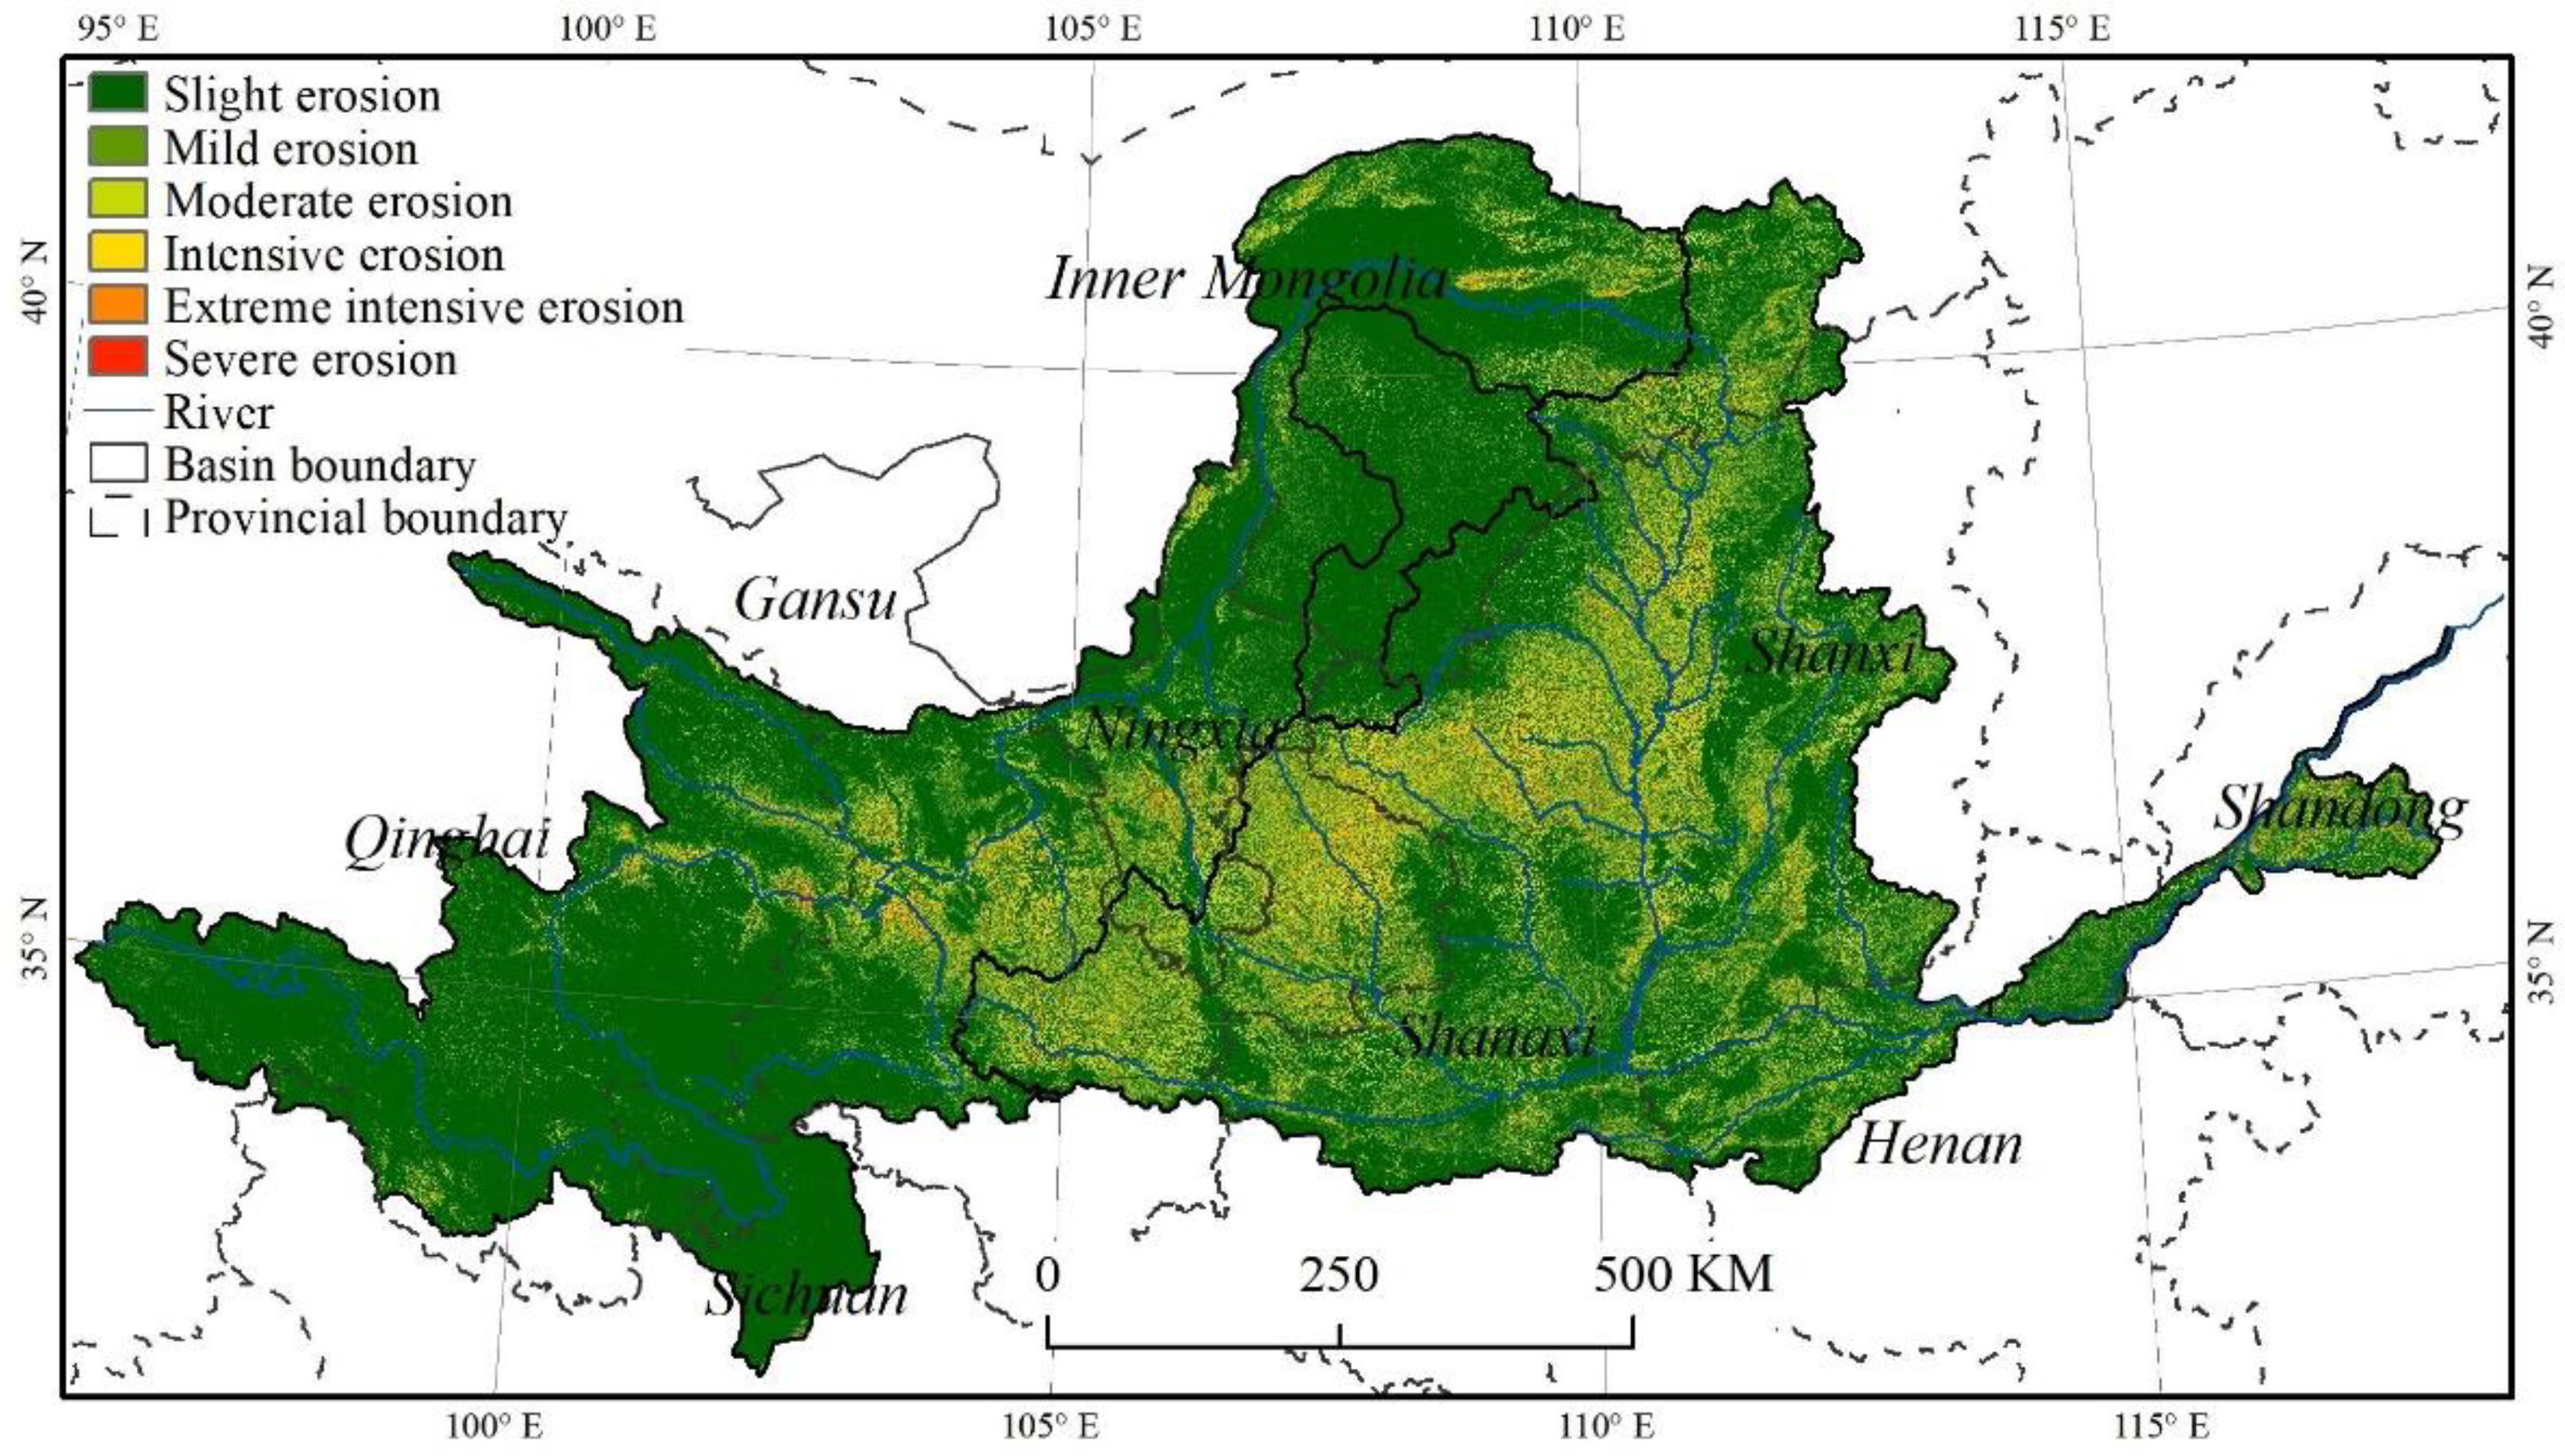
3.1. Spatial Distribution of Soil Erosion in the Yellow River Basin
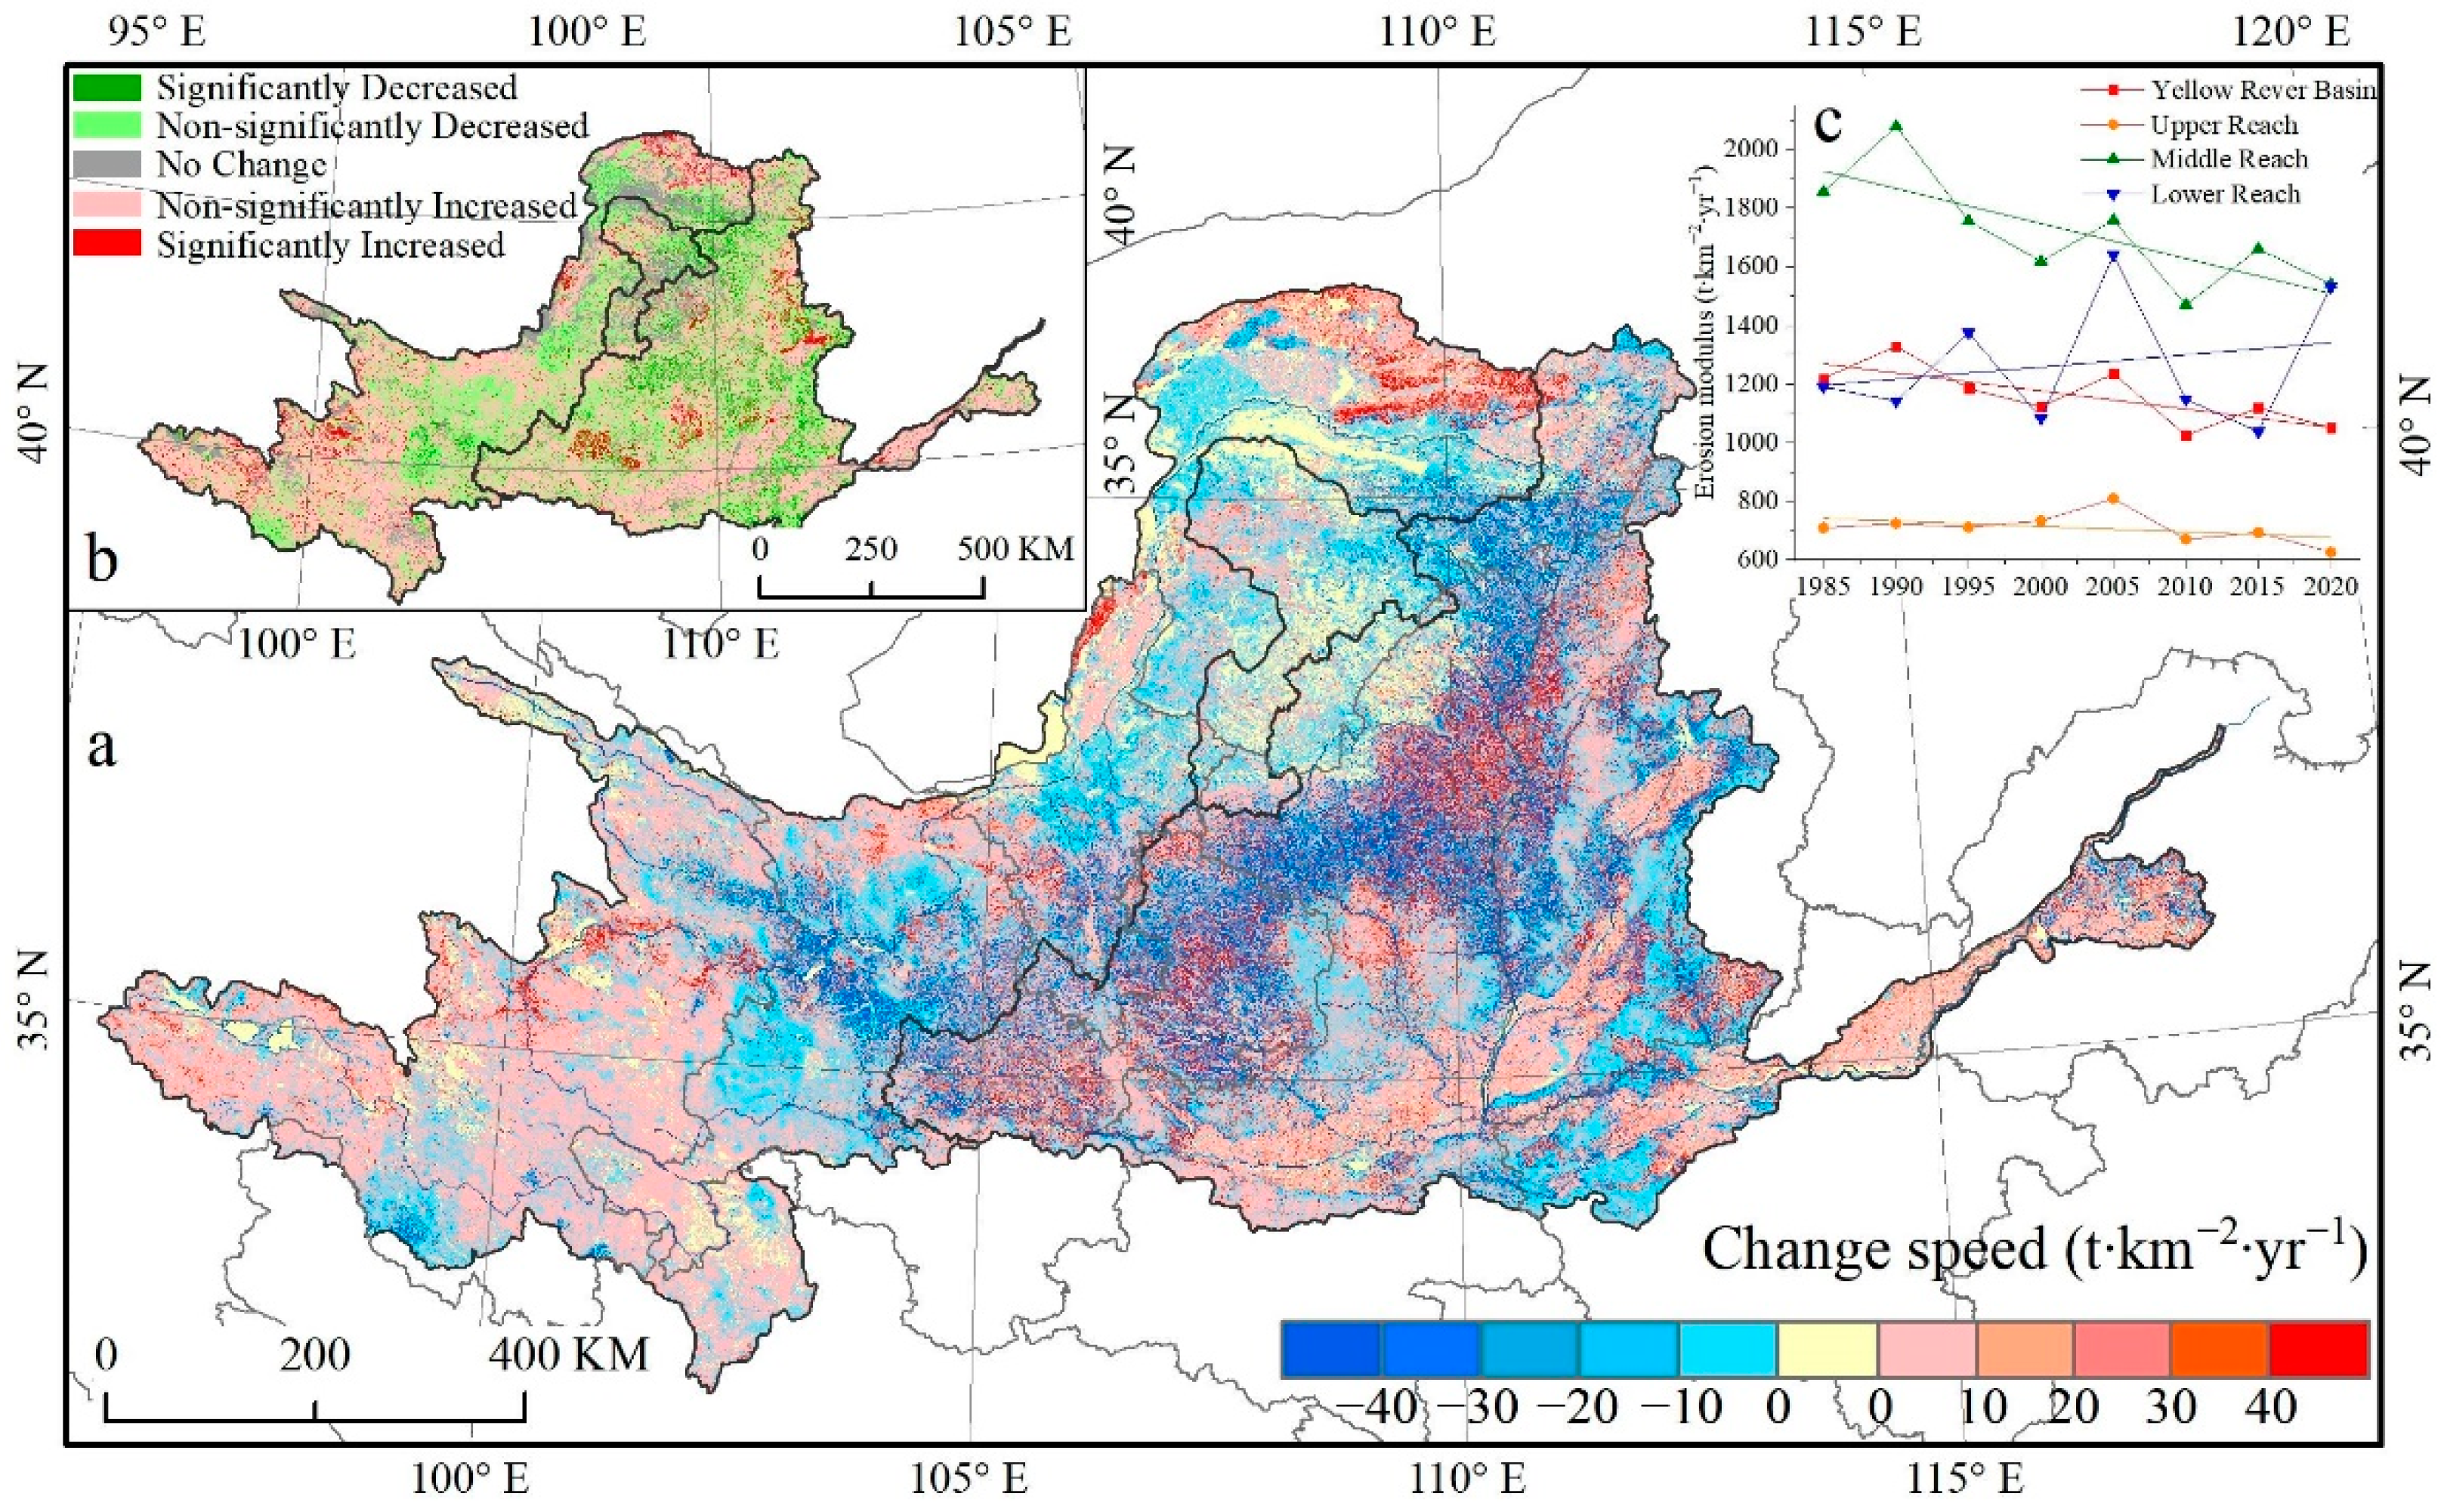
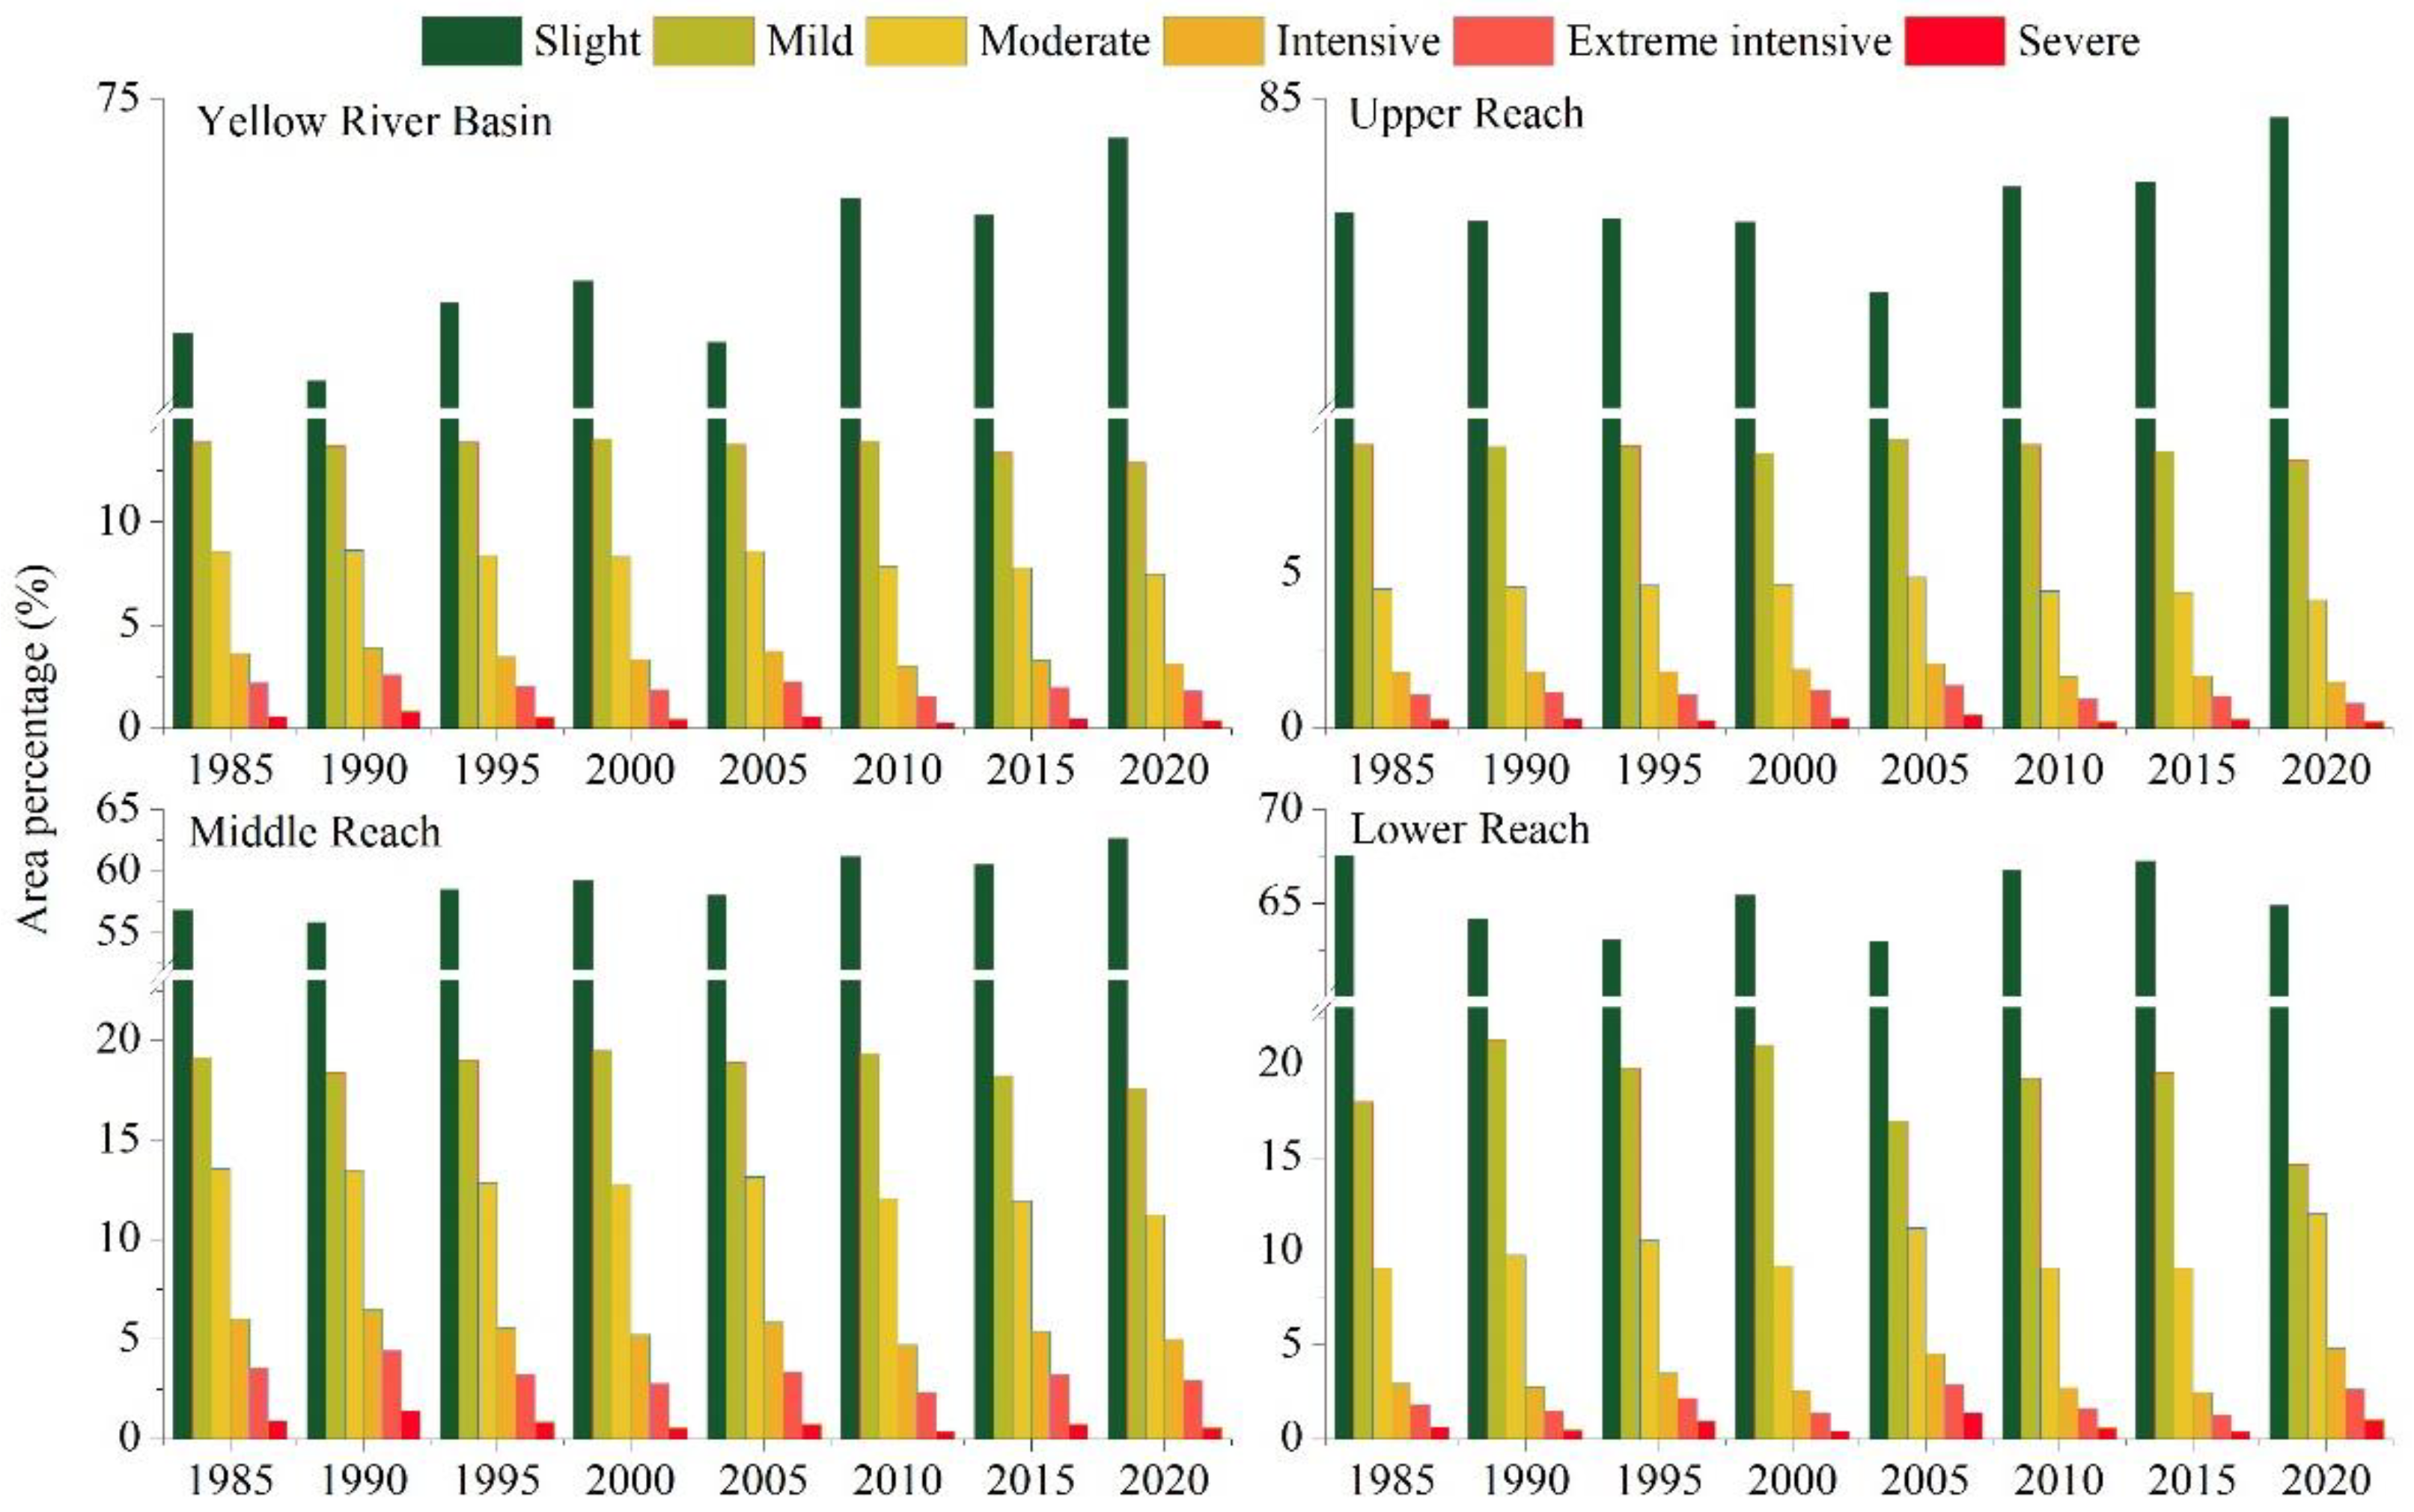
3.2. Temporal and Spatial Variation Characteristics of Soil Erosion in the Yellow River Basin
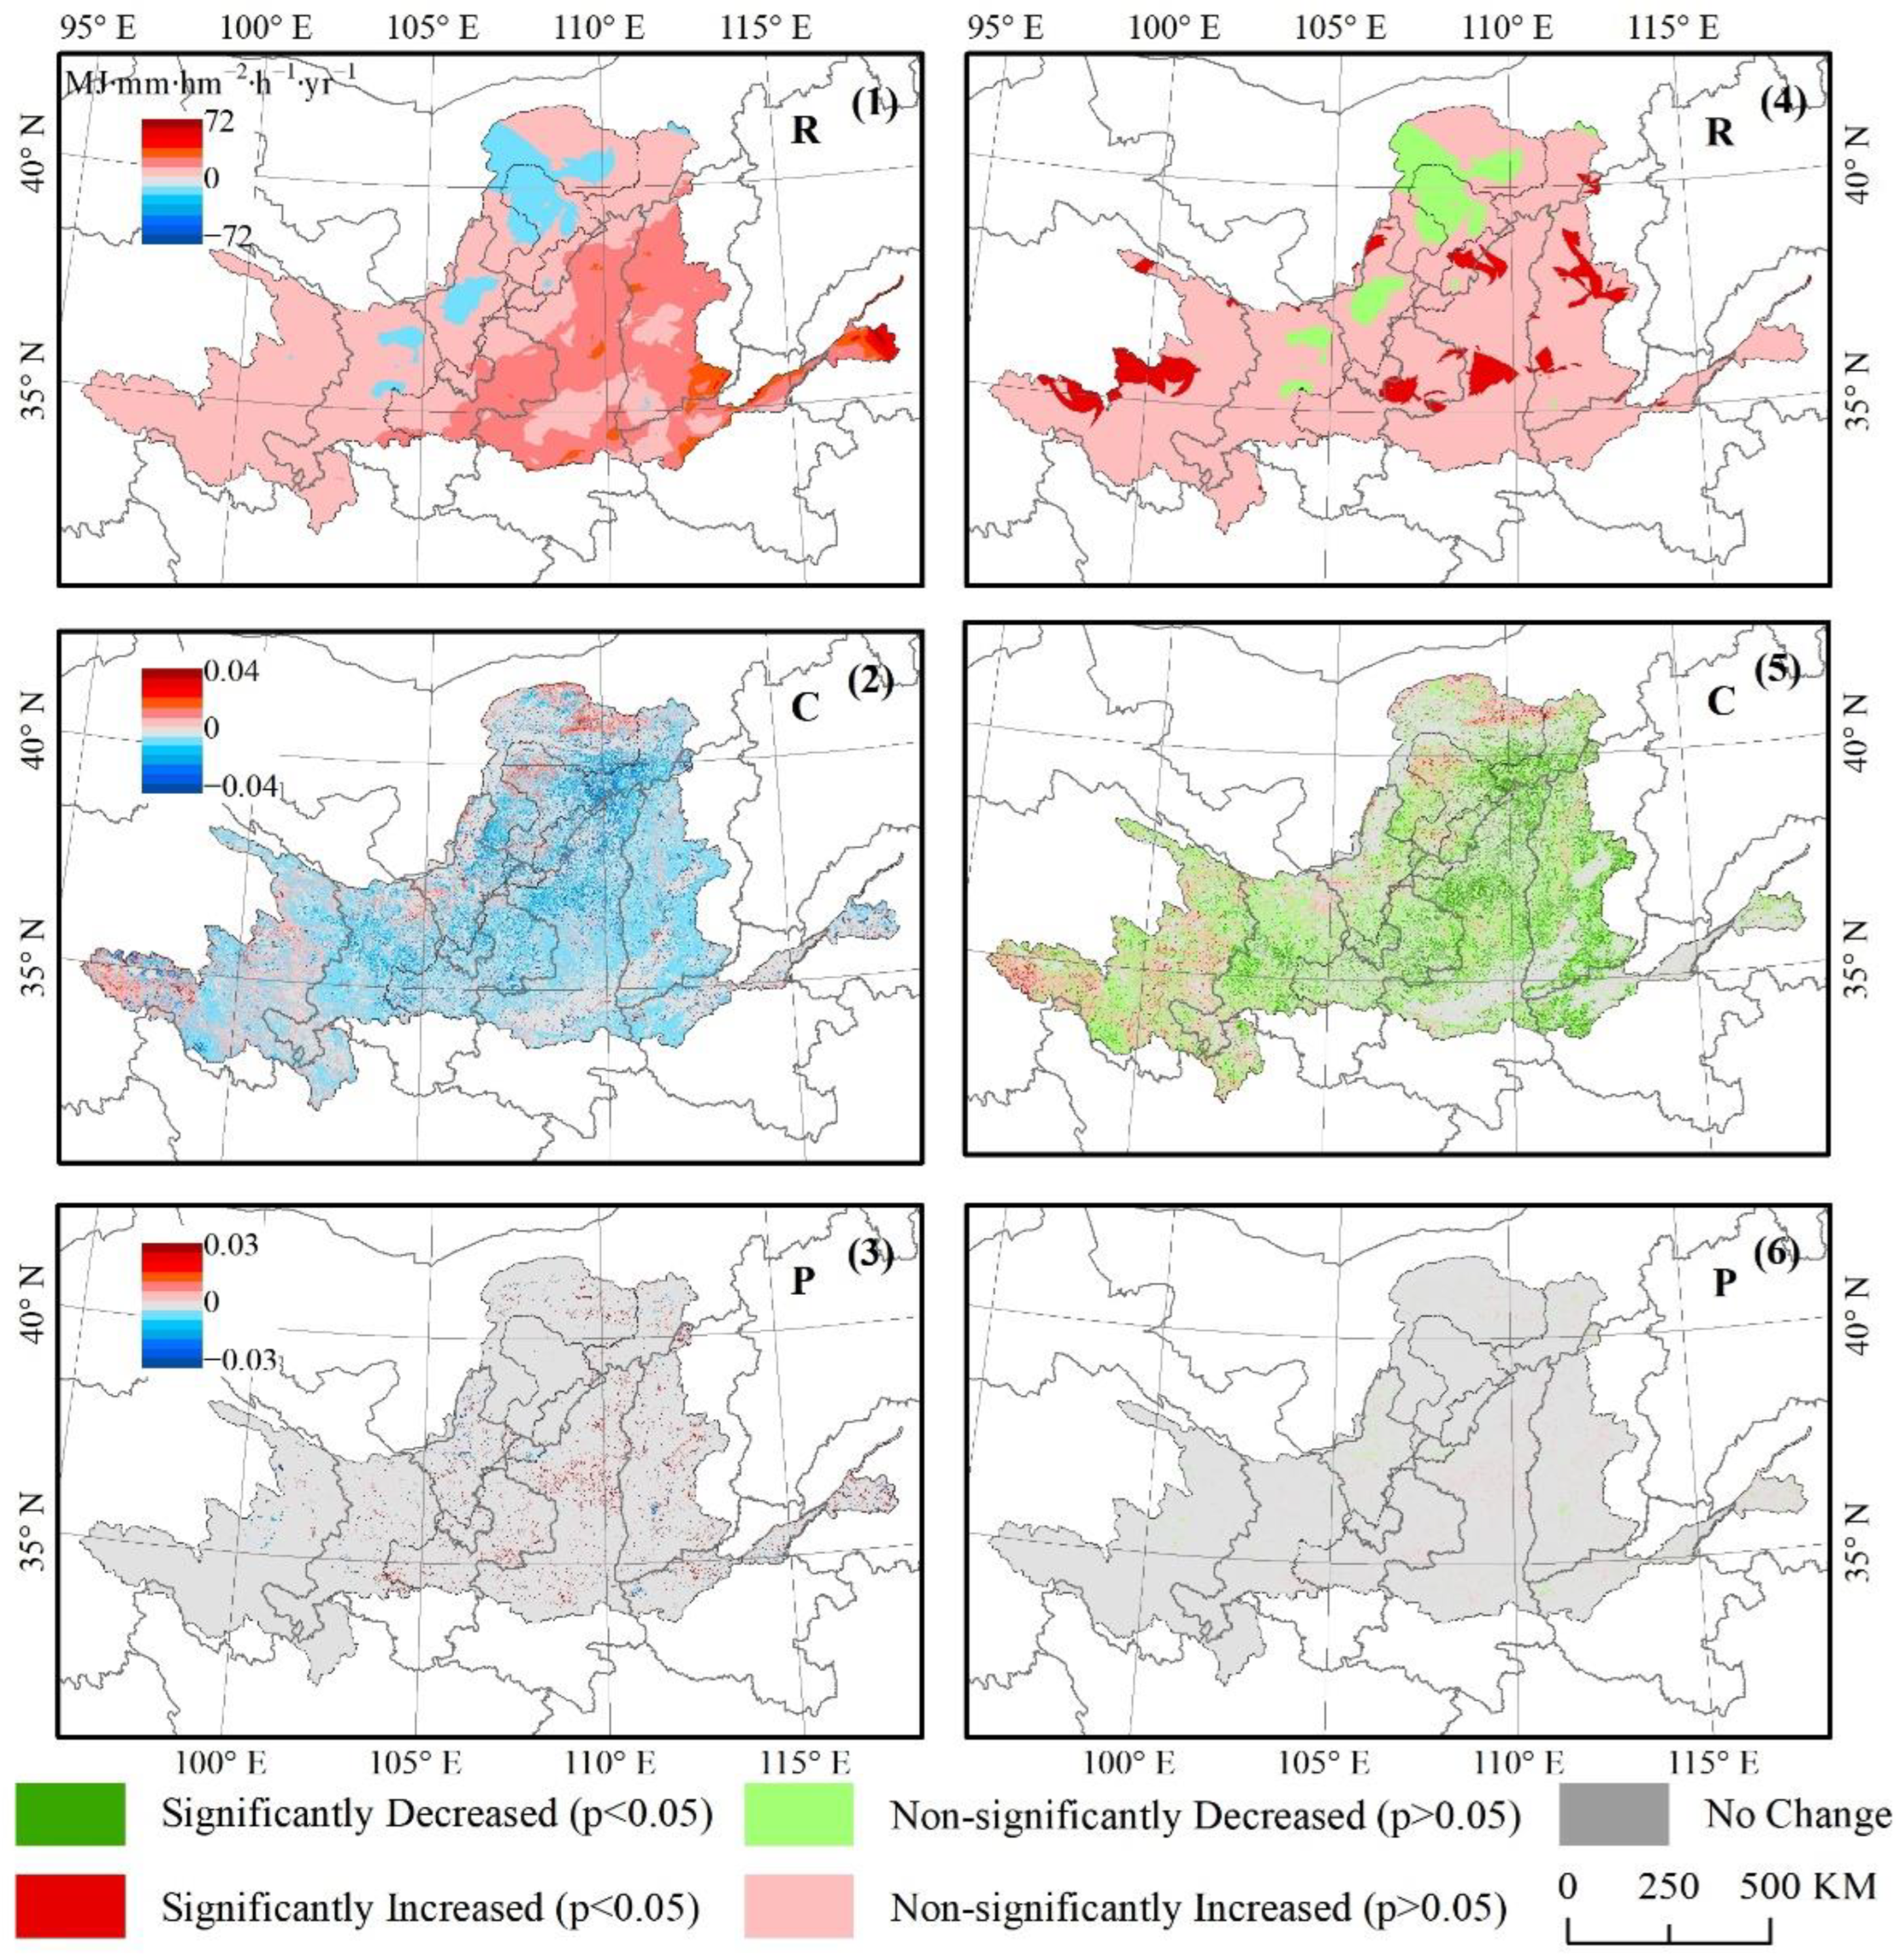
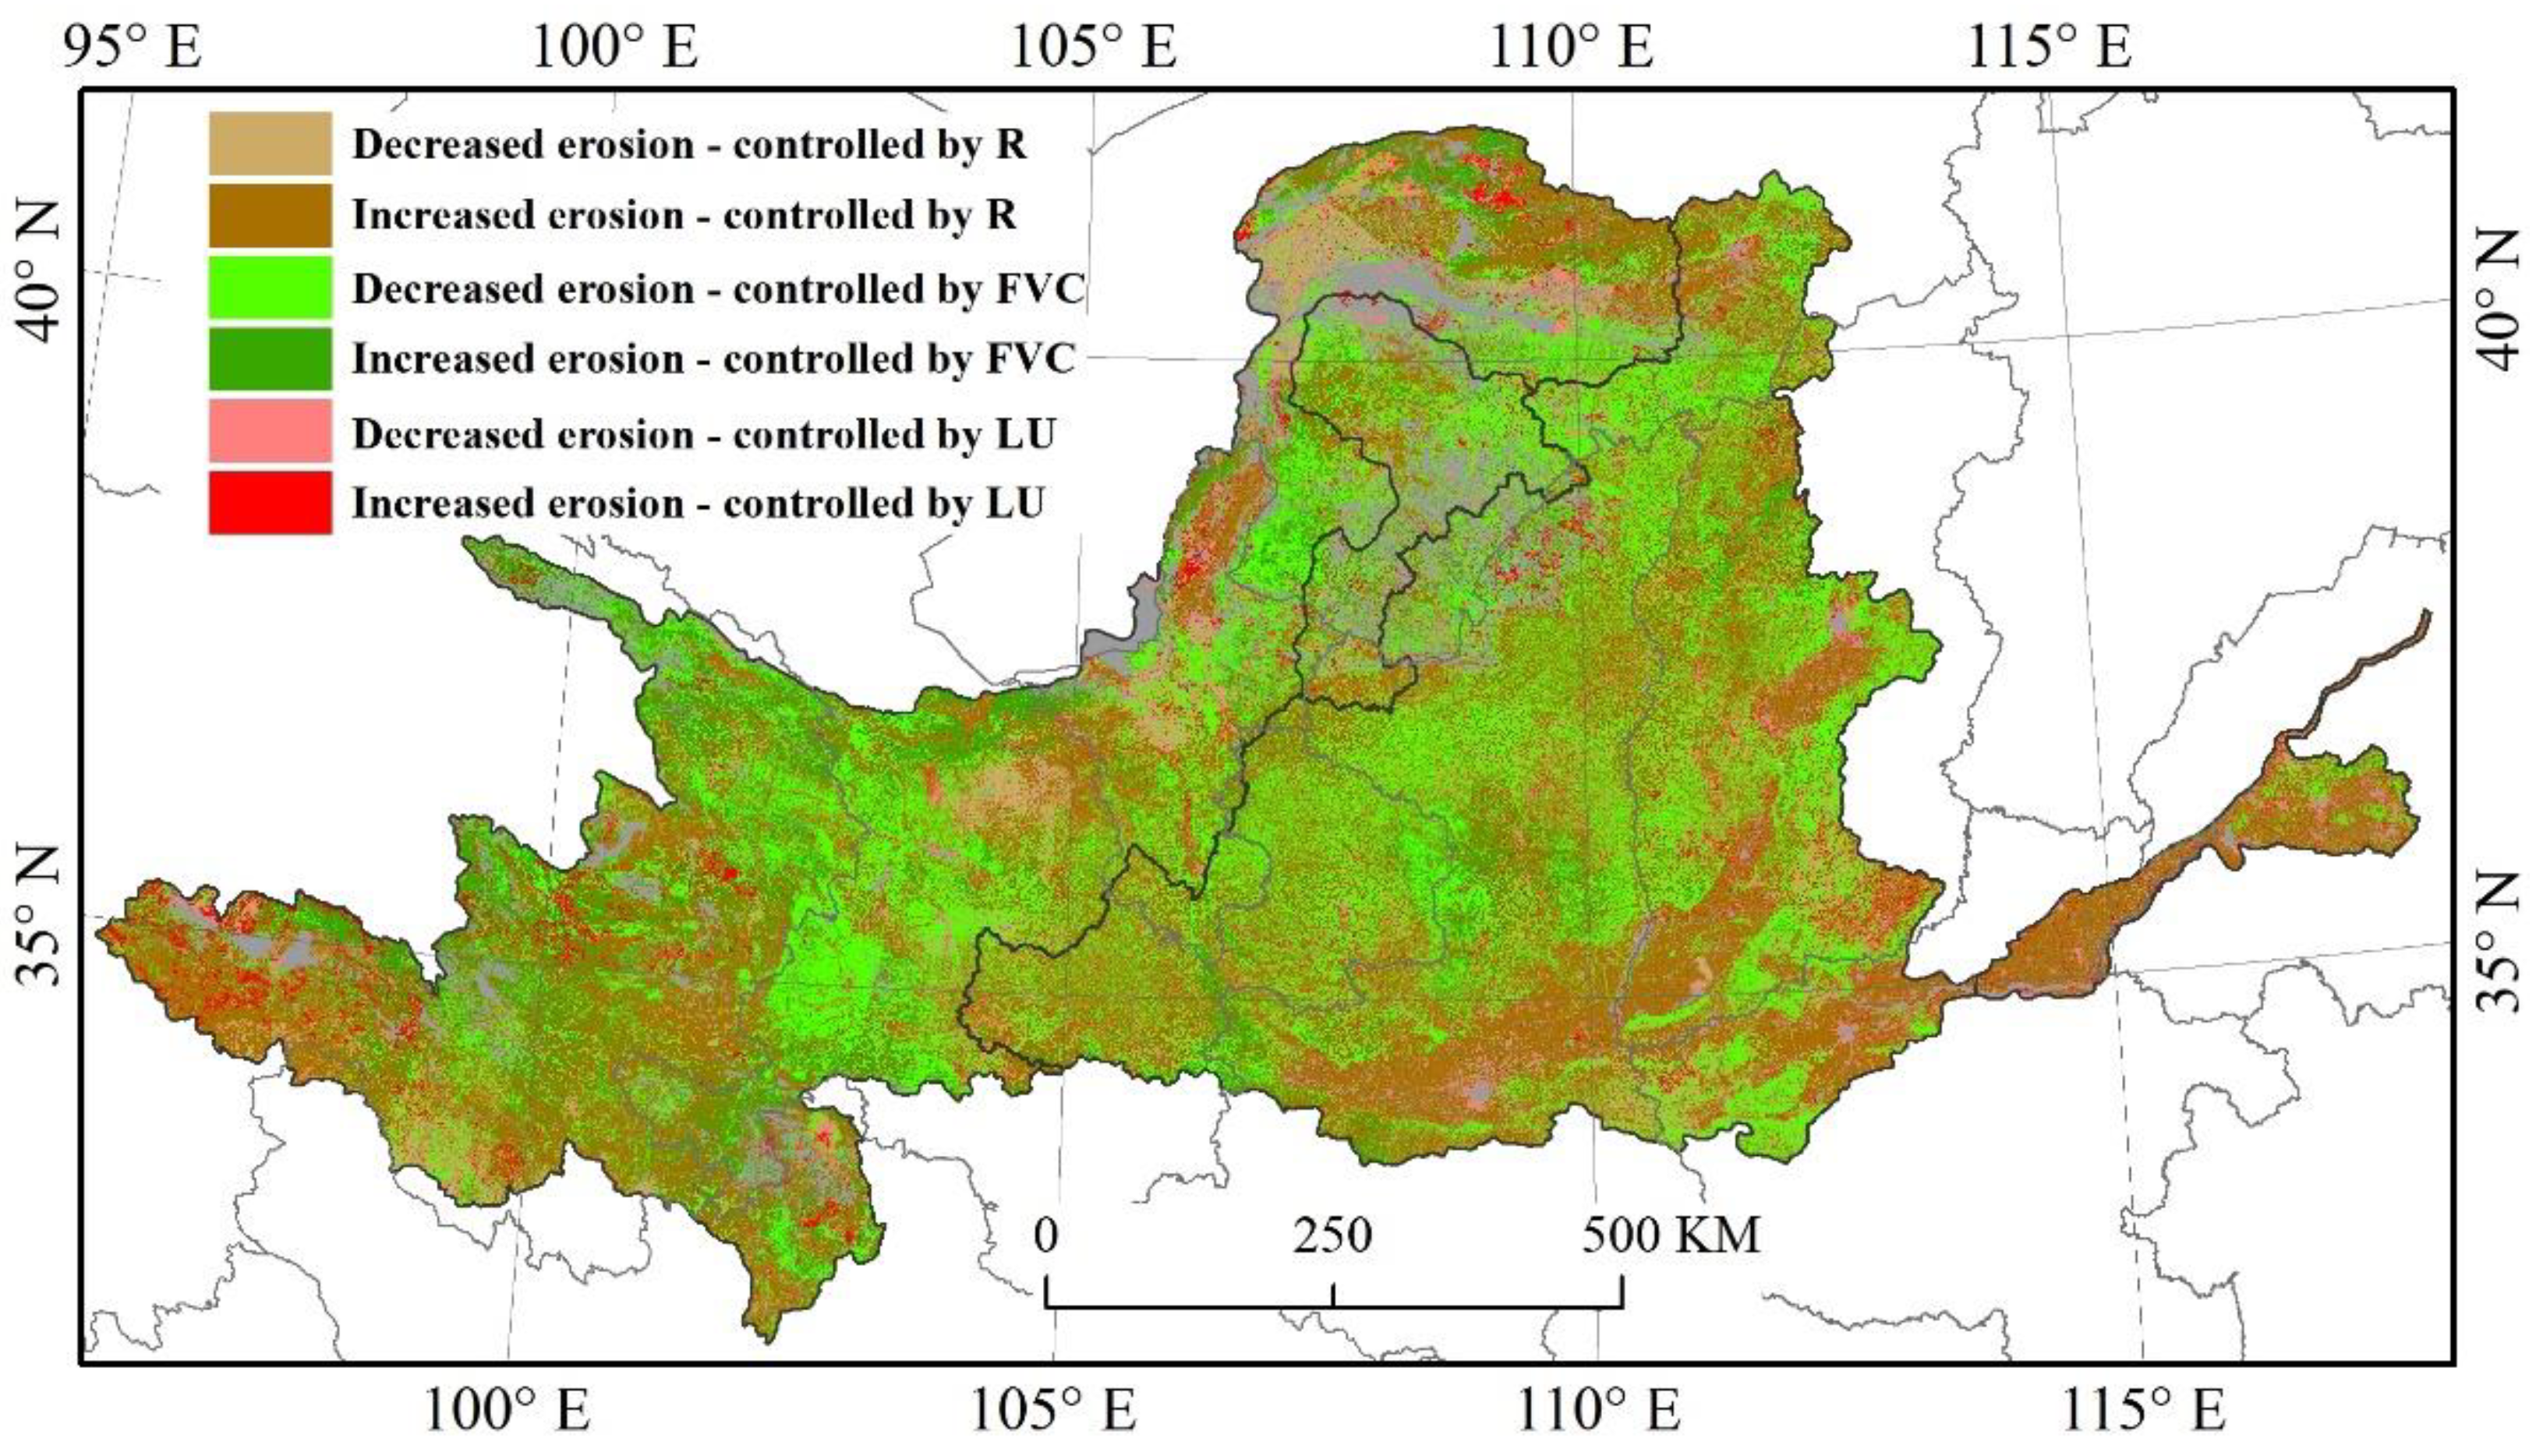
3.3. Factors Controlling Spatial Changes in Soil Erosion
4. Discussion
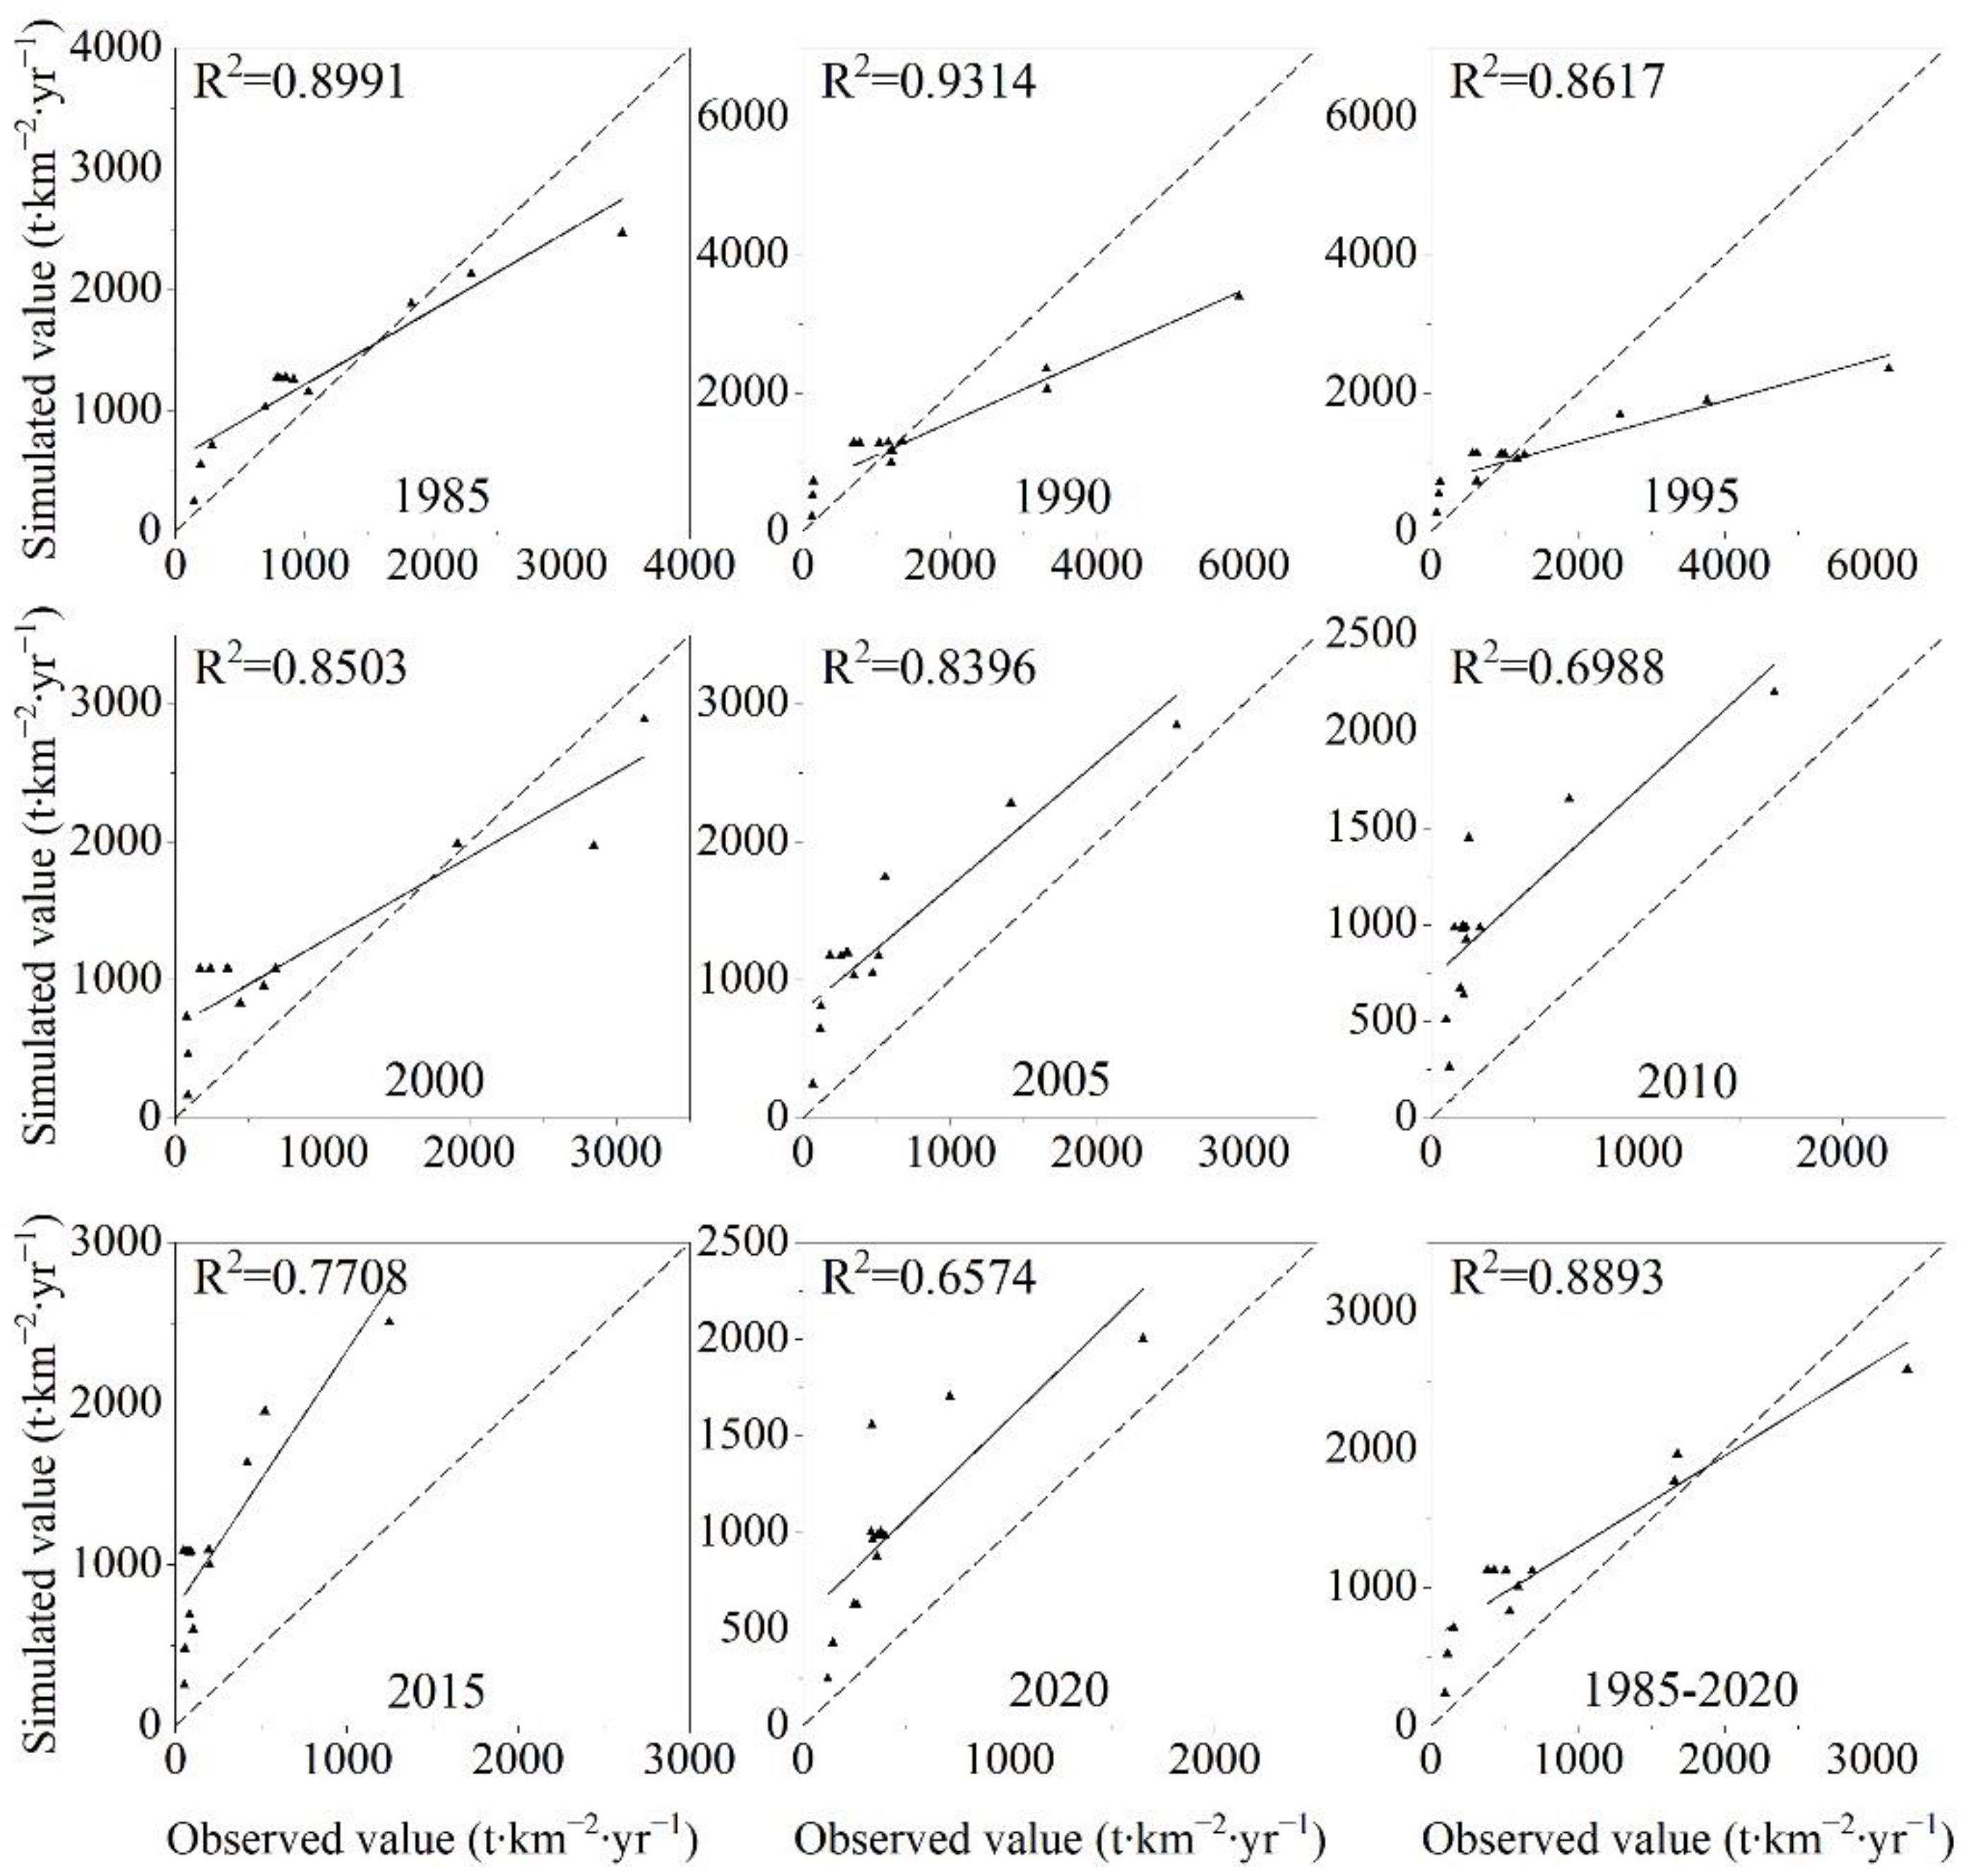
4.1. Uncertainty of the USLE
4.2. Spatial-Temporal Variation of Soil Erosion and Its Controlling Factors in the Yellow River Basin
5. Conclusions
Author Contributions
Funding
Institutional Review Board Statement
Informed Consent Statement
Data Availability Statement
Acknowledgments
Conflicts of Interest
References
- Lal, R. Soil erosion and the global carbon budget. Environ. Int. 2003, 29, 437–450. [Google Scholar] [CrossRef]
- Pimentel, D.; Harvey, C.; Resosudarmo, P.; Sinclair, K.; Kurz, D.; McNair, M.; Crist, S.; Shpritz, L.; Fitton, L.; Saffouri, R.; et al. Environmental and Economic Costs of Soil Erosion and Conservation Benefits. Science 1995, 267, 1117–1123. [Google Scholar] [CrossRef]
- Lantican, M.A.; Guerra, L.C.; Bhuiyan, S.I. Impacts of soil erosion in the upper Manupali watershed on irrigated lowlands in the Philippines. Paddy Water Environ. 2003, 1, 19–26. [Google Scholar] [CrossRef]
- Marques, M.J.; Bienes, R.; Pérez-Rodríguez, R.; Jiménez, L. Soil degradation in central Spain due to sheet water erosion by low-intensity rainfall events. Earth Surf. Process. Landf. 2008, 33, 414–423. [Google Scholar] [CrossRef]
- Pimentel, D.; Kounang, N. Ecology of Soil Erosion in Ecosystems. Ecosystems 1998, 1, 416–426. [Google Scholar] [CrossRef]
- Lal, R.; Bruce, J.P. The potential of world cropland soils to sequester C and mitigate the greenhouse effect. Environ. Sci. Policy 1999, 2, 177–185. [Google Scholar] [CrossRef]
- Nearing, M.A.; Jetten, V.; Baffaut, C.; Cerdan, O.; Couturier, A.; Hernandez, M.; Le Bissonnais, Y.; Nichols, M.H.; Nunes, J.P.; Renschler, C.S.; et al. Modeling response of soil erosion and runoff to changes in precipitation and cover. Catena 2005, 61, 131–154. [Google Scholar] [CrossRef]
- Tang, Q.; Xu, Y.; Bennett, S.J.; Li, Y. Assessment of soil erosion using RUSLE and GIS: A case study of the Yangou watershed in the Loess Plateau, China. Environ. Earth Sci. 2015, 73, 1715–1724. [Google Scholar] [CrossRef]
- Jiang, C.; Zhang, H.; Zhang, Z.; Wang, D. Model-based assessment soil loss by wind and water erosion in China’s Loess Plateau: Dynamic change, conservation effectiveness, and strategies for sustainable restoration. Glob. Planet. Chang. 2019, 172, 396–413. [Google Scholar] [CrossRef]
- Ni, J.-R.; Li, X.-X.; Borthwick, A.G.L. Soil erosion assessment based on minimum polygons in the Yellow River basin, China. Geomorphology 2008, 93, 233–252. [Google Scholar] [CrossRef]
- Yao, W.; Ran, D.; Chen, J. Recent changes in runoff and sediment regimes and future projections in the Yellow River basin. Adv. Water Sci. 2013, 24, 607–616, (In Chinese with English abstract). [Google Scholar] [CrossRef]
- Liu, T.; Yuan, C. Study on soil erosion of the Yellow River Basin in Henan Province based on RUSLE model. J. N. China Univ. Water Resour. Electr. Power (Nat. Sci. Ed.) 2020, 41, 7–13, (In Chinese with English abstract). [Google Scholar] [CrossRef]
- Fu, B. Soil erosion and its control in the loess plateau of China. Soil Use Manag. 1989, 5, 76–82. [Google Scholar] [CrossRef]
- Ma, G. Records of the Yellow River Flood in 1958. Henan Leg. Dly. 2009, 15, 661–678. [Google Scholar]
- Hainan Daily. Yellow River Floods in History. 2007. Available online: https://news.sina.com.cn/c/2007-06-15/073912026626s.shtml (accessed on 10 February 2024).
- Chu, X.; Zhan, J.; Li, Z.; Zhang, F.; Qi, W. Assessment on Forest Carbon Sequestration in the Three-North Shelterbelt Program Region, China. J. Clean. Prod. 2019, 215, 382–389. [Google Scholar] [CrossRef]
- Chen, N.; Ma, T.; Zhang, X. Responses of soil erosion processes to land cover changes in the Loess Plateau of China: A case study on the Beiluo River basin. Catena 2016, 136, 118–127. [Google Scholar] [CrossRef]
- Yao, W. Development Opportunity and Sicentific Positioning of Soil and Water Conservation of the Yellow River in the New Era. Yellow River 2019, 41, 8446, (In Chinese with English abstract). [Google Scholar] [CrossRef]
- Zhang, W. A 40 years governance model for the construction of the Three North Shelterbelt System. In Green Monument; China Forestry Press: Beijing, China, 2018; (In Chinese with English abstract). [Google Scholar]
- Chen, C.; Park, T.; Wang, X.; Piao, S.; Xu, B.; Chaturvedi, R.K.; Fuchs, R.; Brovkin, V.; Ciais, P.; Fensholt, R.; et al. China and India lead in greening of the world through land-use management. Nat. Sustain. 2019, 2, 122–129. [Google Scholar] [CrossRef]
- Yao, Y.; Wang, Y.; Li, Y.; Zhang, X. Climate Warming and Drying and Its Environmental Effects in The Loess Plateau. Resour. Sci. 2005, 05, 146–152. [Google Scholar]
- Zhao, G.; Mu, X.; Wen, Z.; Wang, F.; Gao, P. Soil Erosion, Conservation, and Eco-Environment Changes in the Loess Plateau of china. Land Degrad. Dev. 2013, 24, 499–510. [Google Scholar] [CrossRef]
- Zhang, X.C.; Liu, W.Z. Simulating potential response of hydrology, soil erosion, and crop productivity to climate change in Changwu tableland region on the Loess Plateau of China. Agric. For. Meteorol. 2005, 131, 127–142. [Google Scholar] [CrossRef]
- Li, Z.; Liu, W.; Zhang, X.; Zheng, F. Response of Slope Erosion to Global Climate Change on the Loess Tableland. Bull. Soil Water Conserv. 2010, 30, 1–6, (In Chinese with English abstract). [Google Scholar] [CrossRef]
- Wang, S.; Zhao, G.; Wang, M. Characteristics of Climate Change in the Yellow River Basin from 1961 to 2020. Meteorol. Environ. Sci. 2021, 44, 1–8, (In Chinese with English abstract). [Google Scholar] [CrossRef]
- Foster, G.R.; Meyer, L.D. Transport of particles by shallow flow. Trans. Am. Soc. Agric. Eng. 1972, 19, 99–102. [Google Scholar]
- Renard, K.G.; Foster, G.R.; Weesies, G.A.; McCool, D.K.; Yoder, D.C. Predicting Soil Erosion by Water: A Guide to Conservation Planning with the Revised Universal Soil Loss Equation (RUSLE); Agricultural Handbook No. 703; USDA: Washington, DC, USA, 1997; p. 404. [Google Scholar]
- Williams, J.R.; Neitsch, S.L.; Arnold, J.G. Soil and Water Assessment Tool-User’s Manual; Black and Research Center, Texas Agricultural Experiment Station: College Station, TX, USA, 1999. [Google Scholar]
- Wischmeier, W.H.; Smith, D.D. Predicting Rainfall Erosion Losses from Cropland East of the Rocky Mountains; Agric. Handbook. No. 282; USDA: Washington, DC, USA, 1965. [Google Scholar]
- Zhu, M.; He, W.; Zhang, Q.; Xiong, Y.; Tan, S.; He, H. Spatial and Temporal Characteristics of Soil Conservation Service in the Area of the Upper and Middle of the Yellow River, China. Heliyon 2019, 5, e02985. [Google Scholar] [CrossRef]
- Makhdumi, W.; Shwetha, H.R.; Dwarakish, G.S. Soil Erosion in Diverse Agroecological Regions of India: A Comprehensive Review of Usle-Based Modelling. Environ. Monit. Assess. 2023, 195, 1112. [Google Scholar] [CrossRef]
- Wondrade, N. Integrated Use of Gis, Rs and Usle Model for Lulc Change Analysis and Soil Erosion Risk Mapping in the Lake Hawassa Watershed, Southern Ethiopia. Geocarto Int. 2023, 38, 2210106. [Google Scholar] [CrossRef]
- Tian, P.; Tian, X.; Geng, R.; Zhao, G.; Yang, L.; Mu, X.; Gao, P.; Sun, W.; Liu, Y. Response of Soil Erosion to Vegetation Restoration and Terracing on the Loess Plateau. Catena 2023, 227, 107103. [Google Scholar] [CrossRef]
- Schnitzer, S.; Seitz, F.; Eicker, A.; Güntner, A.; Wattenbach, M.; Menzel, A. Estimation of Soil Loss by Water Erosion in the Chinese Loess Plateau Using Universal Soil Loss Equation and Grace. Geophys. J. Int. 2013, 193, 1283–1290. [Google Scholar] [CrossRef]
- Ouyang, W.; Hao, F.; Skidmore, A.K.; Toxopeus, A.G. Soil erosion and sediment yield and their relationships with vegetation cover in upper stream of the Yellow River. Sci. Total Environ. 2010, 409, 396–403. [Google Scholar] [CrossRef]
- Sun, W.; Shao, Q.; Liu, J.; Zhai, J. Assessing the effects of land use and topography on soil erosion on the Loess Plateau in China. Catena 2014, 121, 151–163. [Google Scholar] [CrossRef]
- Zhang, X.; She, D.; Hou, M.; Wang, G.; Liu, Y. Understanding the influencing factors (precipitation variation, land use changes and check dams) and mechanisms controlling changes in the sediment load of a typical Loess watershed, China. Ecol. Eng. 2021, 163, 106198. [Google Scholar] [CrossRef]
- Wang, Y.; Niu, F.; Wu, Q.; Gao, Z. Assessing soil erosion and control factors by radiometric technique in the source region of the Yellow River, Tibetan Plateau. Quat. Res. 2014, 81, 538–544. [Google Scholar] [CrossRef]
- Xiao; Yang; Guo, B.; Lu, Y.; Zhang, R.; Zhang, D.; Zhen, X.; Chen, S.; Wu, H.; Wei, C.; et al. Spatial–temporal evolution patterns of soil erosion in the Yellow River Basin from 1990 to 2015: Impacts of natural factors and land use change. Geomat. Nat. Hazards Risk 2021, 12, 103–122. [Google Scholar] [CrossRef]
- Liu, B.; Guo, S.; Li, Z.; Xie, Y.; Zhang, K. Sampling Survey of Water Erosion in China. Soil And Water Conservation In China. Int. Soil Water Conserv. Res. 2013, 10, 26–34, (In Chinese with English abstract). [Google Scholar] [CrossRef]
- Wischmeier, W.H. Predicting Rainfall Erosion Losses: A Guide to Conservation Planning; United States Department of Agriculture, Science and Education Administration: Washington DC, USA, 1978; Volume 58, p. 26. [Google Scholar]
- Liu, B.Y.; Nearing, M.; Risse, L. Slope Gradient Effects on Soil Loss for Steep Slopes. Trans. ASAE 1994, 37, 1835–1840. [Google Scholar] [CrossRef]
- Zhang, H.; Yang, Q.; Liu, Q.; Guo, W.; Wang, C. Regional Slope Length and Slope Steepness Factor Extraction Algorithm Based on GIS. Comput. Eng. 2010, 36, 246–248, (In Chinese with English abstract). [Google Scholar]
- Jiang, Z.; Wang, Z.; Liu, Z. Quantitative Study on Spatial Variation of Soil Erosion in a Small Watershed in the Loess Hilly Region. J. Soil Eros. Soil Conserv. 1996, 1, 6308–6320, (In Chinese with English abstract). [Google Scholar] [CrossRef]
- Chen, H. Spatial and Temporal Changes of Soil Erosion and Its Driving Factors before and after the “Grain for Green” Project in the Loess Plateau. Ph. D. Thesis, Institute of Soil and Water Conservation, Northwest A&F University, Xianyang, China, 2019. [Google Scholar]
- Liu, B.; Xie, Y.; Li, Z.; Liang, Y.; Zhang, W.; Fu, S.; Guo, Q. The assessment of soil loss by water erosion in China. Int. Soil Water Conserv. Res. 2020, 8, 430–439. [Google Scholar] [CrossRef]
- Fu, B.J.; Zhao, W.W.; Chen, L.D.; Zhang, Q.J.; Lü, Y.H.; Gulinck, H.; Poesen, J. Assessment of soil erosion at large watershed scale using RUSLE and GIS: A case study in the Loess Plateau of China. Land Degrad. Dev. 2005, 16, 73–85. [Google Scholar] [CrossRef]
- Fu, B.; Liu, Y.; Lü, Y.; He, C.; Zeng, Y.; Wu, B. Assessing the soil erosion control service of ecosystems change in the Loess Plateau of China. Ecol. Complex. 2011, 8, 284–293. [Google Scholar] [CrossRef]
- Lufafa, A.; Tenywa, M.M.; Isabirye, M.; Majaliwa, M.J.G.; Woomer, P.L. Prediction of soil erosion in a Lake Victoria basin catchment using a GIS-based Universal Soil Loss model. Agric. Syst. 2003, 76, 883–894. [Google Scholar] [CrossRef]
- Ministry of Water Resources of the People’s Republic of China. SL190-2007; Soil Erosion Classification and Grading Standards. China Water Resources and Hydropower Press: Beijing, China, 2008; pp. 3–12. [Google Scholar]
- Mann, H.B. Non-parametric test against trend. Econometrika 1945, 13, 163–171. [Google Scholar] [CrossRef]
- Kendall, M.G. Rank Correlation Methods; Charles Griffin: London, UK, 1975; p. 202. [Google Scholar]
- Sen, P.K. Estimates of the Regression Coefficient Based on Kendall’s Tau. J. Am. Stat. Assoc. 1968, 63, 1379–1389. [Google Scholar] [CrossRef]
- Chappell, A.; Baldock, J.; Sanderman, J. The global significance of omitting soil erosion from soil organic carbon cycling schemes. Nat. Clim. Chang. 2016, 6, 187–191. [Google Scholar] [CrossRef]
- Ludwig, B.; Boiffin, J.; Chadoeuf, J.; Auzet, A.-V. Hydrological structure and erosion damage caused by concentrated flow in cultivated catchments. Catena 1995, 25, 227–252. [Google Scholar] [CrossRef]
- Wang, G.; Zhong, D.; Wu, B. Future trend of Yellow River sediment changes. China Water Resour. 2020, 01, 9–12+32, (In Chinese with English abstract). [Google Scholar]
- Smith, S.V.; Sleezer, R.O.; Renwick, W.H.; Buddemeier, R.W. Fates of Eroded Soil Organic Carbon: Mississippi Basin Case Study. Ecol. Appl. 2005, 15, 1929–1940. [Google Scholar] [CrossRef]
- Jomaa, S.; Barry, D.A.; Brovelli, A.; Heng, B.C.P.; Sander, G.C.; Parlange, J.Y.; Rose, C.W. Rain splash soil erosion estimation in the presence of rock fragments. Catena 2012, 92, 38–48. [Google Scholar] [CrossRef]
- Ryzak, M.; Bieganowski, A.; Polakowski, C. Effect of soil moisture content on the splash phenomenon reproducibility. PLoS ONE 2015, 10, e0119269. [Google Scholar] [CrossRef]
- Fernández-Raga, M.; Palencia, C.; Keesstra, S.; Jordán, A.; Fraile, R.; Angulo-Martínez, M.; Cerdà, A. Splash erosion: A review with unanswered questions. Earth-Sci. Rev. 2017, 171, 463–477. [Google Scholar] [CrossRef]
- Huo, J.; Yu, X.; Liu, C.; Chen, L.; Zheng, W.; Yang, Y.; Tang, Z. Effects of soil and water conservation management and rainfall types on runoff and soil loss for a sloping area in North China. Land Degrad. Dev. 2020, 31, 2117–2130. [Google Scholar] [CrossRef]
- Wang, J.; Shi, B.; Bai, T.; Yuan, Q. Spatio-temporal patterns of precipitation and its possible driving factors in the Yellow River Basin. J. Desert Res. 2022, 6, 94–102, (In Chinese with English abstract). [Google Scholar]
- Ziadat, F.M.; Taimeh, A.Y. Effect of Rainfall Intensity, Slope, Land Use and Antecedent Soil Moisture on Soil Erosion in an Arid Environment. Land Degrad. Dev. 2013, 24, 582–590. [Google Scholar] [CrossRef]
- Wang, B.; Steiner, J.; Zheng, F.; Gowda, P. Impact of rainfall pattern on interrill erosion process. Earth Surf. Process. Landf. 2017, 42, 1833–1846. [Google Scholar] [CrossRef]
- Xu, Z.; Zhang, S.; Yang, X. Water and sediment yield response to extreme rainfall events in a complex large river basin: A case study of the Yellow River Basin, China. J. Hydrol. 2021, 597, 126183. [Google Scholar] [CrossRef]
- Díaz-Raviña, M.; Martín, A.; Barreiro, A.; Lombao, A.; Iglesias, L.; Díaz-Fierros, F.; Carballas, T. Mulching and seeding treatments for post-fire soil stabilisation in NW Spain: Short-term effects and effectiveness. Geoderma 2012, 191, 31–39. [Google Scholar] [CrossRef]
- Goldman, S.J.; Jackson, K.; Bursztynsky, T.A. Erosion and Sediment Control Handbook; McGraw Hill Book Company: New York, NY, USA, 1986. [Google Scholar]
- Wen, X.; Zhen, L. Soil erosion control practices in the Chinese Loess Plateau: A systematic review. Environ. Dev. 2020, 34, 100493. [Google Scholar] [CrossRef]
- Yang, Q.; Liu, G.; Agostinho, F.; Giannetti, B.F.; Yang, Z. Assessment of ecological restoration projects under water limits: Finding a balance between nature and human needs. J. Environ. Manag. 2022, 311, 114849. [Google Scholar] [CrossRef]
- Liang, W.; Fu, B.; Wang, S.; Zhang, W.; Jin, Z.; Feng, X.; Yan, J.; Liu, Y.; Zhou, S. Quantification of the ecosystem carrying capacity on China’s Loess Plateau. Ecol. Indic. 2019, 101, 192–202. [Google Scholar] [CrossRef]
- Zhao, H.; He, H.; Wang, J.; Bai, C.; Zhang, C. Vegetation Restoration and Its Environmental Effects on the Loess Plateau. Sustainability 2018, 10, 4676. [Google Scholar] [CrossRef]


| Research Period | Daily Precipitation Data | Landsat-FVC | ||
|---|---|---|---|---|
| Time | Satellite Type | Temporal Resolution | ||
| 1985 | 1983–1987 | 1986–1990 | Landsat-5 | 8 days |
| 1990 | 1988–1992 | 1988–1992 | Landsat-5 | |
| 1995 | 1993–1997 | 1993–1997 | Landsat-5 | |
| 2000 | 1998–2002 | 1998–2002 | Landsat-5, Landsat-7 | |
| 2005 | 2003–2007 | 2003–2007 | Landsat-5, Landsat-7 | |
| 2010 | 2008–2012 | 2008–2012 | Landsat-5, Landsat-7 | |
| 2015 | 2013–2017 | 2013–2017 | Landsat-8 | |
| 2020 | 2018–2022 | 2018–2022 | Landsat-8 | |
| Land Use | C |
|---|---|
| Farmland | 1 |
| Water | 0 |
| Construction land | 0 |
| Other land use | Bare land is 1, other land use is 0 |
| Erosion Intensity | Area (104 km2) | Erosion Modulus (t∙km−2∙yr−1) | Proportion of Area (%) |
|---|---|---|---|
| Slight erosion | 56.15 | 182.10 | 70.63 |
| Mild erosion | 11.61 | 1625.01 | 14.60 |
| Moderate erosion | 7.10 | 3530.54 | 8.93 |
| Intensive erosion | 2.91 | 6232.95 | 3.66 |
| Extreme intensive erosion | 1.50 | 10,307.12 | 1.89 |
| Severe erosion | 0.23 | 19,419.98 | 0.29 |
| Total | 79.50 | 1160.97 | 100 |
| Year | Farmland | Forest | Grassland | Water | Residential Area | Unused Land |
|---|---|---|---|---|---|---|
| 1985 | 20.95 | 10.36 | 38.20 | 1.46 | 1.58 | 6.95 |
| 1990 | 21.02 | 10.37 | 38.13 | 1.38 | 1.61 | 6.99 |
| 1995 | 21.03 | 9.80 | 39.22 | 1.25 | 1.65 | 6.55 |
| 2000 | 21.21 | 10.36 | 37.96 | 1.33 | 1.75 | 6.89 |
| 2005 | 20.78 | 10.61 | 37.80 | 1.36 | 1.88 | 7.07 |
| 2010 | 20.55 | 10.65 | 38.35 | 1.34 | 2.34 | 6.27 |
| 2015 | 20.47 | 10.63 | 38.29 | 1.35 | 2.52 | 6.24 |
| 2020 | 19.97 | 10.69 | 38.47 | 1.42 | 2.85 | 6.10 |
Disclaimer/Publisher’s Note: The statements, opinions and data contained in all publications are solely those of the individual author(s) and contributor(s) and not of MDPI and/or the editor(s). MDPI and/or the editor(s) disclaim responsibility for any injury to people or property resulting from any ideas, methods, instructions or products referred to in the content. |
© 2024 by the authors. Licensee MDPI, Basel, Switzerland. This article is an open access article distributed under the terms and conditions of the Creative Commons Attribution (CC BY) license (https://creativecommons.org/licenses/by/4.0/).
Share and Cite
Guo, J.; Qi, Y.; Zhang, L.; Zheng, J.; Sun, J.; Tang, Y.; Yang, X. Identifying and Mapping the Spatial Factors That Control Soil Erosion Changes in the Yellow River Basin of China. Land 2024, 13, 344. https://doi.org/10.3390/land13030344
Guo J, Qi Y, Zhang L, Zheng J, Sun J, Tang Y, Yang X. Identifying and Mapping the Spatial Factors That Control Soil Erosion Changes in the Yellow River Basin of China. Land. 2024; 13(3):344. https://doi.org/10.3390/land13030344
Chicago/Turabian StyleGuo, Jinwei, Yanbing Qi, Luhao Zhang, Jiale Zheng, Jingyan Sun, Yuanyuan Tang, and Xiangyun Yang. 2024. "Identifying and Mapping the Spatial Factors That Control Soil Erosion Changes in the Yellow River Basin of China" Land 13, no. 3: 344. https://doi.org/10.3390/land13030344