Abstract
Green development is a primary path for ports and cities to achieve a low-carbon transition under the Sustainable Development Goals and a powerful driving force to elevate regional port–city relations to a high level of coordination. In this paper, twenty port cities in the Yangtze River Delta (YRD) were selected and port environmental efficiency (PEE) was calculated through the window SBM model, while the EW-TOPSIS model was used to evaluate high-quality urban economic development (HED). The coupling coordination degree (CCD) model, the kernel density model, GIS spatial analysis, and the grey prediction model were used to further explore the spatial–temporal dynamic evolution and prediction of the CCD between PEE and HED. The results suggested that: (1) PEE fluctuation in the YRD is increasing, with a trend of seaports achieving higher PEE than river ports; (2) HED in the YRD shows upward trends, and the polarization of individual cities is obvious; (3) Temporally, the CCD in the YRD has risen from 0.438 to 0.518. Shanghai consistently maintains intermediate coordination, and Jiangsu has experienced the most significant increase in CCD. Spatially, CCD is led by Lianyungang, Suzhou, Shanghai, and Ningbo-Zhoushan, displaying a decreasing distribution pattern from east to west. The projection for 2026 suggests that all port cities within the YRD will have transitioned to a phase of orderly development. To enhance the coordination level in the YRD, policymakers should consider the YRD as a whole to position the ports functionally and manage them hierarchically, utilize the ports to break down resource boundaries to promote the synergistic division of labor among cities, and then tilt the resources towards Anhui.
1. Introduction
The in-depth implementation of the Coordinated Regional Development Strategy [1] is an inevitable support of China’s high-quality development as well as an essential part of promoting the modernization of construction in China. In the construction of coastal cities, the coordination between the port environment and the urban economy has gradually become a focal point. As an essential way to construct ecological civilization, green development has become the guiding principle for the low-carbon transformation of ports and cities [2] and for regional coordination development [3].
The YRD is located on the eastern coast of China and south of the Qinling–Huaihe Line, boasting a mild climate and abundant rainfall. The Yangtze River has endowed the region with vast alluvial plains, providing the necessary foundation for population concentration and industrial and agricultural development in the YRD. Meanwhile, the favorable geographical conditions of the lower reaches of the Yangtze River, such as stable water levels, wide navigation channels, gentle currents, and complex river networks, have catalyzed the region’s shipping industry growth. Consequently, the YRD has emerged as the largest port cluster and city cluster in China. The port cluster, relying on the Yangtze River and the ocean, passes through the core area of the YRD and surrounds the left side of the urban agglomeration, forming a close geographical connection with the city cluster. This geographical synergy renders the YRD an ideal case study for exploring port–city coordination dynamics in China.
The YRD port cluster is one of the world’s maritime trade centers [4]. It has the broadest hinterland, with the Yangtze River linking 11 provinces in China. Meanwhile, there are numerous harbors and river ports in the YRD, with significant advantages in sea–river intermodal transport. Data from Lloyd’s List shows that 7 ports in the YRD entered the world’s top 100 container ports in 2022, with Shanghai Port and Ningbo-Zhoushan Port ranking prominently among the top 10. The Ministry of Transport of the People’s Republic of China claimed that the annual cargo throughput and container throughput of major ports in the YRD represented 37.56% and 37.39% of the national total in 2022, providing tax revenues and employment opportunities for the YRD city cluster. Furthermore, the YRD port cluster mitigates geographical barriers for goods and resources, enabling coastal industry transfers to inland cities and fostering a synergistic labor division within the cluster [5]. As the center of China’s economic construction, the YRD city cluster leads in high-quality development [6]. According to data from the China National Bureau of Statistics, the regional GDP of the YRD accounted for 24% of China’s GDP in 2022, providing strong financial support for the development of the port cluster. The advanced transport network in the YRD, with a total operating mileage of high-speed railways exceeding 6600 km, a highway network of 16,700 km, and a network of high-grade waterways exceeding 4270 km, also supports multimodal transport in the port cluster. The port and city clusters are interdependent, supporting the overall prosperity of the YRD [7].
While the port and city clusters of the YRD are synergistically improving in terms of economic benefits, escalating ecological conflict poses a significant challenge to high-quality economic growth. Serving as China’s largest port cluster, port operations in the YRD consume plenty of fossil energy [8] and emit large amounts of greenhouse gases and particulate matter [9]. The pollution emissions from ships account for 47.84% of China’s three major port clusters [10], affecting urban air quality and the respiratory health of residents of the YRD [11]. Furthermore, the rapid industrialization and urbanization of the YRD city cluster has also exacerbated energy consumption and ecological damage [12]. This contradicts the goal of high-quality and high-efficiency construction of the urban economy and hinders the port cluster’s low-carbon transition. In response to these pressing challenges, the Outline of the Yangtze River Delta Regional Integration Development Plan explicitly set out the principles of synergistic environmental management and adherence to green development in December 2019. Consequently, green development has become a critical requirement for the low-carbon transformation of ports, the high-quality development of port cities, and coordinated development between ports and cities.
In summary, green development introduces a new perspective for examining the coordination relationship between the port and the city. It will provide data support for further coordinated development policies of the YRD through reconstructing the PEE and HED evaluation indicators, considering environmental performance, and systematically evaluating the spatial–temporal evolution characteristics of CCD between ports and cities.
2. Literature Review
2.1. Port Environmental Efficiency
Ports serve as the land and water transport intersection, equipped with multifaceted facilities for ship access, berthing, and passenger and cargo transport [13]. Previous papers have explored the technical [14] and operational [15] efficiency of ports in depth. With the popularization of the green development concept, the goal of port upgrading and transformation has become to pursue low energy consumption, low carbon emissions, efficient use of resources, and environmental friendliness [16]. Subsequently, essays on pollution emission measurement [17], emission reduction pathways [18], and green port evaluation [19] have been developed. Aligned with the guiding principles espoused by influential entities such as the Organization for Economic Co-operation and Development (OECD) [20], environmental efficiency is conceptualized as the ratio of the value of products and services obtained by an economy in its production and operation process to the input of production and operation and environmental pollution factors. It measures both economic and environmental efficiency and has become a standard for measuring the efficient allocation of resources. Therefore, PEE reflects the economic value generated per unit of environmental load during the production and operation process of ports, which is a characterization of a port’s overall competitiveness [21].
SFA and DEA models are the most commonly used methods in efficiency analysis [22]. Since the DEA model does not require setting a specific functional form, it is more suitable for analyzing multiple inputs and outputs [23]. Wang et al. [24] measured the efficiency of 18 ports in China using a DEA model based on a “game and cooperation” development framework. With China entering the stage of green development, environmental efficiency has become an essential part of port efficiency research. Chin and Low [25] were the first to consider environmental factors in measuring port efficiency. The SBM model, which considers the undesired outputs, has gradually become the mainstream method for studying PEE. Hsu and Huynh [26] explored the PEE evaluation of 12 container terminals in Vietnam by applying SBM models, considering CO2 as undesirable output. Li et al. [27] measured the PEE in China’s Bohai Sea Rim using SBM models. The window SBM model was further employed to analyze the dynamic evolution of environmental efficiency. Nodin et al. [28] examined the efficiency of rice self-sufficiency in Malaysia based on a windowed SBM model. Mamghaderi et al. [29] measured the dynamic environmental performance of 27 OECD countries by using the window SBM model.
2.2. High-Quality Urban Economic Development
HED is constructed under the concept of green development, serving as a comprehensive indicator to measure the sustainable development of various aspects of the urban economy, society, and environment [30]. The economic volume, green technology spillover, and innovative talent cultivation of port cities are the fundamental stones of low-carbon port development.
The existing literature has elaborated HED in multiple dimensions [31]. Most scholars agree that urbanization development, economic growth, and environmental quality are the cornerstones of urban development [32]. With the gradual completion of urban functions, the concept of HED has been gradually extended to three aspects: economic development, quality of life, and ecological environment [33]. Subsequent studies in the literature have successively incorporated social governance, resource utilization, ecological environment, cultural construction, livelihood, and innovation efficiency into the concept of HED [34]. Research methods have focused on principal component analysis [35], the expert survey method [36], and the entropy power method [37]. The New Development Concept encompasses five aspects: innovation, greenness, coordination, openness, and sharing, which represent urban development dynamics, harmony between humanity and nature, balanced development, internal and external linkages, and social justice. It covers economic growth points, which is more in line with the current situation of China’s green and high-quality development [38]. Zha et al. [39] used EW-TOPSIS to investigate the development characteristics of HED of the significant city clusters in the Yangtze River Economic Belt. Guo and Sun [40] added economic development indexes to measure the HED of 30 provinces in China.
2.3. Synergistic Effect of Port and Urban Economics
Ports and port cities are an organic whole linked by geographic location. Functioning as pivotal logistics hubs, ports play a dual role by supplying global raw materials [41] and promoting cities’ integration into the global industrial chain [42], thus realizing urban commercial service value [43]. Simultaneously, benefiting from the absorptive capacity of ports for productivity factors such as technology, information, and capital, industries like shipping services [44] and bonding [45] are gathering at the borders of ports. This eases urban employment pressure [46] and also strengthens the connection between cities and ports, promoting regional port–city integration. Port cities have a feedback mechanism for ports as well. The cities provide the operational spaces of ports, and their outputs are also related to the economic volume and openness of cities. With the rapid development of the tertiary industry, the support of the advanced management system, green technology overflow, and talent cultivation of the cities are more obvious in the construction of ports. However, it is not sustainable for ports and cities to develop in the traditional way characterized by high pollution and high energy consumption. Negative environmental impacts from ports’ production activities can cause serious damage to the ecological environment of port cities; the deterioration of the ecological environment of port cities is detrimental to the survival and development of human beings and ultimately limits the future development of ports. Therefore, modern, high-quality port–city relations require adherence to the direction of green development and the reduction in negative environmental externalities caused by the production of economic agents.
The existing literature has explored the synergistic effect of port and urban development in a quantitative manner. Most documents have measured port–city interactions by constructing evaluation systems. Wang et al. [47] took Lianyungang as an example and built a land–sea coordinated development evaluation system from three aspects of port cities, marine resources, and ports. Guo et al. [48] used a dynamic centralization index to estimate port–city relationships and identify port–city interaction patterns in major coastal port cities in China. Ma et al. [49] measured the integration degree of Chinese ports by the port integration index and conducted a comparative analysis between the YRD and the Bohai Sea Rim. Some of the literature draws on case studies for research. Vroomans et al. [50] took the ports of Hamburg, Antwerp, and Rotterdam as examples and showed that shared values enhance the integration of ports and cities. Russo and Musolino [51] explored port–city relationships in Antwerp, Trieste, Santander, and Algeciras in a transportation system model context. Only a few scholars have used the CCD model to discuss port–city synergistic effects. Liu et al. [52] measured port–city interactions in Liaoning. Guo and Qin [53] constructed a port–city network system to evaluate the theoretical framework and measurement methods of port–city synergistic relationships from the perspective of mobility space.
In summary, the existing literature has researched PEE and HED, but more discussion is needed still. Firstly, the green development concept puts higher demands on the port–city coordination relationship in the YRD, and the related literature should be supplemented. Secondly, the traditional DEA model cannot accurately assess the dynamic changes in PEE in the YRD, and the green dimension should be added to the HED measures to comprehensively assess the level of the urban economy. Ports and cities are interdependent and should be integrated into a system to explore their interaction. Therefore, this article further analyzes the spatial–temporal dynamic evolution of CCD between PEE and HED of the YRD from the green development concept and then makes reasonable predictions to provide data support for the formulation of further coordinated development policies in the YRD. The marginal contribution lies in the following: (1) In terms of research perspective, the existing literature mainly considers the economic performance of port efficiency and urban economic development. This paper explores PEE and HED based on the green development perspective, making up for the existing literature’s having ignored environmental efficiency. (2) The traditional PEE and HED measurements have ignored the environmental impact indicators in constructing indicators. This paper adds carbon emission indicators to PEE evaluation, and green dimensions are constructed in the HED evaluation system to compensate for the shortcomings of ignoring environmental factors. (3) Regarding model selection, the window SBM model is used instead of the traditional SBM model to reflect the dynamic development of PEE. The CCD model is also more capable of analyzing the dynamic association of CCD between PEE and HED from a whole perspective than linear regression. The grey prediction model is used to scientifically predict the CCD of the YRD, which assists the port–city coordinated development in the YRD by putting forward reasonable suggestions.
3. Materials and Methods
3.1. Model
3.1.1. Window SBM Model
The SBM model is a non-parametric technical efficiency analysis model for comparing multiple decision-making units (DMUs) based on considering slack variables and non-expected outputs [54]. The window DEA is based on the principle of the moving average; it treats the same assessed object in different periods as separate DMUs and then selects different reference sets for efficiency calculations by moving the window [55]. Therefore, this paper adopted the SBM model of the window DEA to better reflect the time variation in DMUs. Additionally, the method enhances the identification of differences in the efficiency values of decision-making units by expanding the DMUs.
Referring to the extant literature [56], the window width d = 3 was selected.
The model is defined as follows:
3.1.2. Entropy Weight and TOPSIS (EW-TOPSIS)
The entropy weight method determines the weight of each indicator through the amount of information reflected in the degree of data variability, which reduces the interference of subjective factors caused by artificial assignment. The TOPSIS method ranks quantitatively by comparing the relative distance of each measurement object with the optimal and the worst solutions, with the advantages of simple calculation and reasonable results. In this paper, the EW-TOPSIS model was selected to measure HED.
Firstly, determine the positive and negative ideal solutions of the evaluation indicators.
Then, calculate the distance between the indicator to its positive and negative ideal solutions in different years, and .
Finally, calculate the relative fitness of the evaluation object and the optimal scheme .
The value represents the HED, and the calculation results can be used for ranking different provinces.
3.1.3. Coupling Coordination Degree Model
Coupling reflects two systems’ degree of interdependence and constraints, the degree of interaction between two systems; coordination measures the virtuous cooperation between two systems [57]. Using the CCD model to explore the coordination level is more consistent with the synergistic relationship between PEE and HED.
where and respectively represent the PEE and HED; is coupling degree, is CCD; is a composite evaluation index between the two systems; and and are the weight coefficient. This study assumes that PEE and HED are equally important [58], so . The classification of CCD is shown in Table 1.

Table 1.
Classification of CCD.
3.1.4. Grey Prediction Model
The grey system theory indicates that complex system data complexity must also have the overall function and the inherent development of the law. It can effectively predict future data through correlation analysis of the degree of difference in trends among system factors with a small sample size and weak data regularity [59]. This paper used this model to forecast the CCD between PEE and HED in the YRD from 2022 to 2026.
Firstly, assume that the time series consists of n observations, and perform a cumulative productive series, . The corresponding differential equation for the GM (1.1) model is:
where is the developmental ash number and is the endogenous control ash number.
Then, assuming that is the parameter vector to be estimated, ; then, the least squares method can be used to solve and solve the differential equations to obtain the prediction model:
3.2. Index System Construction
Following the data requirements of the DEA window model and considering the characteristics of the port industry, the article selected the number of terminals and the length of berths as input variables to reflect the production and service capacity of the port and selected cargo throughput and container throughput as desired output variables to reflect the capacity of the port. In addition, based on the requirements of China’s green development and the dual-carbon background, port carbon emissions were taken as the non-desired output. The PEE measurement indicators are presented in Table 2.
Table 2.
Indicator system for PEE in ports.
The New Development Concept brings green development to the fore of the national development strategy, which is of great guiding significance for China’s high-quality construction. Therefore, the evaluation index system of HED was constructed from the New Development Concept of innovation, coordination, greenness, openness, and sharing [60]. It is presented in Table 3.
Table 3.
Indicator system for HED in port cities.
3.3. Data Sources
The YRD, located at north latitude 27°12′–35°20′ N and east longitude 114°54′–122°12′ E, covers a total area of 358,000 square kilometers. It is positioned in the lower reaches of the Yangtze River, bordering the central region to the west and the Yellow Sea, the East China Sea, and the Pacific Ocean to the east. The region features flat land, and the terrain slopes from southwest to northeast. According to the Outline of the Plan for the Integrated Development of the Yangtze River Delta Region [61] approved by the State Council of the PRC, the YRD contains four provincial-level administrative units, Shanghai, Jiangsu, Anhui, and Zhejiang, and 41 municipal-level administrative units. Based on data availability, this paper selected the data of 20 major ports and port cities (Figure 1) in the YRD for 2012–2021. The indicator data of PEE were obtained from the China Urban Statistical Yearbook and the China Port Yearbook. The indicator data of HED came from the China Urban Statistical Yearbook, the Statistical Yearbooks of each port city, and the statistical bulletin of national economic and social development of previous years. Individual missing data were filled in by linear interpolation. Data on the administrative divisions of the YRD and the Yangtze River system in Figure 1 were obtained from the Resource and Environmental Science and Data Centre, Chinese Academy of Sciences (https://www.resdc.cn/; accessed on 13 August 2023).
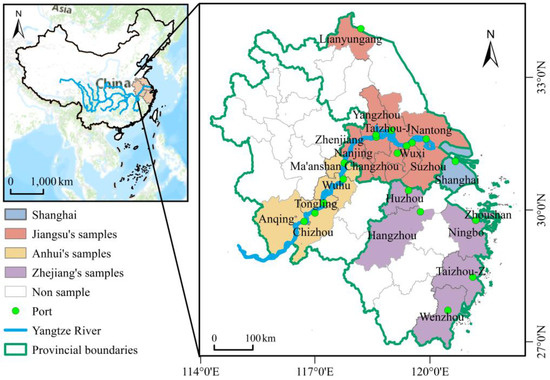
Figure 1.
Twenty ports and their hinterlands in the YRD.
4. Results
4.1. Comprehensive Evaluation of PEE and HED
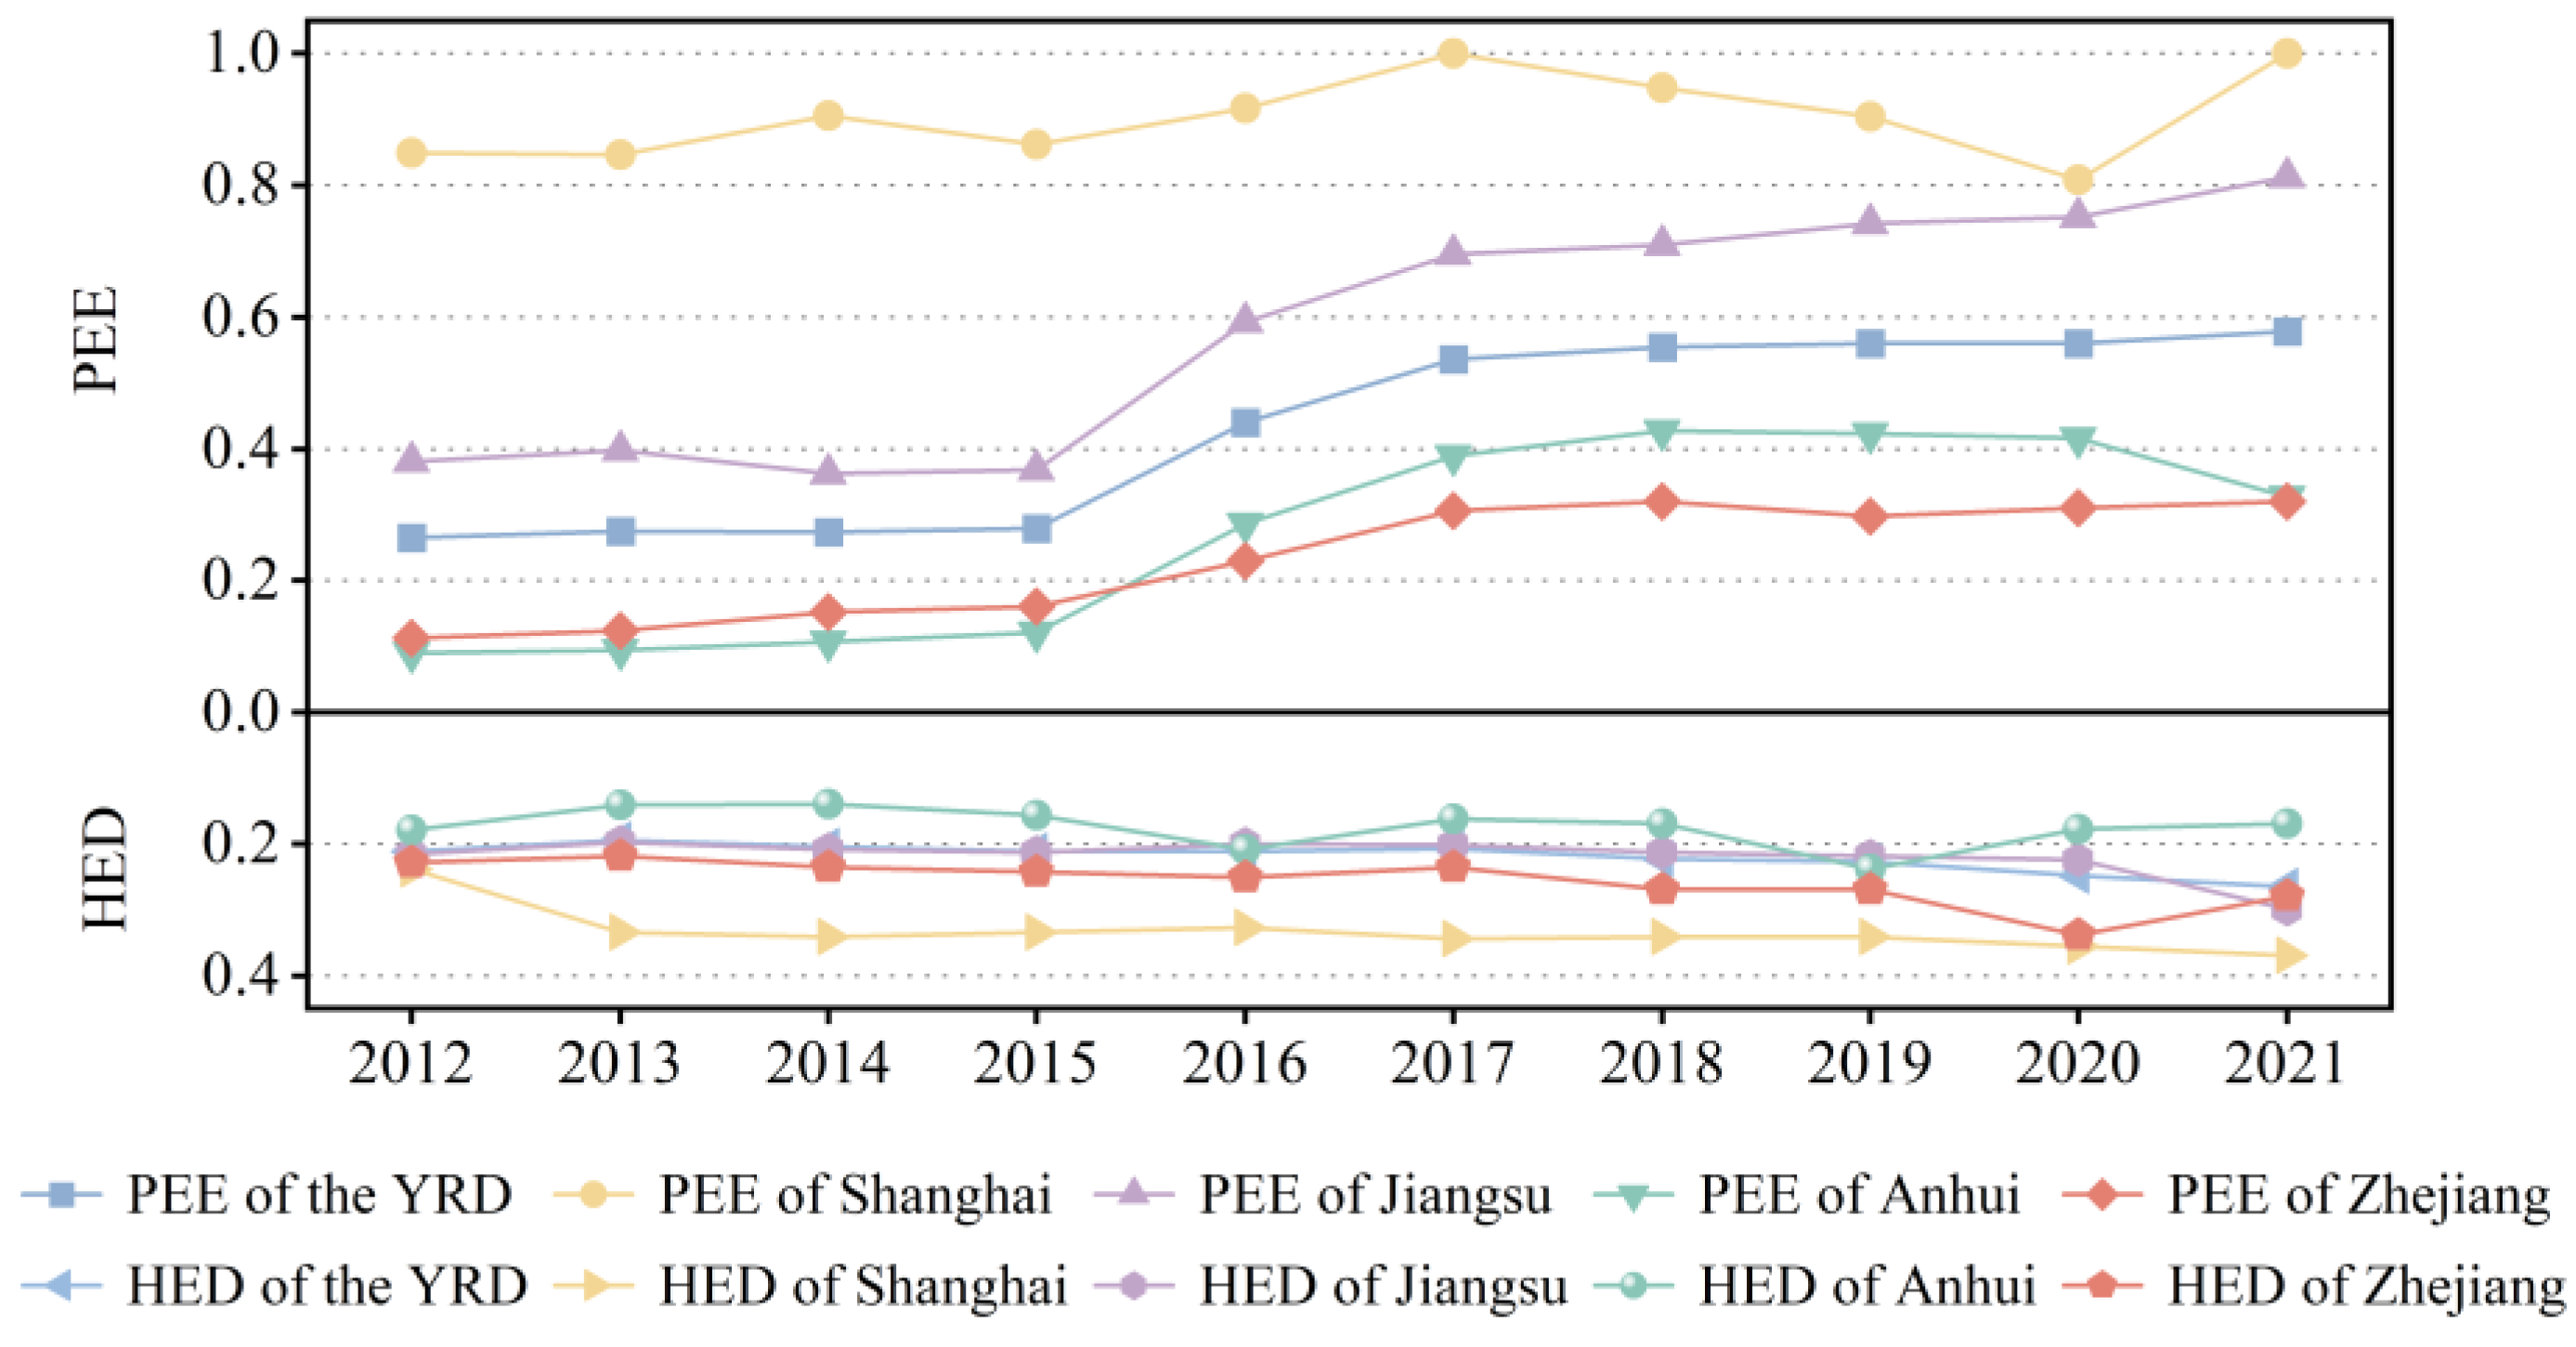
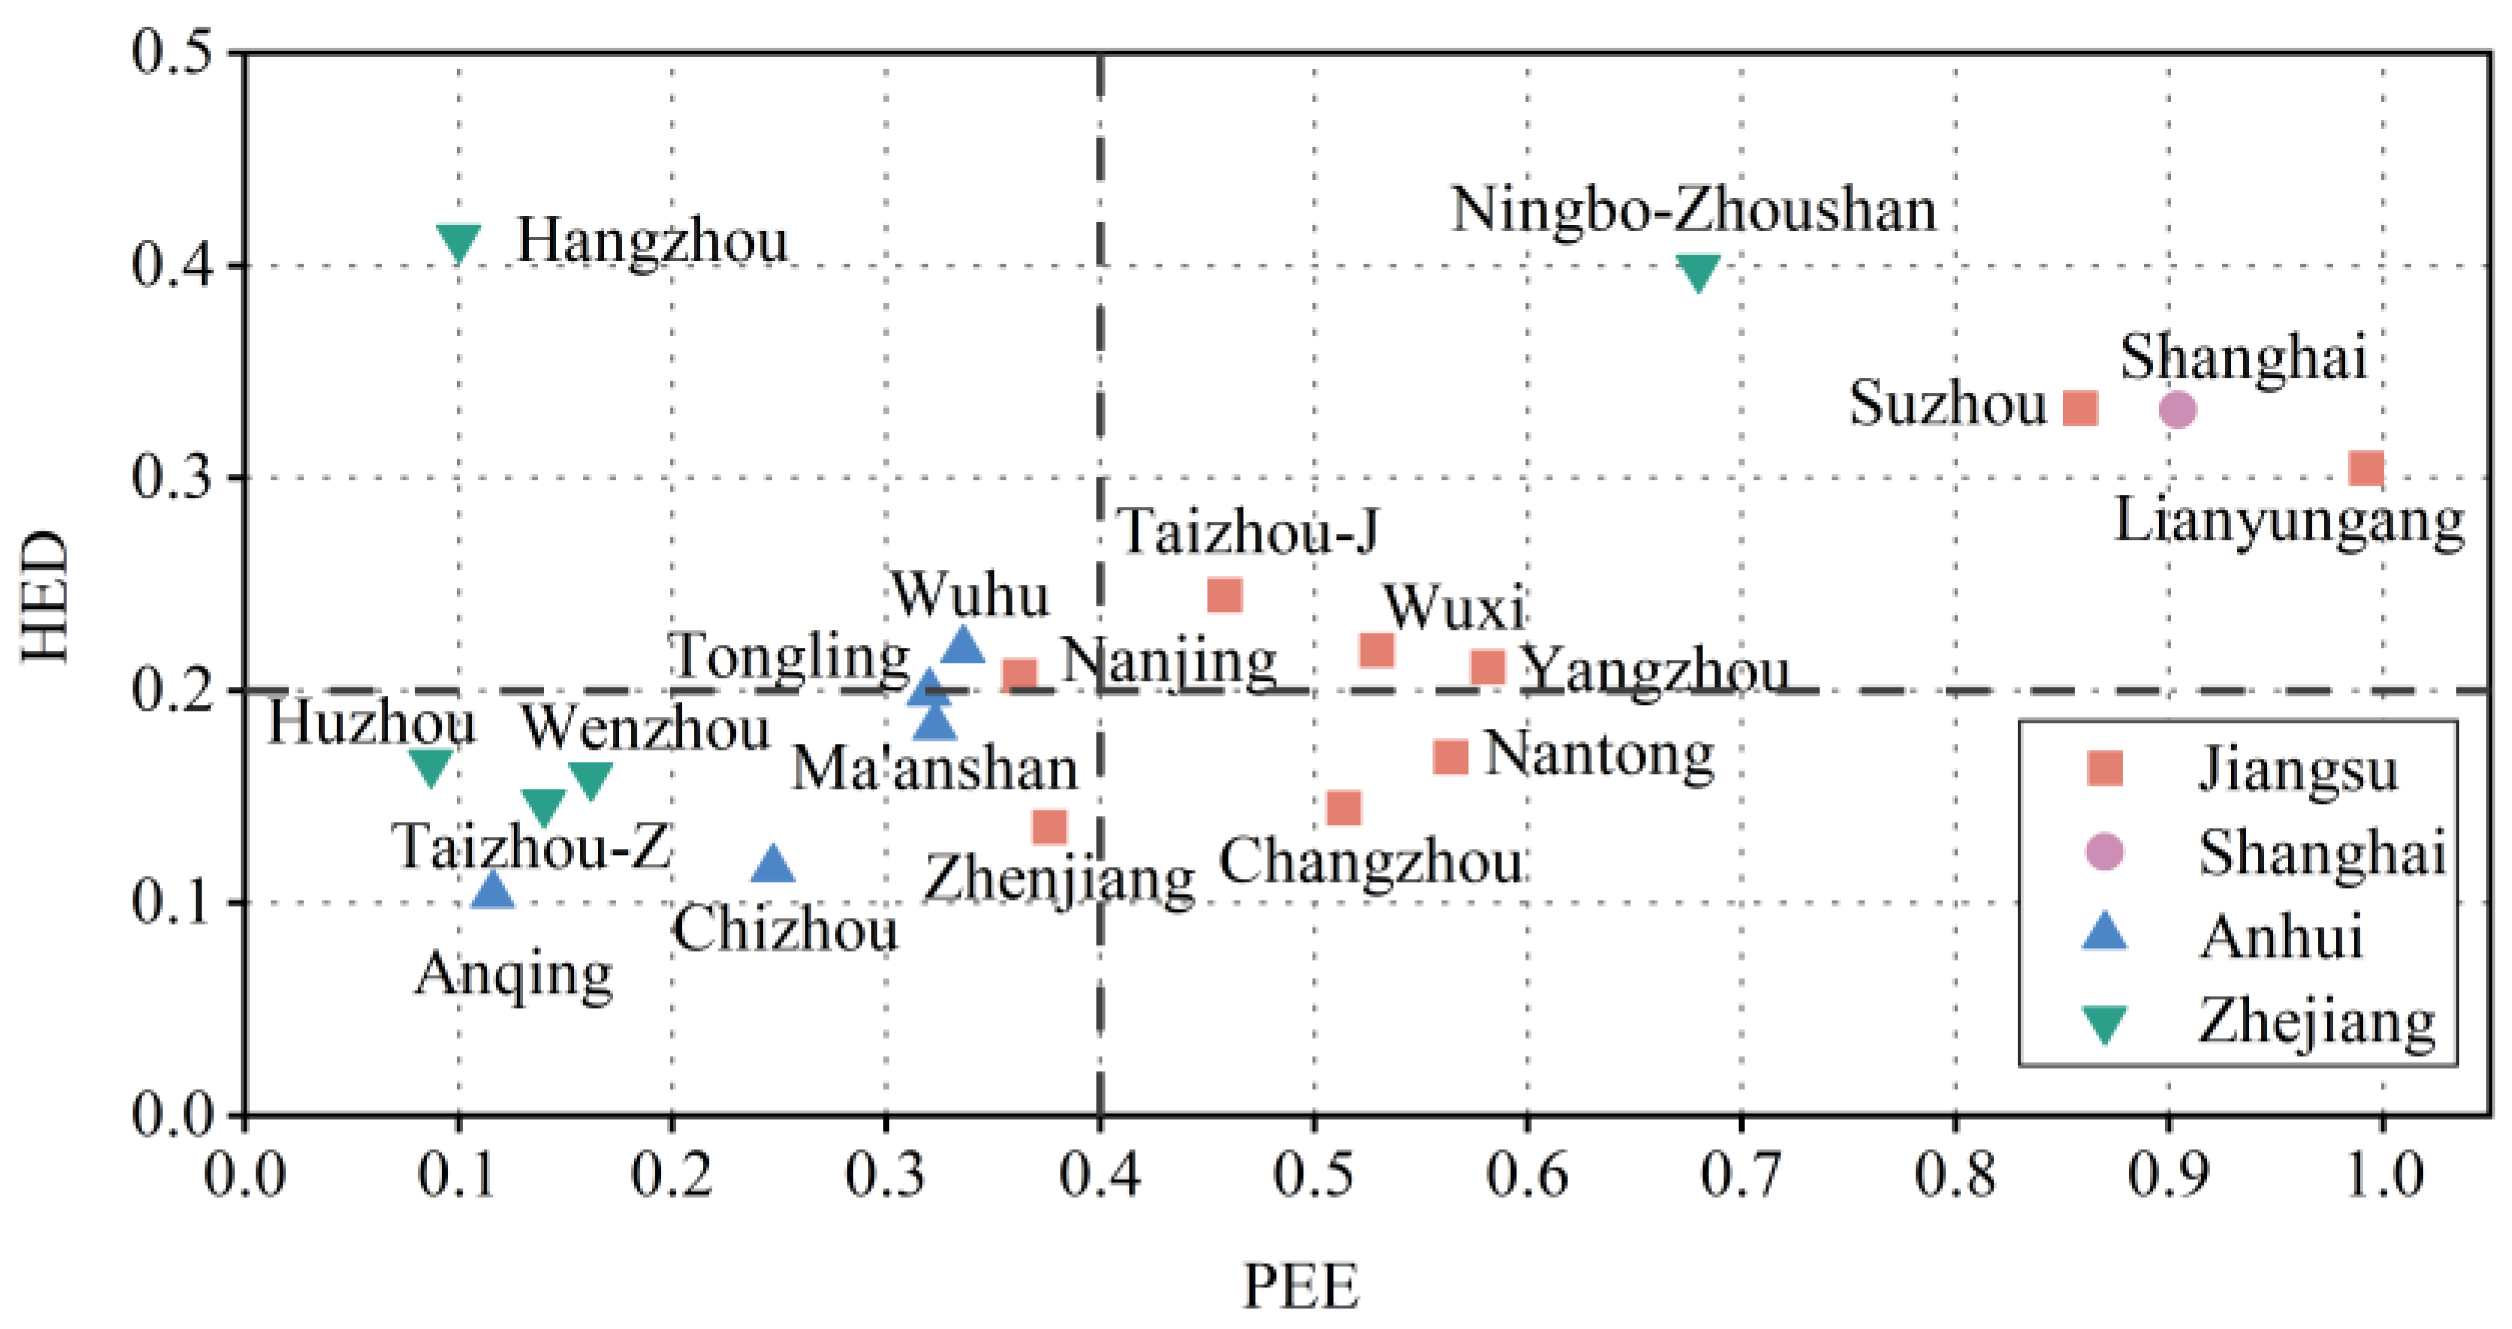
The window SBM and EW-TOPSIS models were applied to measure the PEE and HED of the YRD from 2012 to 2021. The temporal trends at the provincial level are shown in Figure 2. Using 0.4 and 0.2 as the PEE and HED dividing lines, the four-image distribution of the 20 port cities was plotted (Figure 3).
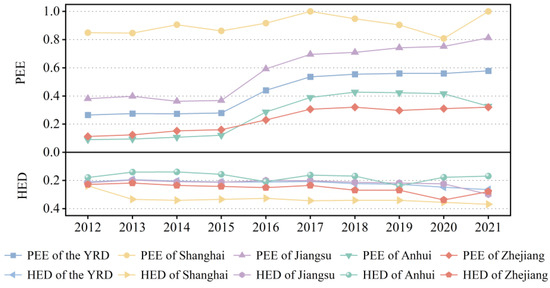
Figure 2.
Time evolution of PEE and HED in the YRD from 2012 to 2021.

Figure 3.
Average PEE and HED of twenty port cities from 2012 to 2021.
The overall PEE of the YRD grew from 0.265 to 0.578 from 2012 to 2021, with an average annual growth rate of 9%. The PEE showed a significant improvement in 2016. In 2015, the Ministry of Transport issued The Opinions on Comprehensively Deepening the Reform of Transportation. The document puts forward a series of requirements, including energy-saving supervision, promotion of emission reduction technologies, and construction of green recycling systems. Since then, the YRD has continued to embark on intensified efforts to bolster vessel emissions management and accelerate the adoption of shore power and clean energy sources. The YRD’s PEE has failed to exceed 0.6 each year, which suggests that the ports have significant room for progress in implementing green coordinated development and reducing carbon emissions. Jiangsu carried out a deep-water channel project in 2016, which greatly liberated the capacity of the lower reaches of the Yangtze River, with Jiangsu boasting the fastest PEE growth rate. Among the 20 ports, coastal ports such as Lianyungang Port, Shanghai Port, Suzhou Port, and Ningbo-Zhoushan Port are at the forefront of PEE. Inland river ports, especially Huzhou Port, Hangzhou Port, and Anqing Port, on the other hand, have a weaker performance.
From 2012 to 2021, the HED increased from 0.211 to 0.265, with robust development momentum. Spatially, it shows regional solid imbalances and increasing inter-provincial disparities. Shanghai’s HED consistently maintained the highest level in the YRD, with an increase of 55% in the past ten years. Positioned as the national economic center, Shanghai exerts a strong agglomeration effect regarding innovative resources, high-end industries, and high-quality talents. Meanwhile, Shanghai has continuously increased investment in the ecological environment, putting its HED significantly ahead of that of the surrounding provinces and cities. The polarization of HED in Zhejiang is extremely serious. This discrepancy can be attributed to the geographical constraints faced by southern Zhejiang, which is confined to a narrow plain area less conducive to accommodating large-scale industries. Conversely, northern Zhejiang penetrates deep into the core region of the YRD, fostering close economic and industrial ties with Shanghai and southern Jiangsu. This has further widened the developmental gap again. Anhui, being the sole non-coastal entity in the YRD, did not fully integrate into the YRD until 2019. Consequently, the HED of Anhui is relatively low. Except for Wuhu, all the other cities rank in the bottom ten.
4.2. Measurement Results for CCD between PEE and HED
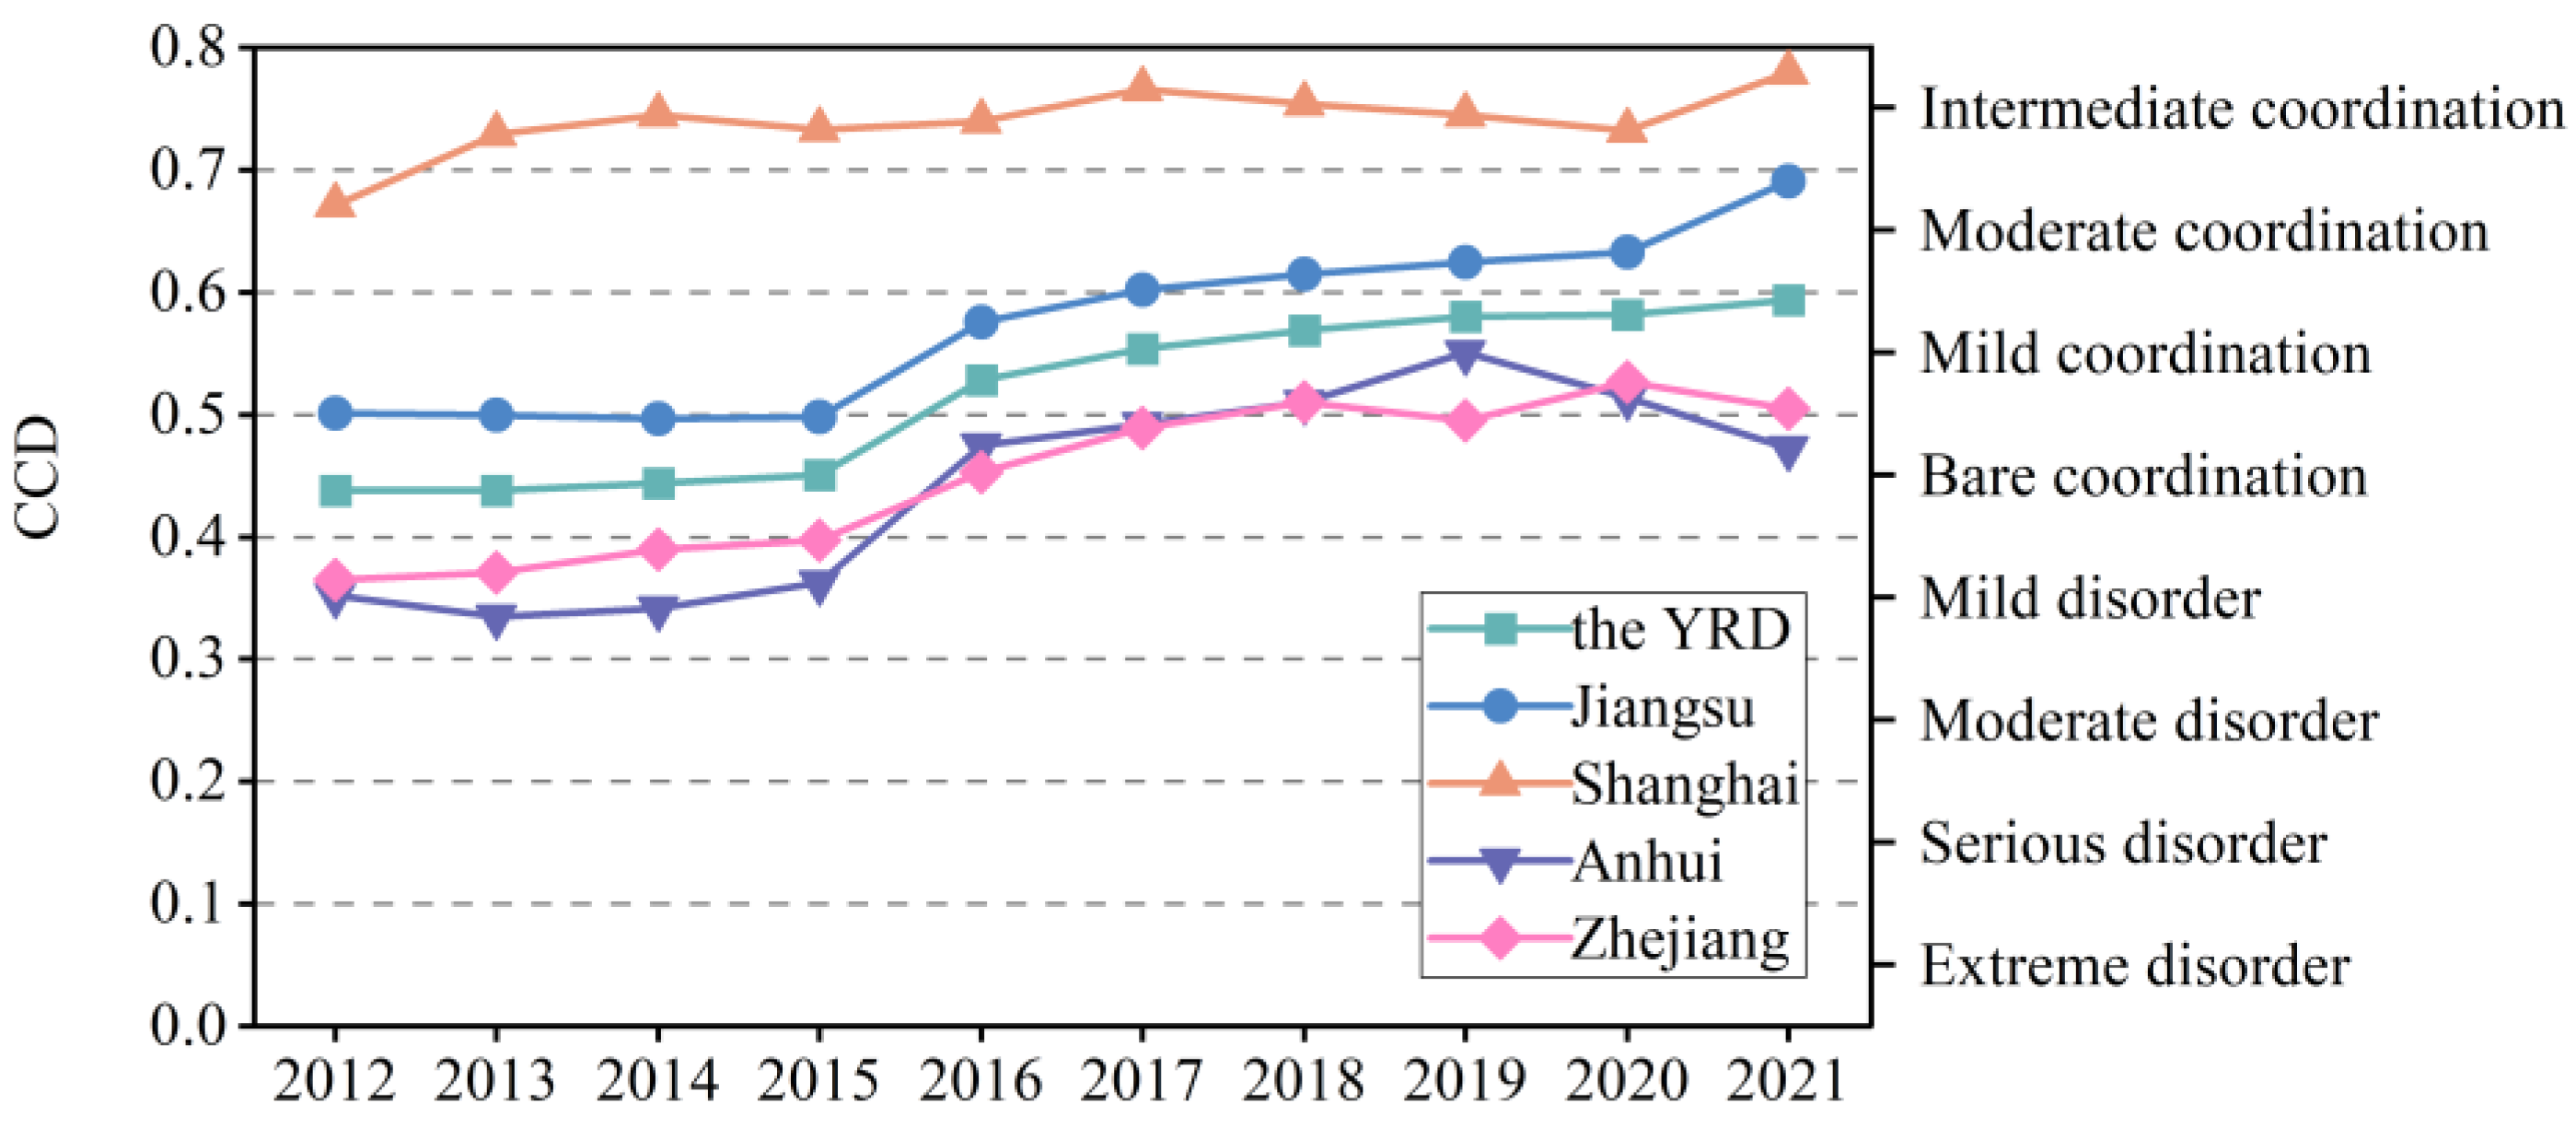
The CCD between PEE and HED in the YRD from 2012 to 2021 is shown in Figure 4. In 2016, the CCD within the YRD experienced a notable 18% increase, marking a transition from bare coordination to mild coordination. This development can be primarily attributed to the implementation of green port construction. The adoption of clean energy and breakthroughs in grid-connected shore power technology have greatly reduced the emission of sulfur dioxide and nitrogen oxides in ports and enhanced the PEE of ports while greatly improving the environment of port cities.
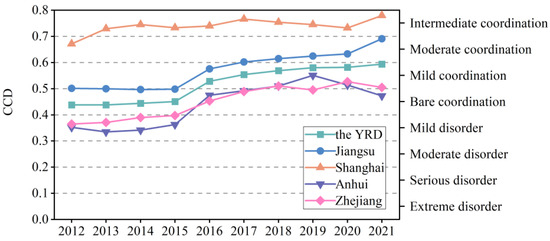
Figure 4.
Time evolution of CCD of the YRD from 2012 to 2021.
At the provincial level, Shanghai has consistently maintained an intermediate coordination level. Jiangsu follows closely, with 38% progress in CCD. The coordination level of Zhejiang and Anhui lags behind the overall level of the YRD, with Zhejiang’s low PEE and Anhui presenting ample room for improvement in HED. The difference in CCD among the four provinces in the YRD shows a trend of narrowing first and then widening. The outbreak of COVID-19 in 2020 dealt a severe blow to foreign trade and green technological innovation in China’s ports and blocked the development of the urban economy, disrupting the YRD’s upward trend in harmonization.
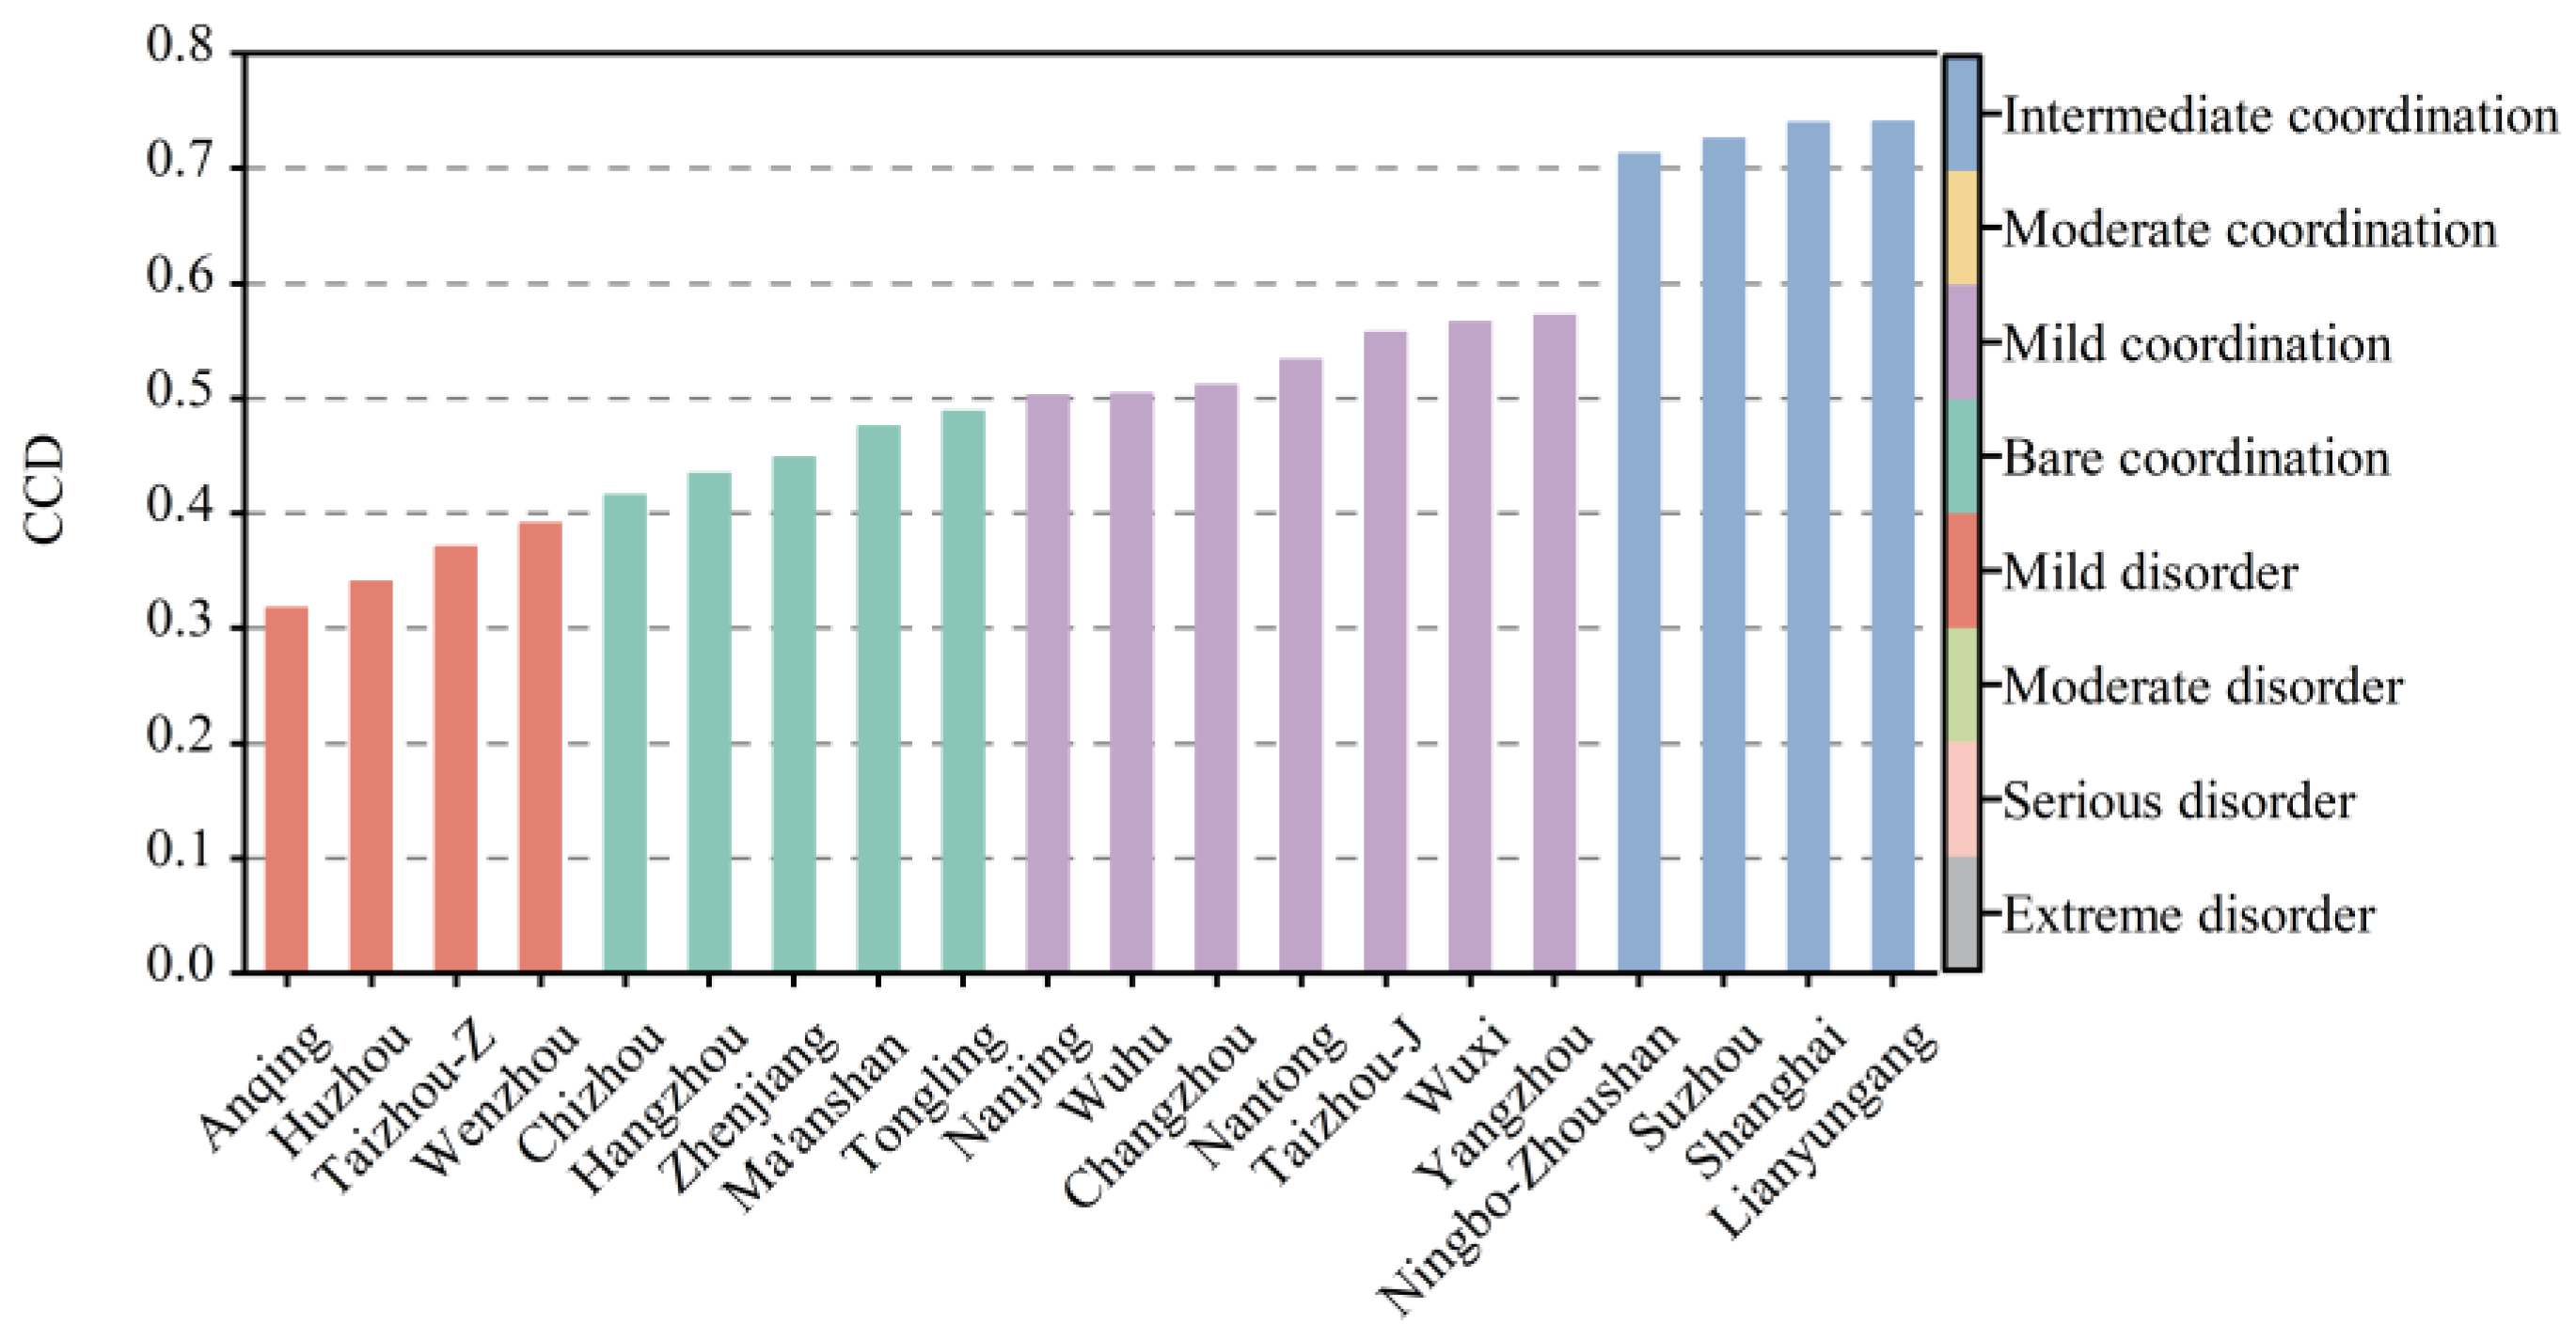
Figure 5 displays the CCD for twenty port cities in the YRD from 2012 to 2021. The average coordination level of most port cities is concentrated in bare coordination and mild coordination, showing a spindle shape. The proportion of port cities in the disordered development stage is 45%, and no city reaches good coordination. Lianyungang, Shanghai, Suzhou, and Ningbo-Zhoushan have reached intermediate coordination. The ports in these major cities are closely linked to the cities’ economies, with important mutual symbiotics. In contrast, Anqing, Huzhou, Taizhou, and Wenzhou are constrained by their relatively remote locations and weak hinterland economies. These cities struggle to provide adequate cargo volumes and lack robust infrastructure support for the ports. The ports in these locales encounter challenges in attracting industrial elements to congregate within the cities, further exacerbating their economic limitations. Regarding regional distribution, the CCD of port–city systems in Zhejiang and Anhui is below 0.5, while in Jiangsu and Zhejiang it is mostly above 0.5.
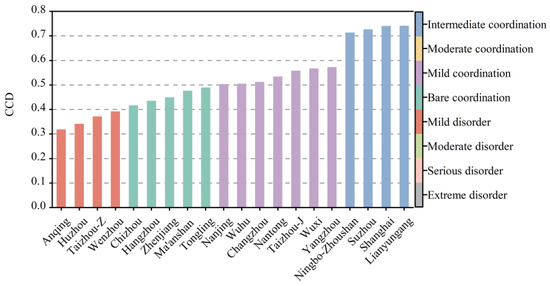
Figure 5.
CCD of twenty port cities in the YRD from 2012 to 2021.
4.3. Spatial Dynamic Evolution of CCD between PEE and HED
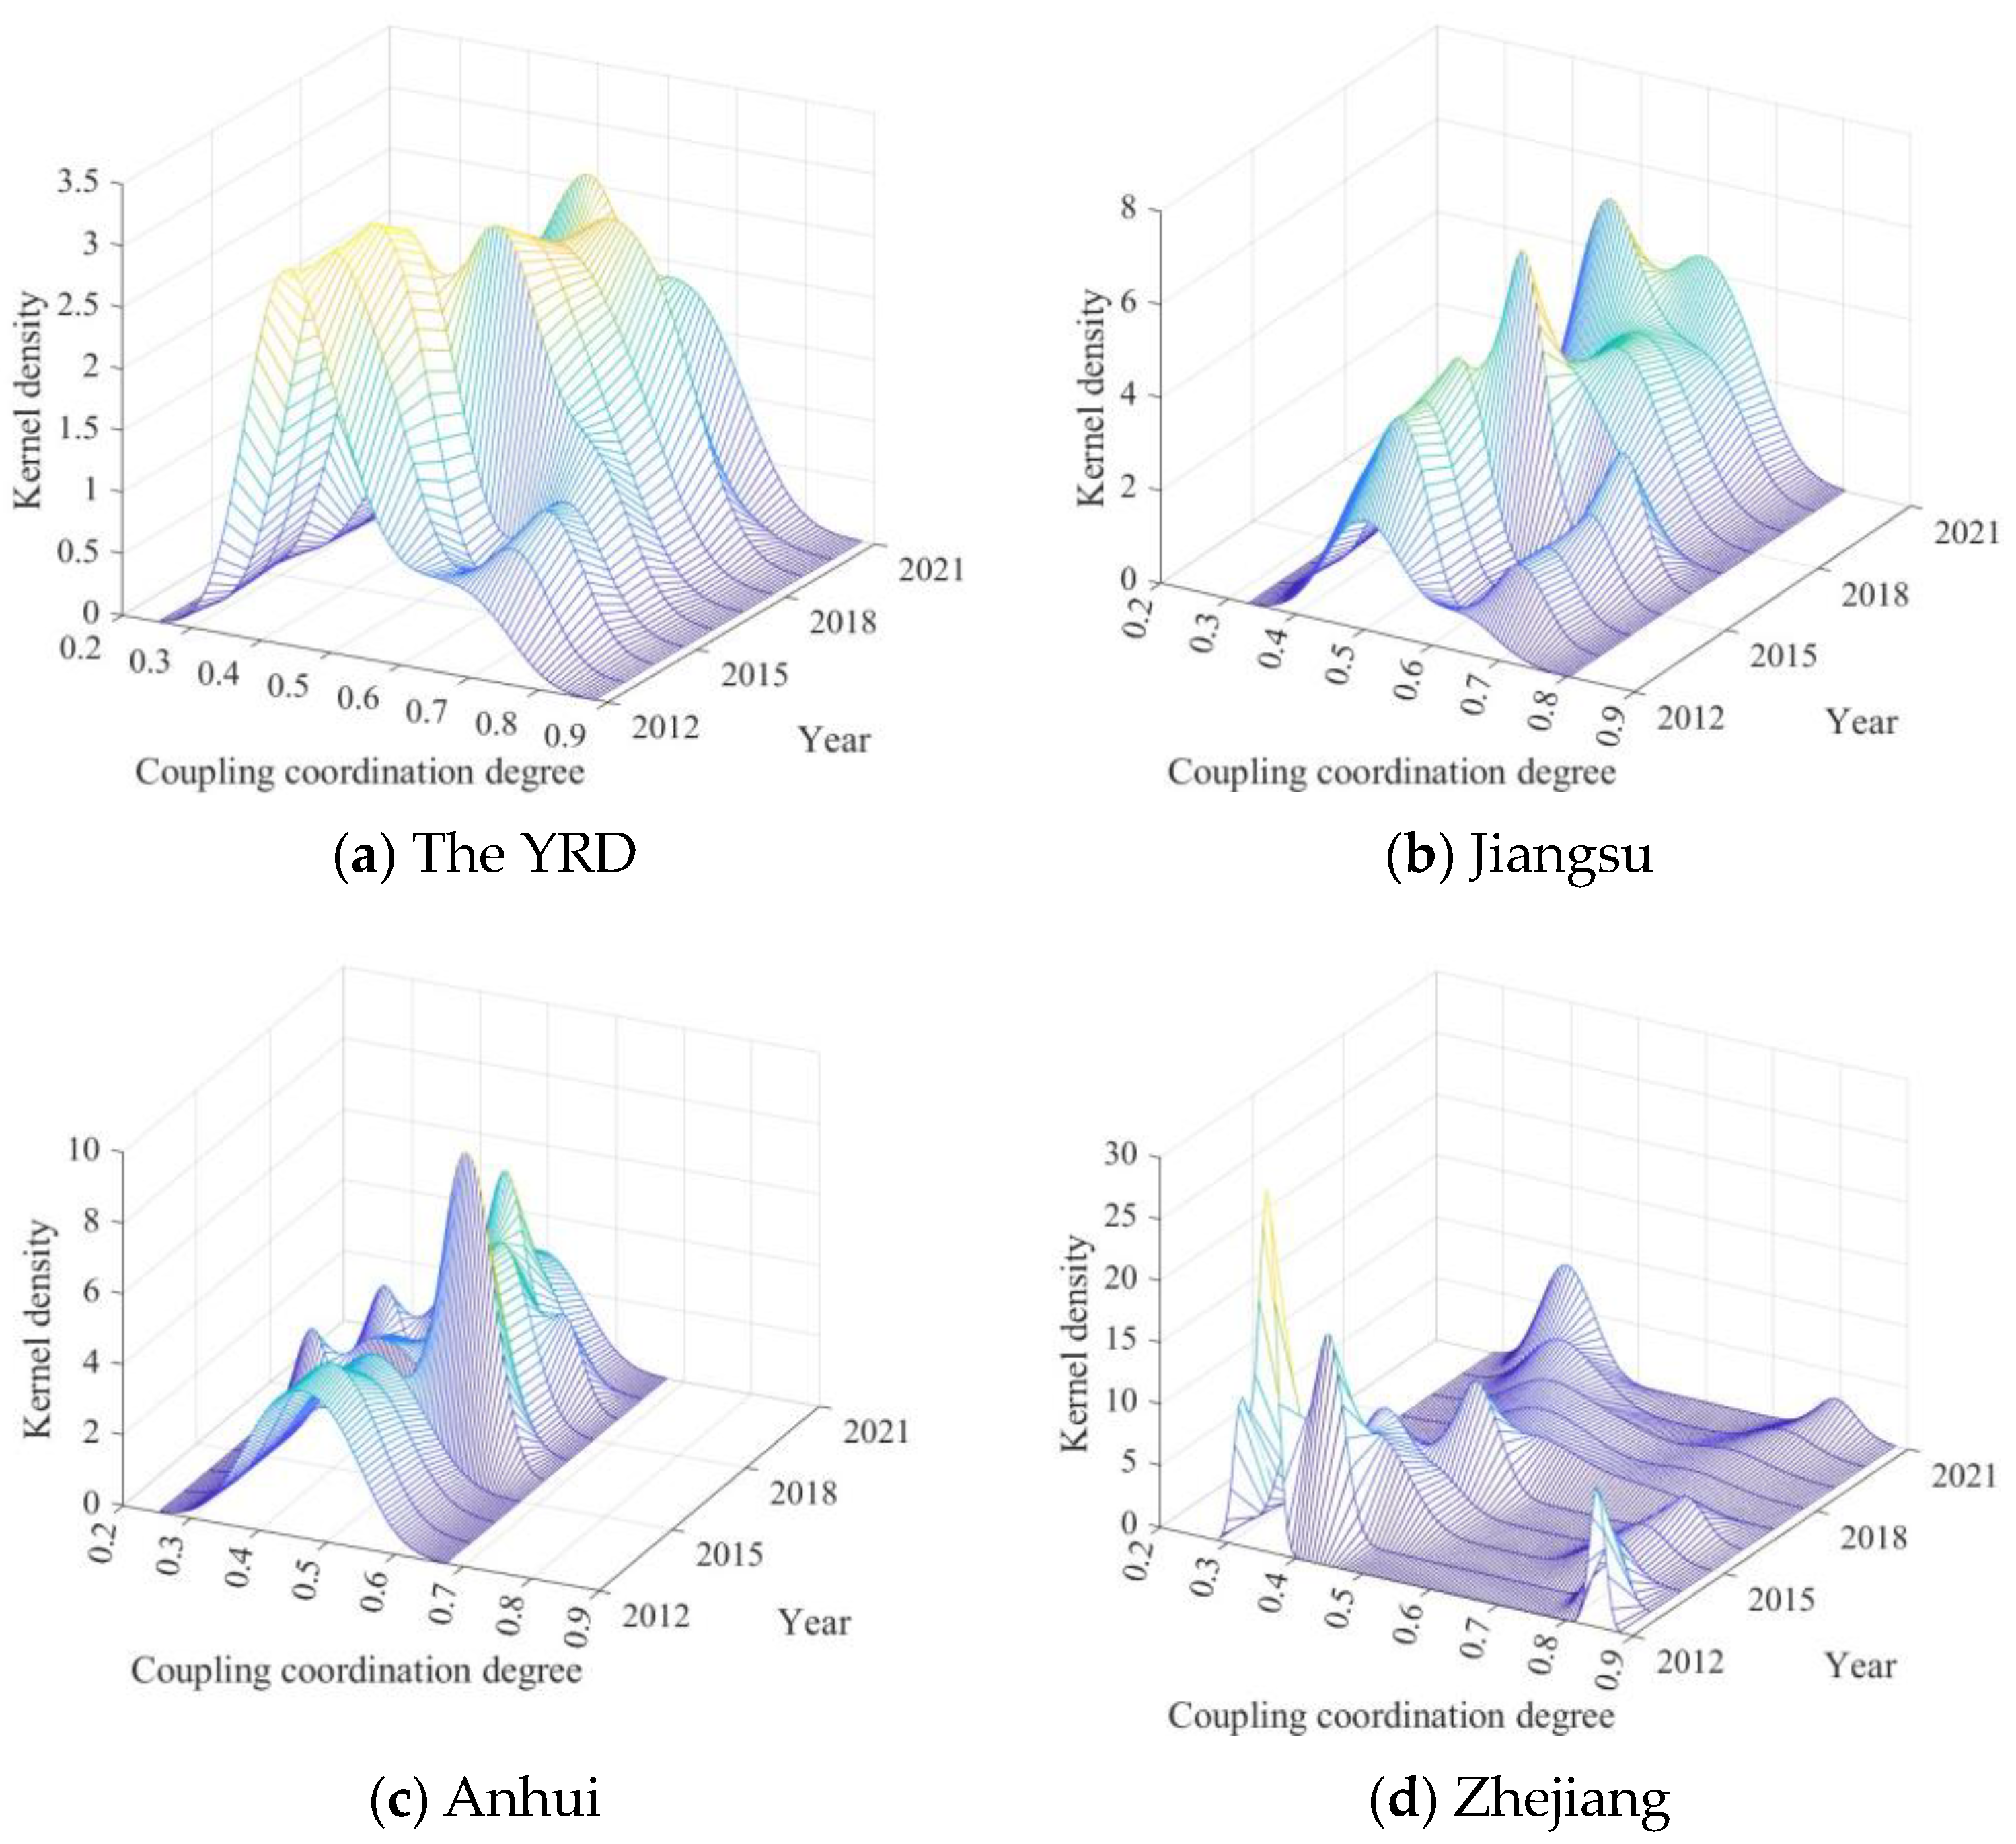
Kernel density estimation is a non-parametric estimation method for estimating probability density functions. Kernel density curves for the YRD from 2012 to 2021 were plotted using kernel density analysis to further reveal the dynamic evolution of the CCD. Since Shanghai has only one port and does not need kernel density analysis, the YRD, Jiangsu, Anhui, and Zhejiang results are reported (Figure 6).
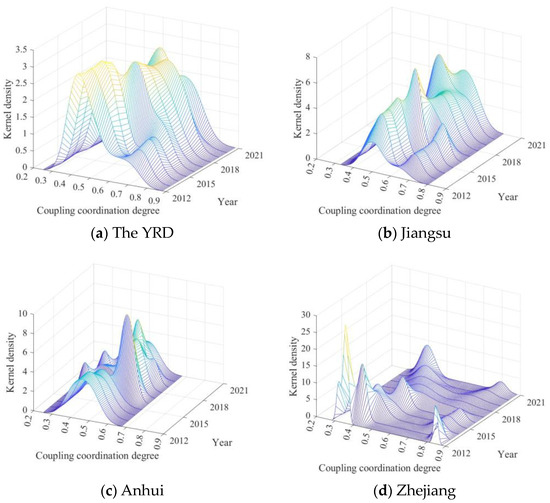
Figure 6.
Kernel density map of CCD in the YRD from 2012 to 2021. (a) CCD of the YRD; (b) CCD of Jiangsu; (c) CCD of Anhui; (d) CCD of Zhejiang.
As shown in Figure 6a, the center line of the kernel density in the YRD is shifted to the right, which shows an overall increase in the CCD. The number of wave peaks turns from multiple to single, and the wave width of the curve narrows, indicating that the CCD multi-polarization in the YRD is gradually weakening.
As shown in Figure 6b, Jiangsu’s kernel density shows a rightward shifting trend. From 2012 to 2016, Suzhou, Lianyungang, and other regions of Jiangsu had significant differences in CCD, with profound polarization and a double-peak pattern of kernel density. The CCD gradually increased after 2016, and the kernel density curve shifted from multiple to single peaks.
Figure 6c shows that Anhui’s CCD kernel density curve is highly chaotic. The median line moves from 0.4 to 0.5, and the coordination level is lower overall. From 2016 to 2019, the CCD of Wuhu and Ma’anshan first showed a considerable enhancement, and the curves appeared to have multiple steep peaks. After 2019, the CCD of Tongling, Chizhou, and Anqing gradually enhanced, the differences between the regions decreased, and the wave peaks shifted to a single peak.
The development of CCD in Zhejiang is shown in Figure 6d. The bimodal pattern runs through the sample period, and the polarization is apparent.
4.4. Spatial–Temporal Differentiation of CCD between PEE and HED
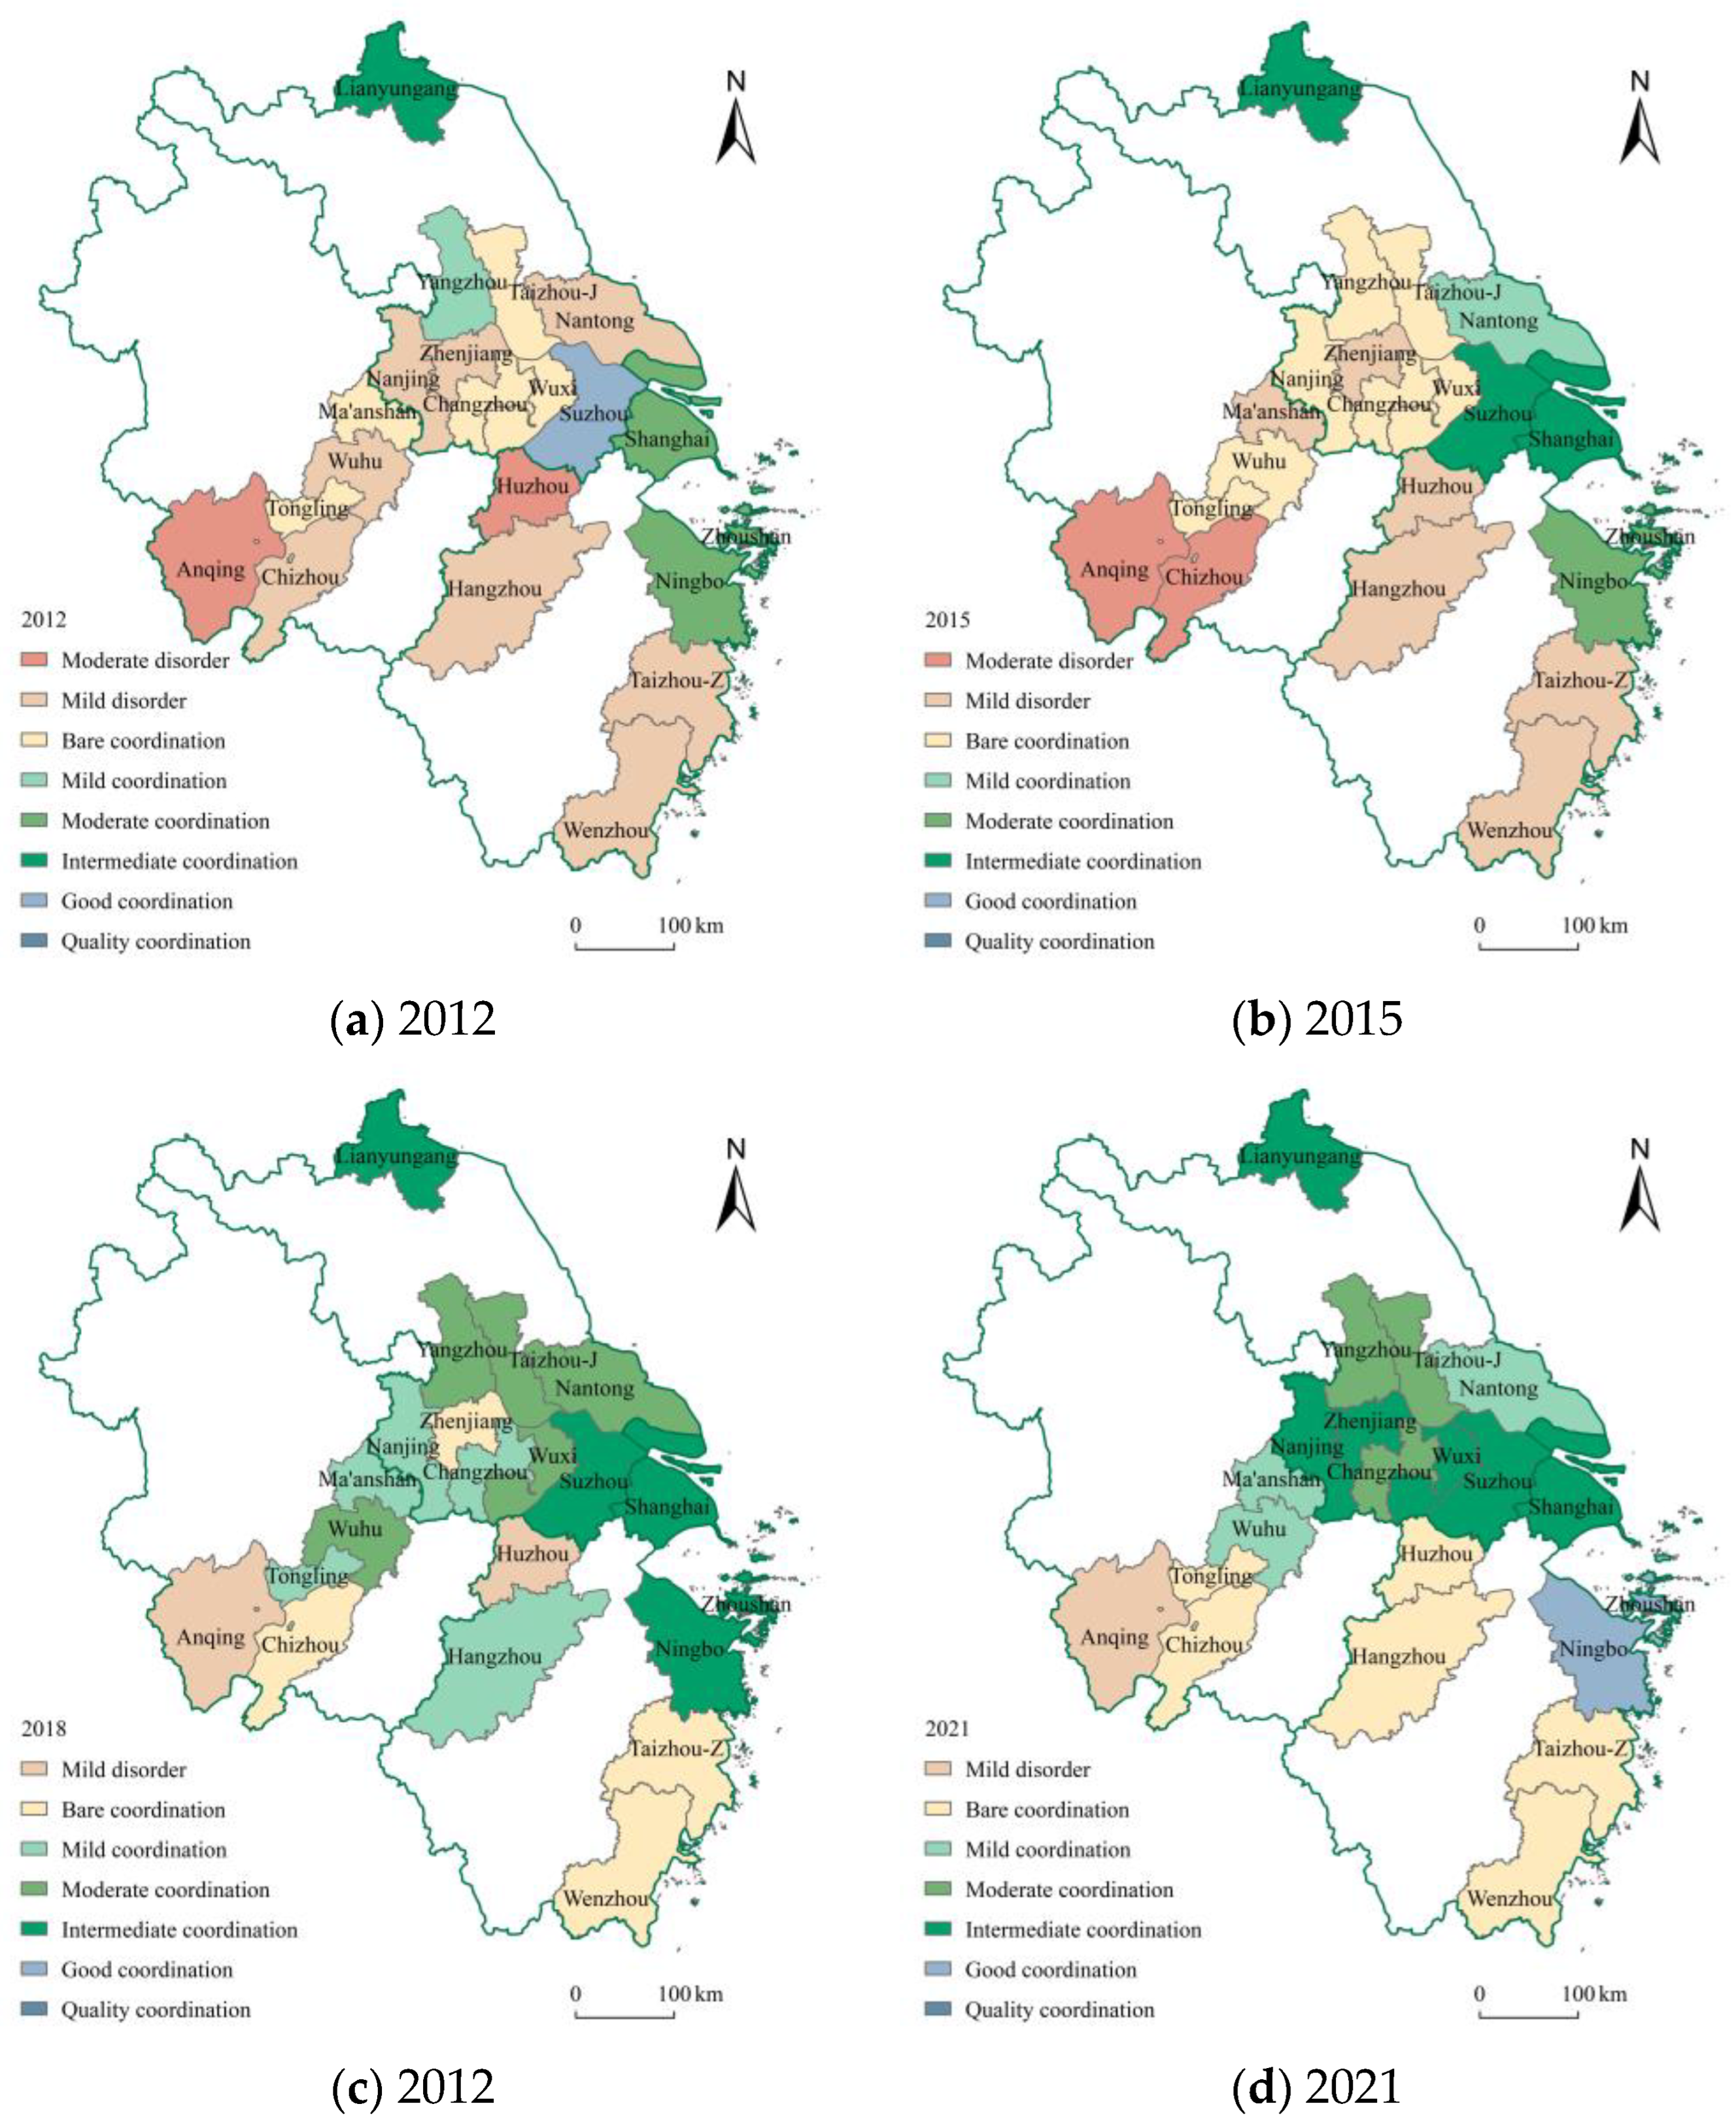
Using ArcGIS spatial visualization technology, Figure 7 displays the spatial distribution of the YRD in 2012, 2015, 2018, and 2021 to present the spatial–temporal differentiation of the CCD.

Figure 7.
Spatial distribution of CCD in the YRD in 2012, 2015, 2018 and 2021.
From the perspective of the YRD as a whole, the number of cities in moderate disorder changes from 2 to 0, while the number of cities in the orderly development stage changes from 5 to 13, indicating that the YRD’s CCD has undergone substantial improvement.
The CCD of the four provinces shows different states of development. Shanghai has maintained an intermediate coordination level since 2013 and is in the leading position in the YRD.
The coordination level in Jiangsu has improved significantly. In 2012, only Yangzhou, Suzhou, and Lianyungang reached the stage of orderly development. After 2016, Jiangsu gradually emphasized the uniqueness of inland ports and conducted meticulous research on inland ports. In 2017, the People’s Government of Jiangsu drew up the first Layout Plan for Inland River Ports in Jiangsu Province (2017–2035), which accurately positioned the development of inland ports. Since then, inland river ports such as Nantong Port and Yangzhou Port have accelerated the pace of intensive, large-scale, and green development. By 2021, all ten port cities in Jiangsu had realized the orderly development stage, realizing a leap from 30% to 100%.
Anhui shows a steady and progressive development. In 2012 and 2015, the five cities in Anhui were all in a disorderly development stage. After 2018, Anhui’s CCD was subject to an enormous spillover from Jiangsu, which led to a steady increase in Wuhu and Ma’anshan. Therefore, the CCD showed a high development trend in the east and a low development trend in the west.
Zhejiang is seriously polarized. Ningbo-Zhoushan is the only location in the YRD to achieve good coordination in 2021. On the other hand, Huzhou, Hangzhou, Taizhou, and Wenzhou are in a disorderly development stage.
4.5. Trend Prediction of CCD between PEE and HED
Based on the grey prediction model, the CCD between PEE and HED in 20 port cities in the YRD from 2022 to 2026 was predicted by Matlab. The accuracy test of the grey prediction model is described in Table 4. The posterior difference ratio (C) is less than 0.65, and the slight error probability (P) is more significant than 0.7, meaning the model qualifies. The smaller the root mean squared error (RMSE), the higher the approximation between the predicted results of the model and the actual results. According to Table 4, the accuracies of the CCD prediction values all meet the qualified standards, making the prediction results reliable.
Table 4.
CCD prediction accuracy test between PEE and HED in the YRD from 2022 to 2026.
The prediction results for CCD between the PEE and HED of 20 port cities in the YRD from 2022 to 2026 are reported in Figure 8. In 2024, the coordination level of the YRD will realize the transition from moderate coordination to intermediate coordination. Until 2016, the CCD reached 0.76. Regionally, Jiangsu will surpass Shanghai and step into good coordination. Zhejiang and Anhui will also break through to moderate coordination. All port cities will individually enter an orderly development stage, during which Wuxi and Ningbo-Zhoushan will achieve quality coordination. However, Anqing and Taizhou are just on the edge of bare coordination. In terms of growth rate, Shanghai, Suzhou, and Lianyungang are growing slowly, so it is urgent to provide new power to the breakthrough of port–city coordination.
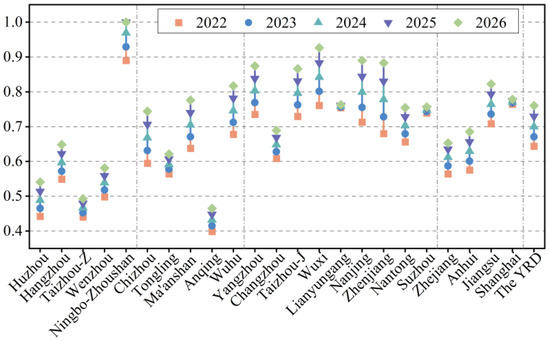
Figure 8.
CCD forecast between PEE and HED of 20 port cities in the YRD from 2022 to 2026.
5. Discussion
The proposal of the dual-carbon target means that China takes green development as the keynote of high-quality development. Simultaneously, fostering a coordinated development relationship between ports and cities is fundamental to promoting port cities to realize high-quality development. Therefore, it is of practical significance to explore the characteristics of the CCD of port cities in the YRD under the concept of green development.
In terms of PEE, the majority of the existing studies focus on the environmental efficiency of the world’s large ports [62], and a few comparative analyses have been conducted on a port cluster. This article selected the YRD port cluster as its research subject, incorporating both large- and small-scale ports to offer a reference for the green development of global port clusters. According to our research, PEE shows significant improvement (Figure 2) and a spatial difference between seaports and inland river ports, the former having achieved higher PEE (Figure 3). Consistent with the study of Wang et al. [63], seaports are in the absolute leading position in the YRD. As an international shipping center, Shanghai Port has the largest regional business volume, the most complete infrastructure, and the most advanced green technology [64]. Ningbo-Zhoushan Port has seized the historical opportunities of globalization, containerization, and its natural endowments in the depth of its channel and terminal to become an important hub port in China [65]. This paper further extended the study of inland river ports in the YRD. Excessive competition is the main reason for the relatively low PEE in the inner harbor. Due to the market squeeze from large ports such as Shanghai Port, the development scale of these ports is very limited [66]. Excessive and disorderly competition in inland river ports has also led to duplicated construction and resource waste, which reduces port efficiency [67]. Conversely, Lianyungang Port, situated at a far distance from the core of the YRD, avoids the homogeneous competition within the port cluster to a certain extent [68].
Secondly, the article has broken the traditional perspective of focusing on the economic benefits of cities and constructed a comprehensive evaluation index for HED based on the context of green development in China. This innovative approach integrates environmental sustainability with economic growth metrics, offering a more holistic view of urban development. The HED of the YRD shows a rising trend, while the rapid rise of Shanghai and Zhejiang widens the inter-provincial differences in the YRD (Figure 2 and Figure 3). Shanghai has led in the low-carbon economy development, but the growth rate is slow [69]. Yang et al. [70] highlighted that effective technological development and resource planning need to compensate for Shanghai’s relatively small area. Consistent with the results of Du et al. [71], Suzhou’s HED performance stands out equally in the YRD. Being adjacent to Shanghai, Suzhou has historically assumed the industrial transfer from Shanghai, forging close ties with its metropolitan neighbor [72]. There exist certain differences between Du, Cardoso, and Rocco [71] and Chen et al. [73], and economically developed cities such as Nanjing and Changzhou are expected to perform better in terms of HED. In fact, due to the divergent functional positioning and development stages of cities, there are differences in the implementation and efficacy of green development initiatives as well as the availability of support mechanisms [74]. Jiangsu, with its developed industry and complex industrial chain, requires further promotion of its carbon emission reduction measures. As Anhui was fully integrated into the YRD in 2019, it was also comparatively analyzed in this paper. Consistent with the results of Wei et al. [75], innovation and green development are the focus of Anhui’s HED enhancement.
Thirdly, while prior research such as that of Sun et al. [76] and Wang et al. [77] has predominantly focused on resource coordination within urban systems, this article has highlighted the significant interdependent relationship between port and city, adopting the YRD port and city clusters and creatively putting PEE and HED into the coupled coordination framework as two subsystems to explore their interaction and analyze them comparatively. The results show that the CCD is on the rise (Figure 4), with a regional imbalance (Figure 6, Figure 7). Consistent with the findings of Qu, Kong, Li, and Zhu [3] and Chen, Zhang, Song, and Wang [58], Shanghai and Ningbo-Zhoushan are well coordinated. As China’s premier coastal cities, they boast obvious advantages in terms of both urban economy and port productivity. The substantial economic output of these cities not only ensures ample cargo volume for the ports but also facilitates investment in port infrastructure [78]. Furthermore, the ports transship urban cargo and revitalize urban resources [79], forming an economic cycle. In addition, Kong and Liu [80] further point out that there is over-investment in ports in Ningbo-Zhoushan, which leads to waste of resources and reduced efficiency. The article also focused on the development of CCD in inner port cities in the YRD. Anhui is the only inland province in the YRD. Due to the limitations of urban space and economic volume, there is no strong mutual support between PEE and HED in Anhui [42].
Based on the background of high-quality development in China, our research constructed HED evaluation indexes around the New Development Concept. As the era progresses, devising a more comprehensive and in-depth index system to examine HED remains an area ripe for further investigation. Moreover, this paper took ports and cities as subsystems in the coupled coordination framework study. Our following research will focus on including more subsystems, such as industries, for a more detailed exploration of the urban economic system.
6. Conclusion and Recommendations
6.1. Conclusions
This paper explores the CCD between PEE and HED in 20 major port cities in YRD from 2012 to 2021 based on the perspective of green development. The conclusions are as follows:
(1) The gradual implementation of green port construction in the YRD has increased PEE to 0.578, but there is still plenty of scope for progress. The inter-provincial gap keeps narrowing, indicating a favorable regional integration development trend. The PEE in Jiangsu and Shanghai is higher than that in Zhejiang and Anhui. The PEE of seaports is higher than that of river ports due to the support of the market, advanced technology, geographic advantages, and robust infrastructure development.
(2) HED fluctuates and rises, widening the gap between provinces. Shanghai performs better in terms of HED. Economic leaders such as Hangzhou and Ningbo-Zhoushan support Zhejiang’s HED. Jiangsu underperforms in HED because of its large industrial scale and complex industrial chain. Furthermore, Anhui, being landlocked, has the lowest HED in the YRD.
(3) In terms of temporal evolution, the CCD between PEE and HED in the YRD rose from bare coordination to mild coordination in 2012–2021, exhibiting an overall rising trend. This is mainly because the significant increase in PEE positively affects the overall quality of the city’s economy, and the city also guarantees the improvement of green technologies in the port. Shanghai relies on its strong economy and efficient ports to keep the CCD at the highest level in the RD. Jiangsu’s initiatives in waterway renovation and green port construction have achieved the most significant rise in CCD. In terms of spatial evolution, Jiangsu’s CCD polarization has been weakening. Anhui’s overall CCD is lower, with an unstable coordination trend. Zhejiang’s polarization is apparent. Across the entire YRD, there exists a spatial distribution characterized by a decreasing trend from the coast to inland. It is expected that by 2026, the average coordination level of the YRD will reach intermediate coordination. Taizhou-Z, Huzhou, Anqing, Tongling, and Changzhou are the critical points for the synergistic, high-quality development of ports and cities in the YRD.
6.2. Recommendations
Based on the findings of our study, we propose the following recommendations:
(1) Promote the construction of green ports based on the existing port integration system and reduce carbon emissions through talent and technology introduction, equipment automation, and pollution emission management. Furthermore, implementing functional positioning and hierarchical management across various seaports and river ports will mitigate excessive competition and maximize the sea–river intermodal transport capabilities of the YRD.
(2) Jiangsu should carry the green concept through industrial development and reduce carbon emissions through clean energy use and optimization of industrial structure. Zhejiang should leverage the influential role of Hangzhou and Ningbo-Zhoushan to stimulate regional development. Anhui should endeavor to absorb industrial and population spillovers from the YRD and focus on ecological benefits alongside economic development.
(3) Recognize and harness the synergistic relationship between ports and cities to foster the development of the green circular economy. Exploit the ports’ resource deployment and transportation functions to promote the transfer of coastal industries to Anhui, establishing a balanced division of labor within the YRD city cluster. Strengthen city support for port infrastructure and the application of green technology to enhance port capacity. Accelerate YRD integration efforts to facilitate synergistic regional development.
Author Contributions
Conceptualization, M.W., Y.L., H.L., X.J., S.L. and K.D.; methodology, M.W., Y.L., H.L. and X.J.; software, Y.L. and H.L.; validation, S.L. and K.D.; formal analysis, M.W., Y.L., H.L., X.J., S.L. and K.D.; writing—original draft preparation, M.W., Y.L., H.L., X.J., S.L. and K.D.; writing—review and editing, M.W., Y.L., H.L. and X.J.; visualization, M.W., Y.L. and H.L., supervision, H.L. and X.J.; project administration, M.W. All authors have read and agreed to the published version of the manuscript.
Funding
This research was funded by the National Social Science Foundation of China (22BJL052), the Major Program of the Philosophy and Social Science Foundation of the Jiangsu Educational Committee (2021SJZDA120), and the Fundamental Research Funds for the Central Universities (B220203043).
Data Availability Statement
The original contributions presented in the study are included in the article, further inquiries can be directed to the corresponding author.
Acknowledgments
The authors sincerely thank all the students and staff who provided their input to this study. Our acknowledgments are also extended to the anonymous reviewers for their constructive comments.
Conflicts of Interest
The authors declare no conflicts of interest.
References
- Central People’s Government of China. Report of the 20th National Congress of the Communist Party of China. Available online: https://www.gov.cn/xinwen/2022-10/25/content_5721685.htm (accessed on 17 September 2023).
- Botana, C.; Fernández, E.; Feijóo, G. Towards a Green Port strategy: The decarbonisation of the Port of Vigo (NW Spain). Sci. Total Environ. 2023, 856, 159198. [Google Scholar] [CrossRef]
- Qu, Y.; Kong, Y.; Li, Z.; Zhu, E. Pursue the coordinated development of port-city economic construction and ecological environment: A case of the eight major ports in China. Ocean Coast. Manag. 2023, 242, 106694. [Google Scholar] [CrossRef]
- Jiang, Z.; Pi, C.; Zhu, H.; Wang, C.; Ye, S. Temporal and spatial evolution and influencing factors of the port system in Yangtze River Delta Region from the perspective of dual circulation: Comparing port domestic trade throughput with port foreign trade throughput. Transp. Policy 2022, 118, 79–90. [Google Scholar] [CrossRef]
- Moretti, B. Technical Land-Sea Spaces. Impacts of the Port Clusterization Phenomenon on Coasts, Cities and Architectures. J. Contemp. Urban Aff. 2023, 7, 208–223. [Google Scholar] [CrossRef]
- Xia, C.; Zhai, G. The spatiotemporal evolution pattern of urban resilience in the Yangtze River Delta urban agglomeration based on TOPSIS-PSO-ELM. Sustain. Cities Soc. 2022, 87, 104223. [Google Scholar] [CrossRef]
- Deng, P.; Song, L.; Xiao, R.; Huang, C. Evaluation of logistics and port connectivity in the Yangtze River Economic Belt of China. Transp. Policy 2022, 126, 249–267. [Google Scholar] [CrossRef]
- Chen, J.; Abbas, J.; Najam, H.; Liu, J.; Abbas, J. Green technological innovation, green finance, and financial development and their role in green total factor productivity: Empirical insights from China. J. Clean. Prod. 2023, 382, 135131. [Google Scholar] [CrossRef]
- Tseng, Y.; Yuan, C.; Wong, K.; Lin, C. Chemical fingerprints and source resolution of atmospheric fine particles in an industrial harbor based on one-year intermittent field sampling data. Sci. Total Environ. 2023, 868, 161335. [Google Scholar] [CrossRef]
- Wan, Z.; Ji, S.; Liu, Y.; Zhang, Q.; Chen, J.; Wang, Q. Shipping emission inventories in China’s Bohai Bay, Yangtze River Delta, and Pearl River Delta in 2018. Mar. Pollut. Bull. 2020, 151, 110882. [Google Scholar] [CrossRef]
- Yang, L.; Zhang, Q.; Lv, Z.; Zhang, Y.; Yang, Z.; Fu, F.; Lv, J.; Wu, L.; Mao, H. Efficiency of DECA on ship emission and urban air quality: A case study of China port. J. Clean. Prod. 2022, 362, 132556. [Google Scholar] [CrossRef]
- Liu, C.; Sun, W.; Li, P.X.; Zhang, L.; Li, M. Differential characteristics of carbon emission efficiency and coordinated emission reduction pathways under different stages of economic development: Evidence from the Yangtze River Delta, China. J. Environ. Manag. 2023, 330, 117018. [Google Scholar] [CrossRef]
- Guo, J.; Wang, Z.; Yu, X. Accessibility measurement of China’s coastal ports from a land-sea coordination perspective—An empirical study. J. Transp. Geogr. 2022, 105, 103479. [Google Scholar] [CrossRef]
- Kammoun, R.; Abdennadher, C. Seaport efficiency and competitiveness in European seaports. Transp. Policy 2022, 121, 113–124. [Google Scholar] [CrossRef]
- Iris, Ç.; Lam, J.S.L. A review of energy efficiency in ports: Operational strategies, technologies and energy management systems. Renew. Sustain. Energy Rev. 2019, 112, 170–182. [Google Scholar] [CrossRef]
- Sogut, M.Z.; Erdoğan, O. An investigation on a holistic framework of green port transition based on energy and environmental sustainability. Ocean Eng. 2022, 266, 112671. [Google Scholar] [CrossRef]
- Wang, L.; Li, Y. Estimation methods and reduction strategies of port carbon emissions—What literatures say? Mar. Pollut. Bull. 2023, 195, 115451. [Google Scholar] [CrossRef]
- Wang, B.; Liu, Q.; Wang, L.; Chen, Y.; Wang, J. A review of the port carbon emission sources and related emission reduction technical measures. Environ. Pollut. 2023, 320, 121000. [Google Scholar] [CrossRef] [PubMed]
- Hua, C.; Chen, J.; Wan, Z.; Xu, L.; Bai, Y.; Zheng, T.; Fei, Y. Evaluation and governance of green development practice of port: A sea port case of China. J. Clean. Prod. 2020, 249, 119434. [Google Scholar] [CrossRef]
- OECD. Eco-Efficiency. Available online: https://read.oecd-ilibrary.org/environment/eco-efficiency_9789264040304-en (accessed on 23 August 2023).
- Na, J.; Choi, A.Y.; Ji, J.; Zhang, D. Environmental efficiency analysis of Chinese container ports with CO2 emissions: An inseparable input-output SBM model. J. Transp. Geogr. 2017, 65, 13–24. [Google Scholar] [CrossRef]
- Lampe, H.; Hilgers, D. Trajectories of efficiency measurement: A bibliometric analysis of DEA and SFA. Eur. J. Oper. Res. 2015, 240, 1–21. [Google Scholar] [CrossRef]
- Roll, Y.; Hayuth, Y. Port performance comparison applying data envelopment analysis (DEA). Marit. Policy Manag. 1993, 20, 153–161. [Google Scholar] [CrossRef]
- Wang, L.; Zhou, Z.; Yang, Y.; Wu, J. Green efficiency evaluation and improvement of Chinese ports: A cross-efficiency model. Transp. Res. Part D Transp. Environ. 2020, 88, 102590. [Google Scholar] [CrossRef]
- Chin, A.; Low, J. Port performance in Asia: Does production efficiency imply environmental efficiency? Transp. Res. Part D Transp. Environ. 2010, 15, 483–488. [Google Scholar] [CrossRef]
- Hsu, W.; Huynh, N. Container terminals’ efficiency with the unexpected output: A revised SBM approach. Environ. Sci. Pollut. Res. 2023, 30, 37845–37858. [Google Scholar] [CrossRef]
- Li, J.; Ren, J.; Ma, X.; Xiao, G. Environmental efficiency of ports under the dual carbon goals: Taking China’s Bohai-rim ports as an example. Front. Mar. Sci. 2023, 10, 1129659. [Google Scholar] [CrossRef]
- Nodin, M.; Mustafa, Z.; Hussain, S. Eco-efficiency assessment of Malaysian rice self-sufficiency approach. Socio-Econ. Plan. Sci. 2023, 85, 101436. [Google Scholar] [CrossRef]
- Mamghaderi, M.; Mamkhezri, J.; Khezri, M. Assessing the environmental efficiency of OECD countries through the lens of ecological footprint indices. J. Environ. Manag. 2023, 338, 117796. [Google Scholar] [CrossRef]
- Zhu, C.; Fang, C.; Zhang, L. Analysis of the coupling coordinated development of the Population–Water–Ecology–Economy system in urban agglomerations and obstacle factors discrimination: A case study of the Tianshan North Slope Urban Agglomeration, China. Sustain. Cities Soc. 2023, 90, 104359. [Google Scholar] [CrossRef]
- Bell, S.; Morse, S. Sustainability Indicators Past and Present: What Next? Sustainability 2018, 10, 1688. [Google Scholar] [CrossRef]
- Han, Z.; Jiao, S.; Zhang, X.; Xie, F.; Ran, J.; Jin, R.; Xu, S. Seeking sustainable development policies at the municipal level based on the triad of city, economy and environment: Evidence from Hunan province, China. J. Environ. Manag. 2021, 290, 112554. [Google Scholar] [CrossRef] [PubMed]
- Luo, S.; Yu, M.; Dong, Y.; Hao, Y.; Li, C.; Wu, H. Toward urban high-quality development: Evidence from more intelligent Chinese cities. Technol. Forecast. Soc. Chang. 2024, 200, 123108. [Google Scholar] [CrossRef]
- Guo, B.; Wang, Y.; Zhang, H.; Liang, C.; Feng, Y.; Hu, F. Impact of the digital economy on high-quality urban economic development: Evidence from Chinese cities. Econ. Model. 2023, 120, 106194. [Google Scholar] [CrossRef]
- Yang, Z. Comparison and empirical analysis of the urban economic development level in the Yangtze River urban agglomeration based on an analogical ecosystem perspective. Ecol. Inform. 2021, 64, 101321. [Google Scholar] [CrossRef]
- Pan, W.; Wang, J.; Lu, Z.; Liu, Y.; Li, Y. High-quality development in China: Measurement system, spatial pattern, and improvement paths. Habitat. Int. 2021, 118, 102458. [Google Scholar] [CrossRef]
- Zheng, W.; Zhang, L.; Hu, J. Green credit, carbon emission and high quality development of green economy in China. Energy Rep. 2022, 8, 12215–12226. [Google Scholar] [CrossRef]
- Wan, J.; Wang, Z.; Ma, C.; Su, Y.; Zhou, T.; Wang, T.; Zhao, Y.; Sun, H.; Li, Z.; Wang, Y.; et al. Spatial-temporal differentiation pattern and influencing factors of high-quality development in counties: A case of Sichuan, China. Ecol. Indic. 2023, 148, 110132. [Google Scholar] [CrossRef]
- Zha, Q.; Liu, Z.; Song, Z.; Wang, J. A study on dynamic evolution, regional differences and convergence of high-quality economic development in urban agglomerations: A case study of three major urban agglomerations in the Yangtze river economic belt. Front. Environ. Sci. 2022, 10, 1012304. [Google Scholar] [CrossRef]
- Guo, J.; Sun, Z. How does manufacturing agglomeration affect high-quality economic development in China? Econ. Anal. Policy 2023, 78, 673–691. [Google Scholar] [CrossRef]
- Cong, L.; Zhang, D.; Wang, M.; Xu, H.; Li, L. The role of ports in the economic development of port cities: Panel evidence from China. Transp. Policy 2020, 90, 13–21. [Google Scholar] [CrossRef]
- Wu, Z.; Woo, S.; Lai, P.L.; Chen, X. The economic impact of inland ports on regional development: Evidence from the Yangtze River region. Transp. Policy 2022, 127, 80–91. [Google Scholar] [CrossRef]
- Li, Z.; Luan, W.; Zhang, Z.; Su, M. Research on the Interactive Relationship of Spatial Expansion between Estuarine and Coastal Port Cities. Land 2023, 12, 371. [Google Scholar] [CrossRef]
- Zhu, S.; Zheng, S.; Ge, Y.-E.; Fu, X.; Sampaio, B.; Jiang, C. Vertical integration and its implications to port expansion. Marit. Policy Manag. 2019, 46, 920–938. [Google Scholar] [CrossRef]
- Qu, C.; Wang, G.W.Y.; Zeng, Q. Modelling port subsidy policies considering pricing decisions of feeder carriers. Transp. Res. Part E Logist. Transp. Rev. 2017, 99, 115–133. [Google Scholar] [CrossRef]
- Hidalgo-Gallego, S.; NúñezSánchez, R. The effect of port activity on urban employment: An analysis for the Spanish functional urban areas. J. Transp. Geogr. 2023, 108, 103570. [Google Scholar] [CrossRef]
- Wang, C.; Chen, J.; Li, Z.; Abouel Nasr, E.; El-Tamimi, A. An indicator system for evaluating the development of land-sea coordination systems: A case study of Lianyungang port. Ecol. Indic. 2019, 98, 112–120. [Google Scholar] [CrossRef]
- Guo, J.; Qin, Y.; Du, X.; Han, Z. Dynamic measurements and mechanisms of coastal port–city relationships based on the DCI model: Empirical evidence from China. Cities 2020, 96, 102440. [Google Scholar] [CrossRef]
- Ma, Q.; Jia, P.; She, X.; Haralambides, H.; Kuang, H. Port integration and regional economic development: Lessons from China. Transp. Policy 2021, 110, 430–439. [Google Scholar] [CrossRef]
- Vroomans, J.; Geerlings, H.; Kuipers, B. The energetic relationship between ports and cities; how the role of shared values is under pressure. Case Stud. Transp. Policy 2022, 10, 2358–2368. [Google Scholar] [CrossRef]
- Russo, F.; Musolino, G. Port-city interactions: Models and case studies. Transp. Res. Procedia 2023, 69, 695–702. [Google Scholar] [CrossRef]
- Liu, J.; Zhou, J.; Liu, F.; Yue, X.; Kong, Y.; Wang, X. Interaction Analysis and Sustainable Development Strategy between Port and City: The Case of Liaoning. Sustainability 2019, 11, 5366. [Google Scholar] [CrossRef]
- Guo, J.; Qin, Y. Coupling characteristics of coastal ports and urban network systems based on flow space theory: Empirical evidence from China. Habitat. Int. 2022, 126, 102624. [Google Scholar] [CrossRef]
- Tone, K. A slacks-based measure of efficiency in data envelopment analysis. Eur. J. Oper. Res. 2001, 130, 498–509. [Google Scholar] [CrossRef]
- Charnes, A.; Clark, C.; Cooper, W.W.; Golany, B.A.B. A developmental study of data envelopment analysis in measuring the efficiency of maintenance units in the U.S. air forces. Ann. Oper. Res. 1984, 2, 95–112. [Google Scholar] [CrossRef]
- Zarbi, S.; Shin, S.; Shin, Y. An Analysis by Window DEA on the Influence of International Sanction to the Efficiency of Iranian Container Ports. Asian J. Shipp. Log. 2019, 35, 163–171. [Google Scholar] [CrossRef]
- Meehl, G.; Senior, C.; Eyring, V.; Flato, G.; Lamarque, J.; Stouffer, R.; Taylor, K.; Schlund, M. Context for interpreting equilibrium climate sensitivity and transient climate response from the CMIP6 Earth system models. Sci. Adv. 2020, 6, eaba1981. [Google Scholar] [CrossRef]
- Chen, J.; Zhang, W.; Song, L.; Wang, Y. The coupling effect between economic development and the urban ecological environment in Shanghai port. Sci. Total Environ. 2022, 841, 156734. [Google Scholar] [CrossRef]
- Huang, Y.; Huang, C. The integration and application of fuzzy and grey modeling methods. Fuzzy Sets Syst. 1996, 78, 107–119. [Google Scholar] [CrossRef]
- Zhou, C.; Li, X.; Lin, X.; Cheng, M. Influencing factors of the high-quality economic development in China based on LASSO model. Energy Rep. 2022, 8, 1055–1065. [Google Scholar] [CrossRef]
- The State Council of the PRC. Outline of the Plan for the Integrated Development of the Yangtze River Delta Region. Available online: https://www.gov.cn/zhengce/2019-12/01/content_5457442.htm (accessed on 17 September 2023).
- Erdas, C.; Fokaides, P.A.; Charalambous, C. Ecological footprint analysis based awareness creation for energy efficiency and climate change mitigation measures enhancing the environmental management system of Limassol port. J. Clean. Prod. 2015, 108, 716–724. [Google Scholar] [CrossRef]
- Wang, Z.; Wu, X.; Guo, J.; Wei, G.; Dooling, T. Efficiency evaluation and PM emission reallocation of China ports based on improved DEA models. Transp. Res. Part D Transp. Environ. 2020, 82, 102317. [Google Scholar] [CrossRef]
- Li, D.; Xin, X.; Zhou, S. Integrated governance of the Yangtze River Delta port cluster using niche theory: A case study of Shanghai Port and Ningbo-Zhoushan Port. Ocean Coast. Manag. 2023, 234, 106474. [Google Scholar] [CrossRef]
- Feng, H.; Grifoll, M.; Zheng, P. From a feeder port to a hub port: The evolution pathways, dynamics and perspectives of Ningbo-Zhoushan port (China). Transp. Policy 2019, 76, 21–35. [Google Scholar] [CrossRef]
- Shi, J.; Jiao, Y.; Chen, J.; Ye, J.; Gong, J. A study on the evolution of competition pattern of inland container ports along the Yangtze River in China. J. Transp. Geogr. 2023, 109, 103591. [Google Scholar] [CrossRef]
- Jiang, L.; Wang, X.; Yang, K.; Gao, Y. Bilevel optimization for the reorganization of inland river ports: A niche perspective. Socio-Econ. Plan. Sci. 2023, 86, 101466. [Google Scholar] [CrossRef]
- Wang, M.; Ji, M.; Wu, X.; Deng, K.; Jing, X. Analysis on Evaluation and Spatial-Temporal Evolution of Port Cluster Eco-Efficiency: Case Study from the Yangtze River Delta in China. Sustainability 2023, 15, 8268. [Google Scholar] [CrossRef]
- Li, Z.; Galeano Galván, M.; Ravesteijn, W.; Qi, Z. Towards low carbon based economic development: Shanghai as a C40 city. Sci. Total Environ. 2017, 576, 538–548. [Google Scholar] [CrossRef]
- Yang, H.; Li, X.; Elliott, M. Integrated quantitative evaluation framework of sustainable development—The complex case of the Yangtze River Delta. Ocean Coast. Manag. 2023, 232, 106426. [Google Scholar] [CrossRef]
- Du, Y.; Cardoso, R.V.; Rocco, R. The challenges of high-quality development in Chinese secondary cities: A typological exploration. Sustain. Cities Soc. 2024, 103, 105266. [Google Scholar] [CrossRef]
- Wang, D.; Shi, Y.; Wan, K. Integrated evaluation of the carrying capacities of mineral resource-based cities considering synergy between subsystems. Ecol. Indic. 2020, 108, 105701. [Google Scholar] [CrossRef]
- Chen, X.; Di, Q.; Jia, W.; Hou, Z. Spatial correlation network of pollution and carbon emission reductions coupled with high-quality economic development in three Chinese urban agglomerations. Sustain. Cities Soc. 2023, 94, 104552. [Google Scholar] [CrossRef]
- Wang, D.; Li, Y.; Yang, X.; Zhang, Z.; Gao, S.; Zhou, Q.; Zhuo, Y.; Wen, X.; Guo, Z. Evaluating urban ecological civilization and its obstacle factors based on integrated model of PSR-EVW-TOPSIS: A case study of 13 cities in Jiangsu Province, China. Ecol. Indic. 2021, 133, 108431. [Google Scholar] [CrossRef]
- Wei, X.; Zhao, R.; Xu, J. Spatiotemporal Evolution, Coupling Coordination Degree and Obstacle Factors of Urban High-Quality Development: A Case Study of Anhui Province. Sustainability 2023, 15, 852. [Google Scholar] [CrossRef]
- Sun, J.; Zhai, N.; Mu, H.; Miao, J.; Li, W.; Li, M. Assessment of urban resilience and subsystem coupling coordination in the Beijing-Tianjin-Hebei urban agglomeration. Sustain. Cities Soc. 2024, 100, 105058. [Google Scholar] [CrossRef]
- Wang, L.; Yuan, M.; Li, H.; Chen, X. Exploring the coupling coordination of urban ecological resilience and new-type urbanization: The case of China’s Chengdu–Chongqing Economic Circle. Environ. Technol. Innov. 2023, 32, 103372. [Google Scholar] [CrossRef]
- Song, L.; van Geenhuizen, M. Port infrastructure investment and regional economic growth in China: Panel evidence in port regions and provinces. Transp. Policy 2014, 36, 173–183. [Google Scholar] [CrossRef]
- Shan, J.; Yu, M.; Lee, C.-Y. An empirical investigation of the seaport’s economic impact: Evidence from major ports in China. Transp. Res. Part E Logist. Transp. Rev. 2014, 69, 41–53. [Google Scholar] [CrossRef]
- Kong, Y.; Liu, J. Sustainable port cities with coupling coordination and environmental efficiency. Ocean Coast. Manag. 2021, 205, 105534. [Google Scholar] [CrossRef]


Disclaimer/Publisher’s Note: The statements, opinions and data contained in all publications are solely those of the individual author(s) and contributor(s) and not of MDPI and/or the editor(s). MDPI and/or the editor(s) disclaim responsibility for any injury to people or property resulting from any ideas, methods, instructions or products referred to in the content. |
© 2024 by the authors. Licensee MDPI, Basel, Switzerland. This article is an open access article distributed under the terms and conditions of the Creative Commons Attribution (CC BY) license (https://creativecommons.org/licenses/by/4.0/).