Abstract
During the dry season, extensive peatland fires in South Sumatra and another peatland in Indonesia result in environmental damage and pose health risks to humans. The Indonesian Government has implemented several measures to prevent the recurrence of these fires. One such measure involves the establishment of observation stations to monitor hydrometeorological parameters in different peatlands across Indonesia, including those in South Sumatra. To effectively control fires in South Sumatra’s peatland and minimize hotspot occurrences, it is essential to determine hydrometeorological parameters that can serve as fire control indicators. Therefore, this study aimed to investigate the relationship between groundwater levels and hotspot occurrences by analyzing groundwater level data collected from six Peat Restoration Agency stations in South Sumatra’s peatland, along with hotspot data obtained from Moderate Resolution Imaging Spectroradiometer satellite measurements. The findings reveal a significant correlation between groundwater levels and hotspots at the six stations. As the GWL increased, the number of hotspots tended to decrease, and vice versa. This means that GWL can be used as a controlling variable for hotspot emergence. To effectively minimize hotspot occurrences, it is recommended to maintain a minimum groundwater level of −0.45 ± 0.09 m in the peatland of South Sumatra.
1. Introduction
Indonesia is home to the largest expanse of tropical peatland in Southeast Asia, encompassing approximately 20.9 million ha or approximately half of the global tropical peatland area. This peatland is situated in the Indonesian provinces of Papua, Kalimantan, Sumatra, and Sulawesi. In South Sumatra Province alone, peatland covers 1.5 million ha [1,2,3,4]. This peatland serves as a crucial reservoir for water and carbon.
The peatland in Indonesia, including that in South Sumatra, is highly prone to combustion [5,6,7]. In 1997 and 1998, 173,000 ha of peatland in southern Sumatra was burnt [8]. According to data from the National Disaster Management Agency of Indonesia in 2015, South Sumatra experienced the largest fire area in Indonesia in 2014 (8505 ha) and the second-most widespread fire in Indonesia in 2015 (144,410 ha). Indonesia’s peatlands quickly dry out during the extreme dry season. Many canals have been made to channel water from peatlands to nearby plantations, so, during the dry season, the water in the peatlands quickly runs out.
Peatland fires in Indonesia produce smog, which has detrimental effects on both human health and the environment. The primary concerns lie in human health, particularly respiratory infections. In 2015, during the peatland fires, Indonesia witnessed 19 fatalities and 500,000 cases of respiratory diseases. Another consequence of peatland fires is the emission of carbon into the atmosphere, which contributes to global warming. During the period between September and October 2015, the rate of carbon emissions reached 11.3 Tg CO2/day, representing the worst carbon emission since 1997 owing to fire incidents [9].
Severe fires in peatland primarily arise during extremely dry seasons. These seasons feature minimal rainfall, leading to a drastic decline in groundwater levels within the peatland. At the peak of the dry season, daily rainfall is below 50 mm, while, at the peak of the rainy season, it is above 150 mm. As a result, the surface soil of the peatland becomes excessively dry, thus becoming vulnerable to fires. Previous studies have demonstrated a positive correlation between lower groundwater levels and increased hotspots [10,11,12]. Nevertheless, studies on whether groundwater level can be used as a parameter for fire control are lacking. To address this knowledge gap, this study aimed to investigate the relationship between groundwater levels and hotspot occurrences by analyzing groundwater level data collected from six sampling stations in South Sumatra’s peatland coupled with hotspot data obtained from MODIS satellite measurements.
2. Materials and Methods
2.1. Study Area
In July 2017, the Indonesian Government initiated the implementation of several in situ measurement stations to monitor hydrometeorological parameters in peatland areas across the country, including South Sumatra. This measurement system, known as the Sensory Data Transmission Service Assisted by Midori Engineering Laboratory (SESAME), encompasses the monitoring of temperature, rainfall, groundwater level (GWL), and soil moisture. This integrated measurement system was established to predict and mitigate fire disasters in peatlands and is managed by the Peat Restoration Agency (BRG). BRG launched a Peatland and Water Monitoring System (SIPALAGA) in seven Indonesian provinces, including South Sumatra, at the end of 2018. SIPALAGA incorporates the SESAME measurement system “http://www.sipalaga.brg.go.id (accessed on 11 July 2023)”.
A photograph of the SESAME equipment system installed in peatland in South Sumatra is shown in Figure 1. This equipment is an integrated system consisting of rainfall, GWL, temperature, and soil moisture sensors. Temperature and rainfall sensors are placed in the box. The GWL and soil moisture sensors are installed approximately 15 cm below the soil surface. The energy source comes from a solar cell battery installed at the top of the equipment system.
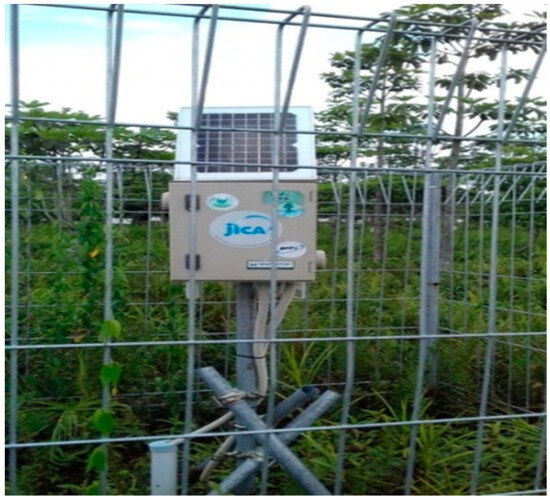
Figure 1.
SESAME equipment.
This study utilized rainfall and GWL data from six BRG stations during July–October 2019, encompassing the progression of a strongly positive Indian Ocean Dipole (IOD+). An IOD+ is a natural phenomenon that occurs in the Indian Ocean which causes very minimal rainfall in most parts of Indonesia [13,14]. The names, locations, and data availability of the six BRG stations are documented in Table 1 and Figure 2. The BRG data collection period is from 1 July 2019 to 31 October 2019. The peak of the dry season in Indonesia usually occurs between July and October (JASO). Figure 2 depicts eight measurement stations belonging to BRG that are situated on peatlands in Ogan Komering Ilir (OKI) District. However, for this study, data from only six stations—stations SS1, CJ1, CJ2, PS2, PS3, and KA—were utilized owing to incomplete data from the other two stations, AR and K. Hotspot data, which were obtained from the Fire Information for Resource Management System (FIRMS) of the National Aeronautics and Space Administration (NASA), were based on the MODIS aboard the Aqua and Terra satellites, as well as the Visible Infrared Imaging Radiometer Suite (VIIRS) aboard S-NPP and NOAA 20 [15,16]. Hotspot data were obtained from NASA’s Fire Information for Resource Management System (MODIS Collection 6.1 “https://firms2.modaps.eosdis.nasa.gov (accessed on 13 July 2023)”. The hotspot data covered the period between 2001 and 2020, focusing on the dry season in Indonesia from July to October. Furthermore, precipitation data obtained from the European Centre for Medium-Range Weather Forecast (ECMWF) for 2001–2020, at a resolution of 0.25°, were used in this study.

Table 1.
Detailed information regarding the research stations, their GPS coordinates, rainfall data, and GWL data availability.
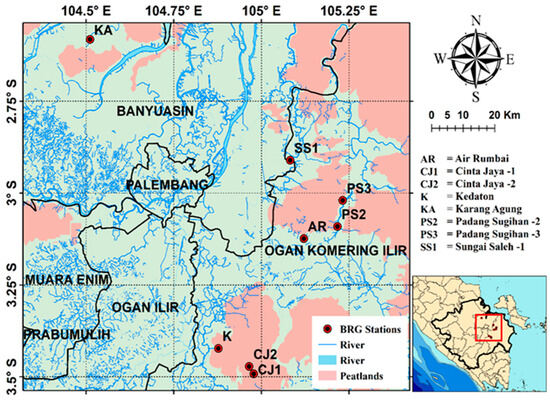
Figure 2.
Map illustrating the location of the BRG stations.
To assess the potential impact of climate modes in the Indo-Pacific sector, dipole mode index (DMI) data were used as an indicator of tropical climate mode anomalies originating from the Indian Ocean, particularly the Indian Ocean Dipole [17,18]. The DMI was calculated as the difference in sea surface temperatures (SSTs) between the Western Tropical Indian Ocean (10° S–10° N, 50°–70° E) and the eastern Indian Ocean (10° E–Equator, 90°–110° E). Additionally, the Niño 3.4 index derived from the average SST anomalies in the equatorial Pacific (5° S–5° N, 170°–120° W) was used to indicate anomalies in the climate from the tropical Pacific, specifically the El Niño–Southern Oscillation (ENSO).
2.2. El Niño–Southern Oscillation
Changes in seawater temperature in the Pacific Ocean due to the interaction between the ocean and atmosphere (La Niña/El Niño) occur in an inter-annual cycle, the ENSO. El Niño, derived from Spanish, is a term used by fisherfolk in South America to define the appearance of an unusual ‘pool’ of warm water in the Pacific Ocean [19,20,21]. These warm pools usually appear from December until the beginning of the new year. In contrast, La Niña, also derived from Spanish, is used to explain widespread cold sea surface temperatures in South America. The evolution of El Niño and La Niña occurs every 3–7 or 8 years and significantly impacts South American fisherfolk. During El Niño episodes, fisherfolk experience a decrease in their catch, whereas La Niña episodes lead to increased fish catch. This can be attributed to the occurrence of upwelling during the evolution of El Niño and La Niña [22,23,24]. As mentioned previously, ENSO evolution comprises three phases: El Niño, La Niña, and neutral. These phases are associated with fluctuations in sea surface temperature and their interaction with the atmosphere. Hence, ENSO is also referred to as the coupling of sea surface and atmospheric temperatures [21,24,25,26].
2.3. Indian Ocean Dipole
The Indian Ocean Dipole (IOD) is a climatic anomaly that arises from the interaction between the atmosphere and sea in the Indian Ocean. IOD activity can be assessed using the dipole mode index (DMI). The DMI is defined as the difference between the sea surface temperature anomalies in the Western Tropical Indian Ocean (WTIO, 50° E–70°/10° S–10° N) and the Southeastern Tropical Indian Ocean (SETIO, 90° E–110° E/10° equator). The IOD is divided into two phases: positive and negative. The positive dipole mode is characterized by increasing sea surface temperature in the WTIO and decreasing sea surface temperature in the SETIO. This positive phase, known as IOD+, leads to minimal rainfall in Indonesia, whereas the negative phase, IOD−, has the opposite effect [19,27,28,29].
The IOD is a phenomenon characterized by alternating sea surface temperature patterns over irregular intervals. The fluctuations in sea surface temperature in the index resemble an oscillation, resulting in the western region of the Indian Ocean being warmer (positive phase) or cooler (negative phase) than the eastern region. The IOD is identified based on the difference in sea surface temperature between two regions, or dipoles, in the Indian Ocean: the eastern coast of Africa and the western waters of Indonesia, as depicted in Figure 2. Studies of the IOD phenomenon have been conducted primarily in the past two decades, and few studies discuss the IOD. As previously mentioned, the IOD is identified based on differences in sea surface temperatures in the waters east of the African coast and the western Indonesian waters. When the sea surface temperature in one of these areas becomes cooler than the norm, it generates alterations in air circulation and ocean currents between the two regions, differing from typical conditions. This change in circulation undoubtedly influences climatic conditions in Indonesia [21,30,31,32,33,34,35,36,37].
2.4. Hotspot
‘Hotspots’ are hot spots on the Earth’s surface that are an indication of forest and land fires. Hotspots are parameters derived from satellite data and are indicated as locations where forest and land fires occur. Another term that describes the point where forest and land fires occur is ‘fire spot’. Many people suggest that the large number of hotspots is an indication of fire. Hotspots can be used as an indication of forest and land fires, whether in the form of crown fires, surface fires, or ground fires. The advanced very-high-resolution radiometer of the National Oceanic and Atmospheric Administration (AVHRR-OAA) satellite, which was originally intended for climate and weather monitoring, is often used for monitoring forest and land fires because it has a sensor that can differentiate between land and sea surface temperatures. Additionally, the satellite passes over the same locations twice a day and at night, providing up-to-date data that are valuable for firefighting teams to swiftly identify and address fire incidents. NOAA satellite-derived hotspot data can be used for forecasting hotspots and smoke, detecting fire incidents, monitoring forest fires, and mapping fire vulnerability levels [10,38].
Hotspots are valuable indicators of forest fires, highlighting areas with relatively higher temperatures compared to their surroundings. AVHRR sensors detect thermal energy from the object being observed with temperatures as low as 42 °C, making satellites ideal for spotting such areas. The ability to differentiate surface temperatures on land and at sea, along with frequent revisits to the same locations, further enhances the effectiveness of hotspot detection. Moreover, these satellites offer a cost-effective solution for monitoring forest and land fires. Although hotspots provide initial information, further analysis and interpretation are crucial for a comprehensive understanding. Large and continuous clusters of hotspots serve as reliable indicators of fire activity. Hotspot data are useful when combined with other types of information. It is important to note that hotspots may have a refractive or geographic error of up to 3 km. Overall, hotspots serve as vital indicators of forest and land fires, with the surrounding areas being susceptible to fire incidents [39,40,41,42].
2.5. Determination of Critical Value for Groundwater Level
Critical GWL was determined through statistical regression tests and t-tests to assess the correlation between groundwater levels and hotspots. The regression tests aimed to determine the coefficient of determination (r2) and the empirical equation that describes the relationship between these two parameters. The correlation coefficient I was calculated based on the coefficient of determination obtained. A t-test was employed to determine the significance of the correlation between the two equations. The t-count value was calculated based on the number of data (n) and correlation coefficient (r) at each location. The t-table value, utilizing a 95% degree of accuracy, was then obtained from a t-test table for each research location. If the t-count value exceeded the t-table value, it indicated a significant correlation between the two parameters.
3. Results
3.1. Hotspot Distribution
Figure 3 depicts the time series data for hotspots, mean precipitation, and climate indices during the dry season (J-A-S-O) from 2001 to 2020. As shown in a previous study [43], peat fires in South Sumatra occurred nearly every year during the dry season in 2001–2020, varying in intensity. The three major fire events observed during the study period from 2001 to 2020 were in 2006, 2015, and 2019, with 12,118, 19,942, and 7563 fires, respectively (Figure 3a).
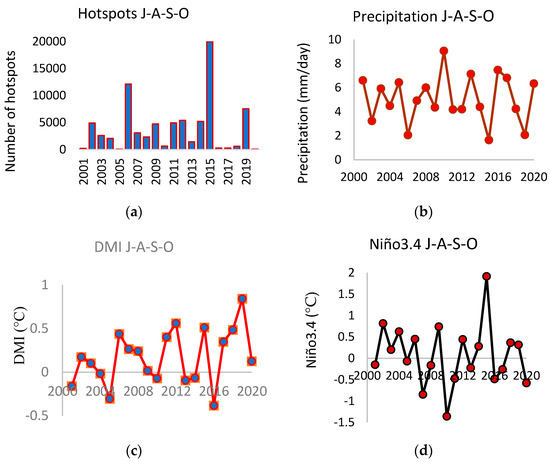
Figure 3.
Time series of (a) hotspots, (b) rainfall, (c) DMI, and (d) Niño 3.4 in year 2001 until 2020.
Peat fires have a detrimental impact on the environment, leading to haze pollution and disrupting daily activities, such as transportation and public health [9,43]. It is worth noting that the three largest fire events coincided with a lack of precipitation (Figure 3b). Specifically, in 2015, the highest number of hotspots was observed during the driest conditions with the lowest observed precipitation intensity. Previous studies have shown that Indo-Pacific climate modes, namely the IOD and ENSO, are linked to the deficit in precipitation observed across the Indonesian region [36,44]. Figure 3c,d display the IOD and ENSO indices, respectively, with the magnitude of the indices reflecting the intensity of the events. IOD events are represented by an index called the dipole mode index (DMI), namely the difference in mean sea surface temperature (SST) in the western Indian Ocean and SST in the eastern Indian Ocean. The Niño 3.4 index is the SST condition in the central Pacific Ocean. If DMI is positive, then IOD+ occurs, and, if it is negative, IOD− occurs. If Niño 3.4 is positive, then El Niño occurs, and, if it is negative, there is La Niña. It is evident that the 2006 and 2019 peat fires were associated with strong positive IOD events, whereas the 2015 fire was linked to an extreme El Niño event. The number of hotspots during the 2015 El Niño event nearly doubled (or tripled) compared to that of the 2006 (or 2019) IOD event, suggesting that the influence of El Niño was more significant. However, determining the extent to which ENSO or IOD impacts peat fire occurrence is beyond the scope of this study.
To analyze the distribution of peat fires in South Sumatra, we present distribution maps of hotspots during the peak phase of the events (J−A−S−O season) in 2006, 2015, and 2019 (Figure 4). Among these fire events, the 2019 event had the lowest number of hotspots (Figure 4c). In 2006, hotspots were spread more evenly so they appeared to be more numerous than in 2015. The hotspots appeared to be more concentrated in the eastern part of South Sumatra, as indicated by the denser concentration. As shown in Figure 2, the eastern part of South Sumatra is dominated by peatland, suggesting that severe peatland fires occurred during these three extreme dry seasons.
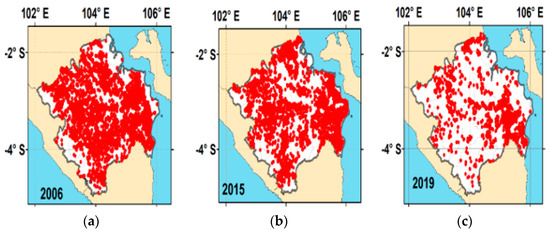
Figure 4.
Distribution of hotspots in South Sumatra during the extreme dry season of J−A−S−O (a) 2006, (b) 2015, and (c) 2019.
3.2. Dynamics of the 2019 Peatland Fires
The Indonesian Government has implemented various measures to prevent peatland fires during the dry season, particularly during extreme dry seasons. One such measure is the establishment of in situ measurement stations for hydrometeorological parameters in peatlands across the country, known as the SESAME measurement system. Fortunately, the SESAME stations in South Sumatra recorded several hydrometeorological parameters during the severe fire events in 2019. Therefore, in this section, we examine the potential role of GWL in controlling peatland fires.
Figure 5 illustrates the time series of the monthly observed number of hotspots, precipitation, and climate indices during the 2019 J−A−S−O season. It is evident that the number of hotspots gradually increased from July to August, sharply rose in September, and then decreased in October (Figure 5a). The highest number of hotspots, observed in September 2019, coincided with the lowest recorded precipitation (Figure 5b). As the intensity of precipitation increased in October, the number of hotspots gradually decreased. As shown in an earlier section, the peatland fires in 2019 were attributed to the positive IOD event (Figure 5c) rather than the El Niño event (Figure 5d). Interestingly, the highest number of hotspots was observed before the peak phase of the IOD in October, and the number of hotspots decreased once the IOD reached its peak phase. This suggests that other factors may also play a role in controlling the increase or decrease in hotspots.
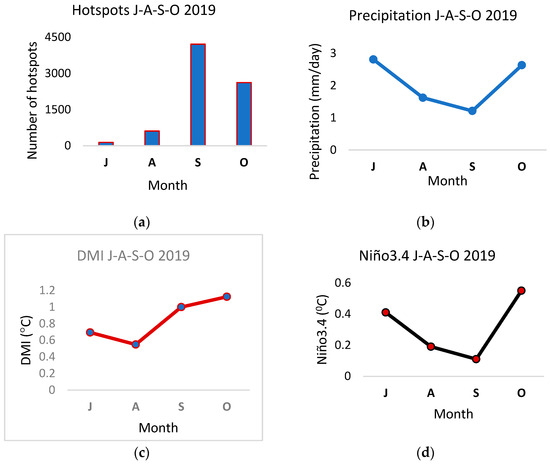
Figure 5.
Time series of (a) hotspots, (b) rainfall, (c) DMI, and (d) Niño 3.4 during the 2019 J−A−S−O period.
First, we examined the possible relationship between rainfall and GWL observed at the SESAME stations. Figure 6 shows the time series of observed rainfall and GWL from July to October 2019. Rainfall had an impact on the temporal variability of GWL. When there was no rainfall observed at these stations, the GWL rapidly increased at all stations. An increase in GWL indicates that GWL is rising relative to the Earth’s surface. Interestingly, even a short period of rainfall could influence GWL, as indicated by intermittent increases in GWL. For example, an immediate response of the GWL to rainfall was observed in early October 2019 at station Cinta Jaya-2. The GWL increased in response to increased rainfall and vice versa (Figure 6b).
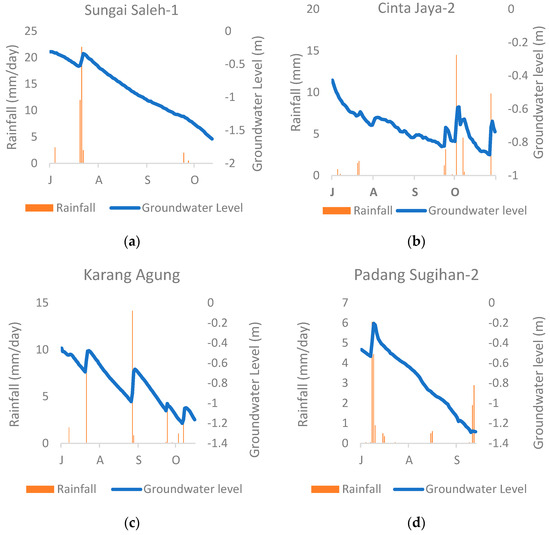
Figure 6.
(a–d) Overlay graph of groundwater level and rainfall in the period J−A−S−O 2019.
3.3. Relationship between Groundwater Level and Hotspots in the Period July to October 2019
Figure 7 presents an overlay graph showing the relationship between GWL and the number of hotspots. The data used for this analysis were collected from July to October 2019 at six measurement stations: Cinta Jaya-1, Cinta Jaya-2, Sungai Saleh-1, Padang Sugihan-2, Padang Sugihan-3, and Karang Agung. All graphs in Figure 7a–f indicated that, in general, as the GWL increased, the number of hotspots tended to decrease, and vice versa. This suggests a clear relationship between GWL and the number of hotspots, making it possible to use GWL as a parameter for managing hotspot emergence in peatland. By maintaining groundwater at a certain level, it is expected that the occurrence of hotspots could be prevented. Therefore, it is crucial to determine the critical GWL necessary to avoid the emergence of hotspots.
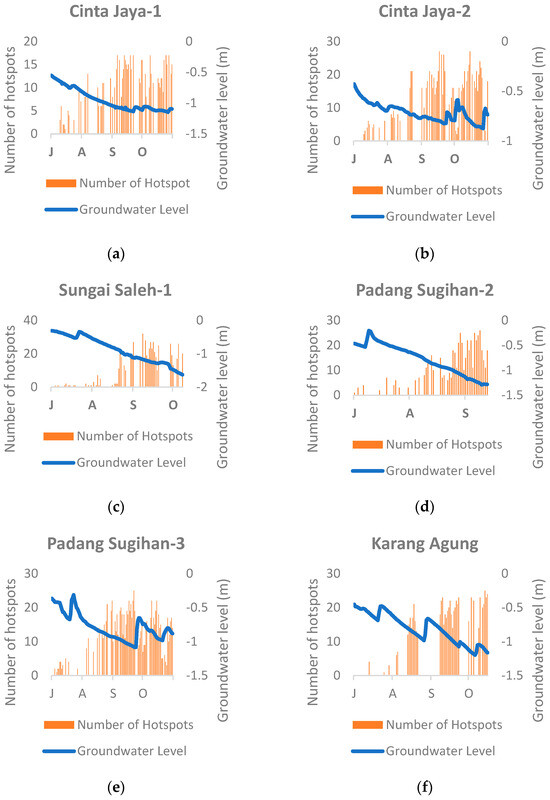
Figure 7.
(a–f) Overlay graph of groundwater level and hotspots in the period J−A−S−O 2019.
3.4. Critical Value for Groundwater Level
Some graphics depicting the correlation between these two parameters is shown in Figure 8a–f. The graphs also show the empirical equations obtained and the values of the coefficients of determination. The results of the statistical analyses are presented in Table 2. In this table, n represents the number of data, r is the correlation coefficient, t signifies the t-value based on the calculations, and t is the t-value from the t-test table. As shown in Table 3, the correlation between GWL and hotspots is significant at all study locations; therefore, the empirical equations obtained can be applied in further related studies. The critical value of GWL can be calculated based on the empirical equation describing the correlation between GWL and the number of hotspots obtained. By assigning a value of Y = 0 to the empirical equation, the corresponding value of X can be obtained. In this case, the Y variable represents the number of hotspots, and the X variable represents the GWL. Statistical data calculated for critical GWL are presented in Table 3.
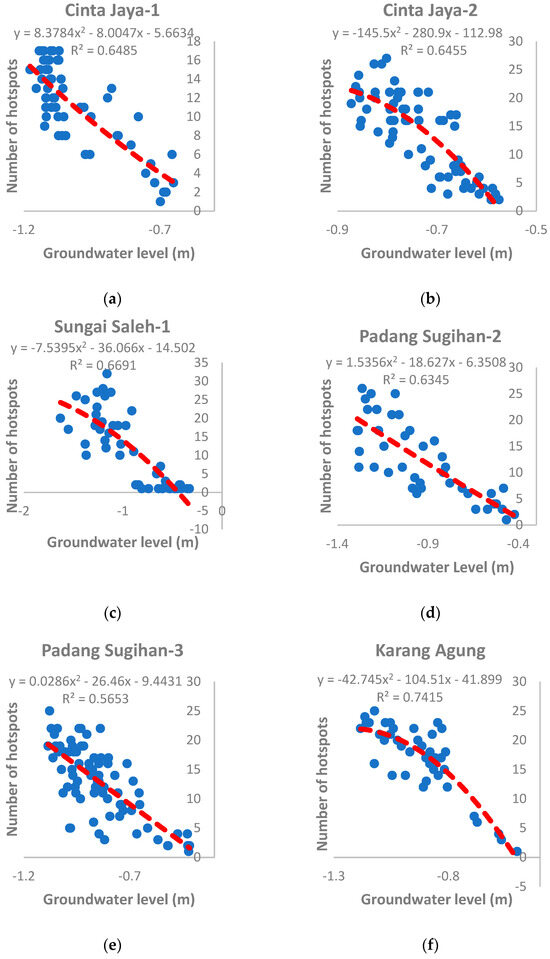
Figure 8.
(a–f) Correlation between groundwater level and hotspots in the period J−A−S−O 2019.
Table 2.
Statistical data for the correlation between GWL and the number of hotspots.
Table 3.
Statistical data for determining critical GWL.
The data obtained from critical GWL calculations at the six study locations were averaged and analyzed with the inclusion of standard deviation. Consequently, the average critical GWL value was determined to be (−0.45 ± 0.09) m. If the GWL is lower than 45 cm, then hotspots can appear on peatlands in South Sumatra because the surface of the peatland becomes very dry, and it can easily catch fire.
4. Discussion
This research shows that, in 2006, 2015, and 2019, the average daily precipitation was minimal. In 2006, El Niño occurred, which caused a daily average precipitation of only 2.05 mm/day. In 2015 and 2019, there was an IOD+ event, which caused the daily average precipitation in 2015 to only be 1.64 mm/day and, in 2019, only 2.07 mm/day. Previous studies have shown that the Indo-Pacific climate modes, namely IOD and ENSO, have been linked to the deficit in precipitation observed across the Indonesian region [13,38].
Hotspots always appear in varying numbers every dry season. The most hotspots appeared in 2006, 2015, and 2019. These results indicate that the presence of El Niño and IOD+ causes an increase in the number of hotspots. As shown by a previous study [39,40], the peat fires in South Sumatra were observed almost every year during the dry season with different intensities. These peat fires have a negative influence on the environment, causing haze pollution that disrupts daily activities, such as transportation, public health, and others [3,41,42].
Groundwater levels in the 2019 dry season experienced a sharp decline. This sharp decline occurred due to the IOD+ event. On 27 October 2019, at the KA station, the groundwater level decreased to a depth of −1.36 m. This sharp decline resulted in the peat soil surface being very dry, making it vulnerable to fire. In 2019, there was a massive fire in South Sumatra [35]. Figure 9 displays changes in daily GWL values of the two measurement stations in the 2019 J-A-S-O period.
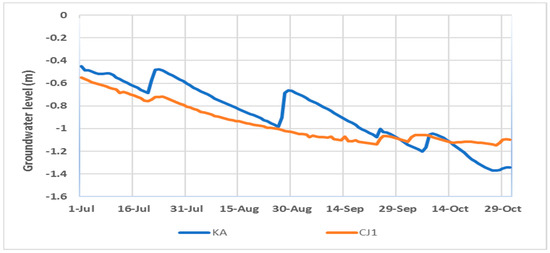
Figure 9.
GWL time series of two measurement stations in the period J−A−S−O 2019.
This research has also provided information about the correlation between groundwater levels and hotspots. The correlation between these two parameters shows that, the lower the groundwater level, the more hotspots that appear. It was also found that the correlation between the two parameters is significant, so the empirical equation that connects the two parameters can be used for another scientific study. Based on the empirical equation, the minimum value of the groundwater level that must be maintained to minimize the emergence of hotspots is −0.45 ± 0.09 m. By maintaining a minimum GWL value of −0.45 ± 0.09 m, it is expected that the peat soil surface will not be too dry, so hotspots will not easily appear, and plants will grow well. Various efforts can be made to maintain the ideal condition of the GWL. These efforts include, for example, making canal blocks that can regulate the flow of water from peatlands to plantation areas, making channels that can channel river water into peatlands, and reforesting deforested peatlands.
One of the pivotal aspects in understanding peat fires revolves around the concept of the GWL critical point, representing the juncture at which peat undergoes irreversible desiccation, rendering it highly susceptible to combustion [45,46]. These fires commonly coincide with periods of drought, prompting various methodologies for delineating this critical threshold, including assessments based on precipitation metrics. Previous research demonstrated that, during dry seasons characterized by rainfall levels below 100 mm/month, coupled with groundwater recharge rates below 20 mm/month, peatlands become markedly predisposed to ignition [47]. Taufik et al. (2015) introduced a hydrological approach by refining the Keetch–Byram Drought Index (KBDI), which integrates localized climate adjustments and incorporates peat water table depth as a dynamic variable, resulting in the modified Keetch–Byram Index (mKBDI), which furnishes invaluable predictions regarding the GWL criticality. Extensive investigations revealed that the critical GWL stands at 0.85 m for wetland forests in South Sumatra, 0.4 m for peatlands with canal networks in Kuburaya, and 0.6 m for burnt peat substrates [48]. In this paper, we obtain a critical GWL value of around 0.45 m for canalized peatlands where similar results were obtained by Taufik et al. in 2022 [48]. The congruence observed in these findings underscores the robustness of various methodologies associated with forest and peatland fire indices, rendering them pivotal for forest fire mitigation efforts. Among these, a proposed forest fire index, reliant on meteorological parameters including wind speed, temperature, and humidity, emerges as particularly noteworthy [49,50]. Leveraging satellite technology, this index offers real-time accessibility, making it a highly valuable asset for the early detection and management of forest and peatland fires.
5. Conclusions
Between 2001 and 2020, three major fires were recorded in peatland in South Sumatra, occurring in 2006, 2015, and 2019. The most severe of these fires occurred in 2015. Severe fires occur during extremely dry seasons as a result of the natural phenomenon known as the IOD+ and/or El Niño. Notably, the extreme dry season of 2019 was primarily attributed to the IOD+ phenomenon. During this period, rainfall was minimal, leading to a significant drop in groundwater levels. Consequently, the peatland surface became excessively dry and flammable.
This research convincingly demonstrates a significant correlation between GWL and the number of hotspots in several peatland areas in South Sumatra. As the GWL increased, the number of hotspots tended to decrease, and vice versa. This suggests a clear relationship between GWL and the number of hotspots, making it possible to use GWL as a parameter for managing hotspot emergence in peatland. Based on the study findings, it is recommended to maintain a GWL depth of −0.45 ± 0.09 m in peatland in South Sumatra to minimize the occurrence of hotspots.
Author Contributions
Conceptualization, M.I. and I.I.; methodology, M.I. and H.A.; software, K.S. and H.; validation, M.I., S. and I.I., formal analysis, M.I. and R.A.S.; investigation, M.I.; resources, A.; data curation, E.K.; writing—original draft preparation, M.I. and S.S.; writing—review and editing, I.I., A.S., E.C.; visualization, M.I.; supervision, R.A.S.; project administration, E.K. and S.S.; funding acquisition, R.A.S. and E.C. All authors have read and agreed to the published version of the manuscript.
Funding
This research was funded by University of Sriwijaya and The APC was funded by CIFOR-ICRAF.
Data Availability Statement
Data hotspots at https://firms2.modaps.eosdis.nasa.gov (accessed on 26 December 2023).
Acknowledgments
We thank the National Research and Innovation Agency (BRIN) for providing us with the SESAME data.
Conflicts of Interest
The authors declare no conflict of interest.
References
- Iriana, W.; Tonokura, K.; Inoue, G.; Kawasaki, M.; Kozan, O.; Fujimoto, K.; Ohashi, M.; Morino, I.; Someya, Y.; Imasu, R.; et al. Ground-based measurements of column-averaged carbon dioxide molar mixing ratios in a peatland fire-prone area of Central Kalimantan, Indonesia. Sci. Rep. 2018, 8, 8437. [Google Scholar] [CrossRef]
- Leng, L.Y.; Ahmed, O.H.; Jalloh, M.B. Brief review on climate change and tropical peatlands. Geosci. Front. 2019, 10, 373–380. [Google Scholar] [CrossRef]
- Osaki, M.; Tsuji, N. Tropical Peatland Ecosystems; Springer: Tokyo, Japan, 2015; pp. 1–651. [Google Scholar]
- Rudiyanto; Arief, C.; Saptono, S.K.; Gunawan, A.; Kuswarman; Sungkono; Indriyanto, E. Estimating distribution of carbon stock in tropical peatland using a combination of an empirical peat depth model and GIS. Procedia Environ. Sci. 2015, 24, 152–157. [Google Scholar] [CrossRef]
- Murdiyarso, D.; Lilleskov, E.; Kolka, R. Tropical peatlands under siege: The need for evidence-based policies and strategies. Mitig. Adapt. Strateg. Glob. Chang. 2019, 24, 493–505. [Google Scholar] [CrossRef]
- Park, H.; Takeuchi, W.; Ichii, K. Satellite-based estimation of carbon dioxide budget in tropical peatland ecosystems. Remote Sens. 2020, 12, 250. [Google Scholar] [CrossRef]
- Uda, S.K.; Hein, L.; Atmoko, D. Assessing the health impacts of peatland fires: A case study for Central Kalimantan, Indonesia. Environ. Sci. Pollut. Res. 2019, 26, 31315–31327. [Google Scholar] [CrossRef] [PubMed]
- Tacconi, L. Kebakaran Hutan di Indonesia: Penyebab, Biaya dan Implikasi Kebijakan; Center for International Forestry Research (CIFOR) and World Agroforestry Centre (ICRAF): Bogor, Indonesia, 2003; pp. 1–38. [Google Scholar]
- Huijnen, V.; Wooster, M.J.; Kaiser, J.W.; Gaveau, D.L.; Flemming, J.; Parrington, M.; Inness, A.; Murdiyarso, D.; Main, B.; van Weele, M. Fire carbon emissions over maritime Southeast Asia in 2015 largest since 1997. Sci. Rep. 2016, 6, 26886. [Google Scholar] [CrossRef] [PubMed]
- Ijumulana, J.; Ligate, F.; Bhattacharya, P.; Mtalo, F.; Zhang, C. Spatial analysis and GIS mapping of regional hotspots and potential health risk of fluoride concentrations in groundwater of northern Tanzania. Sci. Total Environ. 2020, 735, 139584. [Google Scholar] [CrossRef] [PubMed]
- Multsch, S.; Pahlow, M.; Ellensohn, J.; Michalik, T.; Frede, H.G.; Breuer, L. A hotspot analysis of water footprints and groundwater decline in the High Plains aquifer region, USA. Reg. Environ. Chang. 2016, 16, 2419–2428. [Google Scholar] [CrossRef]
- Takeuchi, W.; Hirano, T.; Roswintiarti, O. Estimation model of groundwater table at peatland in Central Kalimantan, Indonesia. In Tropical Peatland Ecosystems; Springer: Tokyo, Japan, 2015; pp. 445–453. [Google Scholar]
- Wang, G.; Cai, W. Two-year consecutive concurrences of positive Indian Ocean dipole and Central Pacific El Niño preconditioned the 2019/2020 Australian ‘black summer’ bushfires. Geosci. Lett. 2020, 7, 19. [Google Scholar] [CrossRef]
- Ratna, S.B.; Cherchi, A.; Osborn, T.J.; Joshi, M.; Uppara, U. The extreme positive Indian Ocean dipole of 2019 and associated Indian summer monsoon rainfall response. Geophys. Res. Lett. 2021, 48, e2020GL091497. [Google Scholar] [CrossRef]
- Sulman, B.N.; Desai, A.R.; Schroeder, N.M.; Ricciuto, D.; Barr, A.; Richardson, A.D.; Flanagan, L.B.; Lafleur, P.M.; Tian, H.; Chen, G.; et al. Impact of hydrological variations on modeling of peatland CO2 fluxes: Results from the North American carbon program site synthesis. J. Geophys. Res. Biogeosciences 2012, 117, 1–22. [Google Scholar] [CrossRef]
- Schroeder, W.; Giglio, L. NASA VIIRS Land Science Investigator Processing System (SIPS) Visible Infrared Imaging Radiometer Suite (VIIRS) 375 m & 750 m Active Fire Products: Product User’s Guide Version 1.4; NASA: Washington, DC, USA, 2018; pp. 2–23.
- Saji, N.H.; Goswami, B.N.; Vinayachandran, P.N.; Yamagata, T. A dipole mode in the tropical Indian ocean. Nature 1999, 401, 360–363. [Google Scholar] [CrossRef]
- Webster, P.J.; Moore, A.M.; Loschnigg, J.P.; Leben, R.R. Coupled ocean-atmosphere dynamics in the Indian Ocean during 1997–98. Nature 1999, 401, 356–360. [Google Scholar] [CrossRef]
- Il An, S.; Park, H.J.; Kim, S.K.; Shin, J.; Yeh, S.W.; Kug, J.S. Intensity changes of Indian Ocean dipole mode in a carbon dioxide removal scenario. npj Clim. Atmos. Sci. 2022, 5, 20. [Google Scholar] [CrossRef]
- Nurhayati, A.D.; Saharjo, B.H.; Sundawati, L.; Syartinilia, S.; Cochrane, M.A. Forest and peatland fire dynamics in South Sumatra Province. For. Soc. 2021, 5, 591–603. [Google Scholar] [CrossRef]
- Reddy, P.J.; Perkins-Kirkpatrick, S.E.; Sharples, J.J. Interactive influence of ENSO and IOD on contiguous heatwaves in Australia. Environ. Res. Lett. 2022, 17, 014004. [Google Scholar] [CrossRef]
- Wijaya, A.; Zakiyah, U.; Sambah, A.B.; Setyohadi, D. Spatio-temporal variability of temperature and chlorophyll-a concentration of sea surface in Bali Strait, Indonesia. Biodiversitas 2020, 21, 5283–5290. [Google Scholar] [CrossRef]
- Cao, T.; Zheng, F.; Fang, X. Key Processes on Triggering the Moderate 2020/21 La Niña Event as Depicted by the Clustering Approach. Front. Earth Sci. 2022, 10, 822854. [Google Scholar] [CrossRef]
- Hayashi, M.; Jin, F.F.; Stuecker, M.F. Dynamics for El Niño-La Niña asymmetry constrain equatorial-Pacific warming pattern. Nat. Commun. 2020, 11, 4230. [Google Scholar] [CrossRef] [PubMed]
- Sahu, N.; Behera, S.K.; Yamashiki, Y.; Takara, K.; Yamagata, T. IOD and ENSO impacts on the extreme stream-flows of Citarum river in Indonesia. Clim. Dyn. 2012, 39, 1673–1680. [Google Scholar] [CrossRef]
- Plach, J.; Strack, M.; Lucchese, M.; Cagampan, J.P.; Waddington, J.M. Reducing the Carbon Footprint of Canadian Peat Extraction and Restoration. AMBIO J. Hum. Environ. 2009, 38, 194–200. [Google Scholar]
- Hendrawan, I.G.; Asai, K.; Triwahyuni, A.; Lestari, D.V. The interannual rainfall variability in Indonesia corresponding to El Niño southern oscillation and Indian Ocean Dipole. Acta Oceanol. Sin. 2019, 38, 57–66. [Google Scholar] [CrossRef]
- Puryajati, A.D.; Wirasatriya, A.; Maslukah, L.; Sugianto, D.N.; Ramdani, F.; Jalil, A.R.; Andrawina, Y.O. The Effect of ENSO and IOD on the variability of sea surface temperature and rainfall in the Natuna Sea. IOP Conf. Ser. Earth Environ. Sci. 2021, 750, 012020. [Google Scholar] [CrossRef]
- Nur’utami, M.N.; Hidayat, R. Influences of IOD and ENSO to Indonesian rainfall variability: Role of atmosphere-ocean interaction in the Indo-Pacific sector. Procedia Environ. Sci. 2016, 33, 196–203. [Google Scholar] [CrossRef]
- Doi, T.; Behera, S.K.; Yamagata, T. Predictability of the super IOD event in 2019 and its link with El Niño Modoki. Geophys. Res. Lett. 2020, 47, e2019GL086713. [Google Scholar] [CrossRef]
- Lim, E.P.; Hudson, D.; Wheeler, M.C.; Marshall, A.G.; King, A.; Zhu, H.; Hendon, H.H.; de Burgh-Day, C.; Trewin, B.; Griffiths, M.; et al. Why Australia was not wet during spring 2020 despite La Niña. Sci. Rep. 2021, 11, 18423. [Google Scholar] [CrossRef] [PubMed]
- Makarim, S.; Sprintall, J.; Liu, Z.; Yu, W.; Santoso, A.; Yan, X.H.; Susanto, R.D. Previously unidentified Indonesian throughflow pathways and freshening in the Indian Ocean during recent decades. Sci. Rep. 2019, 9, 7364. [Google Scholar] [CrossRef] [PubMed]
- Jauhiainen, J.; Hooijer, A.; Page, S.E. Carbon dioxide emissions from an Acacia plantation on peatland in Sumatra, Indonesia. Biogeosciences 2012, 9, 617–630. [Google Scholar] [CrossRef]
- Cai, W.; Ng, B.; Wang, G.; Santoso, A.; Wu, L.; Yang, K. Increased ENSO sea surface temperature variability under four IPCC emission scenarios. Nat. Clim. Chang. 2022, 12, 228–231. [Google Scholar] [CrossRef]
- Hasudungan, P.; Irham, I.; Utami, A.W. The impact of El Nino southern oscillation and Covid-19 on the rice price dynamics in Indonesia: The vector error correction model approach. IOP Conf. Ser. Earth Environ. Sci. 2021, 883, 012061. [Google Scholar] [CrossRef]
- Sankar, S.; Thondithala Ramachandran, A.; Franck Eitel, K.G.; Kondrik, D.; Sen, R.; Madipally, R.; Pettersson, L.H. The influence of tropical Indian Ocean warming and Indian Ocean Dipole on the surface chlorophyll concentration in the eastern Arabian Sea. Biogeosci. Discuss. 2019, 1–23. [Google Scholar]
- Lim, E.P.; Hendon, H.H. Causes and predictability of the negative Indian Ocean Dipole and its impact on La Niña during 2016. Sci. Rep. 2017, 7, 12619. [Google Scholar] [CrossRef] [PubMed]
- Putra, R.; Zurfi, A.; Nufutomo, T.K.; Lisafitri, Y.; Sari, N.K. Spatial analysis of 2019 peat fire in South Sumatra conservation area. IOP Conf. Ser. Earth Environ. Sci. 2021, 830, 012038. [Google Scholar] [CrossRef]
- Sutikno, S.; Rinaldi, R.; Putri, R.A.; Khotimah, G.K. Study on the impact of canal blocking on groundwater fluctuation for tropical peatland restoration. IOP Conf. Ser. Mater. Sci. Eng. 2020, 933, 012052. [Google Scholar] [CrossRef]
- Dadap, N.C.; Cobb, A.R.; Hoyt, A.M.; Harvey, C.F.; Konings, A.G. Satellite soil moisture observations predict burned area in Southeast Asian peatlands. Environ. Res. Lett. 2019, 14, 094014. [Google Scholar] [CrossRef]
- Adinugroho, W.C.; Imanuddin, R.; Krisnawati, H.; Syaugi, A.; Santosa, P.B.; Qirom, M.A.; Prasetyo, L.B. Exploring the potential of soil moisture maps using sentinel imagery as a proxy for groundwater levels in peat. IOP Conf. Ser. Earth Environ. Sci. 2021, 874, 012011. [Google Scholar] [CrossRef]
- Putra, R.; Sutriyono, E.; Kadir, S.; Iskandar, I.; Lestari, D.O. Dynamical link of peat fires in South Sumatra and the climate modes in the Indo-Pacific region. Indones. J. Geogr. 2019, 51, 18–22. [Google Scholar] [CrossRef][Green Version]
- Gaveau, D.L.A.; Salim, M.A.; Hergoualc’H, K.; Locatelli, B.; Sloan, S.; Wooster, M.; Marlier, M.E.; Molidena, E.; Yaen, H.; DeFries, R.; et al. Major atmospheric emissions from peat fires in Southeast Asia during non-drought years: Evidence from the 2013 Sumatran fires. Sci. Rep. 2014, 4, 6112. [Google Scholar] [CrossRef]
- Huang, P.; Zheng, X.T.; Ying, J. Disentangling the changes in the Indian Ocean dipole-related SST and rainfall variability under global warming in CMIP5 models. J. Clim. 2019, 32, 3803–3818. [Google Scholar] [CrossRef]
- Taufik, M.; Torfs, P.J.J.F.; Uijlenhoet, R.; Jones, P.D.; Murdiyarso, D.; Van Lanen, H.A.J. Amplification of wildfire area burnt by hydrological drought in the humid tropics. Nat. Clim. Chang. 2017, 7, 428–431. [Google Scholar] [CrossRef]
- Taufik, M.; Veldhuizen, A.A.; Wösten, J.H.M.; van Lanen, H.A.J. Exploration of the importance of physical properties of Indonesian peatlands to assess critical groundwater table depths, associated drought and fire hazard. Geoderma 2019, 347, 160–169. [Google Scholar] [CrossRef]
- Taufik, M.; Setiawan, B.I.; van Lanen, H.A.J. Modification of a fire drought index for tropical wetland ecosystems by including water table depth. Agric. For. Meteorol. 2015, 203, 1–10. [Google Scholar] [CrossRef]
- Taufik, M.; Widyastuti, M.T.; Sulaiman, A.; Murdiyarso, D.; Santikayasa, I.P.; Minasny, B. An improved drought-fire assessment for managing fire risks in tropical peatland. Agric. For. Meteorol. 2022, 312, 108738. [Google Scholar] [CrossRef]
- Hayasaka, H.; Usup, A.; Naito, D. New Approach Evaluating Peatland Fires in Indonesian Factors. Remote Sens. 2020, 12, 2055. [Google Scholar] [CrossRef]
- Hayasaka, H. Fire Weather Conditions in Plantation Areas in Northern Sumatra, Indonesia. Atmosphere 2023, 14, 1480. [Google Scholar] [CrossRef]


Disclaimer/Publisher’s Note: The statements, opinions and data contained in all publications are solely those of the individual author(s) and contributor(s) and not of MDPI and/or the editor(s). MDPI and/or the editor(s) disclaim responsibility for any injury to people or property resulting from any ideas, methods, instructions or products referred to in the content. |
© 2024 by the authors. Licensee MDPI, Basel, Switzerland. This article is an open access article distributed under the terms and conditions of the Creative Commons Attribution (CC BY) license (https://creativecommons.org/licenses/by/4.0/).