Article

Unveiling Sri Lanka’s Wilderness: GIS-Based Modelling of Wilderness Attributes

1
Department of Geography, University of Peradeniya, Peradeniya 20400, Sri Lanka
2
School of Geography, University of Leeds, Leeds LS2 9JT, UK
*
Author to whom correspondence should be addressed.
Land 2024, 13(4), 402; https://doi.org/10.3390/land13040402
Submission received: 2 February 2024 / Revised: 6 March 2024 / Accepted: 14 March 2024 / Published: 22 March 2024
(This article belongs to the Special Issue Geospatial Data in Landscape Ecology and Biodiversity Conservation)

Abstract

:
This research presents the first detailed national wilderness mapping project conducted in Sri Lanka, aiming to identify and assess the spatial distribution of wilderness areas in the country. The study utilises a GIS-based Wilderness Quality Index (WQI), incorporating three main wilderness attributes: remoteness from public roads, absence of modern human interventions, and naturalness of land cover. The resulting wilderness quality map reveals several areas of high wilderness quality distributed throughout the country, with exceptions in the highly populated western region, where roads and built structures have significant impact. The research highlights the spatial correlation between the distribution of wilderness areas and protected areas, indicating that nearly all wilderness areas in Sri Lanka fall within the boundaries of existing protected areas. However, core wilderness areas outside existing protected areas, termed de facto wilderness areas, constitute a significant portion (19.7%) of total wilderness, raising concerns about their conservation status. The study emphasises the need for further evaluation to assess the ecological and landscape value of these areas and suggests new protected area boundaries. The wilderness quality map developed here provides policymakers with a valuable tool for future conservation planning, enabling informed decision making to preserve and protect Sri Lanka’s diverse and unique wilderness areas.

1. Introduction

The International Union for Conservation of Nature (IUCN) defines wilderness areas as typically large, unmodified or slightly modified regions that maintain their natural character and influence, devoid of permanent or significant human habitation, and managed to preserve their natural condition [1]. These areas encompass large, uninhabited landscapes such as rainforests, canyons, or mountainous forest regions, often protected within national parks or other IUCN designations [2]. However, the concept of wilderness is inherently subjective due to cultural, geographical, and legal influences. This is noted by Nash [3], who succinctly states that ‘wilderness is what men think it is’ (p. 5). Carver et al. [4] emphasise the subjective nature of wilderness, recognising its fuzzy and qualitative essence. Nevertheless, the core idea remains constant in that wilderness represents landscapes that are primarily unaffected by human activity, maintaining their natural integrity with minimal human intervention. Being able to reliably map and defend the boundaries of wilderness areas is important for their protection, yet the spatial definition of wilderness varies based on geographical, social, cultural, and legal considerations, thus underscoring the complexity of identifying these areas.
The value of wilderness extends beyond landscapes devoid of human presence [5], serving a crucial role in providing various services, including biodiversity conservation, ecosystem preservation, climate regulation, and opportunities for scientific research. Safeguarding wilderness is critical for global ecosystem health, supporting biodiversity and ensuring the well-being of present and future generations. Alarmingly, an estimated 9.6% of terrestrial wilderness areas have been lost in the past 20 years [6]. The post-2020 Global Biodiversity Framework identifies protecting existing wilderness areas as the primary action target for 2030, emphasising the need for integrated biodiversity-inclusive spatial planning [7]. Therefore, decisive measures must be taken to safeguard and preserve wilderness areas globally, and for that robust and reliable mapping is required such that boundaries for legal and policy protection may be defined.
Accurate identification of wilderness locations is paramount for preservation efforts, and the creation of wilderness maps serves as a vital tool in this endeavour. These maps are essential for conservation organisations and land managers, aiding in prioritising and directing efforts toward the protection of ecologically significant habitats. Wilderness maps offer crucial information about the spatial distribution, size, and condition of these untamed areas [8].
Diverse interpretations of wilderness have resulted in the adoption of varying methodologies and techniques for wilderness mapping projects. Notably, the Australian National Wilderness Inventory (NWI) was an early adopter of geographic information system (GIS) technology in mapping wilderness quality, employing four specific criteria for assessing the wilderness attributes [9,10]. Over time, numerous research initiatives have worked to map existing wilderness areas at different geographical scales, leveraging GIS and remote sensing technologies to improve the accuracy and reliability of the maps produced [4,8,11,12,13].
Global projects, such as the human footprint [13], capture human influence, employing proxies like population density and land transformation, accessibility, and electrical power infrastructure. Furthermore, there have been many other research projects on mapping wilderness characteristics at a global scale [6,14,15]. Despite advancements in mapping approaches [16], global projects often rely on proxy measures that can be criticised for not fully embodying the wilderness definition or using direct measurement of human impacts on wildness [12]. In addition, the use of low-resolution global data for modelling the human footprint often misses the local- and regional-level details that are crucial in reliably and accurately representing spatial variations in wilderness quality on the ground.
At the continental level, Henry and Husby [17] measured Euro-Arctic Barents region wilderness quality based on remoteness and naturalness, while Ceausu et al. [18] mapped Europe’s wilderness using metrics like artificial light and human accessibility. National-level projects, exemplified by Carver et al.’s [12] Iceland-specific approach, emphasise robust models over simple proxies, employing attributes like remoteness from mechanised access and lack of visual intrusion from human artefacts.
Different national-scale GIS-based projects, such as those of Cao et al. [8], Carver et al. [12], Müller, Bøcher, and Svenning [19], Măntoiu et al. [20], Ólafsdóttir et al. [21], and Plutzar et al. [22], have adopted varying methodologies attuned to national datasets, landscapes, and culture. Local-level studies, like Carver et al.’s [4] focus on Scottish national parks, highlight attributes like naturalness and ruggedness. In China, Cao et al. [8] use different methodological approaches, comparing weighted linear combination and Boolean overlay and their effects on mapping wilderness quality. Despite these diverse approaches, the need for more robust and repeatable methods to capture true wilderness is emphasised [12].
Transitioning from broad-scale global mapping projects such as the human footprint, this paper shifts its focus to Sri Lanka; a tropical island located in the Indian Ocean. This paper introduces a GIS model tailored to the nation’s unique geographical, ecological, and cultural context to map its wilderness quality. While numerous international initiatives have made strides in wilderness mapping, a critical gap persists in the comprehensive representation of wilderness areas at the national and local levels. This lacuna is particularly pronounced in Sri Lanka, a nation renowned for its rich biodiversity and expansive forest cover, making it one of the richest countries in terms of species concentration in the Asian region [23].
However, this natural wealth faces significant challenges due to deforestation and environmental degradation. The WCS human footprint data reveal a concerning trend, indicating a rise in the cumulative direct and indirect impact of human activities on nature in Sri Lanka, increasing from 16.5% to 20.3% between 2000 and 2019 [24]. Despite the substantial efforts in forest conservation and protection, with approximately 35% of the total land area (2.3 million ha) declared as protected areas [25], Sri Lanka lacks a comprehensive mapping programme for wilderness areas and their boundaries with no evidence in the literature of any local mapping projects focusing on Sri Lankan wilderness areas. Although the global human footprint maps offer insights into the areas relatively untouched by human impacts in Sri Lanka [13] (Figure 1a), they rely on global datasets and global definitions of wilderness, potentially leading to inaccuracies and unreliable results when compared to local ground conditions. As such, utilising globally derived methods for wilderness mapping may not be appropriate for capturing the unique social, cultural, and legal context of wilderness areas in Sri Lanka. A more geographically context-specific approach is essential to develop a distinct locally relevant model accurately representing patterns in the country’s true wilderness condition. Moreover, there is a need for high-resolution wilderness maps based on local datasets to capture the full details of wilderness quality across the country.
We develop a geographic information system (GIS)-based model tailored to local perceptions and understandings of wilderness specific to Sri Lanka. The primary goal is to construct a map that not only quantifies the spatial extent and distribution patterns of wilderness but also aligns with the unique characteristics and values assigned to wilderness by the local population and culture. The study’s objectives include not only the development of a GIS model but also a quantitative assessment of wilderness quality and a comparative analysis with existing protected area boundaries. This comparative approach aims to reveal any disparities or variations in wilderness patterns relative to protected area boundaries, enabling a comprehensive understanding of the conservation landscape in Sri Lanka, and provide policymakers with a robust baseline for monitoring and addressing changes in wilderness areas over time. The high-resolution wilderness map generated through this study will not only aid conservationists and land managers in prioritising and directing their efforts but will also empower the nation to adopt tailored conservation strategies aligned with its unique environmental context.
The aims of this research are to:
  • construct a GIS-based spatial model that effectively captures the local perception and understanding of wilderness in Sri Lanka; and
  • quantitatively assess the spatial extent and distribution patterns of wilderness quality in Sri Lanka; and
  • conduct a comparative analysis of the wilderness map of Sri Lanka with existing protected area boundaries to identify and examine any disparities or variations.

2. Materials and Methods

2.1. Study Area

Sri Lanka is situated south of the Tropic of Cancer between 5°55′ and 9°51′ north latitude and 79°41′ and 81°54′ east longitude. It is an island nation with a land area of 65,610 square kilometres, primarily characterised by flat to rolling coastal plains and a mountainous interior rising to a maximum altitude of 2506 m. The terrain features distinct zones based on elevation: the Central Highlands, plains, and coastal belt (Figure 1b). In terms of land use, the country primarily comprises agricultural expanses, forests, built-up areas, reservoirs, and lakes. Its road infrastructure effectively links together various parts of the country (Figure 1c).
Rivers originating in the Central Highlands follow a radial pattern towards the sea, giving rise to 103 river basins that contribute to diverse ecosystems in floodplain areas. Sri Lanka boasts remarkable ecological diversity, with various climatic zones, each hosting unique forest types ranging from tropical rainforests, montane cloud forests, dry zone monsoon forests, and arid thorn scrub forests. Sri Lanka, together with the Western Ghats of India, has been recognised as one of the 35 global biodiversity hotspots in the world [27]. Furthermore, the diverse natural terrain of the nation provides a habitat for a wide range of flora and fauna. According to data from the IUCN Sri Lanka database [28], a total of 7828 species of plants and animals have been documented in Sri Lanka. This includes 4203 species of flowering plants, 119 species of freshwater fish, 498 species of birds, 245 species of butterflies, 217 species of reptiles, 141 species of mammals, and 119 species of amphibians. These species thrive in various ecosystems within the country, including coastal areas, inland aquatic environments, natural forests, and grasslands. Notably, Sri Lanka boasts 1233 km2 of lowland rainforests, 1178 km2 of moist monsoon forests, and 11,213 km2 of dry monsoon forests, as highlighted by Gunatilleke et al. [29].
The terminology ‘wilderness’ or ‘wilderness areas’ is explicitly referenced in the National Heritage Wilderness Areas Act, instituted by the Sri Lankan government in 1988. This legislative framework identifies specific territories distinguished by their notable significance for biodiversity, encompassing habitats that host rare and endangered species, pivotal watershed zones, and locations of exceptional aesthetic importance, designating them as National Heritage Wilderness Areas [30].
In the cultural context of Sri Lanka, the perception of ‘wilderness areas’ is articulated through the Sinhala term ‘පා ළුකරය’ (Paalukaraya). In Sinhala, the official language of Sri Lanka, this term translates in English to ‘deserted areas’ or ‘areas empty of people’. Significantly, this Sinhala designation aligns with the IUCN category 1b areas, characterised by their predominantly unmodified or slightly modified nature, devoid of permanent or significant human habitation and influence.

2.2. Method Development and Attribute Selection

Various GIS-based wilderness mapping approaches, such as fuzzy methods [31], multi-criteria evaluation [4,11,12], Boolean methods [14], and Boolean overlay integrated with multi-criteria evaluation [8], have been employed. Among multi-criteria evaluation methods, weighted linear combination (WLC) is commonly used to map the wilderness continuum (e.g. [4,8]). Considering available techniques, this study opts for multi-criteria evaluation (MCE) with a simple addition of attributes to measure wilderness quality in Sri Lanka, serving as baseline research and identifying potential research gaps [11]. National and local wilderness mapping projects using MCE methods employ diverse attributes for composite wilderness quality maps, including remoteness from access or settlements, minimal visual intrusion from human artefacts, naturalness of land cover, rugged terrain, underdeveloped landscape, solitude, low recreation impact, population, settlements, and infrastructure density [4,8,11,12].
Considering prior wilderness attribute choices at national and local levels, this study opts for three attributes to gauge wilderness quality in Sri Lanka: (1) remoteness from public roads, encompassing motorways, trunk roads, primary, secondary, tertiary roads, residential lanes, unclassified roads, unsurfaced/unpaved roads, tracks; (2) absence of modern human interventions, including buildings, and other built features such as roads and railways; and (3) naturalness of land cover. Furthermore, informal discussions among fifteen people consisting of family members, colleagues, officers from the forest department, and experts from Sri Lanka were useful in understanding how locals understand wilderness in Sri Lanka. The three attributes were chosen to align with the local concept of wilderness in Sri Lanka, characterised as ‘deserted areas’ or ‘areas empty of people’. However, it is worth noting that the ‘ruggedness of the terrain’ has not been considered a wilderness attribute for this study. Some research on wilderness quality mapping has used the ‘ruggedness of the terrain’ as a critical attribute [4]. However, it was decided not to select ruggedness as a wilderness attribute to model wilderness in Sri Lanka. The island has a mountainous central highland, which may result in bias toward more wilderness areas in the central highlands and overlook wilder areas in the coastal plains. Furthermore, in the Sri Lankan context, the local people do not define wilderness based on the ruggedness of the terrain.

2.3. Development of Principal Wilderness Attributes and Data Sources

The ‘Wilderness Quality Index’ (WQI) in Sri Lanka uses a multi-criteria evaluation (MCE) method, combining the three key attributes of: (1) remoteness from roads, (2) absence of human interventions, and (3) naturalness of land cover to model wilderness quality nationwide (Figure 2).
Five sets of data are employed in this study to characterise wilderness quality. Table 1 provides an overview of the data layers, encompassing terrain, land cover, railways, roads, buildings, and other constructed structures. The terrain data were acquired from the Survey Department of Sri Lanka, serving as the primary national repository for such information. The remaining data layers were sourced from global datasets, available in either vector or raster formats. Moreover, the dataset pertaining to protected areas, utilised in subsequent analyses, was obtained from a global database due to the absence of relevant data from national sources.

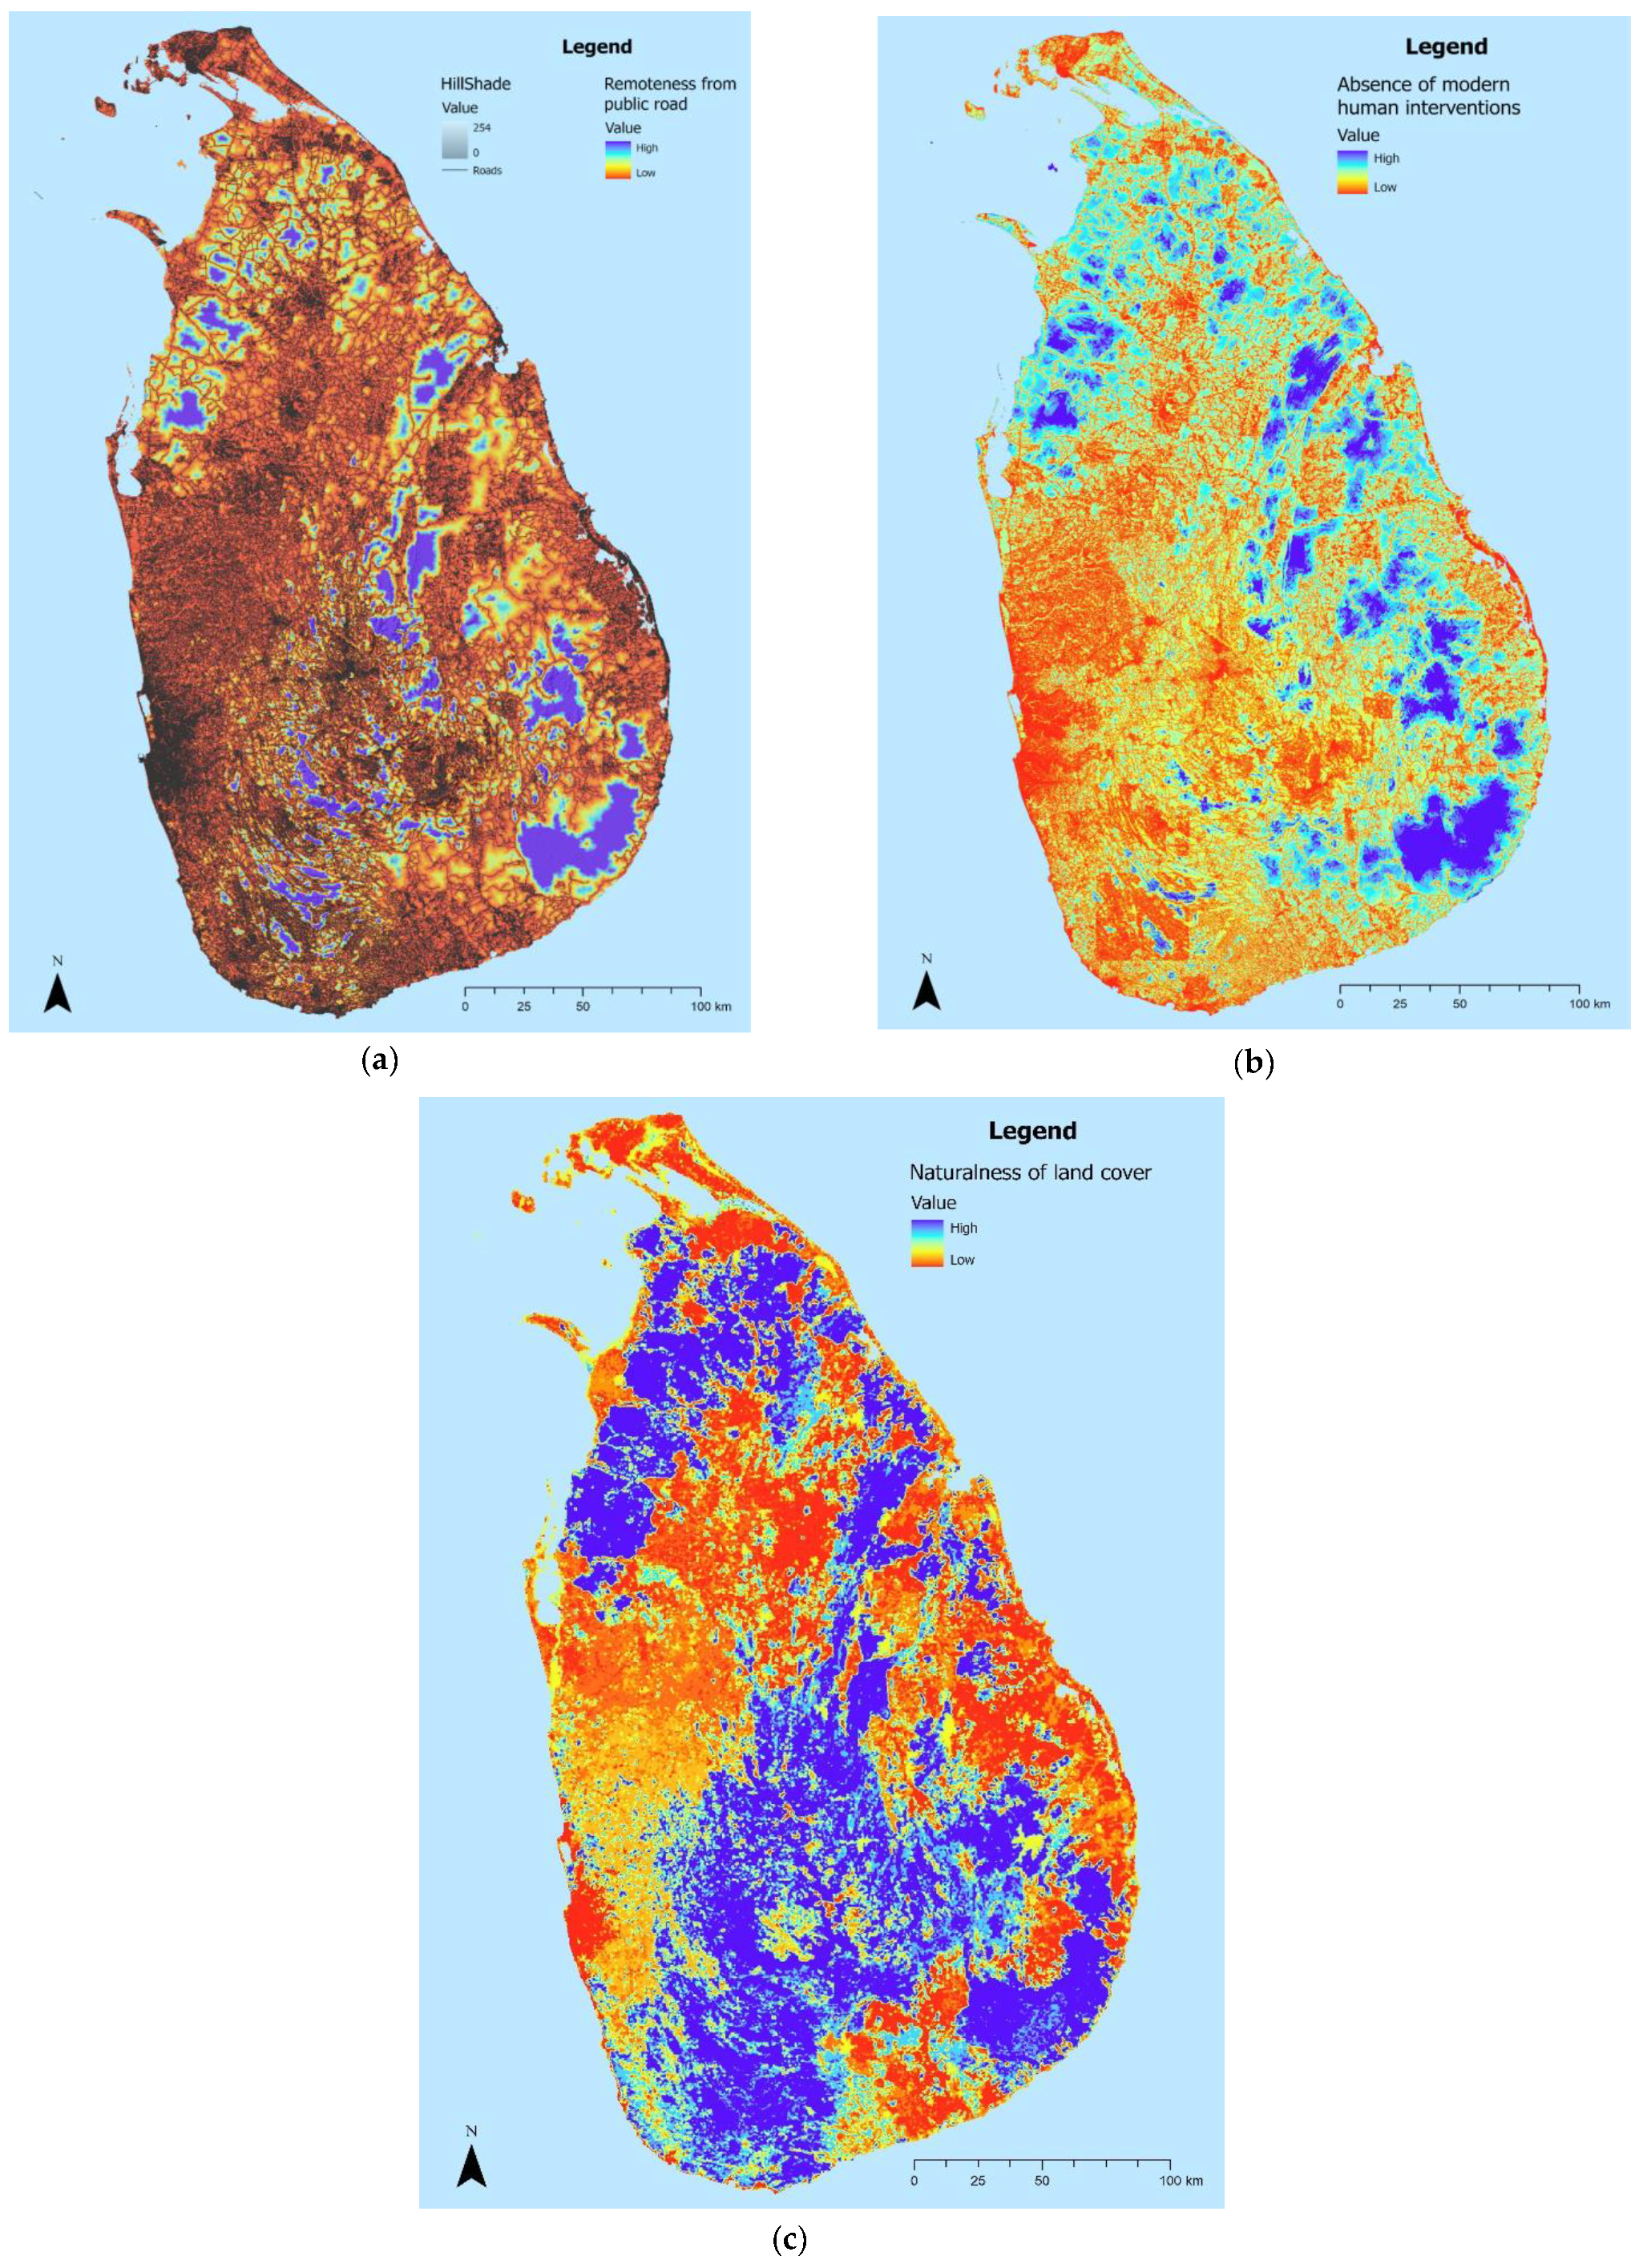
2.3.1. Remoteness from Public Roads

Remoteness significantly shapes wilderness quality, impacting individuals’ emotional experience of disconnection from modern life and reliance on mechanical transportation [12]. Remoteness explains how separated a place or people are from modern development, such as roads. Factors such as terrain and land cover are crucial in determining the degree of remoteness. Simply measuring linear distance from roads does not provide an accurate representation of true remoteness. Naismith’s rule is a technique employed to calculate walking times in mountainous regions. It utilises detailed terrain and land cover data to estimate the time needed to walk from the nearest road, considering factors like distance, gradient, ground cover, and obstacles such as water bodies and steep terrain [4]. Utilising a GIS implementation of Naismith’s rule has proven effective in capturing remoteness, as demonstrated by previous research focused on mapping wilderness quality [4,12,30]. Carver and Fritz [32] provide a detailed account of how Naismith’s rule can be used to measure remoteness for wilderness mapping. Given Sri Lanka’s diverse terrain, remoteness is a key wilderness attribute and so was modelled using Naismith’s rule adapted from Carver et al. [4,12] to estimate walking times from the nearest road. The model was conducted using the Path Distance tool in ArcGIS Pro 3.0. It estimates how quickly someone can walk across different terrains by considering things like the angles of slopes, the type of ground cover, and any obstacles like lakes or steep slopes and assigns appropriate values to them. The data layers used for modelling remoteness are a detailed terrain model accounting for slope and aspect; a road network as the source cells; land cover data as the cost surface; and barrier features such as slopes greater than 45 degrees and open water. The output represents the shortest travel time on foot in seconds from the nearest point accessible by mechanised means.

2.3.2. Absence of Modern Human Interventions

This study explores the absence of human artefacts visible within the landscape from any point. Previous research has often relied on distance measurements to identify areas lacking human artefacts (e.g., [10,13]). Recent studies, including Carver et al. [4,12], employ viewshed analyses for assessing the visibility of human artefacts as a measurement of human impact on wilderness quality. These studies focus on roads, railways, buildings, and other structures such as renewable energy and power transmission and utilise viewshed tools to calculate ‘line of sight’ and distance decay effects [4].
In this study, human constructions such as roads, railways, and buildings were selected for analysis. To assess their visibility, a custom viewshed tool, Viewshed Explorer, was employed. This tool uses a viewshed algorithm to calculate the visibility of one point on the terrain surface from another, considering factors like distance decay effects, which influence relative visibility. The inputs for the tool consisted of a terrain model (DEM) with a cell resolution of 50 m, along with a raster layer only depicting roads, railways, buildings, and other built features. This raster layer contained height values corresponding to the height of these features on the terrain, indicating their relative height and prominence. The Viewshed Explorer tool employed the square distance function to calculate visibility. The output of this analysis indicates the extent to which human-made structures are visible from various points on the terrain. The output files generated by Viewshed Explorer were further processed using ArcGIS Pro 3.0.

2.3.3. Naturalness of Land Cover

Naturalness of land cover is gauged by the degree of modification of vegetation patterns in comparison to what would be naturally occurring in the absence of human influence [12]. The land cover data, sourced from the Copernicus Climate Change Service in 2018 (Table 1), were reclassified into six naturalness classes. These classes are defined as follows: no data (0), urban (1), croplands/lakes (2), sparse vegetation/shrubs/grasslands (3), tree or forest cover and shrubs (4), and tree or forest cover (5). In this classification, a value of 1 denotes the least natural, while 5 signifies the most natural, leaning towards wilderness.
The output map was visually validated against Google Earth imagery. Using the Focal Statistics tool in ArcGIS Pro 3.0, naturalness classes were converted to unitless values, considering the impact of surrounding land cover within 250 m [4]. This approach calculates the average naturalness score for cells surrounding the target cell up to a distance wherein the casual observer can discern the likely degree of human modification of land cover, thus aiding in a comprehensive assessment.

2.4. Development of Wilderness Quality Index, Wilderness Zones, and Wilderness Patches

Wilderness attributes were normalised on a unitless scale using the method outlined by Carver et al. [12]. The initial values of the wilderness attribute layers were adjusted to a scale ranging from 1 to 256 using the Slice tool in ArcGIS Pro 3.0. This approach facilitates the comparison of all attributes on a common scale, where higher values indicate greater wilderness. The final WQI was established by summing up these normalised attributes together in an unweighted multi-criteria evaluation model using the Raster Calculator, assigning equal importance to each attribute. This study represents the inaugural wilderness mapping endeavour in Sri Lanka. Therefore, it was determined that all wilderness attributes would be treated as equally significant in modelling wilderness, serving as a foundational study. Additionally, employing an unweighted MCE model of wilderness can illustrate how each attribute collectively forms a simplified version of wilderness. This approach aims to avoid complexities and offer insights into potential avenues for future research to model Sri Lanka’s wilderness in diverse ways. The final WQI was classified into six categories using the Jenks ‘natural breaks’ method, following Carver et al. [12]. This method aims to minimise the deviation from the average value within each group [12]. The classes range from 1—developed to 6—very high wilderness quality, representing the least to most wild areas. For further analysis, classes 5 and 6 were reclassed as ‘wilderness areas’, and the other classes (1–4) as ‘no data’.
The ‘Region Group’ tool was employed to isolate each distinct wilderness area into separate patches, and then the Zonal Geometry tool was used to calculate the size of each individual wilderness patch. Additionally, all patches were categorised into four classes based on their size ranges: 1 km2 to 9 km2, 10 km2 to 99 km2, 100 km2 to 999 km2, and 1000 km2 to 1550 km2. No specific threshold size was adhered to [33], but 18 patches exceeding 100 km2 were flagged for conservation consideration. All patches, regardless of size, were deemed wild, emphasising the study’s comprehensive assessment.
Wilderness areas were compared with Sri Lanka’s existing protected areas using the protected area boundaries available on the World Database on Protected Areas (WDPA) [34]. Unpublished data suggest that Sri Lanka has around 23,000 km2 of protected areas, constituting approximately 35% of the total land area [25]. In contrast, WDPA [34] reports 19,897 km2, covering about 29.86% of the country. Due to the unavailability of local datasets on the spatial distribution of protected areas to the public, this study relies on WDPA for analysis and employs global datasets.
WDPA protected area boundaries were rasterised and then compared with the wilderness areas using Raster Calculator in ArcGIS Pro 3.0. The comparison revealed de jure (protected) and de facto (non-protected) wilderness areas, acknowledging the WDPA dataset’s incompleteness but recognising it as the best available for national protected areas. Furthermore, the Department of Forest Conservation of Sri Lanka [35] designates some of the de facto wilderness areas as ‘reserved forests’ or ‘other state forest’. However, the lack of spatial boundaries for these protected areas hinders the comparison of their distribution with the de facto wilderness areas. Hence, the absence of spatial boundaries limits further analysis.

3. Results

3.1. Wilderness Attributes

3.1.1. Remoteness from Public Roads

The remoteness attribute, developed according to procedures in Section 2.3.1, yielded a map (Figure 3a) pinpointing areas distant from public roads, based on terrain and land cover. Higher remoteness levels are scattered nationwide, with a concentration in the south-east, north-west, and north-east of the country.

3.1.2. Absence of Modern Human Interventions

Following the method described in Section 2.3.2, the absence of modern human interventions attribute was mapped (Figure 3b). This highlights the visual impact from roads, railways, and buildings, with the highest values indicating total visual isolation where no human artefacts are visible in the landscape. Most regions with total visual isolation cluster in the north-western, north-eastern, and south-eastern quadrants. Surprisingly, terrain ruggedness minimally influences zero-intrusion areas, as roads and buildings are widespread, except in certain protected regions.

3.1.3. Naturalness of Land Cover

Developed as per the method described in Section 2.3.3, the naturalness attribute map (Figure 3c) indicates higher values in the south-west and protected areas, suggesting greater naturalness. Coastal regions generally show lower naturalness, with a few exceptions in the south and north-west of the country.

3.2. Wilderness Quality Index (WQI) and Wilderness Zones

The WQI (Figure 4a) integrates the three-input attribute models; remoteness from roads, absence of human interventions, and naturalness, yielding values ranging from high to low. High WQI values signify areas with elevated wilderness quality, where all attributes exhibit high values. Conversely, low WQI values indicate regions with lower wilderness quality, where either all three or at least one attribute has low values. The resulting wilderness map depicts a spectrum of qualities across the study area.
Figure 4b displays an adapted wilderness zone map with four zones: core, buffer, semi-wild, and not wild. Not wild areas show consistent patterns of roads, buildings, and modified land use. Core and buffer areas predominantly correspond to the locations of existing protected areas, indicating significant wildness. Semi-natural areas in these zones are influenced by the absence of roads and buildings, while in the south-west, inherent natural land cover contributes to distinct characteristics within the semi-wild zone.

3.3. Wilderness Areas by Size

The ‘core’ and ‘buffer’ areas identified in Section 3.2 are exclusively recognised as wilderness areas, collectively covering a land area of 10,976 km2. These areas are further classified based on their patch sizes. There are a total of 201 identified wilderness patches, varying in size from 1 km2 to 1550 km2. The largest is 1550 km2 in size, while 102 fall in the 100 km2 to 99 km2 category. Larger patches, including Yala National Park, Gal Oya National Park, and Wilpattu National Park, cluster in the north-west, east, and south-east, with the south-west having smaller and fewer patches. Eighteen wilderness areas exceed 100 km2, considered significant for enhanced wilderness functionality. Figure 5 depicts their distribution, while Table 2 summarises character.
Most wilderness patches fall within the altitude range of 1 m to 835 m. Only three patches exceed an altitude of 1000 m above sea level. Higher altitudes correlate with smaller sizes, e.g., the Peak Wilderness Nature Reserve (574 m to 2061 m) is 120 km2. Larger wilderness areas generally occur at lower altitudes, e.g., Yala and Wilpattu National Parks consist of coastal wilderness areas. This is fundamentally influenced by the distribution pattern of protected areas in the country.

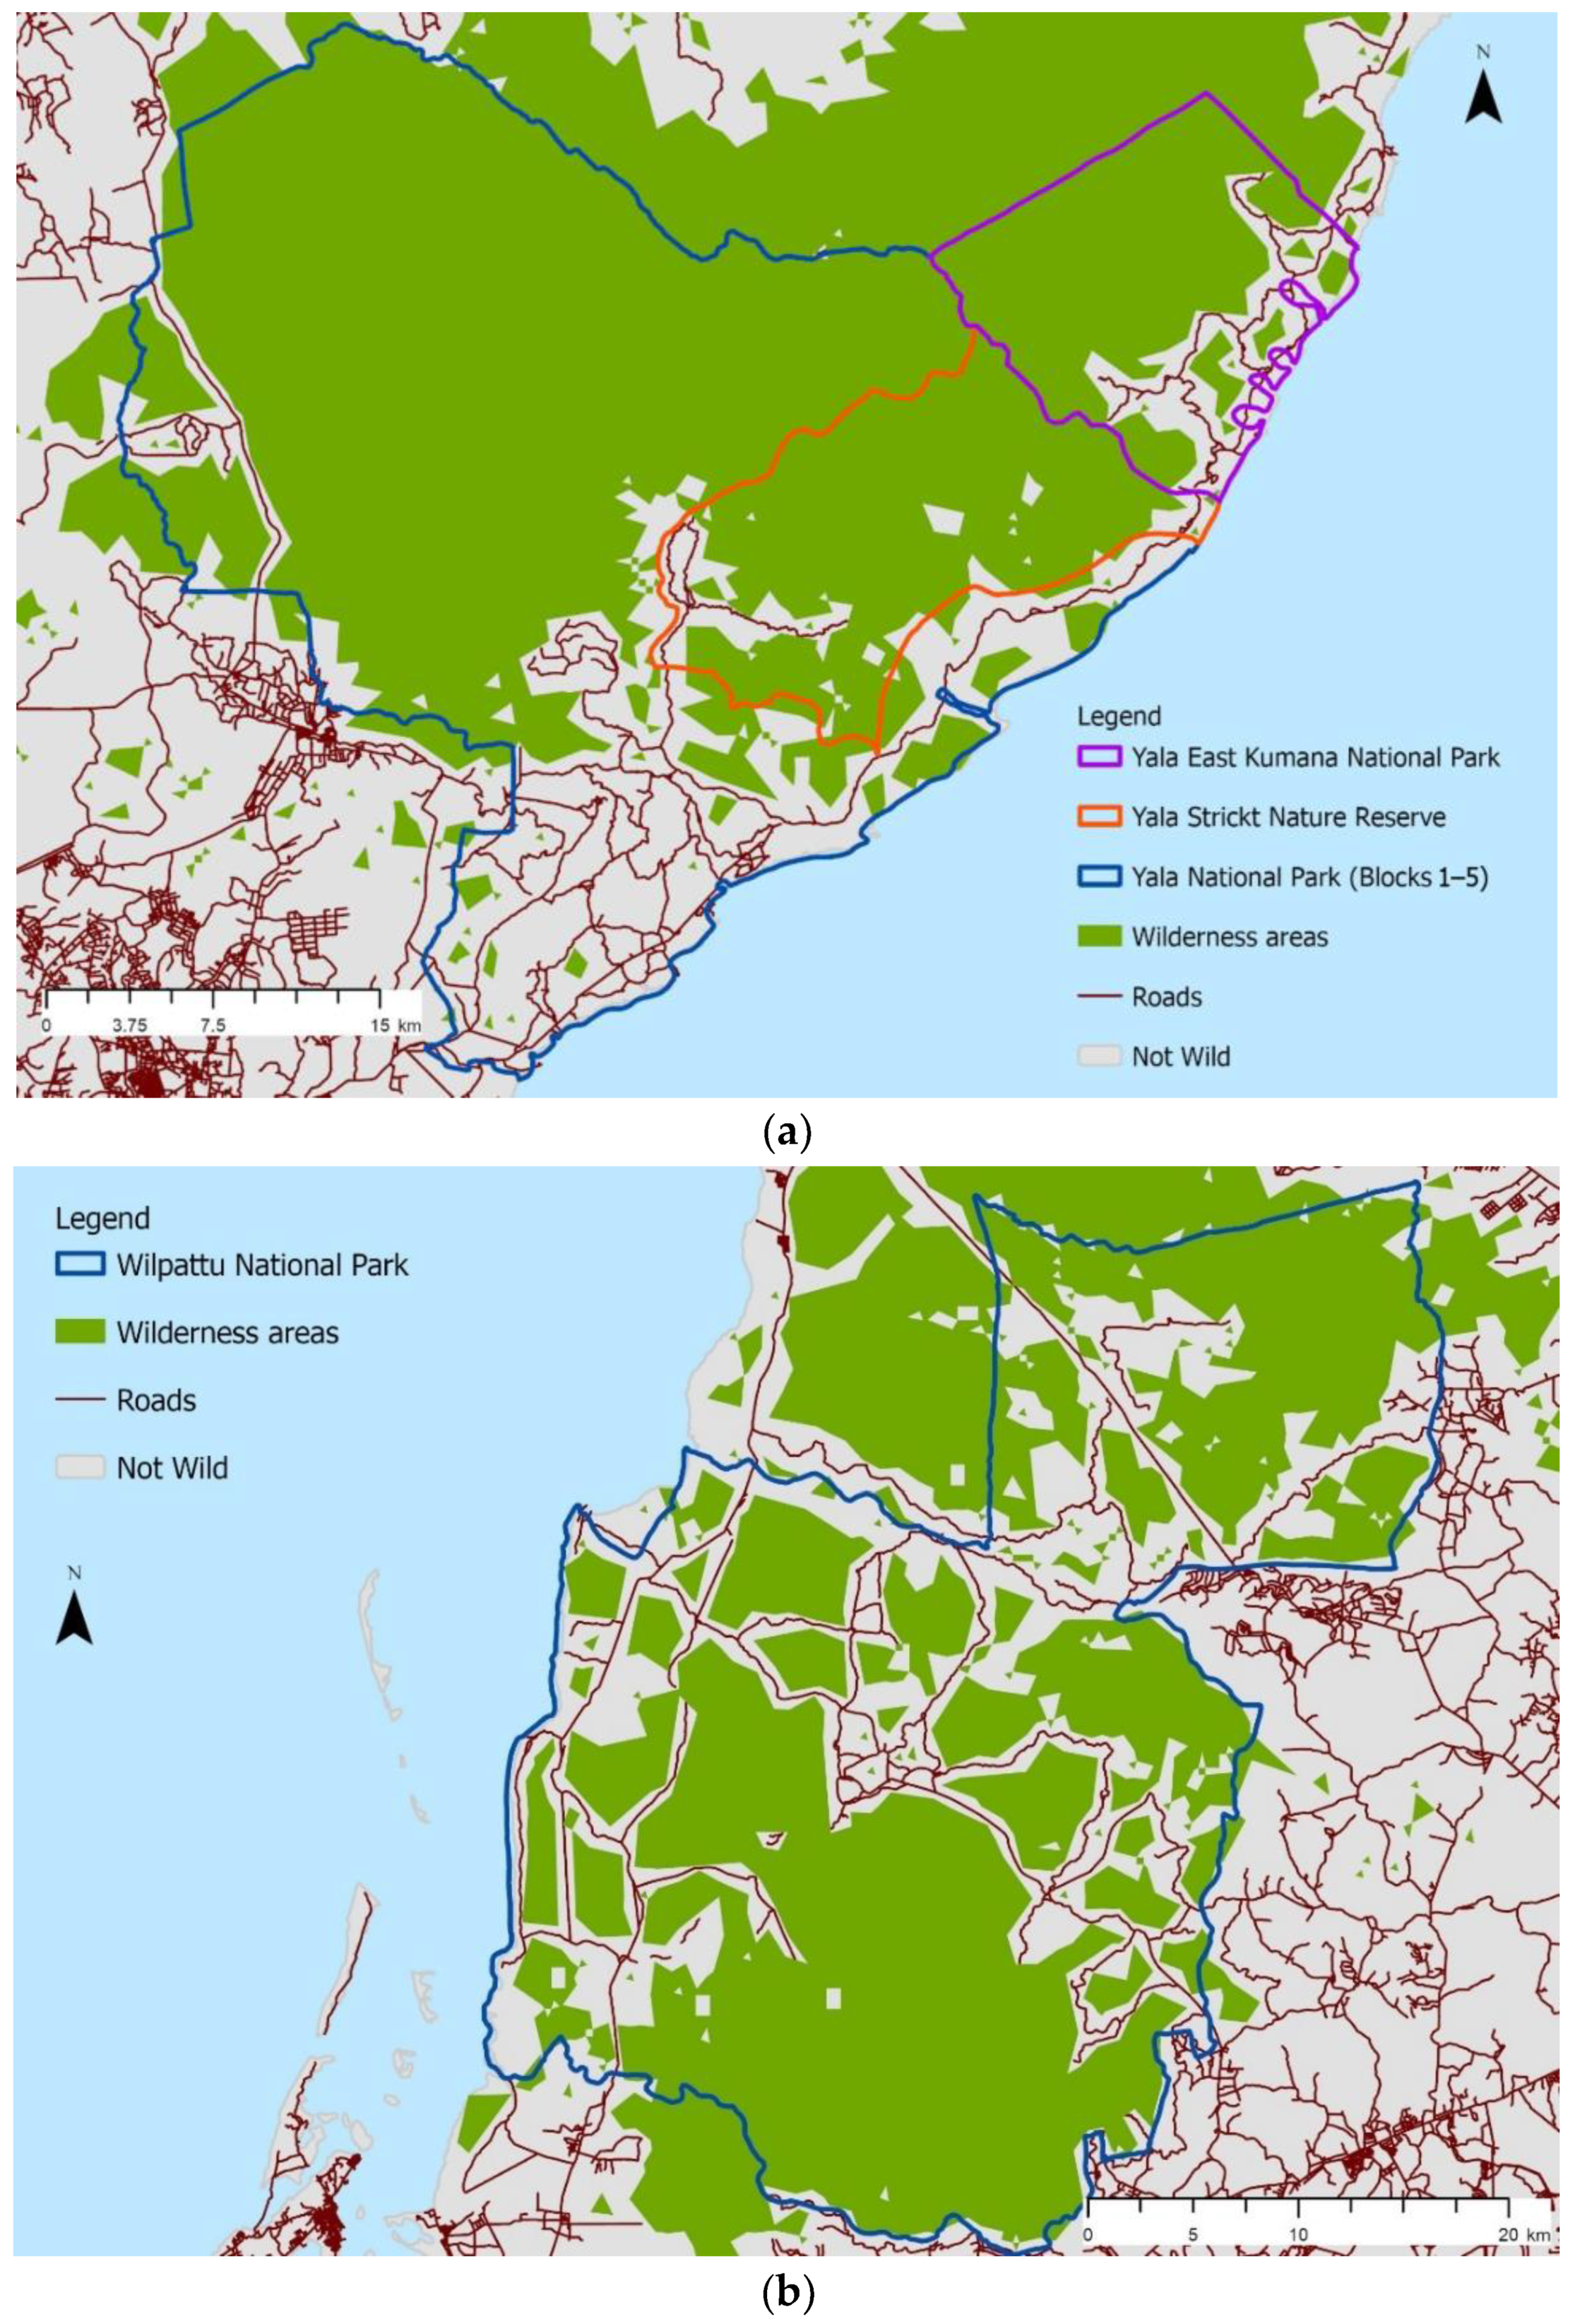
3.4. Wilderness Areas and Existing Protected Areas

Through overlay analysis, the study reveals a significant spatial congruence between wilderness areas and protected areas, indicating a notable alignment between designated wilderness and officially protected areas in Sri Lanka.

3.4.1. Non-Protected (De Facto) Wilderness Areas

Despite the high degree of spatial congruence of wilderness areas with protected areas outlined above, some areas, constituting 19.7% of total wilderness areas, fall outside existing protected boundaries. These total 2132 km2 and vary in size from >1 km2 to 174 km2, with five areas ranging from 50 km2 to 100 km2 and one exceeding 100 km2 (Figure 6):
  • Trincomalee and Kantale block;
  • Moragahakanda;
  • Nuwaragala Forest Reserve—South;
  • Nelugala Jungle Corridor—North;
  • Nelugala Jungle Corridor—South;
  • Gal Oya National Park—West.
The Department of Forest Conservation of Sri Lanka [35] designates the larger de facto wilderness areas as ‘reserved forests’ or ‘other state forest’. However, these areas may not receive sufficiently rigorous protection, making them more vulnerable to degradation and negative impacts. Example: the Moragahakanda Reservoir construction within the Moragahakanda de facto wilderness area highlights the need for conservation attention and investigation regarding the protection and preservation of such areas amid potential development projects.

3.4.2. Wilderness Quality of Existing Protected Areas

An alternative approach to comparing wilderness areas with protected areas is to assess the wilderness quality within existing protected areas. Table 3 displays wilderness quality scores (1 to 256) within protected areas. Notably, jungle corridors—designated to enable the movement of animals between protected areas [36]—score below 193, while other types vary widely. National Heritage Wilderness Areas maintain a score not below 57, with the highest mean wilderness quality. The presence of low wilderness quality areas within protected areas may be attributed to factors such as land encroachment and fragmentation. Many protected areas suffer from division and fragmentation due to narrow corridors created by main and subroads as highlighted by roadless area mapping projects and associated ecological studies [37]. Fragmentation by roads also has great significance when considering remoteness and visual impacts from human interventions when identifying wilderness areas. Figure 7 visually illustrates how two selected protected areas are fragmented by roads and other developments.
In addition to the fragmentation of wilderness areas within protected areas, it is crucial to acknowledge that some protected areas do not encompass any wilderness areas. Out of 19,897 km2 of protected areas, only 8686 km2 (43.6%) exhibits wilderness characteristics.
Approximately 56.4% lacks wilderness attributes, possibly compromised by roads, human settlements, or development activities. In-depth case studies coupled with field-based assessments are needed to understand the causes of the loss of wilderness attributes in these protected areas.

4. Discussion

4.1. Comparing Research Outputs with Global-Scale Studies

This research presents the first detailed national-level wilderness mapping endeavour conducted in Sri Lanka and thus lacks existing national- or local-level wilderness mapping outputs for comparison. However, for comparative purposes, the global human footprint maps [13] provide comparable data for analysis. Figure 1a illustrates the spatial pattern of the human footprint in Sri Lanka, derived from the ‘March of the Human Footprint’ global project, as published by the Wildlife Conservation Society [24] based on the methodology established by Sanderson et al. [13].
This uses a weighted sum approach, combining population density, built infrastructure, accessibility, and a night-time lights proxy for industrial energy supplies. Proxy measures, noted by Carver et al. [12], may limit the capability of the human footprint maps in capturing local nuance and patterns of wilderness quality. Visual comparison of Figure 1a with Figure 4a shows similarity between areas of lower impact in the human footprint map (1a) and very high wilderness areas in the wilderness quality map (4a). Notably, some high wilderness areas, especially in the central and south-western parts, are not adequately captured by the human footprint map.
The wilderness quality maps developed here are based on measurement of remoteness and absence of human interventions, together with derived naturalness maps and so differ from WCS’s human footprint map which relies principally on proxies and, crucially for a topographically varied island nation, lacks consideration of terrain-based variables. Using a 5-m terrain model as a central component, the research presented here models remoteness and the absence of visual impact from human artefacts. While terrain itself is not a primary wilderness attribute, it is essential for robust and reliable measurement of remoteness and visual impact and will lead to some of the differences seen between the two maps shown in Figure 1a and Figure 4a.

4.2. Spatial Distribution of Wilderness Areas

High wilderness quality areas in Sri Lanka follow a distinct pattern, excluding densely populated western and northern regions, linked to high road and built structure density. Similar patterns are noted in China’s wilderness areas [8]. In contrast to other studies such as those conducted by Cao et al. [8] and Carver et al. [4,12], the wilderness quality of Sri Lanka is not directly related to elevation. This phenomenon can be attributed to two main reasons: (1) the exclusion of ‘terrain’ (e.g., ruggedness) as a primary wilderness attribute in this study and (2) the prevalence of main and minor roads covering most high-altitude areas, such as the Central Highlands. Despite employing terrain analysis for remoteness and viewshed assessments, its influence is not explicitly reflected in the broad patterns seen in the final wilderness quality map.
The spatial distribution of wilderness areas strongly correlates with protected areas, emphasising the historical and influential role of protected area establishment since 1938. Yala, the first national park, is the largest wilderness area, highlighting the lasting wilderness qualities within protected areas and effectiveness of these designations. The current distribution’s close ties with protected area patterns underline their fundamental influence on wilderness areas in Sri Lanka.

4.3. Wilderness Areas and Protected Areas

The spatial distribution of wilderness areas in Sri Lanka is clearly influenced by existing protected areas. However, some core wilderness areas, constituting 19.7% of total wilderness areas, do not fall within nor align with existing protected boundaries and can thus be identified as de facto wilderness areas. Notably, 80.3% of wilderness areas are within existing protected area boundaries, contrasting with China, where 77% are outside nature reserves [8]. The heightened level of protection in Sri Lanka is fundamentally rooted in the country’s extensive history of environmental conservation dating back to the 3rd century BC. Furthermore, during the British colonial period in 1938, Yala and Wilpattu were designated as national parks, marking them as the inaugural protected areas in the country.
Department of Forest Conservation Sri Lanka [34] data identify some of the de facto wilderness areas as ‘reserved forests’ or ‘other state forest’, indicating potential additional wilderness areas. However, local-level studies are needed to comprehensively assess their true wilderness and ecological value. Despite significant coverage, approximately 56.4% of Sri Lanka’s protected areas lack true wilderness qualities due to illegal land encroachment and human activities, e.g., illegal deforestation in Wilpattu National Park for settlements occurring since 2009 [38]. In-depth studies supported by field-based assessments are essential to understand the reasons for this loss and develop effective conservation strategies for long-term protection and preservation of Sri Lanka’s wilderness areas.

4.4. Using Wilderness Quality Maps for Future Conservation Planning

The GIS-based WQI developed in this study offers a systematic approach for assessing the natural environmental quality of existing protected areas in Sri Lanka. Conservation managers can use it to re-evaluate the protection status of these areas, considering additional environmental data like species diversity for comprehensive assessments. Additionally, national WQI measures can be used to monitor and assess impacts from policy decisions, developments, and other human activities both within and adjacent to these regions. This research emphasises the significance of six non-protected de facto wilderness areas, currently categorised as ‘reserved forests’ or ‘other state forest’. Despite their current status, these areas demonstrate high wilderness qualities, warranting increased protection, especially considering major development projects like the ‘Moragahakanda Reservoir’. A thorough ecological assessment of these areas is proposed, and if deemed ecologically vital, consideration for upgrading their protection status to ‘conservation forests’ is recommended. Any status changes should be rooted in comprehensive scientific research, considering ecological significance, potential impacts on local communities, and the involvement of stakeholders and local communities for successful conservation measures.

4.5. WQI and Perception of Wilderness in Sri Lanka

The Wilderness Quality Index (WQI) developed in this study adopts a human-centred approach to reflect the cultural understanding of wilderness in Sri Lanka, where ‘wilderness’ is commonly perceived as ‘deserted areas’ or ‘areas empty of people’. However, it is important to recognise Sri Lanka’s diverse biodiversity and natural heritage, suggesting a broader definition of wilderness that includes the preservation of natural processes and biodiversity. Incorporating additional criteria based on biodiversity and nature-centric perspectives could enhance the comprehensiveness and ecological relevance of the index. However, it is crucial to consider the intended focus of the wilderness modelling—whether it aims to capture people’s perceptions of wilderness or the wilderness as defined by natural processes. This consideration will guide the selection of attributes and ultimately influence the outcomes of the index.

4.6. Limitations

This study acknowledges several limitations that may have influenced the accuracy of its findings. One of the key limitations lies in the data sources used for the wilderness quality model, which encompassed information from different time periods, resolutions, and scales. Particularly, the land cover layer utilised in this study was obtained from a global database, providing information on 2018 global land cover data at a resolution of 250 m. The utilisation of land cover data with a relatively lower spatial resolution can give rise to certain drawbacks. It may result in the omission of crucial details and nuances in the landscape, potentially leading to an oversimplified representation of existing data. Nonetheless, we maintain that the resulting models are a significant improvement over the global mapping and use of proxy indices provided in the Human Footprint Index.

4.7. Recommendations

The GIS-based wilderness quality map can be improved further by using different methods, and these methods are mainly associated with data quality and weights. One key improvement involves utilising a more recent and locally sourced database for land cover information, characterised by a higher spatial resolution. Such up-to-date data can yield more precise and reliable outputs, capturing finer details and nuances in the landscape. Also, this study uses the World Database on Protected Areas 2016 [33] as the source of protected area boundaries. However, the data gaps in this dataset hinder further analysis between wilderness areas and protected area boundaries. Hence, future studies of this nature must source a local dataset on Sri Lanka’s protected area boundaries.
This study uses an unweighted MCE to model wilderness, considering three wilderness attributes, to create a baseline study with reduced complexity. If this study had employed a different MCE technique, whether weighted or unweighted, it would have yielded a different result. Therefore, future studies could explore various MCE methods to accurately capture the essence of wilderness characteristics in Sri Lanka.

5. Conclusions

In the absence of prior national or local wilderness mapping initiatives in Sri Lanka, this research contributes a locally nuanced understanding of wilderness attributes and qualities across the country. This study examines the wilderness attributes across Sri Lanka to delineate areas of significant natural value and identify potential threats to their conservation. The analysis incorporates three key wilderness attributes: remoteness from public roads, absence of modern human interventions, and naturalness of land cover. The resulting WQI reveals a diverse spectrum of wilderness qualities across the study area. The classification of core and buffer areas, spanning 10,976 km2 and comprising 201 distinct patches, underscores the rich biodiversity and wilderness functionality in these regions. Comparison with existing protected areas showcased a noteworthy alignment between designated wilderness and protected regions, highlighting the potential synergy in conservation efforts.
However, a crucial finding points to the existence of de facto wilderness areas outside protected boundaries, constituting 19.7% of total wilderness areas. These areas, lacking formal protection, face increased susceptibility to degradation, as illustrated by the Moragahakanda Reservoir construction within the Moragahakanda de facto wilderness area. Furthermore, an assessment of wilderness quality within existing protected areas revealed a concerning trend of fragmentation, particularly caused by roads and other developments. Surprisingly, only 43.6% of protected areas exhibit wilderness characteristics, indicating the need for a more holistic approach to conservation within these designated zones.
This research underscores the importance of recognising and safeguarding wilderness areas, both within and beyond designated protected boundaries. The findings call for enhanced conservation strategies, particularly in de facto wilderness areas, and emphasise the need to address fragmentation within existing protected zones.

Author Contributions

Conceptualisation, U.M. and S.C.; methodology, U.M. and S.C.; software, U.M.; validation, U.M.; formal analysis, U.M.; investigation, U.M.; resources, U.M.; data curation, U.M.; writing—original draft preparation, U.M.; writing—review and editing, S.C. and U.M.; visualisation, U.M.; supervision, S.C.; project administration, U.M.; funding acquisition, U.M. All authors have read and agreed to the published version of the manuscript.

Funding

This research is based on the corresponding author’s dissertation funded by the Commonwealth Scholarship Commission and the Foreign, Commonwealth and Development Office in the UK, and the partner university in the UK under Commonwealth Shared Scholarship programme 2022. All views expressed here are those of the authors not the funding body.

Data Availability Statement

All raw data utilised in the analysis are accessible to the public.

Acknowledgments

The authors acknowledge the Commonwealth Scholarship Commission and the partner university for funding this study under Commonwealth Shared Scholarship programme 2022.

Conflicts of Interest

The authors declare no conflicts of interest.

References

  1. Dudley, N. (Ed.) Guidelines for Applying Protected Area Management Categories; IUCN International Union for Conservation of Nature: Gland, Switzerland, 2008. [Google Scholar]
  2. Ward, K. For wilderness or wildness? Decolonising rewilding. In Rewilding; du Toit, J.T., Pettorelli, N., Durant, S.M., Eds.; Cambridge University Press: Cambridge, UK, 2019; pp. 34–54. [Google Scholar]
  3. Nash, R.F. Wilderness and the American Mind, 4th ed.; Yale University Press: New Haven, CT, USA, 1993. [Google Scholar]
  4. Carver, S.; Comber, A.; McMorran, R.; Nutter, S. A GIS model for mapping spatial patterns and distribution of wild land in Scotland. Landsc. Urban Plan. 2012, 104, 395–409. [Google Scholar] [CrossRef]
  5. Hawes, M.; Dixon, G. A remoteness-oriented approach to defining, protecting and restoring wilderness. PARKS 2020, 26, 23. [Google Scholar] [CrossRef]
  6. Watson, J.E.; Shanahan, D.F.; Di Marco, M.; Allan, J.; Laurance, W.F.; Sanderson, E.W.; Mackey, B.; Venter, O. Catastrophic declines in wilderness areas undermine global environment targets. Curr. Biol. 2016, 26, 2929–2934. [Google Scholar] [CrossRef] [PubMed]
  7. Convention on Biological Diversity. First Draft of the Post-2020 Global Biodiversity Framework-2017. Available online: https://www.cbd.int/doc/c/abb5/591f/2e46096d3f0330b08ce87a45/wg2020-03-03-en.pdf (accessed on 22 July 2023).
  8. Cao, Y.; Carver, S.; Yang, R. Mapping wilderness in China: Comparing and integrating Boolean and WLC approaches. Landsc. Urban Plan. 2019, 192, 103636. [Google Scholar] [CrossRef]
  9. Lesslie, R.G.; Maslen, M. National Wilderness Inventory: Handbook of Procedures, Content and Usage, 2nd ed.; Australian Government Publishing Service: Canberra, Australia, 1995. [Google Scholar]
  10. Lesslie, R.G.; Taylor, S.G. The wilderness continuum concept and its implications for Australian wilderness preservation policy. Biol. Conserv. 1985, 32, 309–333. [Google Scholar] [CrossRef]
  11. Radford, S.L.; Senn, J.; Kienast, F. Indicator-based assessment of wilderness quality in mountain landscapes. Ecol. Indic. 2019, 97, 438–446. [Google Scholar] [CrossRef]
  12. Carver, S.; Konráðsdóttir, S.; Guðmundsson, S.; Carver, B.; Kenyon, O. New Approaches to Modelling Wilderness Quality in Iceland. Land 2023, 12, 446. [Google Scholar] [CrossRef]
  13. Sanderson, E.W.; Jaiteh, M.; Levy, M.A.; Redford, K.H.; Wannebo, A.V.; Woolmer, G. The Human Footprint and the Last of the Wild: The human footprint is a global map of human influence on the land surface, which suggests that human beings are stewards of nature, whether we like it or not. BioScience 2002, 52, 891–904. [Google Scholar] [CrossRef]
  14. McCloskey, J.M.; Spalding, H. A reconnaissance-level inventory of the amount of wilderness remaining in the world. Ambio 1989, 18, 221–227. [Google Scholar]
  15. See, L.; Fritz, S.; Perger, C.; Schill, C.; Albrecht, F.; McCallum, I.; Schepaschenko, D.; Van der Velde, M.; Kraxner, F.; Baruah, U.D.; et al. Mapping human impact using crowdsourcing. In Mapping Wilderness; Springer: Dordrecht, The Netherlands, 2016; pp. 89–101. [Google Scholar]
  16. Sanderson, E.W.; Fisher, K.; Robinson, N.; Sampson, D.; Duncan, A.; Royte, L. The March of the Human Footprint. 2022. Available online: https://ecoevorxiv.org/repository/view/3641/ (accessed on 22 July 2023).
  17. Henry, D.; Husby, E. Wilderness quality mapping in the Euro-Arctic Barents region: A potential management tool. In Proceedings of the 1995 ESRI International User Conference: Creating a New World, Palm Springs, CA, USA, 22 May 1995; pp. 1–13. [Google Scholar]
  18. Ceaușu, S.; Hofmann, M.; Navarro, L.M.; Carver, S.; Verburg, P.H.; Pereira, H.M. Mapping opportunities and challenges for rewilding in Europe. Conserv. Biol. 2015, 29, 1017–1027. [Google Scholar] [CrossRef] [PubMed]
  19. Müller, A.; Bøcher, P.K.; Svenning, J.C. Where are the wilder parts of anthropogenic landscapes? A mapping case study for Denmark. Landsc. Urban Plan. 2015, 144, 90–102. [Google Scholar] [CrossRef]
  20. Măntoiu, D.Ş.; Nistorescu, M.C.; Şandric, I.C.; Mirea, I.C.; Hăgătiş, A.; Stanciu, E. Wilderness areas in Romania: A case study on the Southwestern Carpathians. In Mapping Wilderness: Concepts, Techniques and Applications; Springer: Berlin/Heidelberg, Germany, 2016; pp. 145–156. [Google Scholar]
  21. Ólafsdóttir, R.; Sæþórsdóttir, A.D.; Runnström, M. Purism scale approach for wilderness mapping in Iceland. In Mapping Wilderness; Springer: Dordrecht, The Netherlands, 2016; pp. 157–176. [Google Scholar]
  22. Plutzar, C.; Enzenhofer, K.; Hoser, F.; Zika, M.; Kohler, B. Is there something wild in Austria? In Mapping Wilderness; Springer: Dordrecht, The Netherlands, 2016; pp. 177–189. [Google Scholar]
  23. Convention on Biological Diversity-Country Profiles: Sri Lanka. Available online: https://www.cbd.int/countries/profile/?country=lk (accessed on 22 June 2023).
  24. Wildlife Conservation Society—Summary of Human Footprint Data for Sri Lanka, March of the Human Footprint Website. Available online: https://wcshumanfootprint.org/map/ (accessed on 20 December 2022).
  25. Ministry of Mahaweli Development and Environment. National Biodiversity Strategic Action Plan 2016–2022; Biodiversity Secretariat, Ministry of Mahaweli Development and Environment: Colombo, Sri Lanka, 2016. [Google Scholar]
  26. Survey Department of Sri Lanka. Available online: https://www.survey.gov.lk/sdweb/home.php (accessed on 27 July 2023).
  27. Conservation International. Biodiversity Hotspots. Available online: https://www.conservation.org/priorities/biodiversity-hotspots (accessed on 29 December 2023).
  28. Convention on Biological Diversity—National Biodiversity Strategic Action Plan: 2016–2022. Available online: https://www.cbd.int/doc/world/lk/lk-nbsap-v2-en.pdf (accessed on 10 January 2024).
  29. Gunatilleke, N.; Pethiyagoda, R.; Gunatilleke, S. Biodiversity of Sri Lanka. J. Natl. Sci. Found. Sri Lanka 2008, 36, 25–61. [Google Scholar] [CrossRef]
  30. The Parliament of Sri Lanka, The Government Publication Bureau. National Heritage Wilderness Areas Act, No. 3 of 1988; The Parliament of Sri Lanka, The Government Publication Bureau: Colombo, Sri Lanka, 1998. [Google Scholar]
  31. Fritz, S.; See, L.; Carver, S. A fuzzy modeling approach to wild land mapping in Scotland. In Innovations in GIS 7. GIS and Geocomputation; Atkinson, P.M., Martin, D., Eds.; CRC Press: Boca Raton, FL, USA, 2000. [Google Scholar]
  32. Carver, S.; Fritz, S. Mapping remote areas using GIS. In Landscape Character: Perspectives on Management and Change; Usher, M., Ed.; Natural Heritage of Scotland Series; HMSO: London, UK, 1999. [Google Scholar]
  33. Wild Europe. A Working Definition of European Wilderness and Wild Areas. 2013. Available online: https://www.europarc.org/wp-content/uploads/2015/05/a-working-definition-of-european-wilderness-and-wild-areas (accessed on 20 July 2023).
  34. The World Database on Protected Areas. Available online: https://www.protectedplanet.net/en/thematic-areas/wdpa?tab=WDPA (accessed on 27 July 2023).
  35. Department of Forest Conservation of Sri Lanka. Available online: https://www.mwfc.gov.lk (accessed on 20 June 2023).
  36. Department of Wildlife Conservation of Sri Lanka-Protected Areas. Available online: https://www.dwc.gov.lk/protected-areas/ (accessed on 24 July 2023).
  37. Selva, N.; Switalski, A.; Kreft, S.; Ibisch, P.L. Why keep areas road-free? The importance of roadless areas. In Handbook of Road Ecology; John Wiley & Sons, Ltd.: Hoboken, NJ, USA, 2015; pp. 16–26. [Google Scholar]
  38. Environmental Foundation-Deforestation—North of Wilpattu National Park: Site Visit Report. Available online: https://efl.lk/wp-content/uploads/2018/08/wilpattu-site-visit-report-final.pdf (accessed on 10 January 2024).
Figure 1. Spatial distribution of human footprint in Sri Lanka—2020 [24] (a). Elevation model of Sri Lanka, Source: Survey Department of Sri Lanka [26] (b). Spatial distribution of road network in Sri Lanka (c).
Land 13 00402 g001
Figure 2. WQI model flow chart.
Land 13 00402 g002
Figure 3. Spatial distribution of remoteness from public roads (a), absence of modern human interventions, (b) and naturalness of land cover (c) in Sri Lanka.
Land 13 00402 g003
Figure 4. Wilderness Quality Index. (a) Wilderness Zones (b).
Land 13 00402 g004
Figure 5. Main eighteen wilderness areas.
Land 13 00402 g005
Figure 6. Main six non-protected wilderness areas (de facto wilderness areas).
Land 13 00402 g006
Figure 7. Protected area fragmentation caused by roads in Yala National Park (IUCN category II protected area, and category 1a) (a) and in Wilpattu National Park (IUCN category II protected area) (b).
Land 13 00402 g007
Table 1. Data Sources.
SourceDataTypeResolution Year
Survey Department of Sri LankaDigital terrain modelRaster5 mhttps://www.survey.gov.lk/sdweb/pages_more_feature.php?id=3de826c0fd66f54a700c6b497c14ae1c113d28ee&l=sd (accessed on 27 July 2023)2015
Copernicus Climate Change ServiceLand coverRaster250 mhttps://cds.climate.copernicus.eu/cdsapp#!/dataset/satellite-land-cover?tab=form (accessed on 26 July 2023) 2018
OpenStreetMapRailwaysVector-https://download.geofabrik.de/asia/sri-lanka.html (accessed on 20 July 2023)2022
OpenStreetMapRoadsVector-https://download.geofabrik.de/asia/sri-lanka.html (accessed on 20 July 2023)2022
OpenStreetMapBuildings and other built structuresVector-https://download.geofabrik.de/asia/sri-lanka.html (accessed on 20 July 2023)2022
World Database on Protected Areas (WDPA)Protected
areas
Vector-https://www.protectedplanet.net/ (accessed on 27 July 2023)2016
Table 2. Characteristics of wilderness patches greater than 100 km2.
NoName of the Wilderness AreaArea (km2)Altitude (m)
1Padawiya Forest Reserve10247–163
2Wilpattu National Park—North26125–90
3Veppal Forest Reserve14611–95
4Wilpattu National Park—South4596–122
5Trincomalee and Kantale block47011–235
6Hurulu Forest Reserve119101–230
7Minneriya and Giritale Nature Reserve11090–540
8Wasgamuwa National Park35240–513
9Knuckles Conservation Forest156109–1868
10Maduru Oya National Park12586–653
11Nuwaragala Forest Reserve-South15454–653
12Nelugala Jungle Corridor13781–834
13Gal Oya National Park48150–835
14Bakmitiyawa Thibirigolla Forest Reserve2128–265
15Yala National Park15501–413
16Ilukpelessa and Bogahapelessa Forest Reserve141141–739
17Peak Wilderness Nature Reserve120574–2061
18Sinharaja National Heritage Wilderness Area17640–1379
Table 3. Wilderness quality of protected areas.
Protected Areas CategoryWilderness Quality on a Scale of 1–256 (1 = Low, 256 = High)Wilderness Quality
MeanStd. Dev
National Park3–256129.572.9
Nature Reserve5–235116.164.7
Strict Nature Reserve4–211127.350.4
Jungle Corridor7–193102.449.4
Sanctuary1–223109.563.1
Conservation Forest1–240122.068.6
Forest Reserve4–222111.662.6
National Heritage Wilderness Areas57–224142.044.3
Other State Forest3–238117.061.2
Disclaimer/Publisher’s Note: The statements, opinions and data contained in all publications are solely those of the individual author(s) and contributor(s) and not of MDPI and/or the editor(s). MDPI and/or the editor(s) disclaim responsibility for any injury to people or property resulting from any ideas, methods, instructions or products referred to in the content.

