Article

Analysis of Evolving Carbon Stock Trends and Influencing Factors in Chongqing under Future Scenarios

1
Satellite Applicsticn Center for Ecology and Environment, Ministry of Ecology and Environment, Beijing 100094, China
2
Faculty of Geographical Science, Beijing Normal University, Beijing 100875, China
3
School of Smart City, Chongqing Jiaotong University, Chongqing 400074, China
4
No. 107 Geological Team of the Chongqing Bureau of Geology and Mineral Exploration, Chongqing 401120, China
5
School of Resources and Safety Engineering, Chongqing Vocational Institute of Engineering, Chongqing 402260, China
*
Authors to whom correspondence should be addressed.
Land 2024, 13(4), 421; https://doi.org/10.3390/land13040421
Submission received: 8 February 2024 / Revised: 16 March 2024 / Accepted: 21 March 2024 / Published: 26 March 2024

Abstract

:
The relationship between land use changes and regional carbon storage is closely linked. Identifying evolving trends concerning and influencing factors on carbon storage under future scenarios is key in order to achieve the “dual carbon” goals. Using Chongqing as a case study, this study integrated the advantages of the PLUS model, InVEST model, and a geographic detector model. It conducted simulations of land use type data under scenarios of natural development (ND) and ecological protection (EP), and identified evolving trends and influencing factors regarding carbon storage. The results were as follows: (1) the PLUS model demonstrated excellent simulation performance, with a Kappa coefficient above 0.85 and an overall accuracy above 0.90. During the study period, significant changes occurred for cultivated land, forested land, water bodies, and construction, which were closely related to carbon storage; (2) carbon storage in Chongqing showed a decreasing trend, with a decrease of 10.07 × 10⁶ t C from 2000 to 2020. Under the ND scenario, carbon storage was projected to decrease by 10.54 × 10⁶ t C in 2030 compared to 2020, and it was expected to stabilize from 2030 to 2050. At the county level, Youyang, Fengjie, and Wuxi had the highest carbon storage, while Nanchuan, Jiangbei, and Dadukou had the lowest; (3) the spatial distribution of carbon storage presented an “eastern hotspot western cold spot aggregation” pattern. The proportions of regions with a decreased, unchanged, and increased aggregation of carbon storage in Chongqing during 2000–2010 and 2010–2020 were 2.99%, 95.95%, 1.06%; and 4.39%, 92.40%, 3.21%, respectively. The trend indicated a decrease in the aggregation of carbon storage, and future carbon storage was expected to stabilize; (4) elevation, terrain fluctuation, NDVI, annual average temperature, annual average precipitation, and nighttime light index had influence values of 0.88, 0.81, 0.61, 0.86, 0.77, and 0.81 on carbon storage, respectively, with different combinations of influencing factors having a greater impact. In the future, ecological priority and green development concepts should be followed, and comprehensive improvement of regional development conditions should be pursued to enhance carbon storage, thereby promoting the achievement of the “dual carbon” goals. This study provided an analytical path and data support for formulating optimized carbon storage policies at the regional level.

1. Introduction

Land use and land use change have been identified as key factors affecting carbon dioxide emissions, indicating that land use type is closely related to regional carbon storage, carbon sinks, and carbon release. At the 75th United Nations General Assembly, China announced its goal to peak CO2 emissions before 2030 and strive for carbon neutrality by 2060. The “dual carbon” (peak carbon and carbon neutrality) goals provide a strong foundation for promoting green economic development and ecologically driven expansion of cities in China [1]. Given the close relationship between land use types and carbon storage, optimizing and adjusting land use types are key pathways to enhance carbon storage.
Currently, there is extensive research on the relationship between land use and carbon storage. Carbon storage estimation methods fall mainly into two categories: One type is the carbon density estimation method based on land use type, such as the blue carbon storage measurement conducted by Adams in Spain based on the IPCC method [2]. The other method estimates using on-site land use inventory data [3]. Both methods establish a functional relationship between land use and carbon storage for estimation. The first one has advantages such as simplicity of operation, easy data acquisition, and suitability for conducting large- and medium-scale long-term carbon storage estimation studies. Common models used in this category include vegetation carbon sequestration models [4], bookkeeping models [5], and the InVEST model [6], which are all based on land use type for measurement. Among them, the InVEST model is widely used due to the simplicity in parameter acquisition and strong visibility. The InVEST model is a comprehensive assessment model for ecosystem services and trade-offs developed by Stanford University, The Nature Conservancy, and the World Wildlife Fund. Our study mainly uses its carbon estimation module. For example, Zarandian et al. used the InVEST model to analyze the spatiotemporal changes in the carbon storage of forest landscapes under different scenarios in northern Iran [7]. Imran and Din used the InVEST model and Sentinel-2 data for spatiotemporal analysis of carbon storage in mountainous forest areas [8]. Usually, to simulate the evolution of regional carbon storage for better land use planning and urban sustainable development, the combination of carbon sequestration models and land use future scenario simulation models is widely used. The main scenario simulation models include the CA-Markov [9] and CLUE-S [10]. These models can achieve high simulation accuracy in small areas, but they struggle with large-scale data simulations. The principle of these models is based on the land use demand module and the land use allocation module. Because the CA-Markov model and the CLUE-S model have restrictions on the number of rows and columns of raster data during simulation, it means that the resolution of the data must be reduced when conducting large-scale research. The PLUS (Patch-generating Land Use Simulation Model) model, developed by the HPSCIL@CUG laboratory team at the China University of Geosciences in recent years [11], is a land-use-type data simulation software that has demonstrated good results at a larger scale. For instance, Zhu used the PLUS model to conduct ecological risk simulations in the Chengdu-Chongqing Economic Zone (20.6 × 10⁴ km2) [12], and Yang performed ecosystem service value simulation in the Guanzhong Plain Urban Agglomeration (10.7 × 10⁴ km2) [13]. Therefore, the PLUS model makes it possible to conduct large-scale land-use-type data simulations.
Presently, much research has been focused on analyzing the spatiotemporal characteristics of carbon storage, with fewer studies delving into the analysis of key factors influencing changes in carbon storage. For instance, Babbar et al. utilized Markov chains and the InVEST model to assess and predict carbon storage in the Sariska Tiger Reserve in India [14]. Qacami et al. used a land use simulator to conduct a dynamic simulation of land use change [15], and Kusi et al. simulated the impact of land use changes on ecosystem services in the Ourika watershed of Morocco [16]. Pechanec et al. employed land change models and the InVEST model to estimate carbon storage under climate change conditions [17], where both studies aimed at analyzing its spatiotemporal changes. In our study, we analyzed influencing factors using spatial data. The geographic detector, a commonly employed tool to explore the impact of geographical elements on a specific phenomenon [18], was applied to unravel the key factors affecting carbon storage [19]. In summary, future changes in regional land use are crucial for assessing future carbon storage in the region. To effectively inform regional policies for optimizing carbon storage, it is essential to analyze the evolving trends and key influencing factors of regional carbon storage. This requires addressing two main aspects: firstly, achieving regional future carbon storage estimations based on land-use-type simulation, and secondly, analyzing the key influencing factors of current carbon storage in the region.
Chongqing Municipality serves as the focal point for development in China’s western region, playing a crucial role in increasing inland openness and enhancing the nation’s comprehensive strength. Simultaneously, it serves as a vital ecological barrier region in the upper reaches of the Yangtze River, featuring significant water bodies such as the Yangtze, Jialing, and Wujiang rivers. Hence, it holds a pivotal position in both economic development and ecological preservation [20]. Currently, Chongqing’s economic development is rapidly advancing, making it a key contributor to China’s timely achievement of the “dual carbon” goals. The region exhibits a high carbon sequestration capacity and potential within its ecosystems. Balancing the relationship between economic development and ecological conservation and accurately assessing future regional carbon storage and key influencing factors are crucial issues of great concern and urgency for the region.
The primary objective of the study was to achieve the simulation of land use type data and identify the future evolution trends and key influencing factors of carbon storage in Chongqing Municipality through a combination of the “PLUS-InVEST-Geographic Detector” multi-model approach. To address the aforementioned issues and goals, the study was initiated by employing the PLUS model to conduct future land use simulations in Chongqing. The simulations aimed to acquire land use type data for the years 2030–2050 under scenarios of natural development and ecological conservation at a large-scale range. Subsequently, the InVEST model was introduced to analyze the evolution of carbon storage in Chongqing from 2000 to 2050, with the goal of deciphering the spatiotemporal trends in future carbon storage. Finally, utilizing the Geographic Detector model, the study delved deep into the key influencing factors of carbon storage in Chongqing. The research outcomes can provide valuable insights for the formulation of macro-control policies on carbon storage at the regional level, facilitating the achievement of regional “dual-carbon” goals.

2. Methodology

2.1. Overview of the Study Area

Chongqing is situated in the upstream core of the Yangtze River Economic Belt, forming a unique geographical environment. It is an important region for China to achieve its “dual carbon” goals (Figure 1). The area includes 39 districts and counties (autonomous counties/economic development zones), mainly divided into the main urban area, the northeastern urban cluster, and the southeastern urban cluster. The regional area is approximately 8.24 × 10⁴ km2 [21]. Chongqing has an amalgamation of needs concerning its population, urban areas, and industry. With rapid economic development in the region, urban expansion has followed. The growing pressures between natural and built landscapes underscores the importance of a rational layout for production, residential, and ecological spaces. Analyzing the evolving trends of carbon storage within the region is essential. Therefore, conducting long-term carbon storage simulations and analyzing key influencing factors within this region is critical for promoting green sustainable development, solidifying the ecological barrier in the upper Yangtze River, and ensuring the sustainable development of regional ecosystems.

2.2. Data Sources

The main data and sources used in the study are as follows: land use data (for the years 2000, 2010, and 2020), soil type, temperature, and rainfall data from the Resource and Environment Science and Data Center of the Chinese Academy of Sciences (https://www.resdc.cn/, accessed on 1 September 2023); river and road data from Chongqing’s planning and natural resources departments; terrain data from the 91 Satellite Map Assistant Data website (https://www.91weitu.com/, accessed on 3 September 2023); nighttime light data from the Global Change Research Data Publishing and Repository; and NDVI data from the MOD13A3 dataset under MODIS (https://search.earthdata.nasa.gov/search, accessed on 6 September 2023).

2.3. Research Methods

This study conducted an analysis of the future evolution trends and key influencing factors of carbon storage in the Chongqing Municipality using the PLUS model, InVEST model, and Geographic Detector model in a multi-model framework. Building upon land-use data from 2000 to 2020 in Chongqing, and referencing relevant literature [12] while considering regional circumstances, the study employed NDVI, slope, elevation, primary rivers, secondary rivers, urban arterial roads, expressways, highways, and other roads as driving factors for land-use changes. Water areas were considered limiting factors for land-use changes.
Initially, based on land-use type data from 2000 to 2020, the PLUS model was validated to assess the feasibility and accuracy of simulating 30 m resolution land-use data in Chongqing. Subsequently, using land-use type data from 2020, simulations were conducted for the years 2030, 2040, and 2050 under scenarios of natural development and ecological conservation. The InVEST model’s carbon module was then applied to analyze the spatiotemporal evolution of carbon storage in Chongqing from 2000 to 2050 under these two scenarios.
Finally, employing the Geographic Detector model, considering the literature [22], and considering the actual conditions of the study area, the study discussed key influencing factors of carbon storage in 2020 from perspectives such as geographical resources, meteorological resources, and economic conditions. These factors included elevation, terrain undulation, NDVI, average annual temperature, average annual precipitation, and nighttime light index. The aim was to identify future trends in carbon storage and key influencing factors in the region, providing data support for future policies on urban expansion, land use planning, and ecological conservation in the region.

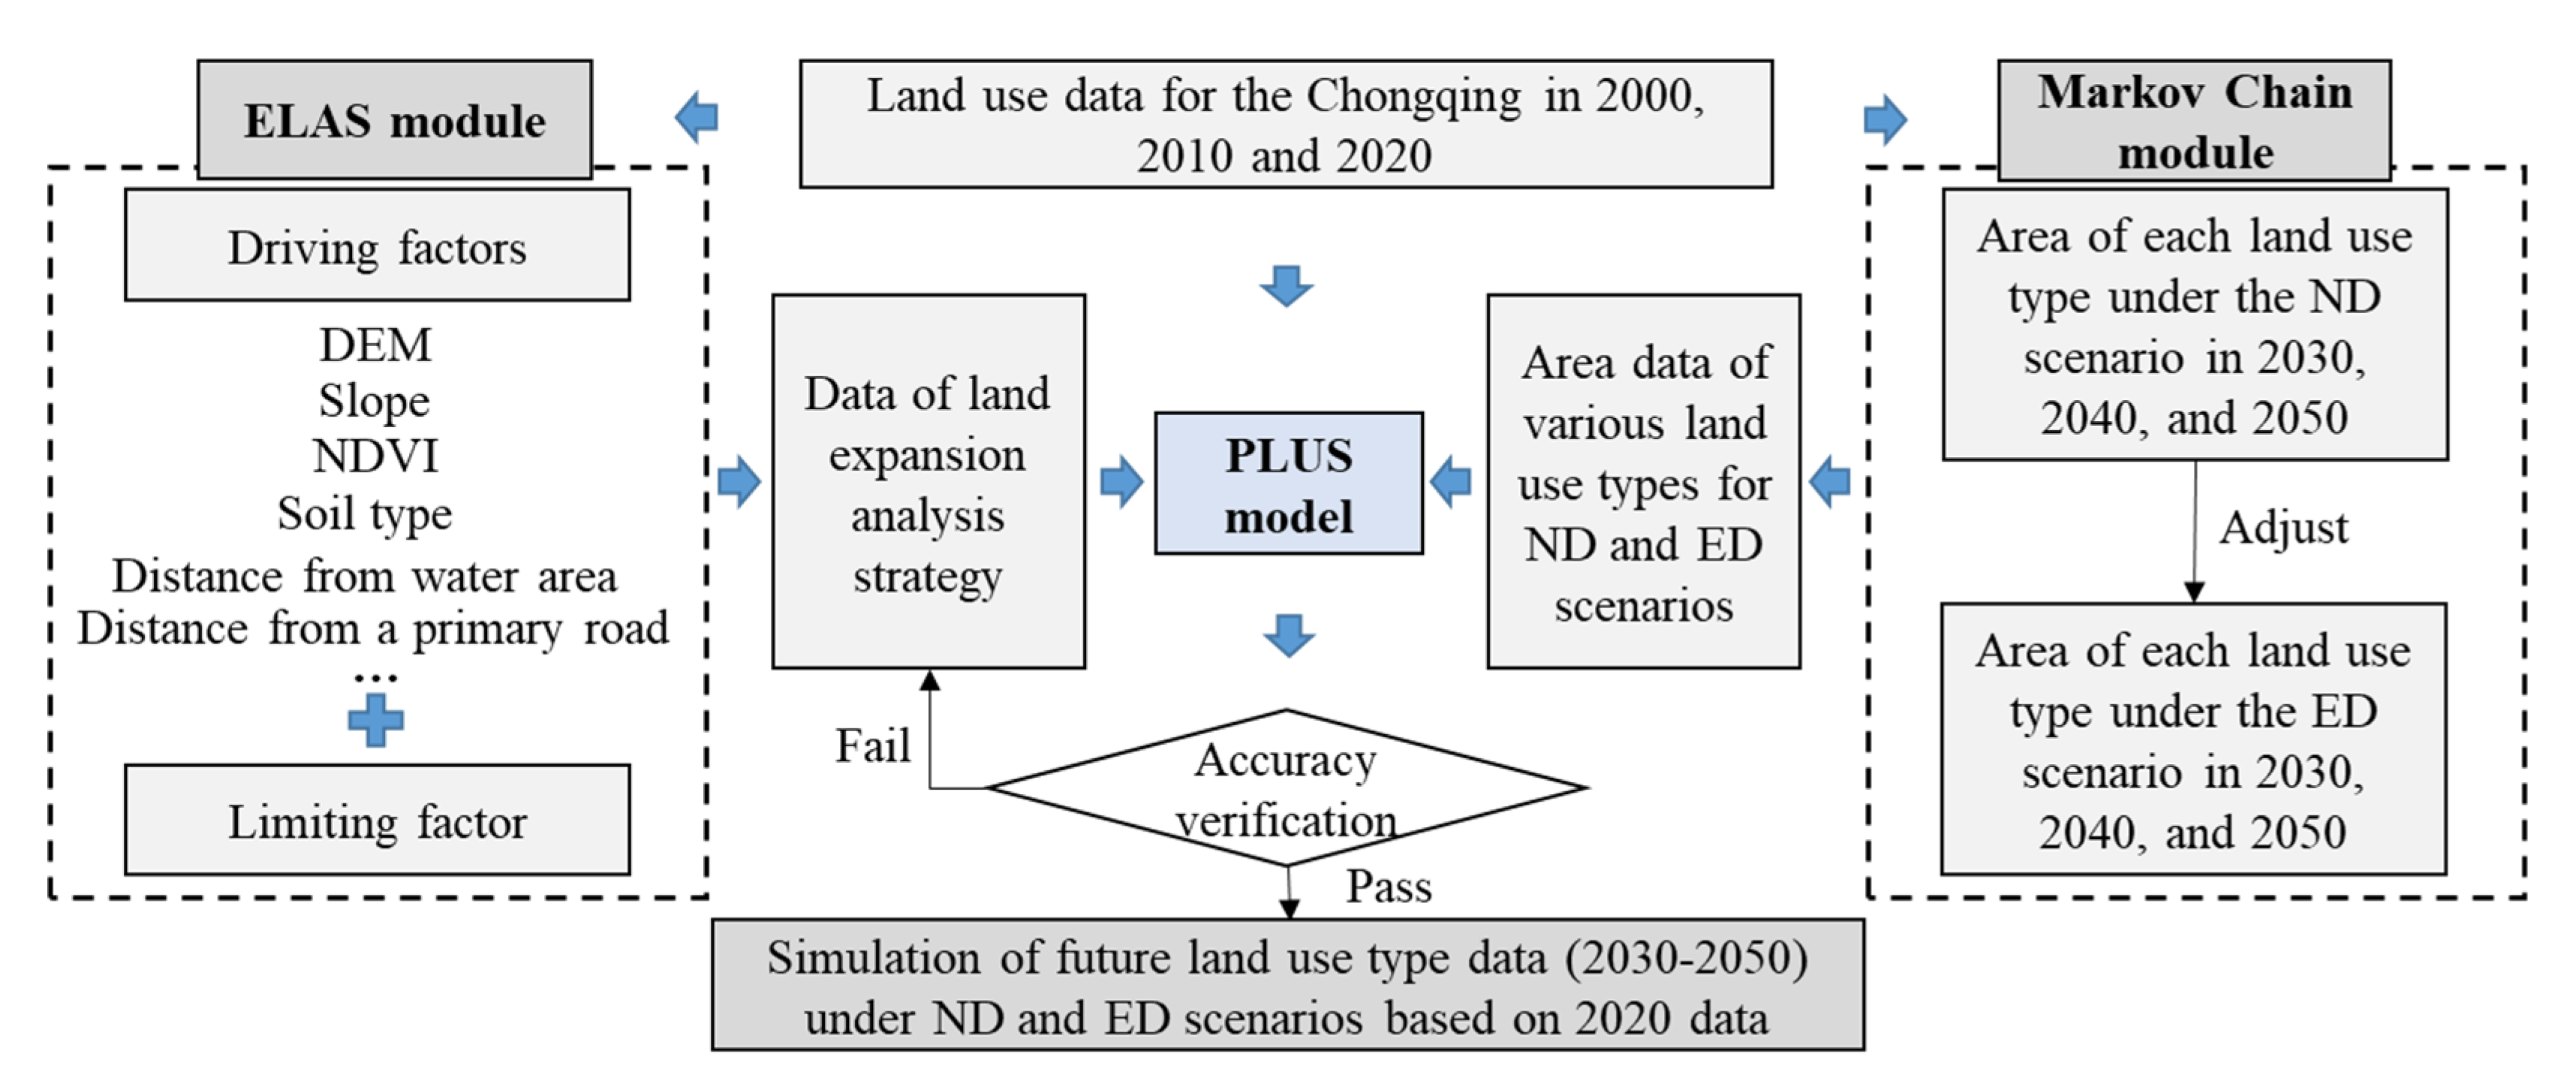
2.3.1. PLUS Model for Future Land Use Type Data Simulation

The PLUS model, developed by the HPSCIL@CUG laboratory team at the China University of Geosciences, was a patch-based land-use-change simulation model that exhibited distinct advantages over commonly used models such as CLUE-S and CA-Markov [23]. For this study, the most significant advantage of this model was its lack of limitations on the rows and columns of simulated data, enabling us to conduct 30 m resolution data simulations in a region of 8.24104 km2. Additionally, the model integrated new land expansion analysis strategies, allowing for a better exploration of the causes of various land-use changes. It included a novel multi-class seed growth mechanism that better simulated changes at the patch level for various land-use classes, enabling the dynamic simulation of patch generation under development probability constraints [11]. The simulation in the PLUS model mainly consisted of the LEAS module and the Markov Chain module. The LEAS module was used to obtain land expansion strategy data (i.e., the spatial expansion capacity of each land-use type), while the Markov Chain module was employed to acquire future area data for each land-use type (Figure 2). The specific simulation steps involved two stages. The first stage used land-use data from 2000 and 2010 as a basis to simulate data for 2010 and 2020, and accuracy analysis was performed using the Kappa coefficient, with a coefficient above 0.75 indicating high consistency, as typically seen in literature [12]. The second stage involved simulating land-use data for 2030, 2040, and 2050 under two scenarios: natural development and ecological conservation. In the natural development scenario, the future demand for each land-use type (i.e., the area of each land class) was predicted using the Markov Chain module integrated into the PLUS model. In the ecological conservation scenario, adjustments were made by reducing the growth rates of cultivated land, grassland, and unused land by 10%, and decreasing the growth rates of forest land, water bodies, and construction land by 10% each to balance the area changes.

2.3.2. InVEST Model for Carbon Storage Calculation

The study utilized the InVEST model’s carbon module to assess the spatiotemporal distribution of carbon storage in Chongqing Municipality from 2000 to 2050. The Carbon module evaluates carbon storage across four aspects: aboveground biomass carbon pool, belowground biomass carbon pool, soil carbon pool, and dead organic carbon pool [24].
The accuracy of the carbon module’s calculations depends on the appropriateness of the input carbon density parameters. For this research, data from the National Ecosystem Science Data Center (http://www.nesdc.org.cn/, accessed on 10 October 2023) were primarily used, specifically the carbon density dataset for terrestrial ecosystems in Sichuan Province and Chongqing Municipality. The aboveground biomass carbon density and belowground biomass carbon density were calculated as the mean values from this dataset. The soil carbon density was determined as the mean value of soil organic carbon density in the 0–100 cm layer. For dead organic carbon density and for some missing values, references were made to existing research data in the southwestern region by Mao et al. [22] and Wan et al. [25]. The values were obtained by averaging the data from both sources. Table 1 presents the carbon density values for each land-use type.

2.3.3. Geographic Detector

Based on the laws of geographical spatial correlation and spatial heterogeneity, generally speaking, the correlation between geographic elements is related to distance. Simultaneously, due to distance isolation, heterogeneity is generated, which can be further classified into spatial local heterogeneity and spatial hierarchical heterogeneity. The geographic detector is a software used for deciphering the distribution patterns of heterogeneity. It was proposed by the research team led by Dr. Wang Jinfeng at the Institute of Geographic Sciences and Natural Resources Research, Chinese Academy of Sciences [26,27]. It can be utilized to identify spatial differentiation, detect explanatory factors, and analyze the interaction between variables. Its core idea is based on the assumption that “if a certain independent variable has a significant impact on a dependent variable, then the two should exhibit similarity in their spatial distribution”. Currently, it has been applied in various fields such as the natural and social sciences. The geographic detector comprises factor detection, interaction detection, risk detection, and ecological detection. For specific methods, refer to existing literature [26,27]. This study primarily analyzes the influence of factors and the degree of influence of pairwise factor combinations on carbon storage differences. Therefore, this study mainly uses the factor detection and interaction detection methods. Among them, factor detection detects the extent to which factor X explains the spatial differentiation of attribute Y. Interaction detection is used to assess whether the explanatory power of dependent variable Y will increase or decrease when factors X1 and X2 act together.

3. Results and Analysis

3.1. Analysis of Land Use Simulation Accuracy and Results in Chongqing

3.1.1. Analysis of PLUS Model Simulation Accuracy

In this study, the PLUS model was used to simulate land use data for Chongqing, covering an area of approximately 8.24 × 10⁴ km2 at a simulation resolution of 30 m. To assess the simulation accuracy of the PLUS model in Chongqing, the years 2000 and 2010 were taken as bases to simulate land use data for 2010 and 2020. Real data for 2010 and 2020 were used for accuracy validation. The precision analysis results showed that the Kappa coefficients for simulating 2010 based on 2000 and simulating 2020 based on 2010 were 0.92 and 0.89, respectively, both exceeding 0.75. The overall accuracies were 0.95 and 0.93, indicating that the PLUS model’s simulation performance for land use in Chongqing was satisfactory at a 30 m resolution. We also analyzed the spatial accuracy of the simulation results for each land use type in 2020. The accuracies of cultivated land, forest land, grass land, water land, construction land, and other land were 0.92, 0.93, 0.90, 0.82, 0.81, and 0.53, respectively. The low accuracy of other land was mainly due to its strong spatial randomness, but its area is very small and will not have a great impact on the research results. The simulation accuracy was at a highly consistent level, making it suitable for future land use data scenario simulations in Chongqing.

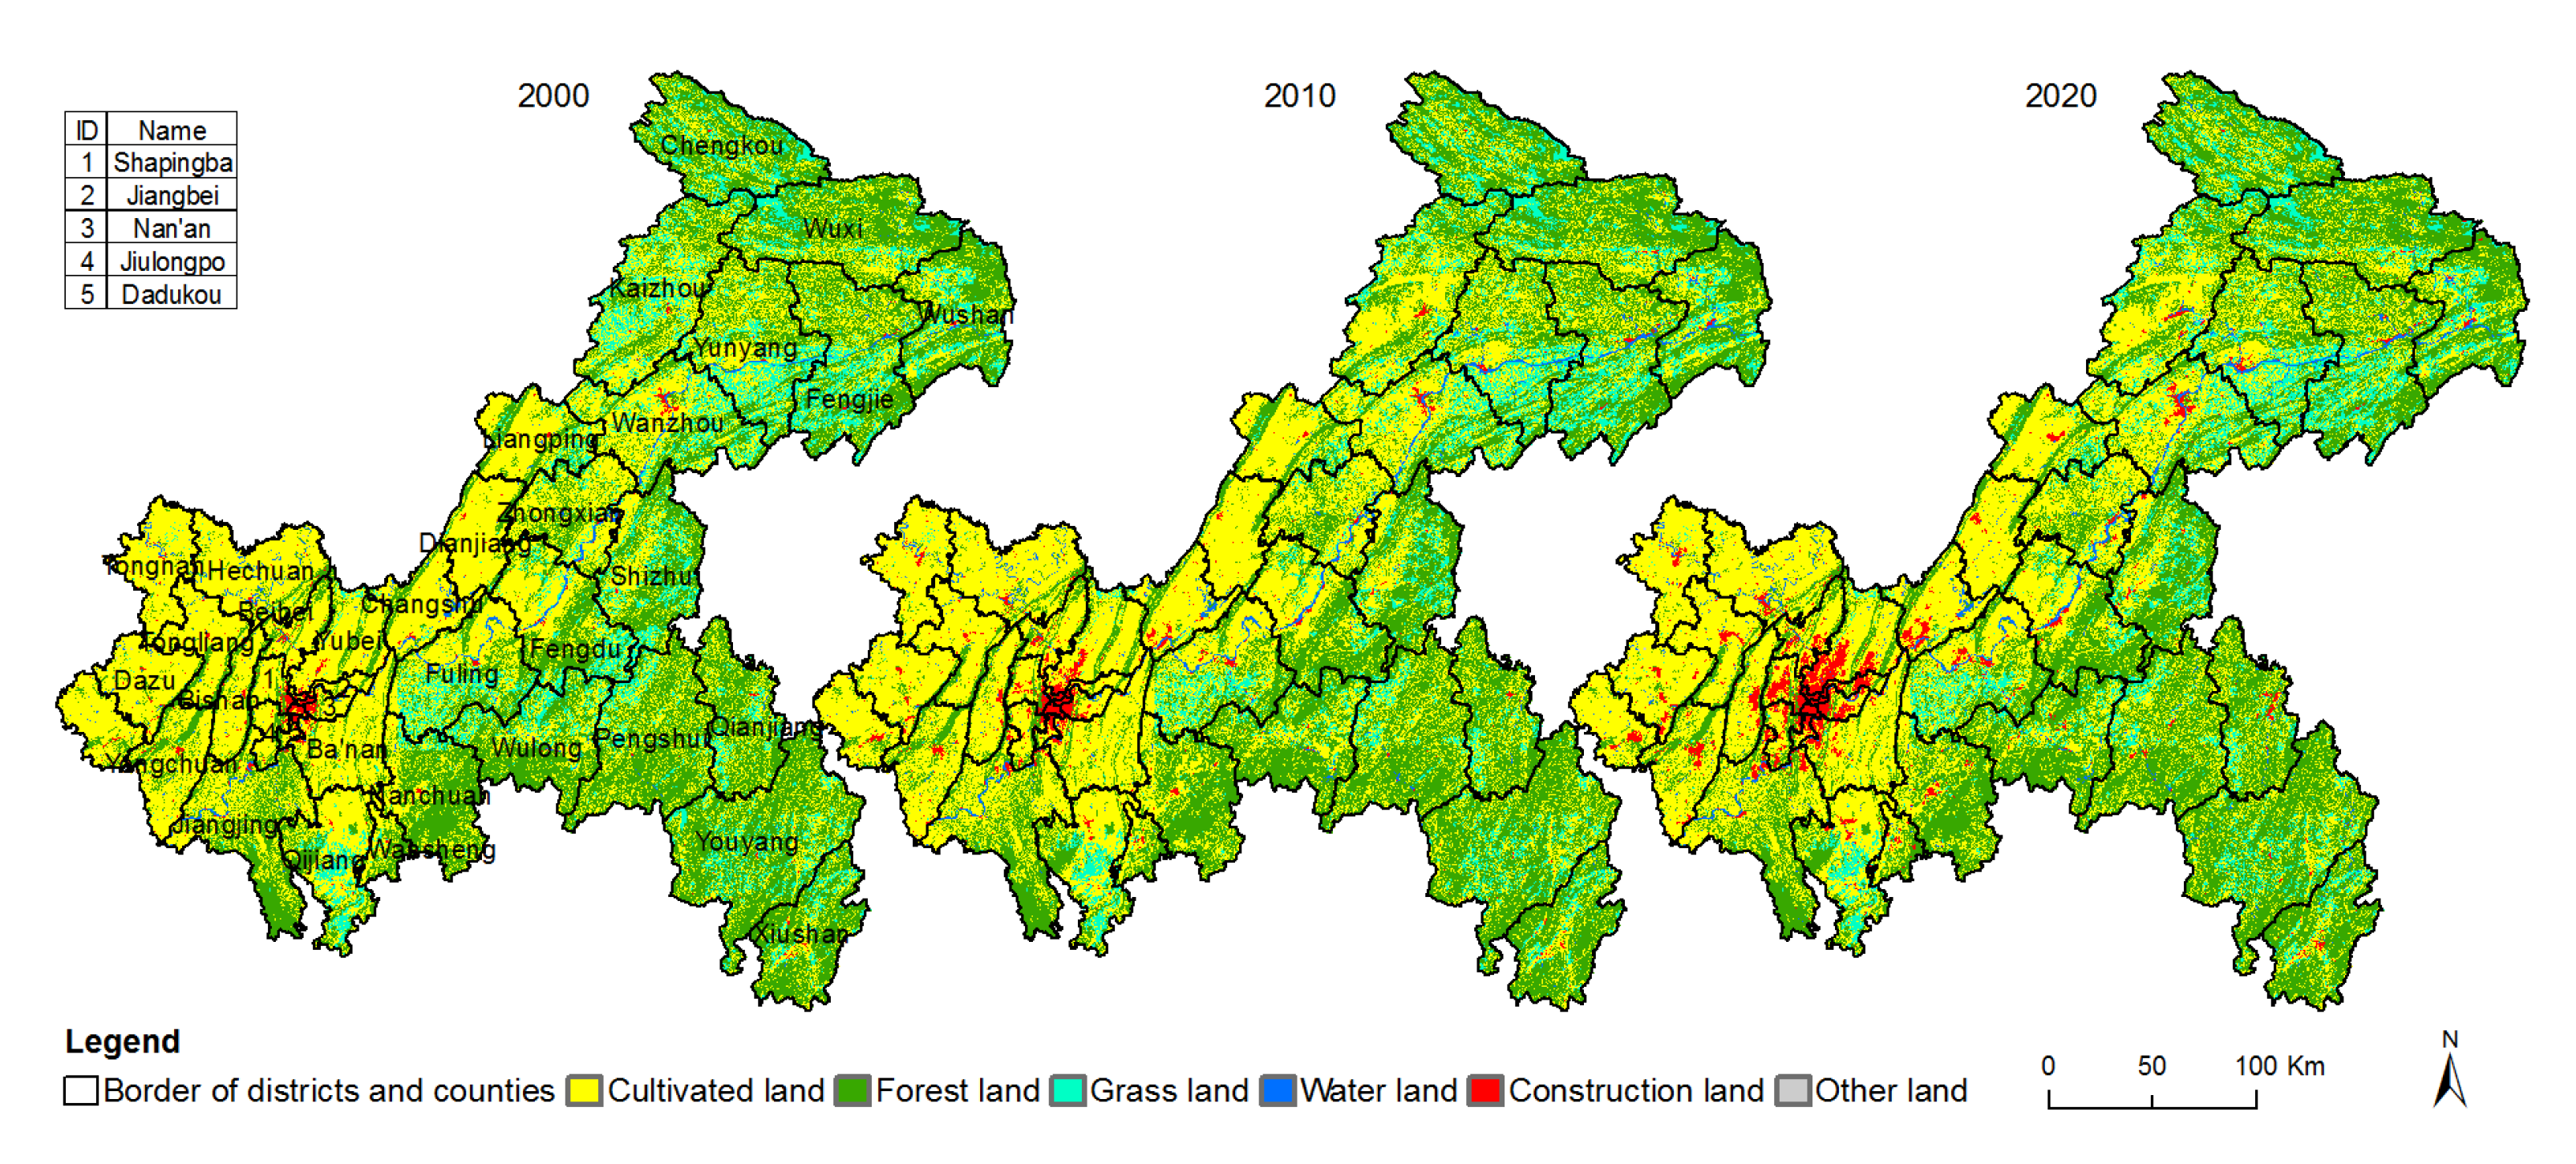
3.1.2. Analysis of Current Land Use Structure

As depicted in Figure 3, significant changes occurred (particularly for six land use types) in Chongqing between 2000 and 2020. In 2000, arable land had the largest area, accounting for 46.94%; forested land was the second-largest type, covering 39.87%; grassland accounted for 11.32%, while water bodies, built-up land, and other land types were relatively small, comprising 1.11%, 0.74%, and 0.02% respectively. By 2010, arable land accounted for 46.55%, remaining the predominant land use type despite a slight decrease, and forested land increased to 41.05%. In 2020, the proportions of arable land and forested land were 45.05% and 40.95%, respectively.
From 2000 to 2020, arable land showed a declining trend, decreasing by 1.89%. Within this period, arable land decreased by 0.39% between 2000 and 2010, and by 1.50% between 2010 and 2020. Over the same timeframe, forested land exhibited an overall increase of 1.08%. Specifically, forested land increased by 1.18% between 2000 and 2010 and decreased by 0.10% between 2010 and 2020, indicating an “increase followed by decrease” pattern. Grasslands demonstrated a noticeable decrease, decreasing by 1.86% from 2000 to 2020. The area of built-up land increased significantly by 2.17% during the same period. Arable land, forested land, grassland, and built-up land are critical land use types influencing carbon storage. These substantial changes undoubtedly impacted both the quantity and pattern of regional carbon storage.

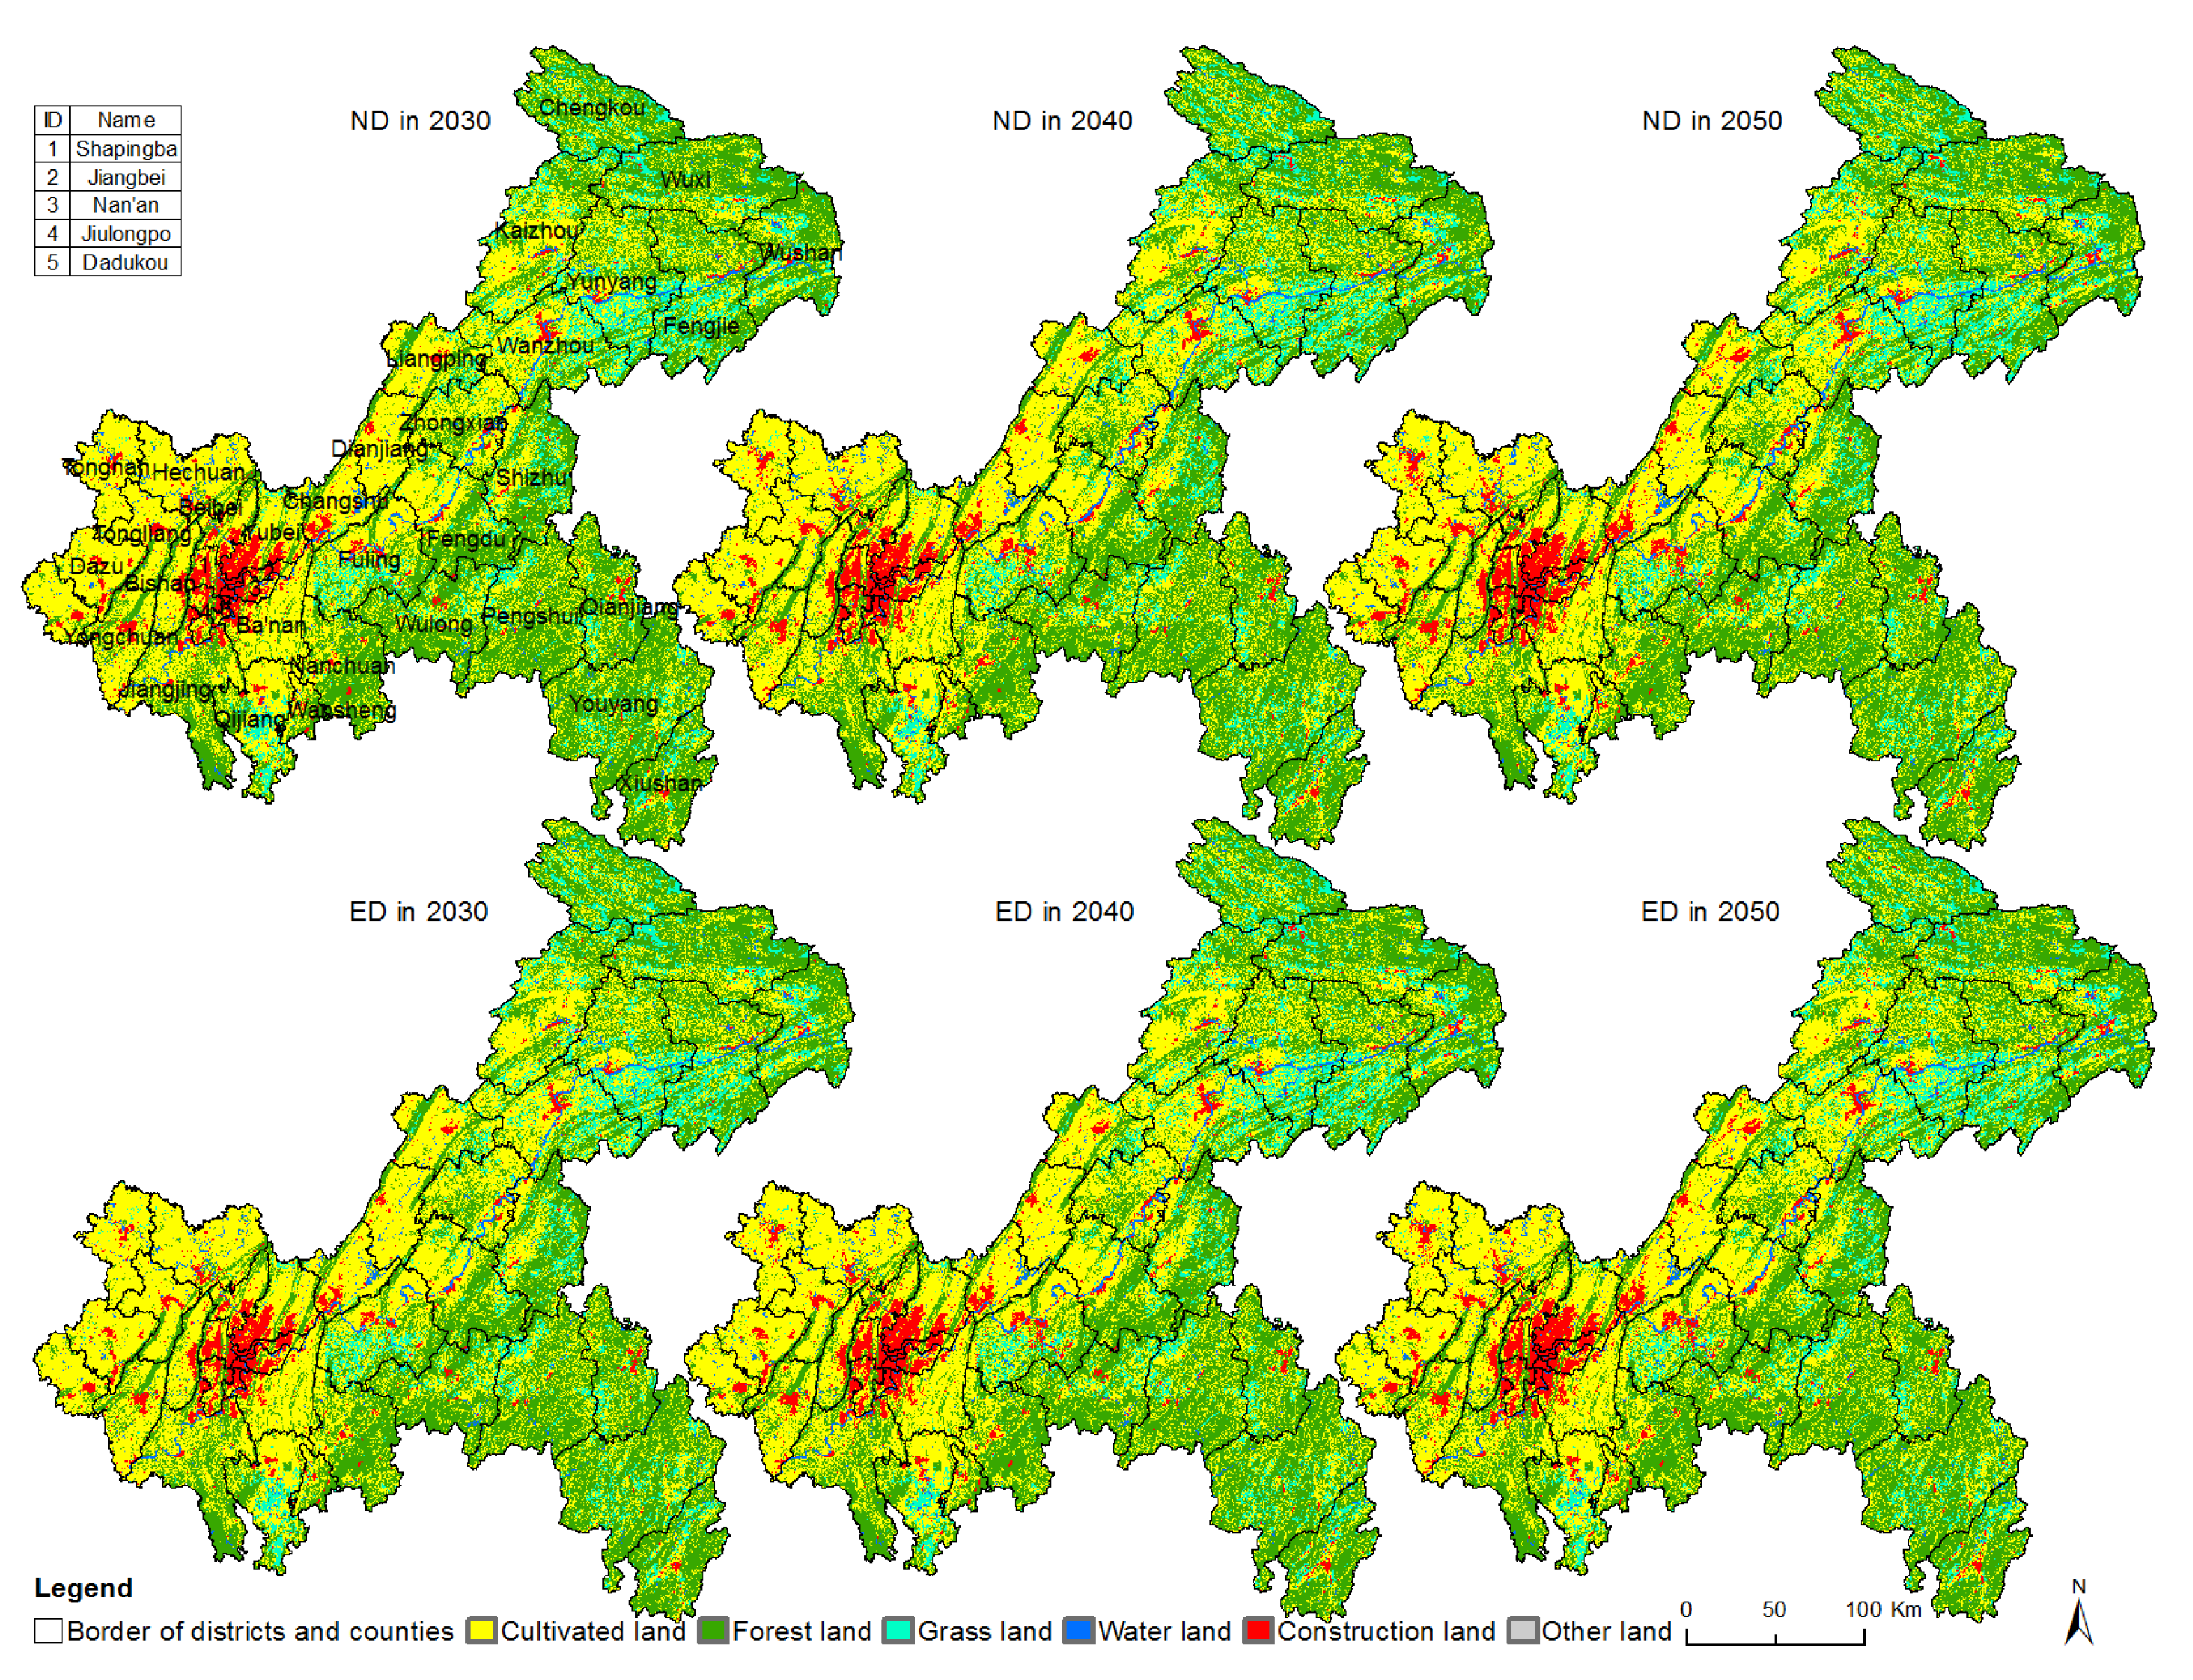
3.1.3. Analysis of Simulated Land Use Scenario Results

As shown in Figure 4, there have been no significant changes in the spatial distribution of various land classes. Forested land is primarily distributed in the mountainous regions of the southeastern urban cluster of Chongqing, the northeastern urban cluster of Chongqing, and the central urban area. Arable land is mainly concentrated in the western region and the southwestern part of the northeastern urban cluster of Chongqing. Urban construction is mainly distributed in the central urban area, Wanzhou District, Kaizhou District, and other regions. Water bodies are mainly found in areas such as the Yangtze River, Jialing River, Wu River, and Changshou Lake. Grassland and unused land are more scattered in distribution.
Under the ND scenario, the area of urban construction shows the greatest increase. It expands from 3260.98 km2 in 2030 to 4347.23 km2 in 2050, representing a growth of 1.32% in proportion to the total area. The next notable increase is observed in the area of forested land, which expands from 33,856.54 km2 in 2030 to 34,132.10 km2 in 2050, with a proportional growth of 0.34%. The area of water bodies expands from 1516.68 km2 in 2030 to 1799.11 km2 in 2050, representing a growth of 0.34% in proportion to the total area. However, the area of arable land experiences the most significant reduction, decreasing from 36,140.45 km2 in 2030 to 34,517.40 km2 in 2050, resulting in a decrease of 1.97% in proportion to the total area. Changes in grassland and unused land are relatively minor.
When comparing the EP scenario with the ND scenario, it is evident that under the EP scenario, there is an increase in forested and arable land areas, a decrease in urban construction, and fluctuations in grassland, water bodies, and other land types. This suggests that ecologically important land types, such as forested and arable land, have been preserved under the EP scenario, while the expansion of urban construction has been somewhat restricted.

3.2. Carbon Storage Evolution Quantitative Analysis

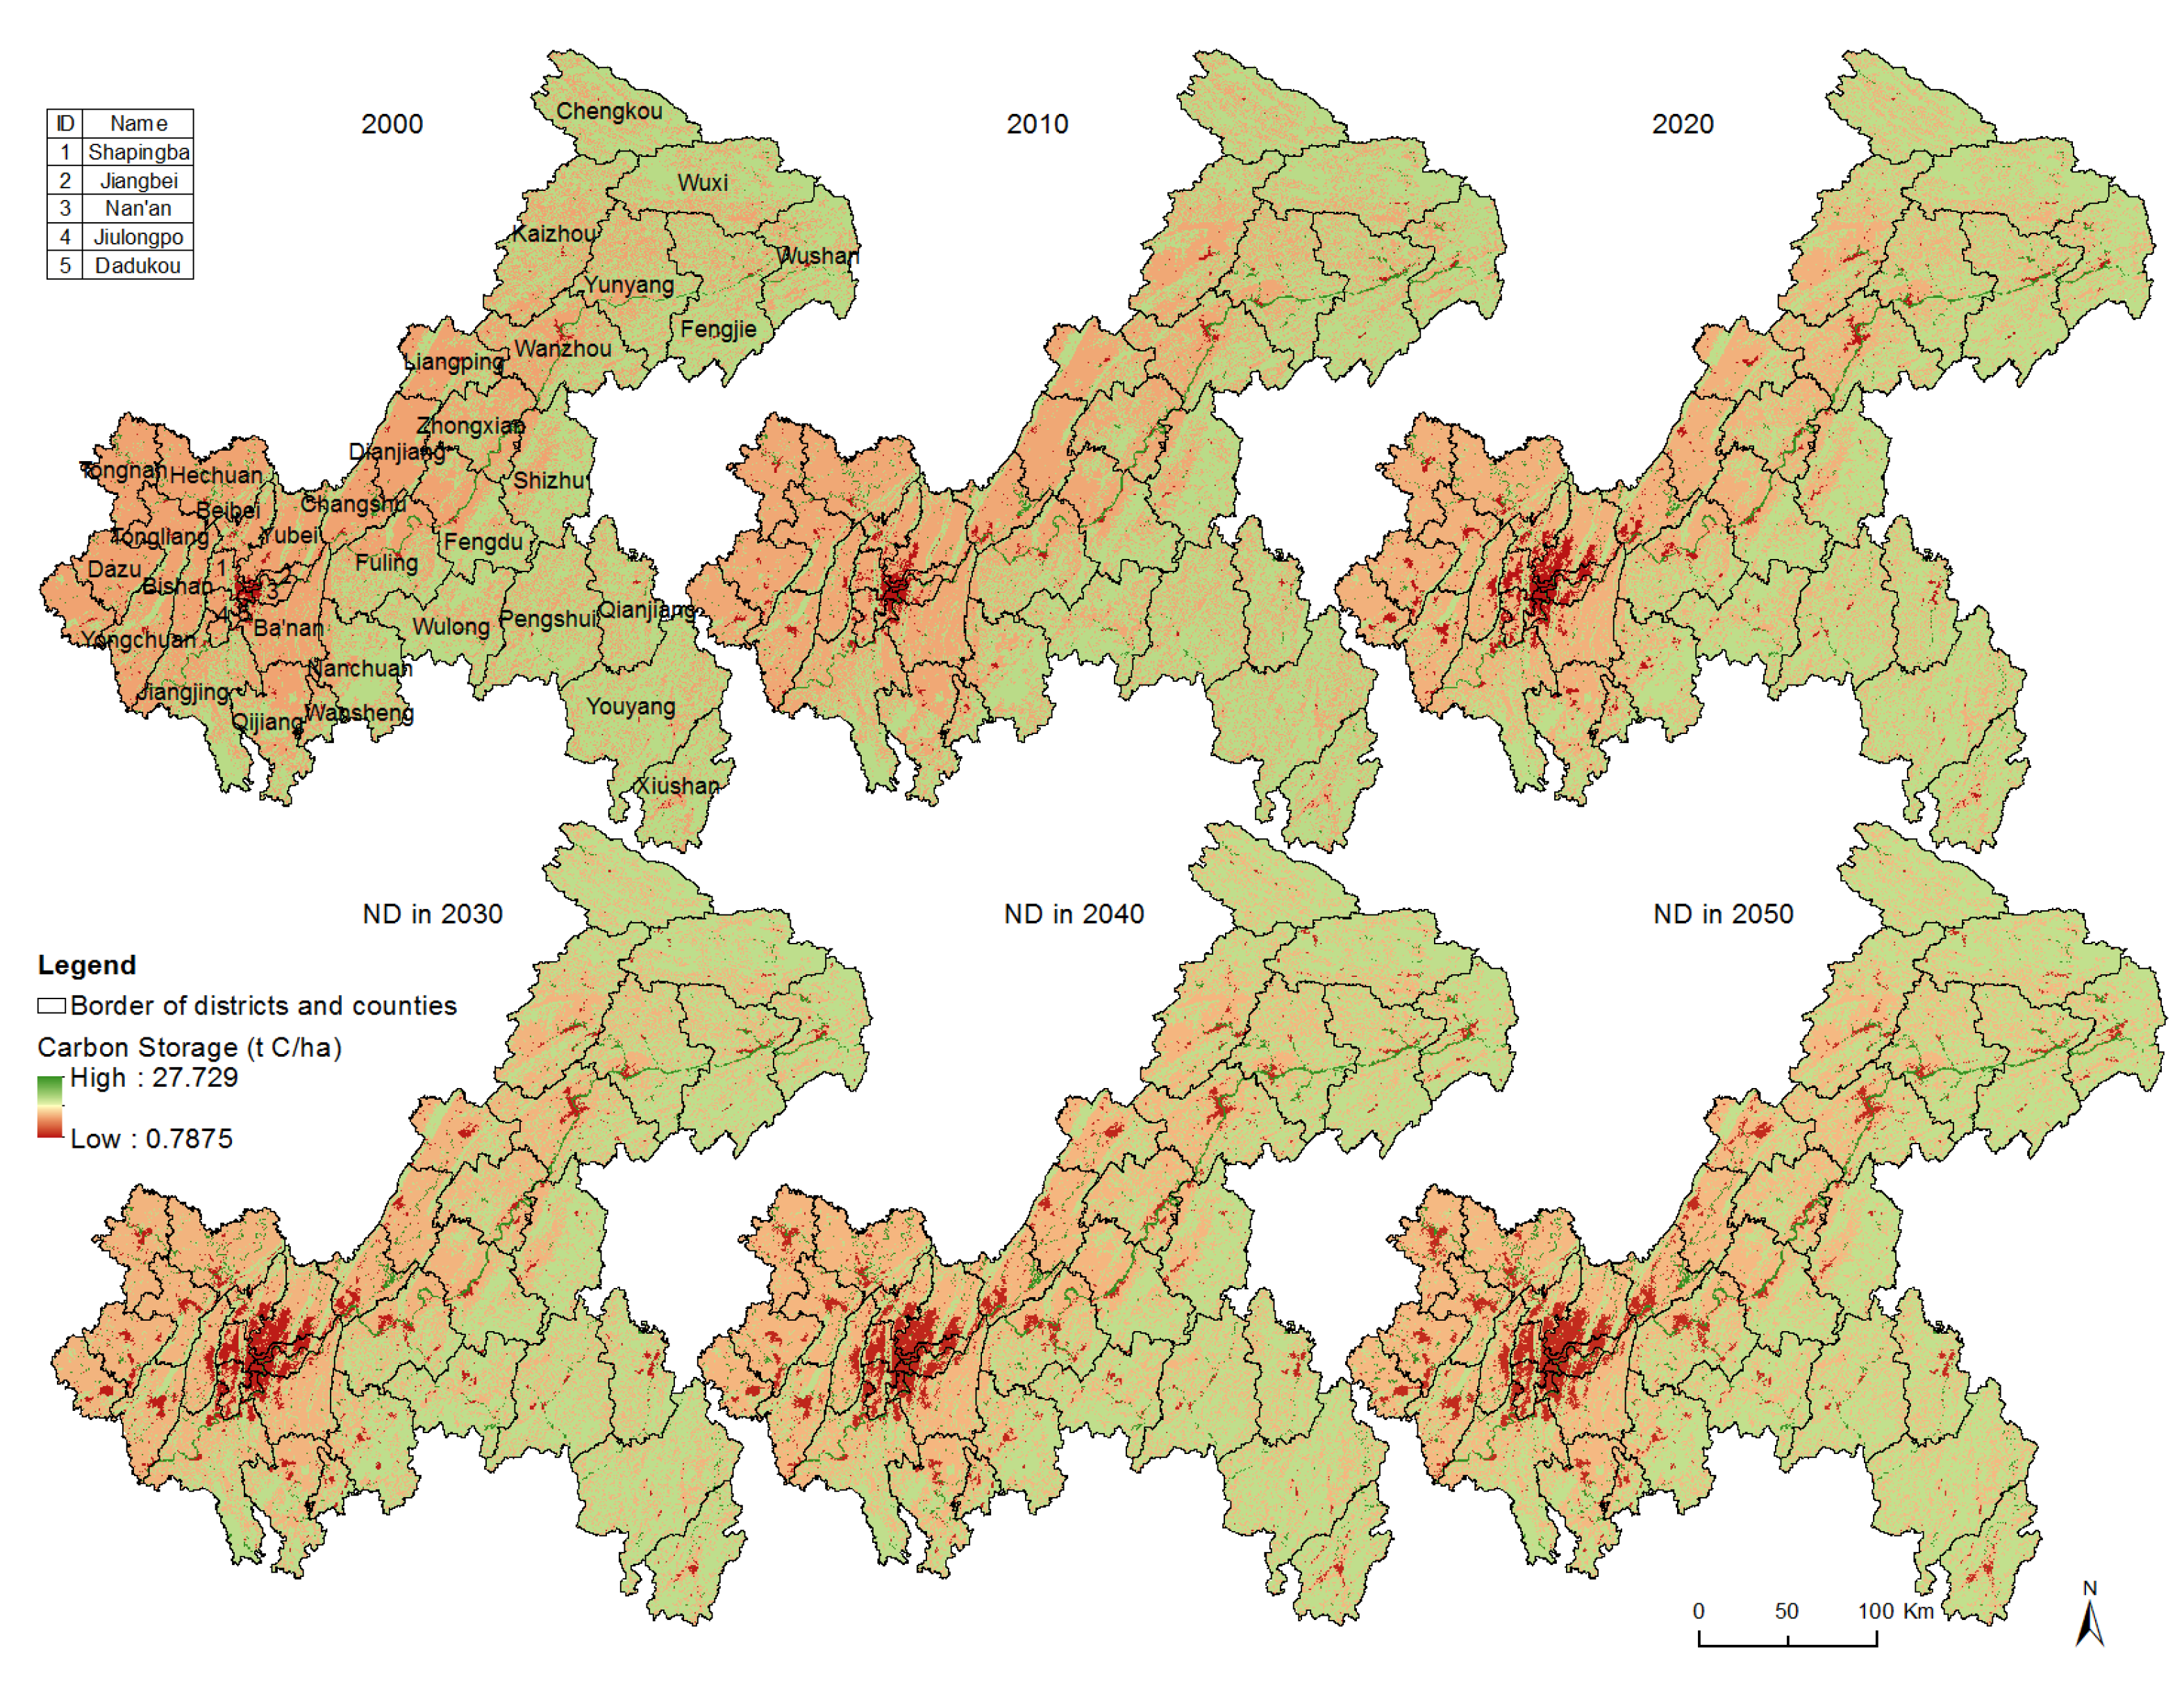
3.2.1. Analysis of Carbon Storage Evolution Trends in Chongqing

The carbon module of the InVEST model was employed to calculate carbon storage. Overall, high values of carbon storage in the city were consistent with the spatial distribution of forests and water bodies. They were mainly concentrated in mountainous areas such as Daba Mountain, Qiyao Mountain, Wuling Mountain, and DaLou Mountain, as well as water bodies like the Yangtze River, Jialing River, and Wu River (Figure 5). Areas with low carbon storage values were in alignment with the spatial distribution of urban construction and arable land, mainly found in the central urban area, Dianjiang, Zhongxian, Liangping, Wanzhou, and other regions. Rapid economic development and urban expansion have led to the swift expansion of low carbon storage value areas, with the primary expanding regions being the central urban area, Wanzhou, Qianjiang, Liangping, Kaizhou, and other economically well-developed and fast-growing regions. The total carbon storage in Chongqing shows an overall decreasing trend, with a significant decline observed during the period from 2000 to 2020, amounting to a decrease of 10.07 × 10⁶ t C. Under the ND scenario, the carbon storage in 2030 decreases by 10.54 × 10⁶ t C compared to 2020. Under the EP scenario in 2030, carbon storage is 2.38 × 10⁶ t C higher than the ND scenario. From 2030 to 2050, total carbon storage starts to stabilize. Therefore, while the carbon storage in the city exhibits a declining trend, the EP scenario helps to mitigate this decline, and future carbon storage will gradually stabilize as urban construction expansion slows down.

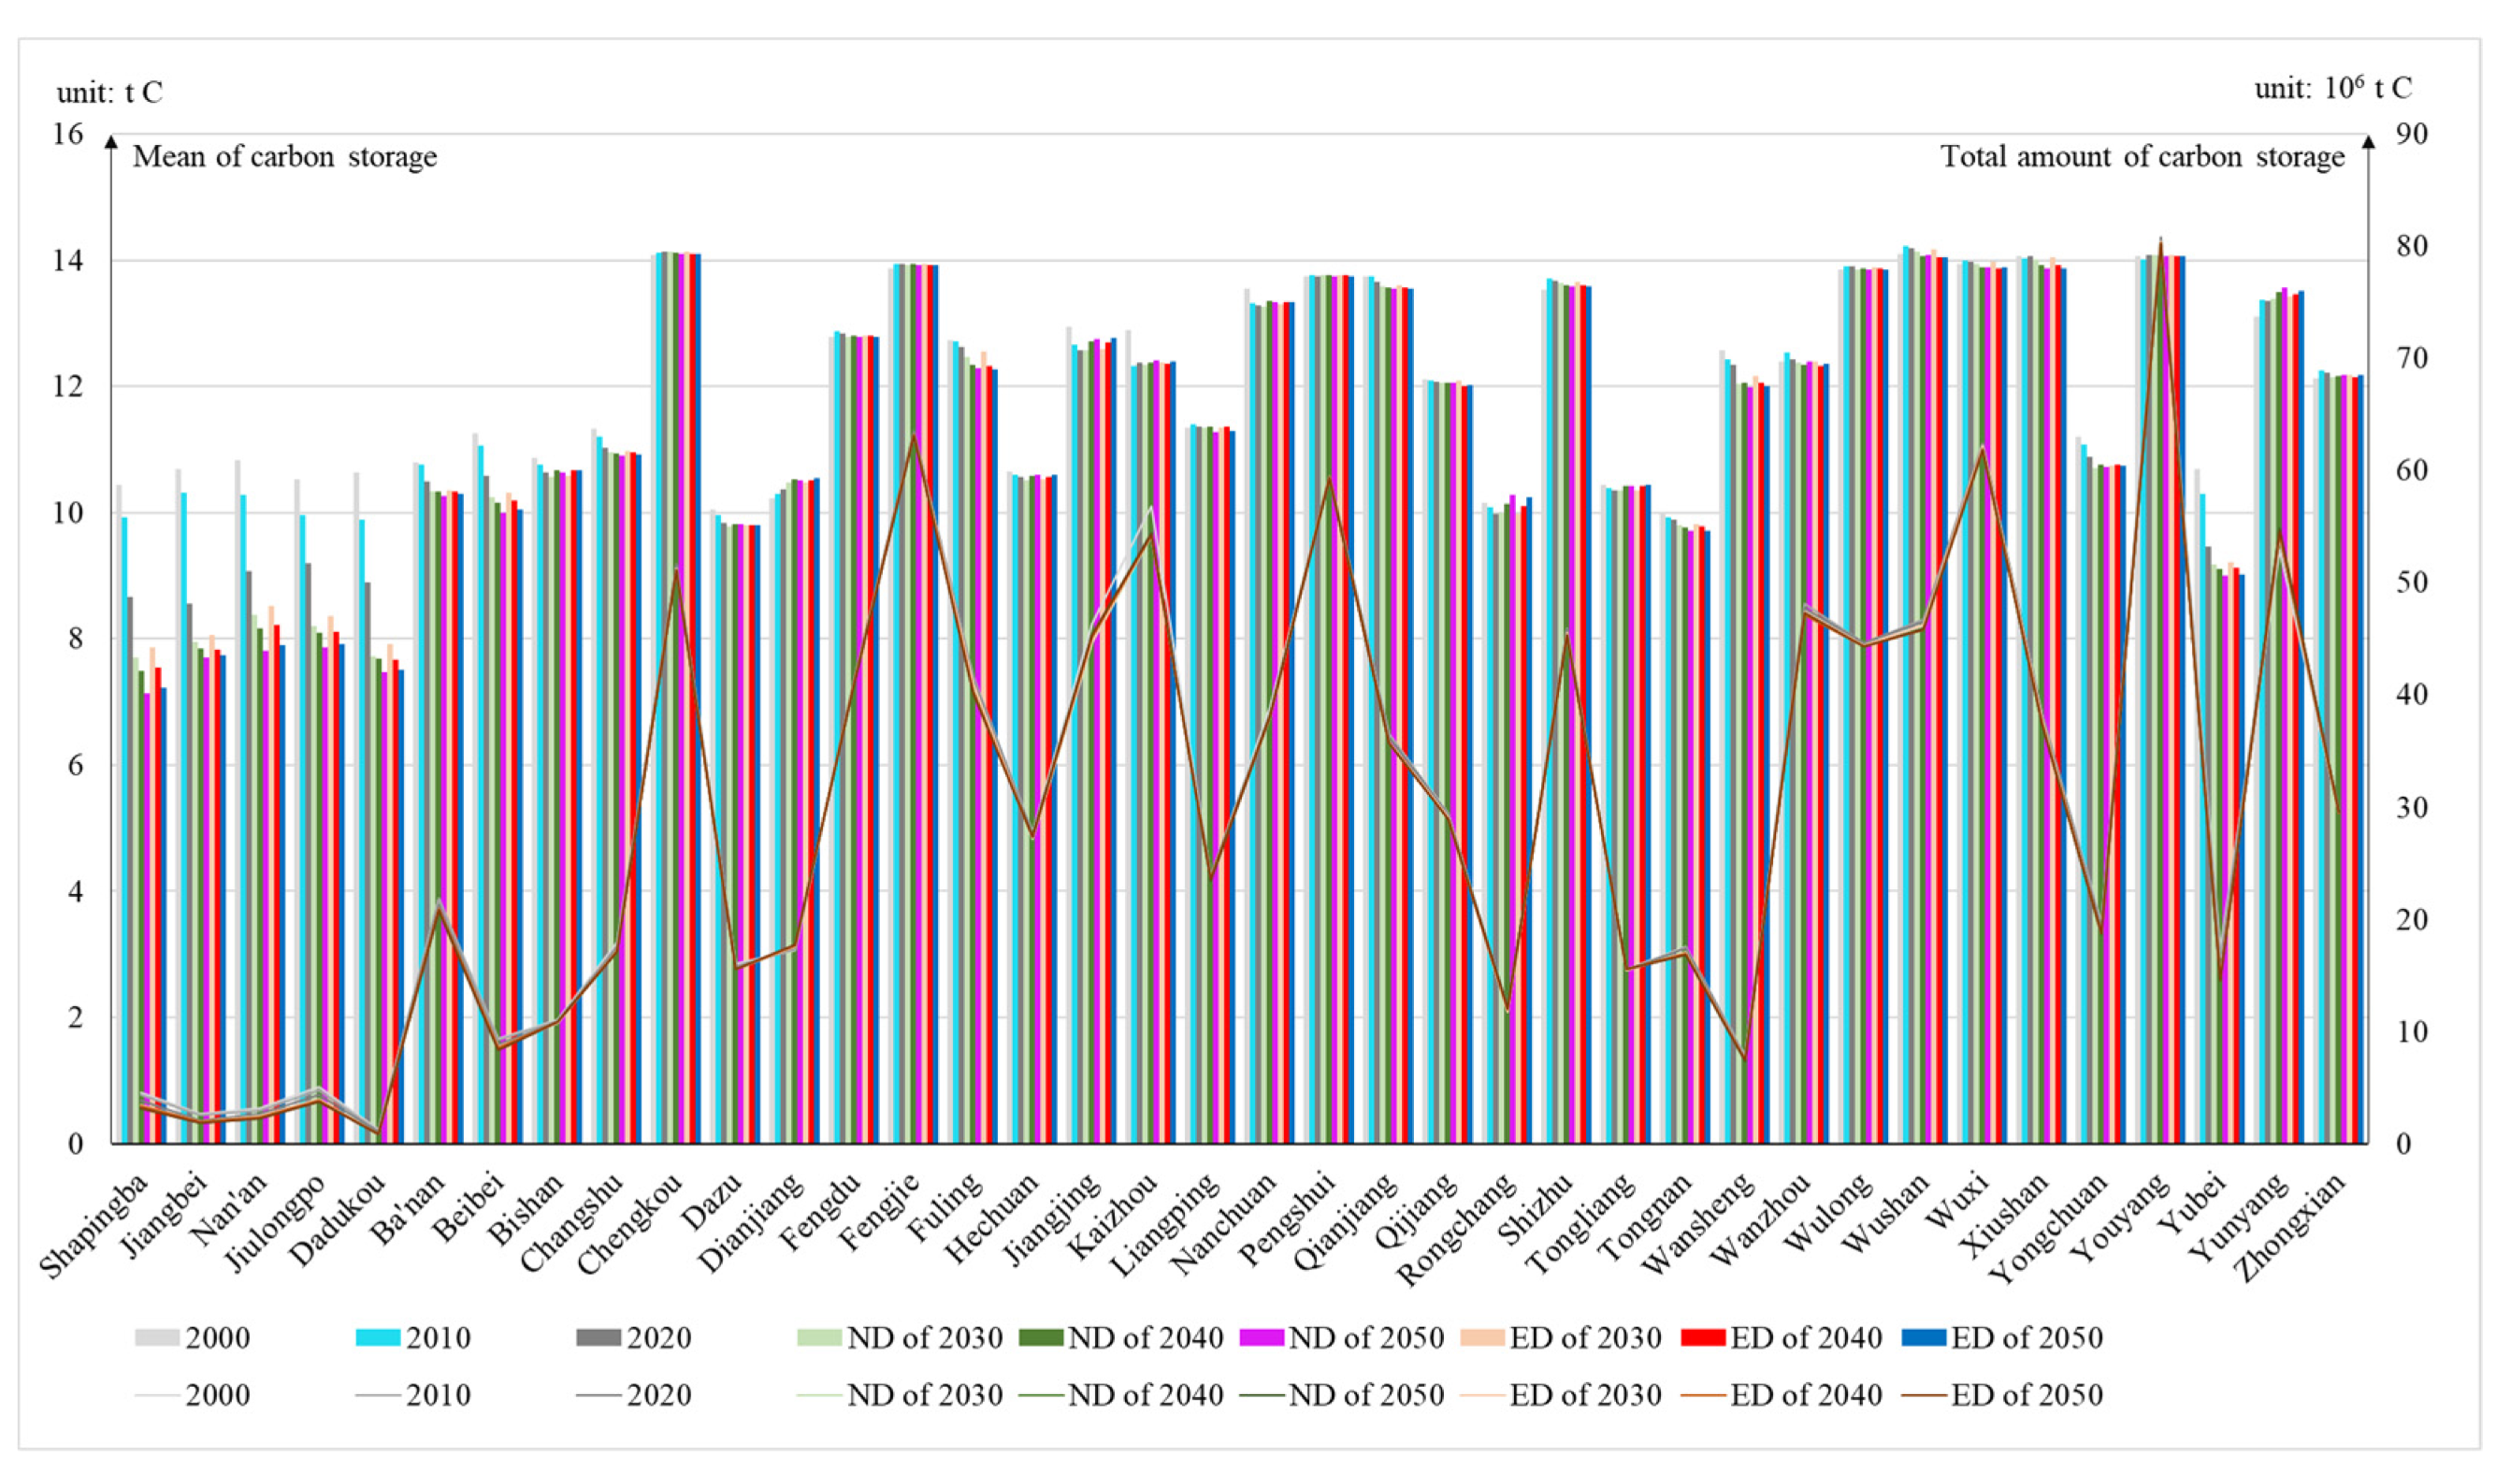
3.2.2. Evolving Carbon Storage Trends in Various Districts and Counties of Chongqing

The statistical results of carbon storage in various districts and counties of Chongqing (Figure 6) show that in terms of the total carbon storage volume ranking, Yuyang, Fengjie, and Wuxi had the highest carbon storage in the year 2000, at 80.75 × 10⁶ t C, 63.19 × 10⁶ t C, and 62.32 × 10⁶ t C, respectively. In the same year, Nanan, Jiangbei, and Dadukou had the lowest carbon storage, at 3.16 × 10⁶ t C, 2.62 × 10⁶ t C, and 1.21 × 10⁶ t C, respectively. The ranking trends for other years were consistent with those for 2000. The average carbon storage values for grids in Chongqing were 12.06 t C, 11.96 t C, and 11.72 t C in 2000, 2010, and 2020, respectively. Under the ND scenario, the average carbon storage values for grids were 11.55 t C, 11.54 t C, and 11.49 t C in 2030, 2040, and 2050, respectively. When looking at the average carbon storage values for each grid in various districts and counties of Chongqing in 2000, Wushan, Chengkou, and Xiushan had the highest average carbon storage values, at 14.11 t C, 14.09 t C, and 14.07 t C, respectively. Rongchang, Tongnan, and Dazu had the lowest average carbon storage values, at 10.16 t C, 10.05 t C, and 9.98 t C, respectively. In 2020, Wushan, Chengkou, and Xiushan had the highest average carbon storage values, at 14.19 t C, 14.14 t C, and 14.08 t C, respectively. Dadukou, Shapingba, and Jiangbei had the lowest average carbon storage values, at 8.89 t C, 8.66 t C, and 8.55 t C, respectively. This indicates that during the period of 2000–2020, rapid urban development caused a similarly rapid decrease in the average carbon storage values in the core urban areas of the central urban zone. Under the ND scenario in 2030, Wushan, Chengkou, and Xiushan had the highest average carbon storage values, at 14.14 t C, 14.13 t C, and 14.08 t C, respectively. Jiangbei, Dadukou, and Shapingba had the lowest average carbon storage values, at 7.96 t C, 7.73 t C, and 7.71 t C, respectively. Carbon storage values in 2040 and 2050 tended to stabilize, and under the EP scenario, the average carbon storage values for various districts and counties were generally higher than under the ND scenario, indicating that the EP scenario is effective in controlling the decline in carbon storage.

3.3. Analysis of Carbon Storage Spatiotemporal Evolution Characteristics

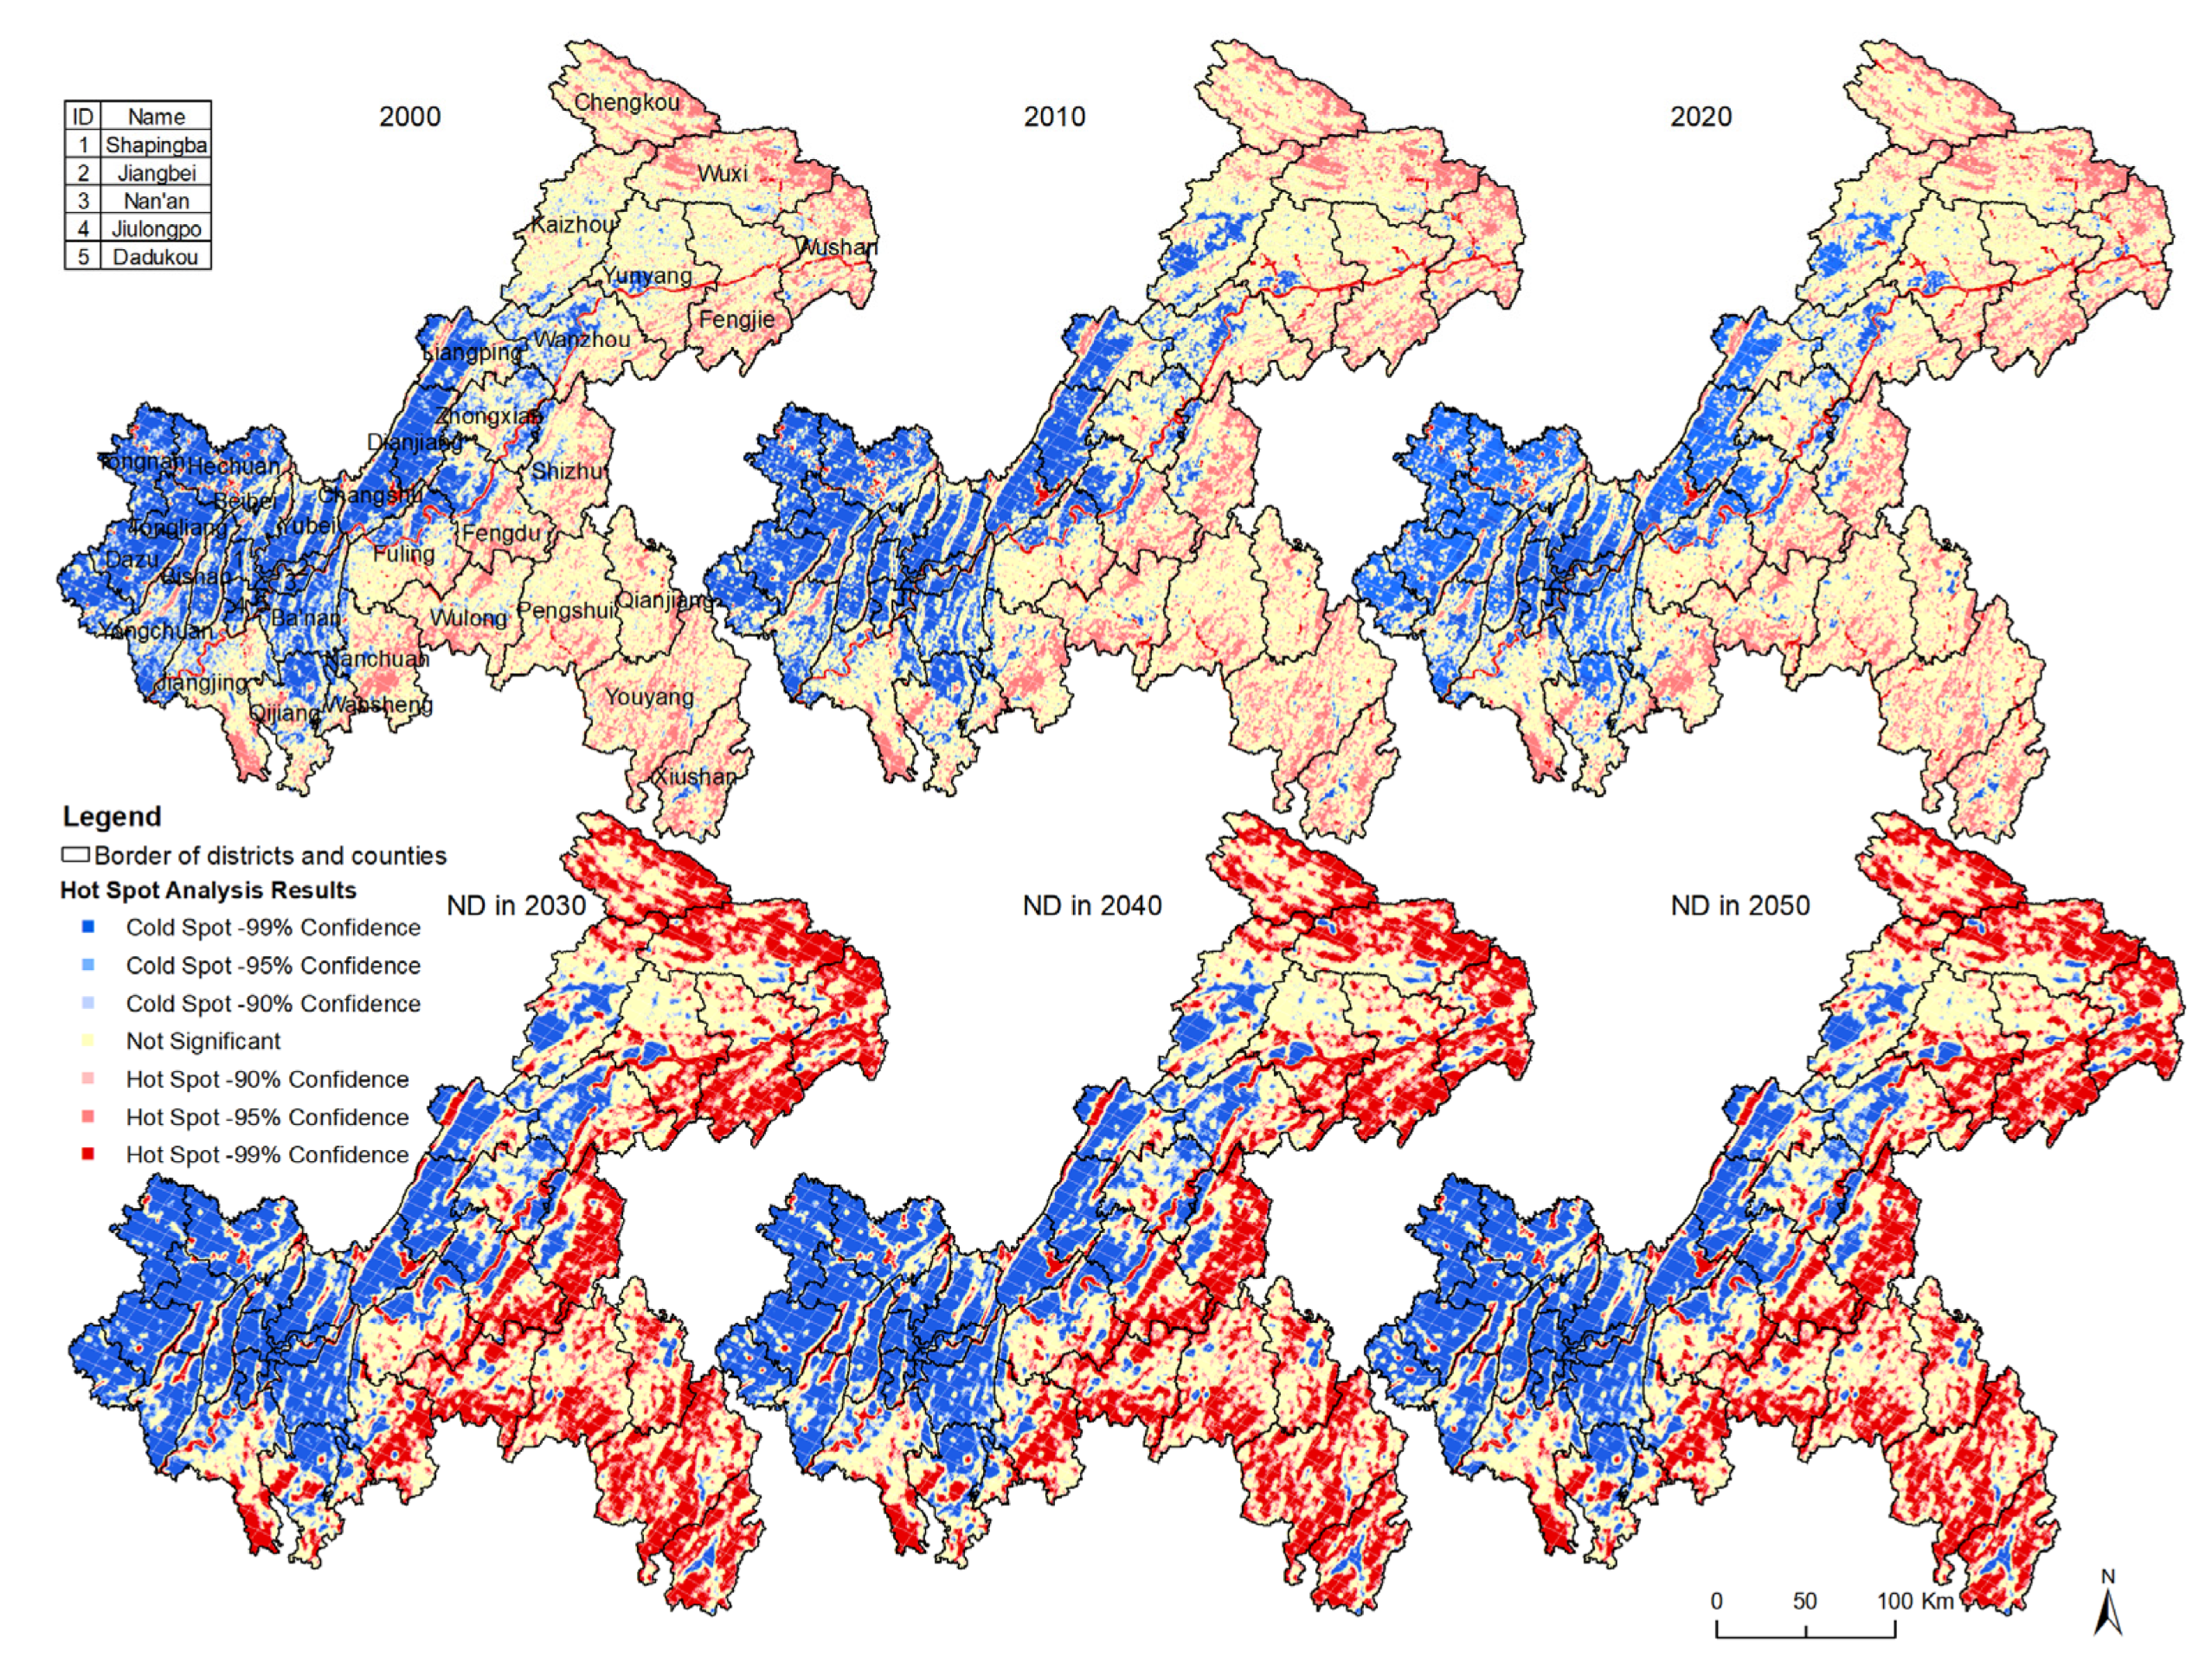
3.3.1. Analysis of Carbon Storage Spatial Aggregation Characteristics

The analysis of hotspots and cold spots of carbon storage from 2000 to 2050 is illustrated in Figure 7. From 2000 to 2020, the cold spots and hotspots of carbon storage were widely distributed across Chongqing, exhibiting an overall pattern of “hotspot aggregation in the east” and “cold spot aggregation in the west”. Cold spots (areas with low aggregated values) were mainly found in economically developed urban areas such as Jiangbei, Yubei, Banan, Bishan, and Tongliang, as well as some areas in the central parts of Dianjiang, Liangping, western Wanzhou, and northwestern Fuling. Hotspots (areas with high aggregated values) were predominantly situated in forested mountainous areas like Daba Mountain, Qiyao Mountain, Wuling Mountain, and DaLou Mountain. Under the natural scenario, from 2030 to 2050, both cold spots and hotspots displayed an increasing trend in spatial aggregation, particularly in the northeastern and southeastern parts of Chongqing where hotspots became more concentrated. The cold spots were mainly in alignment with the distribution of urban construction, with some areas experiencing higher levels of cold spot aggregation due to urban expansion, such as Xiushan, Qianjiang, Kaizhou, and Wushan. Under the EP scenario, the spatial distribution of cold spots and hotspots remained consistent with the patterns under the ND scenario.

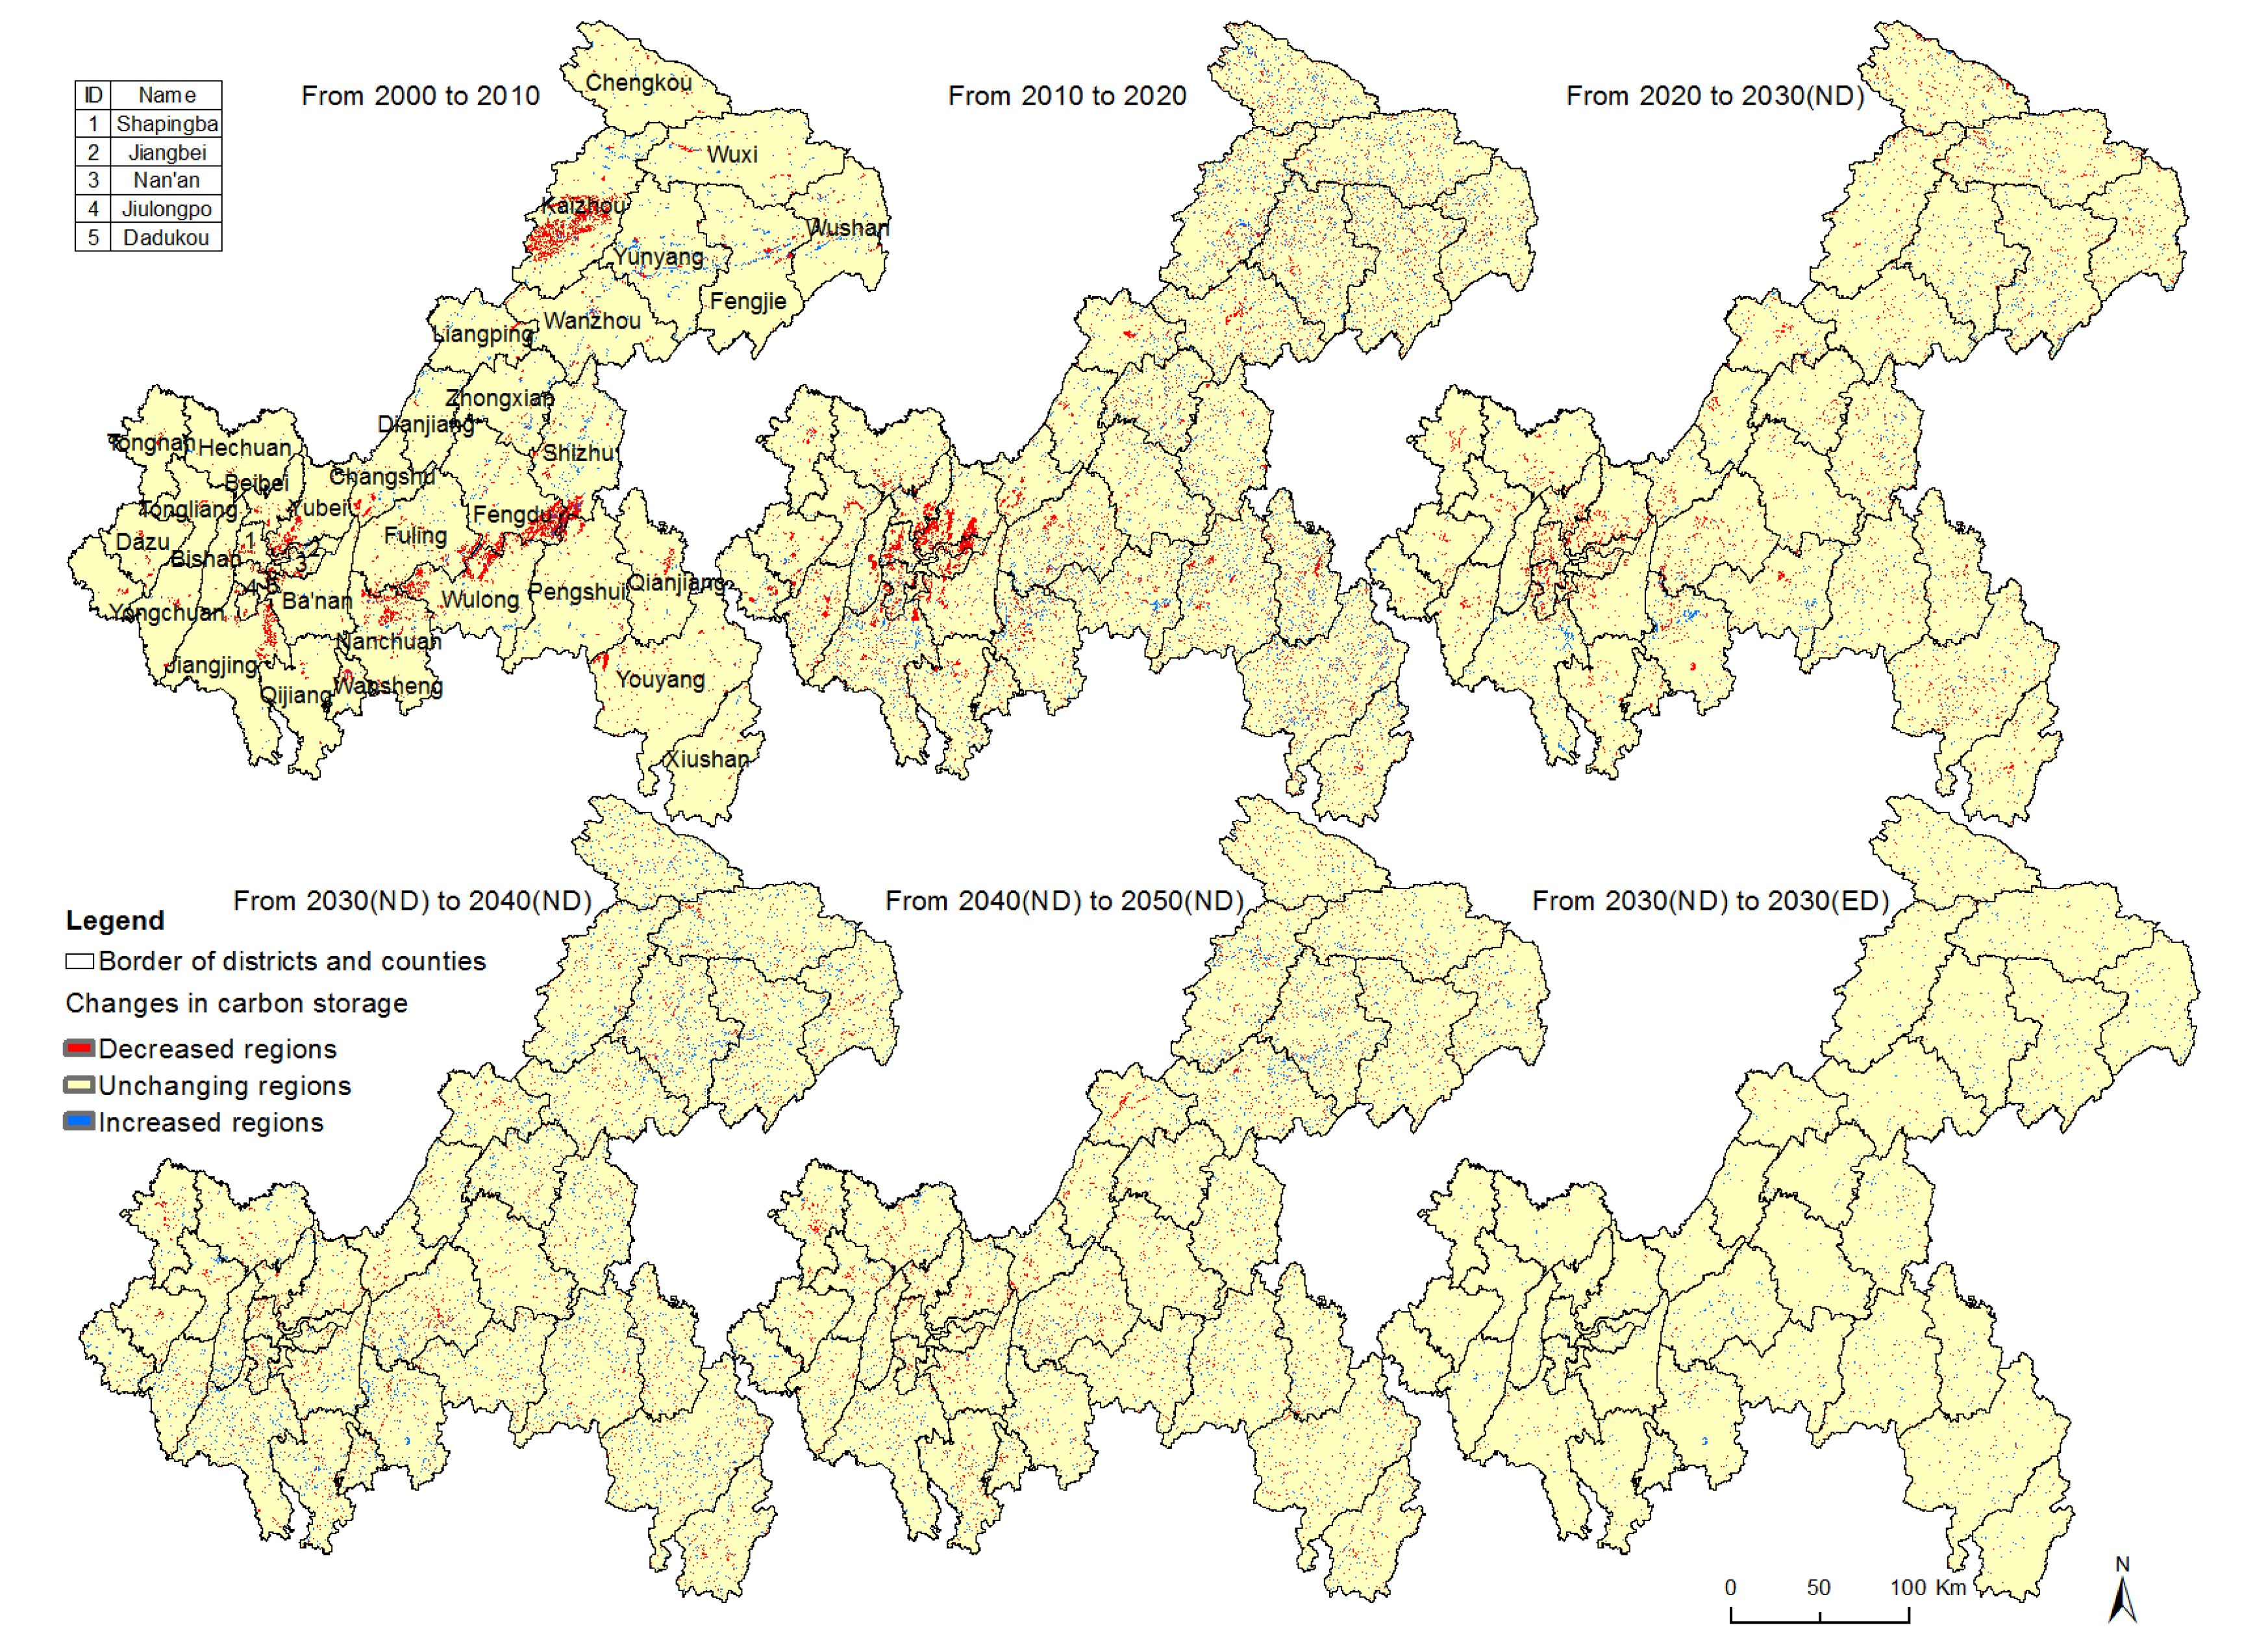
3.3.2. Analysis of Carbon Storage Spatiotemporal Change Patterns

Using GIS spatial overlay analysis, spatiotemporal trends of changes in carbon storage in Chongqing from 2000 to 2050 were explored (Figure 8). Due to rapid economic development, there was a noticeable decrease in carbon storage from 2000 to 2020, with significant decreases observed in regions such as Kaizhou, the southern part of Fengdu, the northern part of Nanchuan, and the central area of the central urban zone. Under the ND scenario, from 2020 to 2030, areas with decreased carbon storage were mainly concentrated in the middle of the central urban zone. From 2030 to 2050, the areas with changing carbon storage were more dispersed, and there were no evident trends of aggregated changes. When comparing the EP and ND scenarios, there was also no significant spatial aggregation of changing carbon storage regions. From 2000 to 2010, the proportions of areas with decreased, unchanged, and increased carbon storage aggregation levels in Chongqing were 2.99%, 95.95%, and 1.06%, respectively. From 2010 to 2020, these proportions were 4.39%, 92.40%, and 3.21%, respectively. Under the ND scenario, from 2020 to 2030, the proportions were 2.59%, 96.09%, and 1.32%, respectively. From 2030 to 2040, the proportions were 2.26%, 95.03%, and 2.71%, respectively. From 2040 to 2050, the proportions were 2.40%, 95.69%, and 1.91%, respectively. Comparing the EP scenario to the ND scenario, the changes in carbon storage aggregation were relatively minor in the year 2030. Therefore, Chongqing’s carbon storage exhibits an overall trend of decreasing aggregation, with the area of regions exhibiting unchanged aggregation levels continuing to increase. This suggests that future carbon storage will gradually stabilize.

4. Discussion

4.1. Impact of Land Use Change on Carbon Storage

An analysis of the carbon storage trends in different land use types in Chongqing from 2000 to 2050 was conducted. As shown in Figure 9, the contribution of carbon storage from various land use types to the total carbon storage in Chongqing ranked from highest to lowest as follows: forested land, cropland, grassland, water bodies, construction, and unused land. The carbon storage of water bodies and construction exhibited an increasing trend, while cropland and grassland showed a decreasing trend, and forested land displayed fluctuating changes. Under the ND scenario, the carbon storage of cropland decreased from 4.02 × 10⁸ t C in 2000 to 3.57 × 10⁸ t C in 2050. Under the EP scenario, the carbon storage of cropland in 2050 was 3.59 × 10⁸ t C. Under the ND scenario, the carbon storage of forested land increased from 5.79 × 10⁸ t C in 2000 to 5.94 × 10⁸ t C in 2050. Under the EP scenario, the carbon storage of forested land in 2050 was 5.95 × 10⁸ t C. Hence, changes in land use types have a significant impact on carbon storage. Urban expansion results in a substantial conversion of cropland and grassland into constructed areas, leading to a greater decrease in carbon storage compared to the increase in carbon storage from forests and water bodies. Chongqing is located in an upstream region, and its rapid economic development has led to extensive land development in central areas, causing a major decline in carbon storage due to the conversion of cropland, forested land, and grassland. Conversely, less-developed areas experience less land development, resulting in increased carbon storage from forests and water bodies. These findings align with existing research. For instance, Li et al. (2022) [24] used the InVEST model to calculate carbon storage in Changchun and found that cropland loss to construction was a major contributor to carbon storage decline, and EP scenarios increased carbon storage. Similarly, Li et al. analyzed carbon dynamics in the northeastern area of the Qinghai-Tibet Plateau and identified wetland and cropland conversion as key drivers of carbon storage decline [28]. Babbar et al. [14] assessed carbon sequestration in the Sariska Tiger Reserve and concluded that forest conversion negatively affected carbon storage. Therefore, changes in land use types directly affect carbon storage, and establishing rational land use development and conservation policies is a key pathway to enhancing regional carbon storage from a macroscopic perspective.

4.2. Factors Affecting Carbon Storage

Several factors influence carbon storage. For example, Ren et al. identified NDVI and per capita GDP as significant factors affecting carbon storage in Hainan Province [29]. Kiran et al. conducted a meta-analysis on carbon storage potential in Indian agricultural and forestry systems and highlighted the influence of land use types and precipitation on these systems [30]. Li et al. used the InVEST model to analyze the driving forces of ecosystem services in Anxi County and found that elevation, slope, and NDVI all had an impact on carbon storage [28]. Analyzing the influencing factors of carbon storage in Chongqing is essential for enhancing future carbon storage. Based on previous research [22] and the local context, natural resource endowment and economic development are key factors affecting carbon storage. Therefore, this study primarily selected elevation (X1), terrain fluctuation (X2), NDVI (X3), annual average temperature (X4), annual average precipitation (X5), and nighttime light index (X6) as indicators for the analysis of influencing factors. A geographic detector was employed to identify the impact of each factor on carbon storage and their interaction effects. The results in Table 2 indicate that elevation, terrain fluctuation, NDVI, annual average temperature, annual average precipitation, and nighttime light index had impact strengths (q values) of 0.88, 0.81, 0.61, 0.86, 0.77, and 0.81, respectively. All p values were below 0.05, indicating significance through statistical testing and revealing that each factor significantly affected carbon storage. Interaction analysis revealed nonlinear enhancement and dual-factor enhancement for all factor combinations. Notably, the combinations X3∩X4(1), X4∩X5(1), X5∩X6(1), and X4∩X6(0.99) had the most significant impact on carbon storage, highlighting that certain factor interactions result in more substantial effects on carbon storage. Consequently, elevation, terrain fluctuation, annual average temperature, and nighttime light index had the greatest impact on carbon storage. However, different combinations of these factors exerted even greater influence. Enhancing carbon storage from a comprehensive perspective, such as optimizing the layout of ecological land and economic development, is crucial for the region’s future development.

4.3. Limitations and Perspectives

This study employed the PLUS model for simulating future land use type data and achieved satisfactory results. However, the selection of driving factors during land use type data simulation using the PLUS model was mainly based on existing research, which might lead to incomplete consideration of both driving and limiting factors. In the future, there is room to further enrich these factors. Similarly, when using the InVEST model for carbon storage calculation, the carbon density values for various land use types were determined based on previous studies, which might result in discrepancies from actual conditions. Future research could involve extensive sampling analysis to acquire more accurate carbon density values. At the same time, we will carry out in-depth research on carbon storage measurement of different types of forests in the future.

5. Conclusions

This study focused on Chongqing and leveraged the strengths of the PLUS model, InVEST model, and a geographic detector model to explore the evolving trends of carbon storage and influencing factors under different development scenarios in Chongqing. The main conclusions are as follows:
  • The PLUS model is suitable for simulating land use type data at a 30-m resolution in Chongqing (with a Kappa coefficient above 0.85 and an overall accuracy above 0.90). Over the study period, significant changes occurred in the area of each land use type in Chongqing. Cropland and grassland showed a continuous decrease, while construction and water bodies exhibited an increasing trend. Forested land and other land use types displayed fluctuating changes. Under the ED scenario, the areas of forested land and cropland were larger than those under the ND scenario, while the area of construction was smaller under the EP scenario.
  • The total carbon storage in Chongqing exhibited an overall decreasing trend, with a decrease of 10.07 × 10⁶ t C from 2000 to 2020. Under the ND scenario, the carbon storage in 2030 decreased by 10.54 × 10⁶ t C compared to 2020, while under the ED scenario, the carbon storage in 2030 was 2.38 × 10⁶ t C higher than that under the ND scenario. From 2030 to 2050, carbon storage began to stabilize. The areas with the highest carbon storage in 2000 were Youyang, Fengjie, and Wuxi (80.75 × 10⁶ t C, 63.19 × 10⁶ t C, 62.32 × 10⁶ t C, respectively), while those with the lowest carbon storage were Nanchuan, Jiangbei, and Dadukou (3.16 × 10⁶ t C, 2.62 × 10⁶ t C, 1.21 × 10⁶ t C, respectively). The trends in carbon storage rankings were consistent with those in the year 2000. Ecological protection scenarios were beneficial for slowing the decline in carbon storage, and future carbon storage will gradually stabilize as the speed of construction expansion slows, contributing to achieving the “dual carbon” goals.
  • Carbon storage hotspots exhibited characteristics of “eastern hotspot clustering” and “western cold spot clustering”. Cold spots were mainly distributed in economically developed urban areas such as Jiangbei, Yubei, and Banan, as well as parts of Dianjiang, Liangping, and Wanzhou. Hotspots were mainly concentrated in forest-rich mountainous areas like Daba Mountain, Qiyao Mountain, Wuling Mountain, and Da Luo Mountain. From 2000 to 2010 and from 2010 to 2020, the proportions of areas with decreased, unchanged, and increased carbon storage aggregation in Chongqing were 2.99%, 95.95%, 1.06%, and 4.39%, 92.40%, 3.21%, respectively. Overall, carbon storage exhibited a decreasing trend in aggregation, and future carbon storage will gradually stabilize.
  • Changes in land use types had a significant impact on carbon storage. Elevation, terrain fluctuation, annual average temperature, and nighttime light index had the greatest impact on carbon storage, while different combinations of these factors exerted even more substantial influence. Enhancing carbon storage requires considering ecological priorities and adopting a green development philosophy to comprehensively improve regional development conditions, achieving stable and improved carbon storage and promoting the realization of “dual carbon” goals.

Author Contributions

Conceptualization, K.Z., J.H., X.T. and P.H.; methodology, K.Z., J.H. and X.T.; software, K.Z., J.H., X.T. and P.H.; Validation, K.Z. and L.W.; formal analysis, K.Z. and J.H.; Investigation, K.Z., J.H. and T.W.; resources, K.Z. and J.H.; data curation, K.Z., J.H., T.W. and S.H.; writing—original draft preparation, K.Z., J.H., X.T. and P.H.; writing—review and editing, K.Z., J.H., D.G. and S.H.; visualization, K.Z., P.H., L.W. and D.G.; funding acquisition, K.Z. and J.H. All authors have read and agreed to the published version of the manuscript.

Funding

This research was supported and funded by the Chongqing Municipal Bureau of Science and Technology (No. CSTB2022TIAD-KPX0118; No. CSTB2022TIAD-KPX0120; No. CSTB2022NSCQ-MSX0538), National Natural Science Foundation of China Youth Science Fund Project (No. 42301353), and Chongqing Municipal Education Commission (No. 22SKGH569).

Institutional Review Board Statement

Not applicable.

Informed Consent Statement

Not applicable.

Data Availability Statement

Not applicable.

Conflicts of Interest

The authors declare no conflicts of interest.

References

  1. Tian, C.S.; Qi, L. Empirical Decomposition and Peaking Path of Carbon Emissions in Resource-Based Areas. J. Clean. Prod. 2023, 395, 136372. [Google Scholar] [CrossRef]
  2. Adams, A.B.; Pontius, J.; Galford, G.L.; Merrill, S.C.; Gudex-Cross, D. Modeling Carbon Storage across a Heterogeneous Mixed Temperate Forest: The Influence of Forest Type Specificity on Regional-Scale Carbon Storage Estimates. Landsc. Ecol. 2018, 33, 641–658. [Google Scholar] [CrossRef]
  3. Rodriguez Martin, J.A.; Alvaro-Fuentes, J.; Gonzalo, J.; Gil, C.; Ramos-Miras, J.J.; Corbi, J.M.G.; Boluda, R. Assessment of the Soil Organic Carbon Stock in Spain. Geoderma 2016, 264, 117–125. [Google Scholar] [CrossRef]
  4. Volkova, L.; Roxburgh, S.H.; Weston, C.J. Effects of Prescribed Fire Frequency on Wildfire Emissions and Carbon Sequestration in a Fire Adapted Ecosystem Using a Comprehensive Carbon Model. J. Environ. Manag. 2021, 290, 112673. [Google Scholar] [CrossRef] [PubMed]
  5. Bultan, S.; Nabel, J.E.M.S.; Hartung, K.; Ganzenmuller, R.; Xu, L.; Saatchi, S.; Pongratz, J. Tracking 21st Century Anthropogenic and Natural Carbon Fluxes through Model-Data Integration. Nat. Commun. 2022, 13, 5516. [Google Scholar] [CrossRef] [PubMed]
  6. Gonzalez-Garcia, A.; Arias, M.; Garcia-Tiscar, S.; Alcorlo, P.; Santos-Martin, F. National Blue Carbon Assessment in Spain Using Invest: Current State and Future Perspectives. Ecosyst. Serv. 2022, 53, 101397. [Google Scholar] [CrossRef]
  7. Zarandian, A.; Badamfirouz, J.; Musazadeh, R.; Rahmati, A.; Azimi, S.B. Scenario Modeling for Spatial-Temporal Change Detection of Carbon Storage and Sequestration in a Forested Landscape in Northern Iran. Environ. Monit. Assess. 2018, 190, 474. [Google Scholar] [CrossRef] [PubMed]
  8. Imran, M.; Din, N.U. Geospatially Mapping Carbon Stock for Mountainous Forest Classes Using Invest Model and Sentinel-2 Data: A Case of Bagrote Valley in the Karakoram Range. Arab. J. Geosci. 2021, 14, 756. [Google Scholar] [CrossRef]
  9. Nouri, J.; Gharagozlou, A.; Arjmandi, R.; Faryadi, S.; Adl, M. Predicting Urban Land Use Changes Using a Ca-Markov Model. Arab. J. Sci. Eng. 2014, 39, 5565–5573. [Google Scholar] [CrossRef]
  10. Lamichhane, S.; Shakya, N.M. Land Use Land Cover (Lulc) Change Projection in Kathmandu Valley Using the Clue-S Model. J. Adv. Coll. Eng. Manag. 2021, 6, 221–233. [Google Scholar] [CrossRef]
  11. Liang, X.; Guan, Q.F.; Clarke, K.C.; Liu, S.S.; Wang, B.Y.; Yao, Y. Understanding the Drivers of Sustainable Land Expansion Using a Patch-Generating Land Use Simulation (Plus) Model: A Case Study in Wuhan, China. Comput. Environ. Urban Syst. 2021, 85, 101569. [Google Scholar] [CrossRef]
  12. Zhu, K.W.; He, J.; Zhang, L.X.; Song, D.; Wu, L.J.; Liu, Y.Q.; Zhang, S. Impact of Future Development Scenario Selection on Landscape Ecological Risk in the Chengdu-Chongqing Economic Zone. Land 2022, 11, 964. [Google Scholar] [CrossRef]
  13. Yang, S.; Su, H. Multi-Scenario Simulation of Ecosystem Service Values in the Guanzhong Plain Urban Agglomeration, China. Sustainability 2022, 14, 8812. [Google Scholar] [CrossRef]
  14. Babbar, D.; Areendran, G.; Sahana, M.; Sarma, K.; Raj, K.; Sivadas, A. Assessment and Prediction of Carbon Sequestration Using Markov Chain and Invest Model in Sariska Tiger Reserve, India. J. Clean. Prod. 2020, 278, 123333. [Google Scholar] [CrossRef]
  15. Qacami, M.; Khattabi, A.; Lahssini, S.; Rifai, N.; Meliho, M. Land-Cover/Land-Use Change Dynamics Modeling Based on Land Change Modeler. Ann. Reg. Sci. 2022, 70, 237–258. [Google Scholar] [CrossRef]
  16. Kusi, N.L.S. Prospective Evaluation of the Impact of Land Use Change on Ecosystem Services in the Ourika Watershed, Morocco. Land Use Policy 2020, 97, 104796. [Google Scholar] [CrossRef]
  17. Pechanec, V.; Purkyt, J.; Benc, A.; Nwaogu, C.; Sterbova, L.; Cudlin, P. Modelling of the Carbon Sequestration and Its Prediction under Climate Change. Ecol. Inform. 2018, 47, 50–54. [Google Scholar] [CrossRef]
  18. Zhang, Z.H.; Song, Y.Z.; Wu, P. Robust Geographical Detector. Int. J. Appl. Earth Obs. Geoinf. 2022, 109, 102782. [Google Scholar] [CrossRef]
  19. Luo, W.; Jasiewicz, J.; Stepinski, T.; Wang, J.F.; Xu, C.D.; Cang, X.Z. Spatial Association between Dissection Density and Environmental Factors over the Entire Conterminous United States. Geophys. Res. Lett. 2016, 43, 692–700. [Google Scholar] [CrossRef]
  20. Xiang, S.J.; Wang, Y.; Deng, H.; Yang, C.M.; Wang, Z.F.; Gao, M. Response and Multi-Scenario Prediction of Carbon Storage to Land Use/Cover Change in the Main Urban Area of Chongqing, China. Ecol. Indic. 2023, 142, 109205. [Google Scholar] [CrossRef]
  21. Liu, C.X.; Wang, C.X.; Li, Y.C.; Wang, Y. Spatiotemporal Differentiation and Geographic Detection Mechanism of Ecological Security in Chongqing, China. Glob. Ecol. Conserv. 2022, 35, e02072. [Google Scholar] [CrossRef]
  22. Mao, Y.F.; Zhou, Q.G.; Wang, T.; Luo, H.R.; Wu, L.J. Spatial–Temporal Variation of Carbon Storage and Its Quantitative Attribution in the Three Gorges Reservoir Area Coupled with PLUS—InVEST Geodector Model. Resour. Environ. Yangtze Basin 2023, 32, 1042–1057. [Google Scholar]
  23. Yu, Y.; Guo, B.; Wang, C.L.; Zang, W.Q.; Huang, X.Z.; Wu, Z.W.; Xu, M.; Zhou, K.D.; Li, J.L.; Yang, Y. Carbon Storage Simulation and Analysis in Beijing-Tianjin-Hebei Region Based on Ca-Plus Model under Dual-Carbon Background. Geomat. Nat. Hazards Risk 2023, 14, 2173661. [Google Scholar] [CrossRef]
  24. Li, Y.X.; Liu, Z.S.; Li, S.J.; Li, X. Multi-Scenario Simulation Analysis of Land Use and Carbon Storage Changes in Changchun City Based on Flus and Invest Model. Land 2022, 11, 647. [Google Scholar] [CrossRef]
  25. Wan, Q.L.; Shao, J.A. Land Use and Carbon Storage Estimation in Chongqing Section of the Three Gorges Reservoir Area from 2000 to 2020. J. Chongqing Norm. Univ. 2023, 40, 1–11. [Google Scholar]
  26. Song, Y.Z.; Wang, J.F.; Ge, Y.; Xu, C.D. An Optimal Parameters-Based Geographical Detector Model Enhances Geographic Characteristics of Explanatory Variables for Spatial Heterogeneity Analysis: Cases with Different Types of Spatial Data. GISci. Remote Sens. 2020, 57, 593–610. [Google Scholar] [CrossRef]
  27. Bai, H.X.; Li, D.Y.; Ge, Y.; Wang, J.F.; Cao, F. Spatial Rough Set-Based Geographical Detectors for Nominal Target Variables. Inf. Sci. 2022, 586, 525–539. [Google Scholar] [CrossRef]
  28. Li, W.; Geng, J.W.; Bao, J.L.; Lin, W.X.; Wu, Z.Y.; Fan, S.S. Analysis of Spatial and Temporal Variations in Ecosystem Service Functions and Drivers in Anxi County Based on the Invest Model. Sustainability 2023, 15, 10153. [Google Scholar] [CrossRef]
  29. Ren, B.Y.; Wang, Q.F.; Zhang, R.R.; Zhou, X.Z.; Wu, X.P.; Zhang, Q. Assessment of Ecosystem Services: Spatio-Temporal Analysis and the Spatial Response of Influencing Factors in Hainan Province. Sustainability 2022, 14, 9145. [Google Scholar] [CrossRef]
  30. Kiran, K.T.M.; Pal, S.; Chand, P.; Kandpal, A. Carbon Sequestration Potential of Agroforestry Systems in Indian Agricultural Landscape: A Meta-Analysis. Ecosyst. Serv. 2023, 62, 101537. [Google Scholar]
Figure 1. Administrative map of Chongqing.
Land 13 00421 g001
Figure 2. Flowchart for simulating future land use type data under ND and ED scenarios.
Land 13 00421 g002
Figure 3. Distribution of land use types in Chongqing from 2000 to 2020.
Land 13 00421 g003
Figure 4. Distribution maps of land use type data simulation results for the ND and EP scenarios from 2030 to 2050.
Land 13 00421 g004
Figure 5. Spatial distribution of carbon storage from 2000 to 2050 (since the spatial distribution patterns under ND and EP scenarios are consistent, the results for the EP scenario from 2030 to 2050 are not shown in the figure).
Land 13 00421 g005
Figure 6. Average and total carbon storage in various districts and counties from 2000 to 2050.
Land 13 00421 g006
Figure 7. Distribution of carbon storage hotspots and cold spots from 2000 to 2050 (since the spatial distribution patterns under ND and EP scenarios are consistent, the results for the EP scenario from 2030 to 2050 are not shown in the figure).
Land 13 00421 g007
Figure 8. Distribution of differences in carbon storage for different periods (since the spatial differences between ND and EP scenarios are small [as seen in the third image of the second row, “From 2030 (ND) to 2030 (ED)”], the results for the EP scenario for 2040 and 2050 are not shown).
Land 13 00421 g008
Figure 9. Changes in carbon storage for different land use types from 2000 to 2050.
Land 13 00421 g009
Table 1. Carbon density values of different land use types.
Land Use TypesGround Carbon DensityUnderground Carbon
Density
Soil Carbon DensityDeath Carbon Density
Cultivated land0.3450.0689.5800.350
Forest land4.590111.5400.283
Grass land0.1000.25017.0500.017
Water land0.1901.38029.2400
Construction land002.5250
Other land0.05000.8250
Table 2. Calculation results of interaction effects among factors based on a geographic detector.
Interactive FactorsX1X2X3X4X5X6
X10.88
X20.970.81
X30.970.900.61
X40.970.9810.87
X50.960.970.9010.77
X60.980.980.950.9910.81
Disclaimer/Publisher’s Note: The statements, opinions and data contained in all publications are solely those of the individual author(s) and contributor(s) and not of MDPI and/or the editor(s). MDPI and/or the editor(s) disclaim responsibility for any injury to people or property resulting from any ideas, methods, instructions or products referred to in the content.

