


Response of Runoff Change to Soil and Water Conservation Measures in the Jing River Catchment of China

 , ,
, ,
Abstract
1. Introduction
2. Materials and Methods
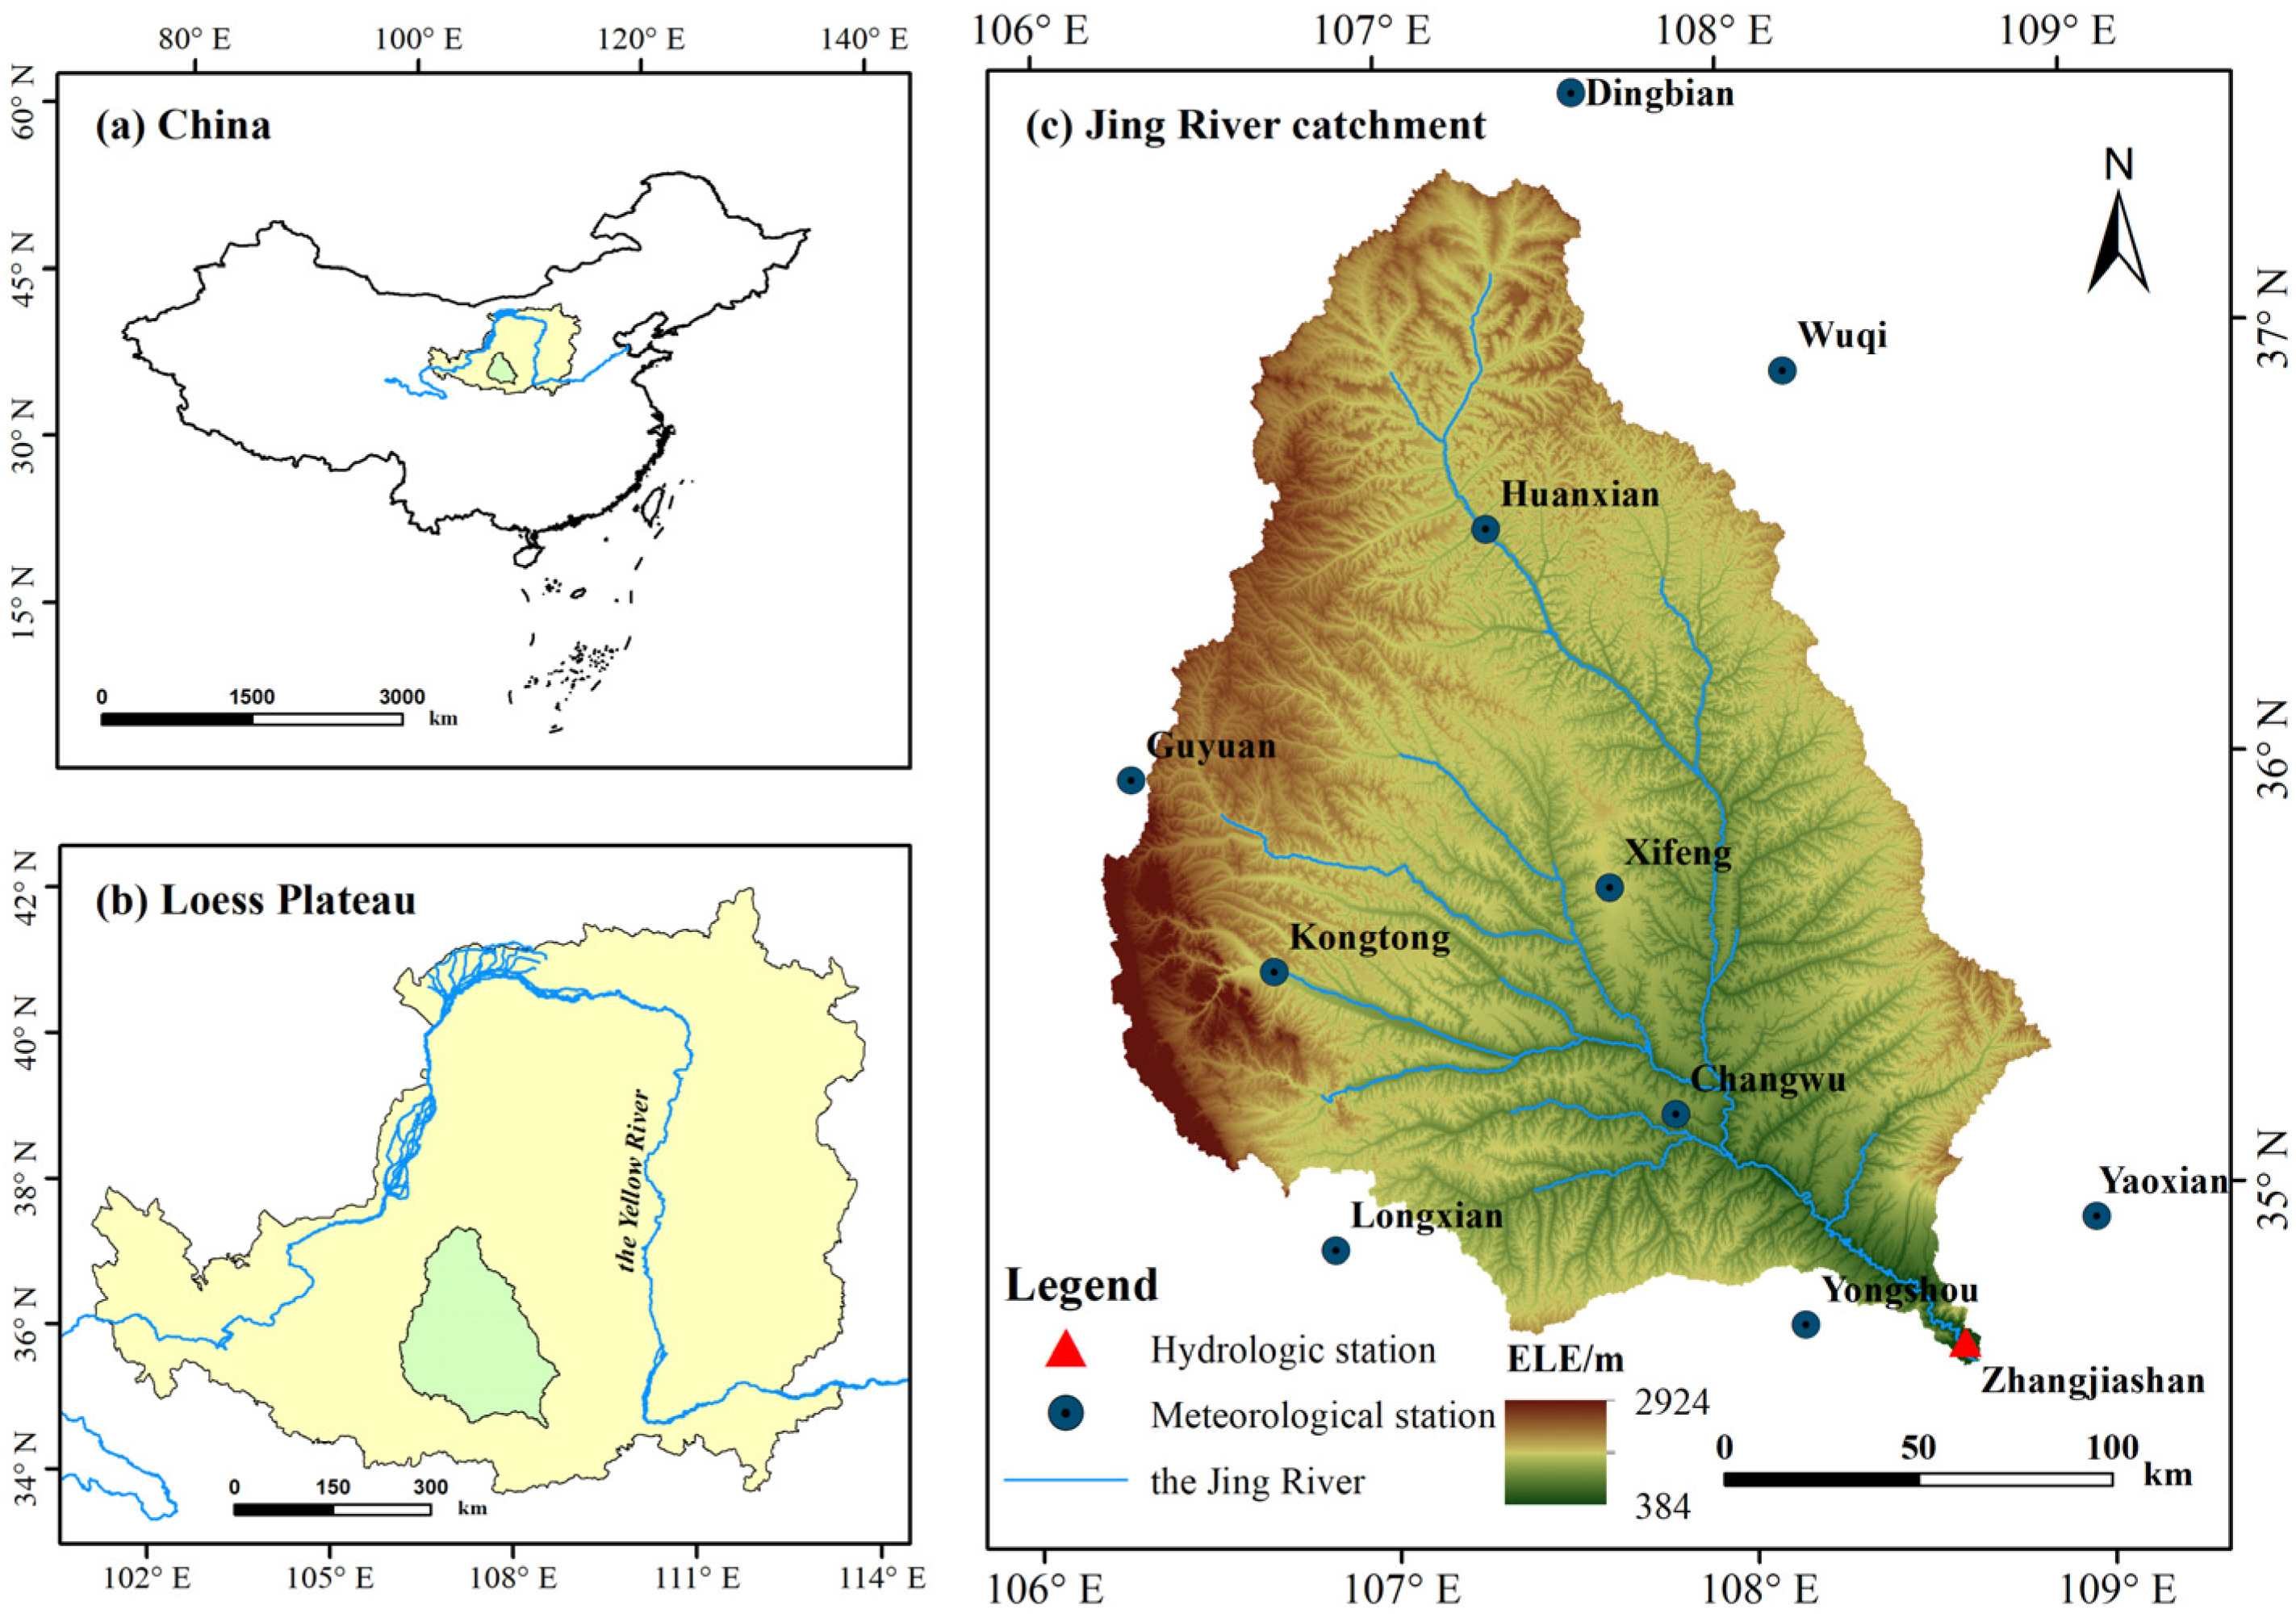
2.1. Study Area
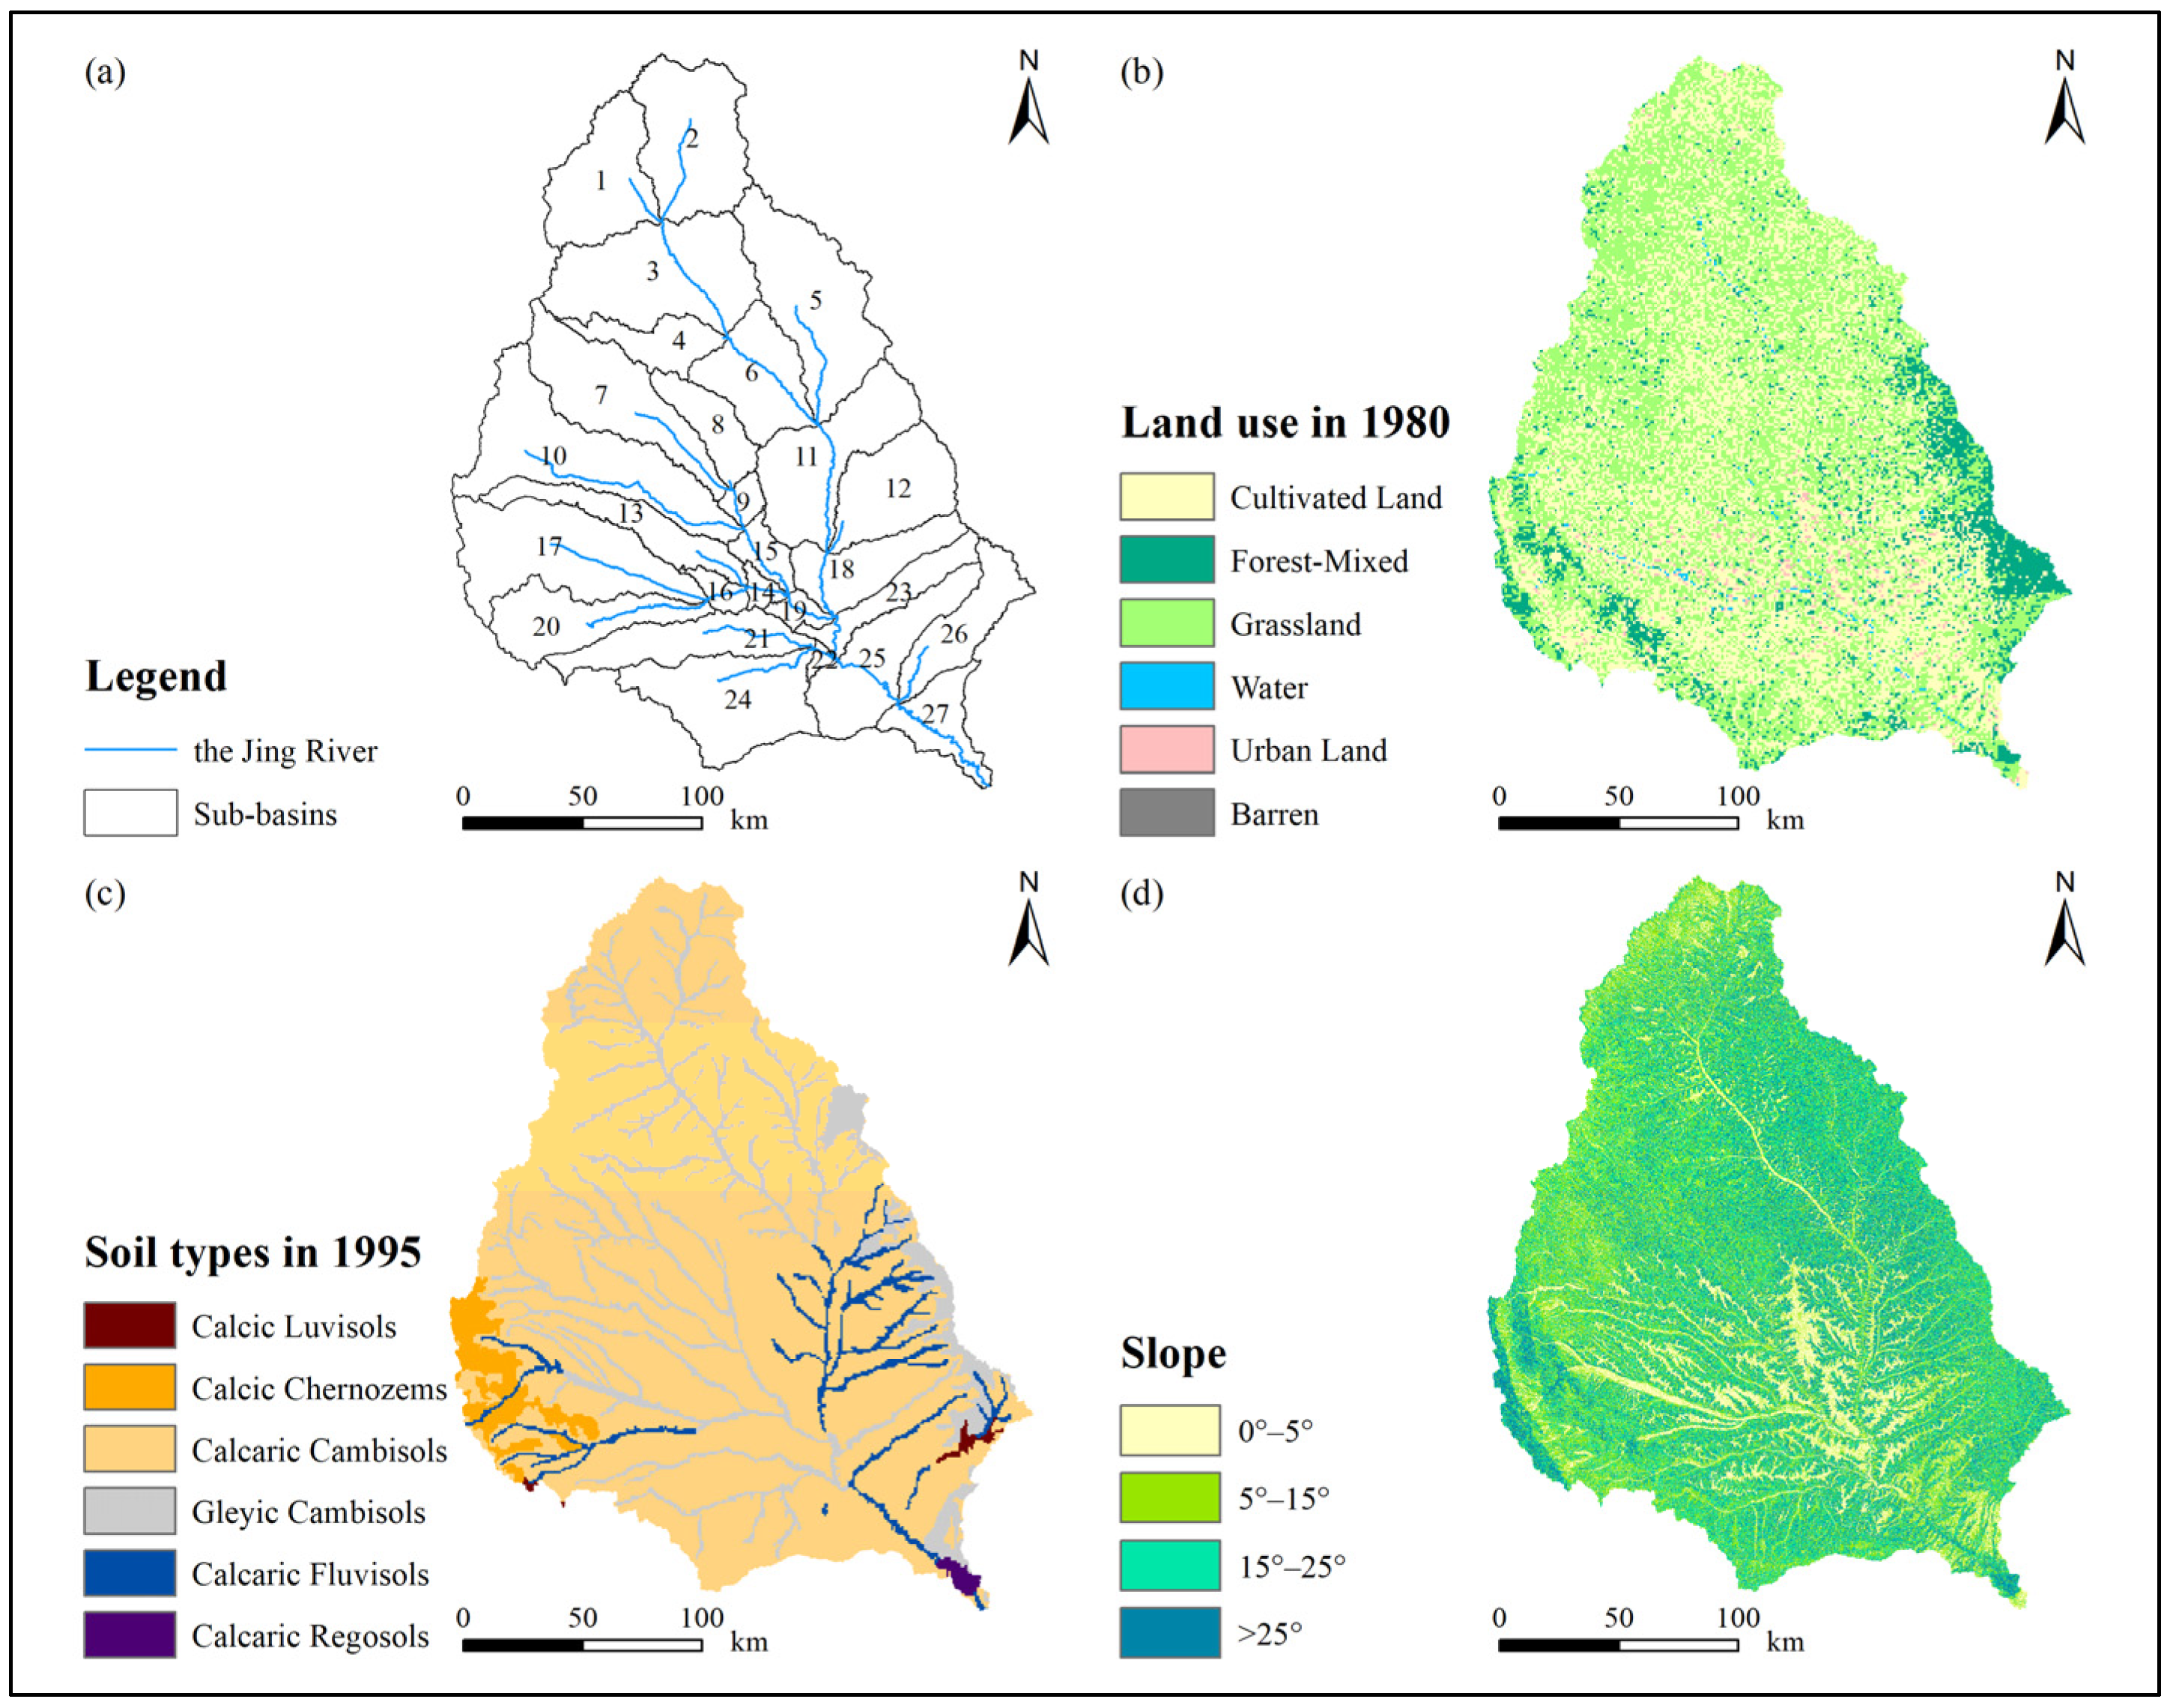
2.2. Data
2.3. Methods
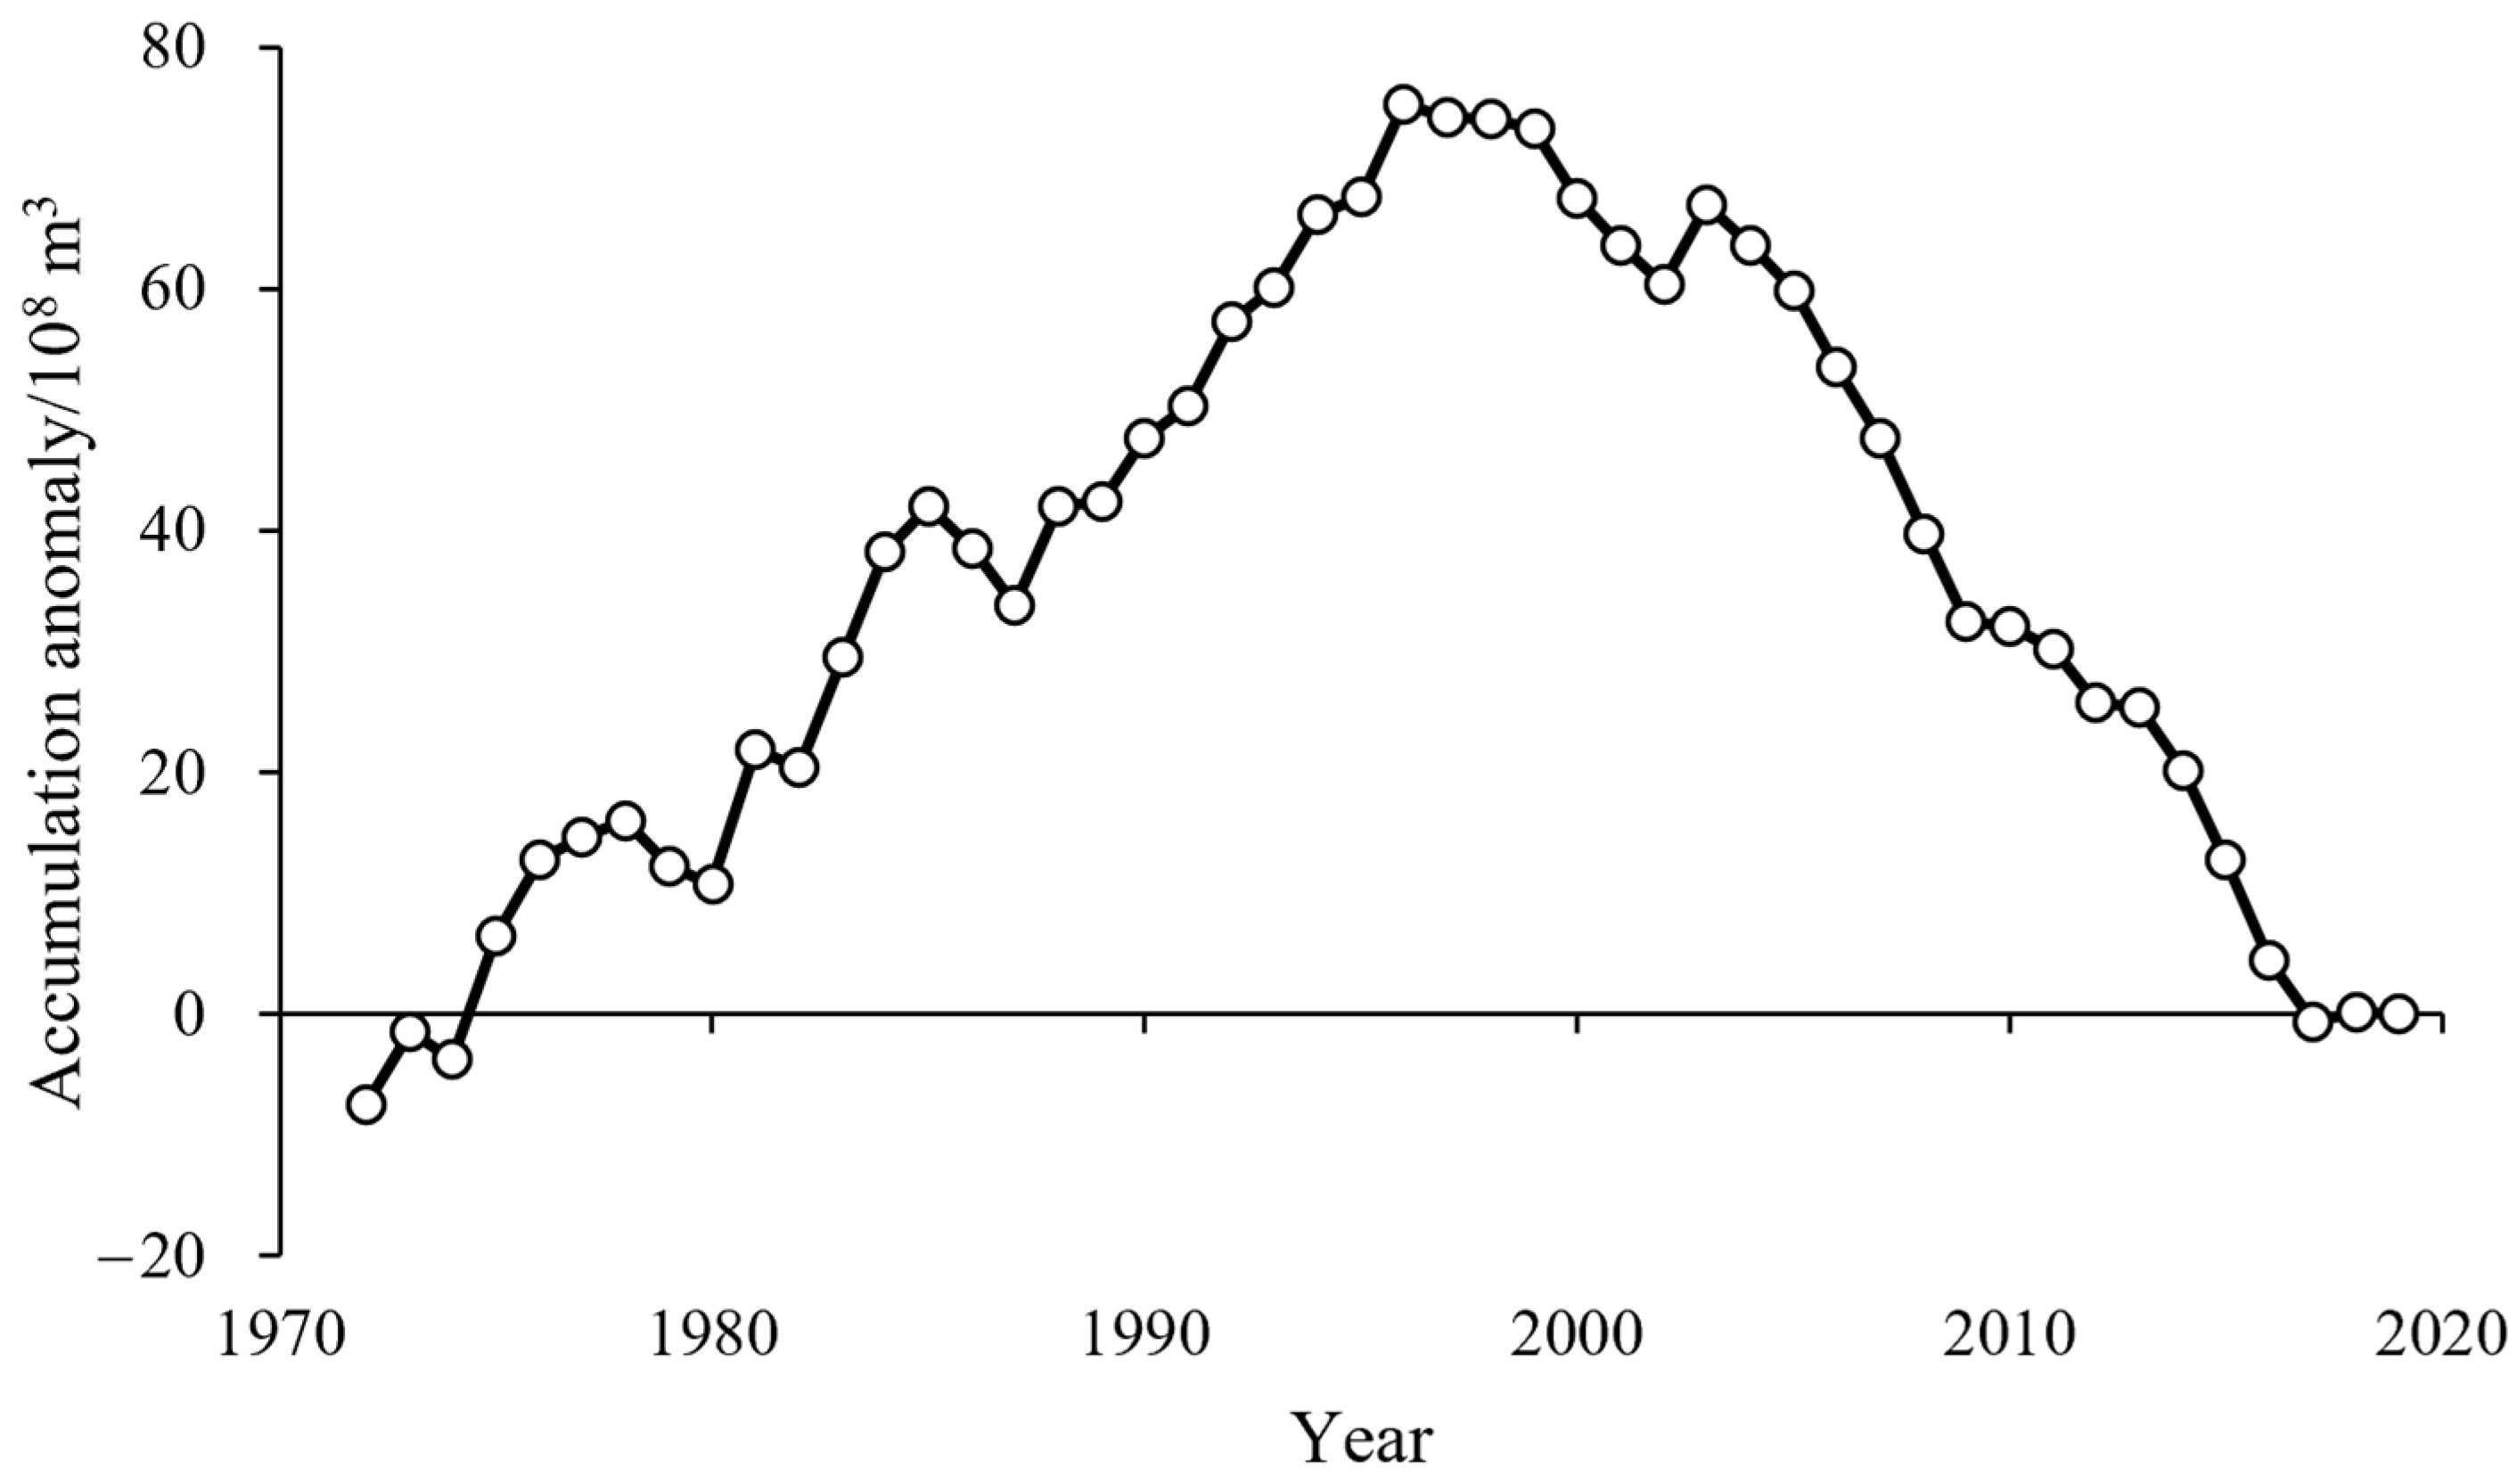
2.3.1. Cumulative Anomaly Method
2.3.2. Runoff Reduction Method
2.3.3. SWAT Model
Application of SWAT Model
Model Applicability Evaluation
Scenario Simulation
3. Results
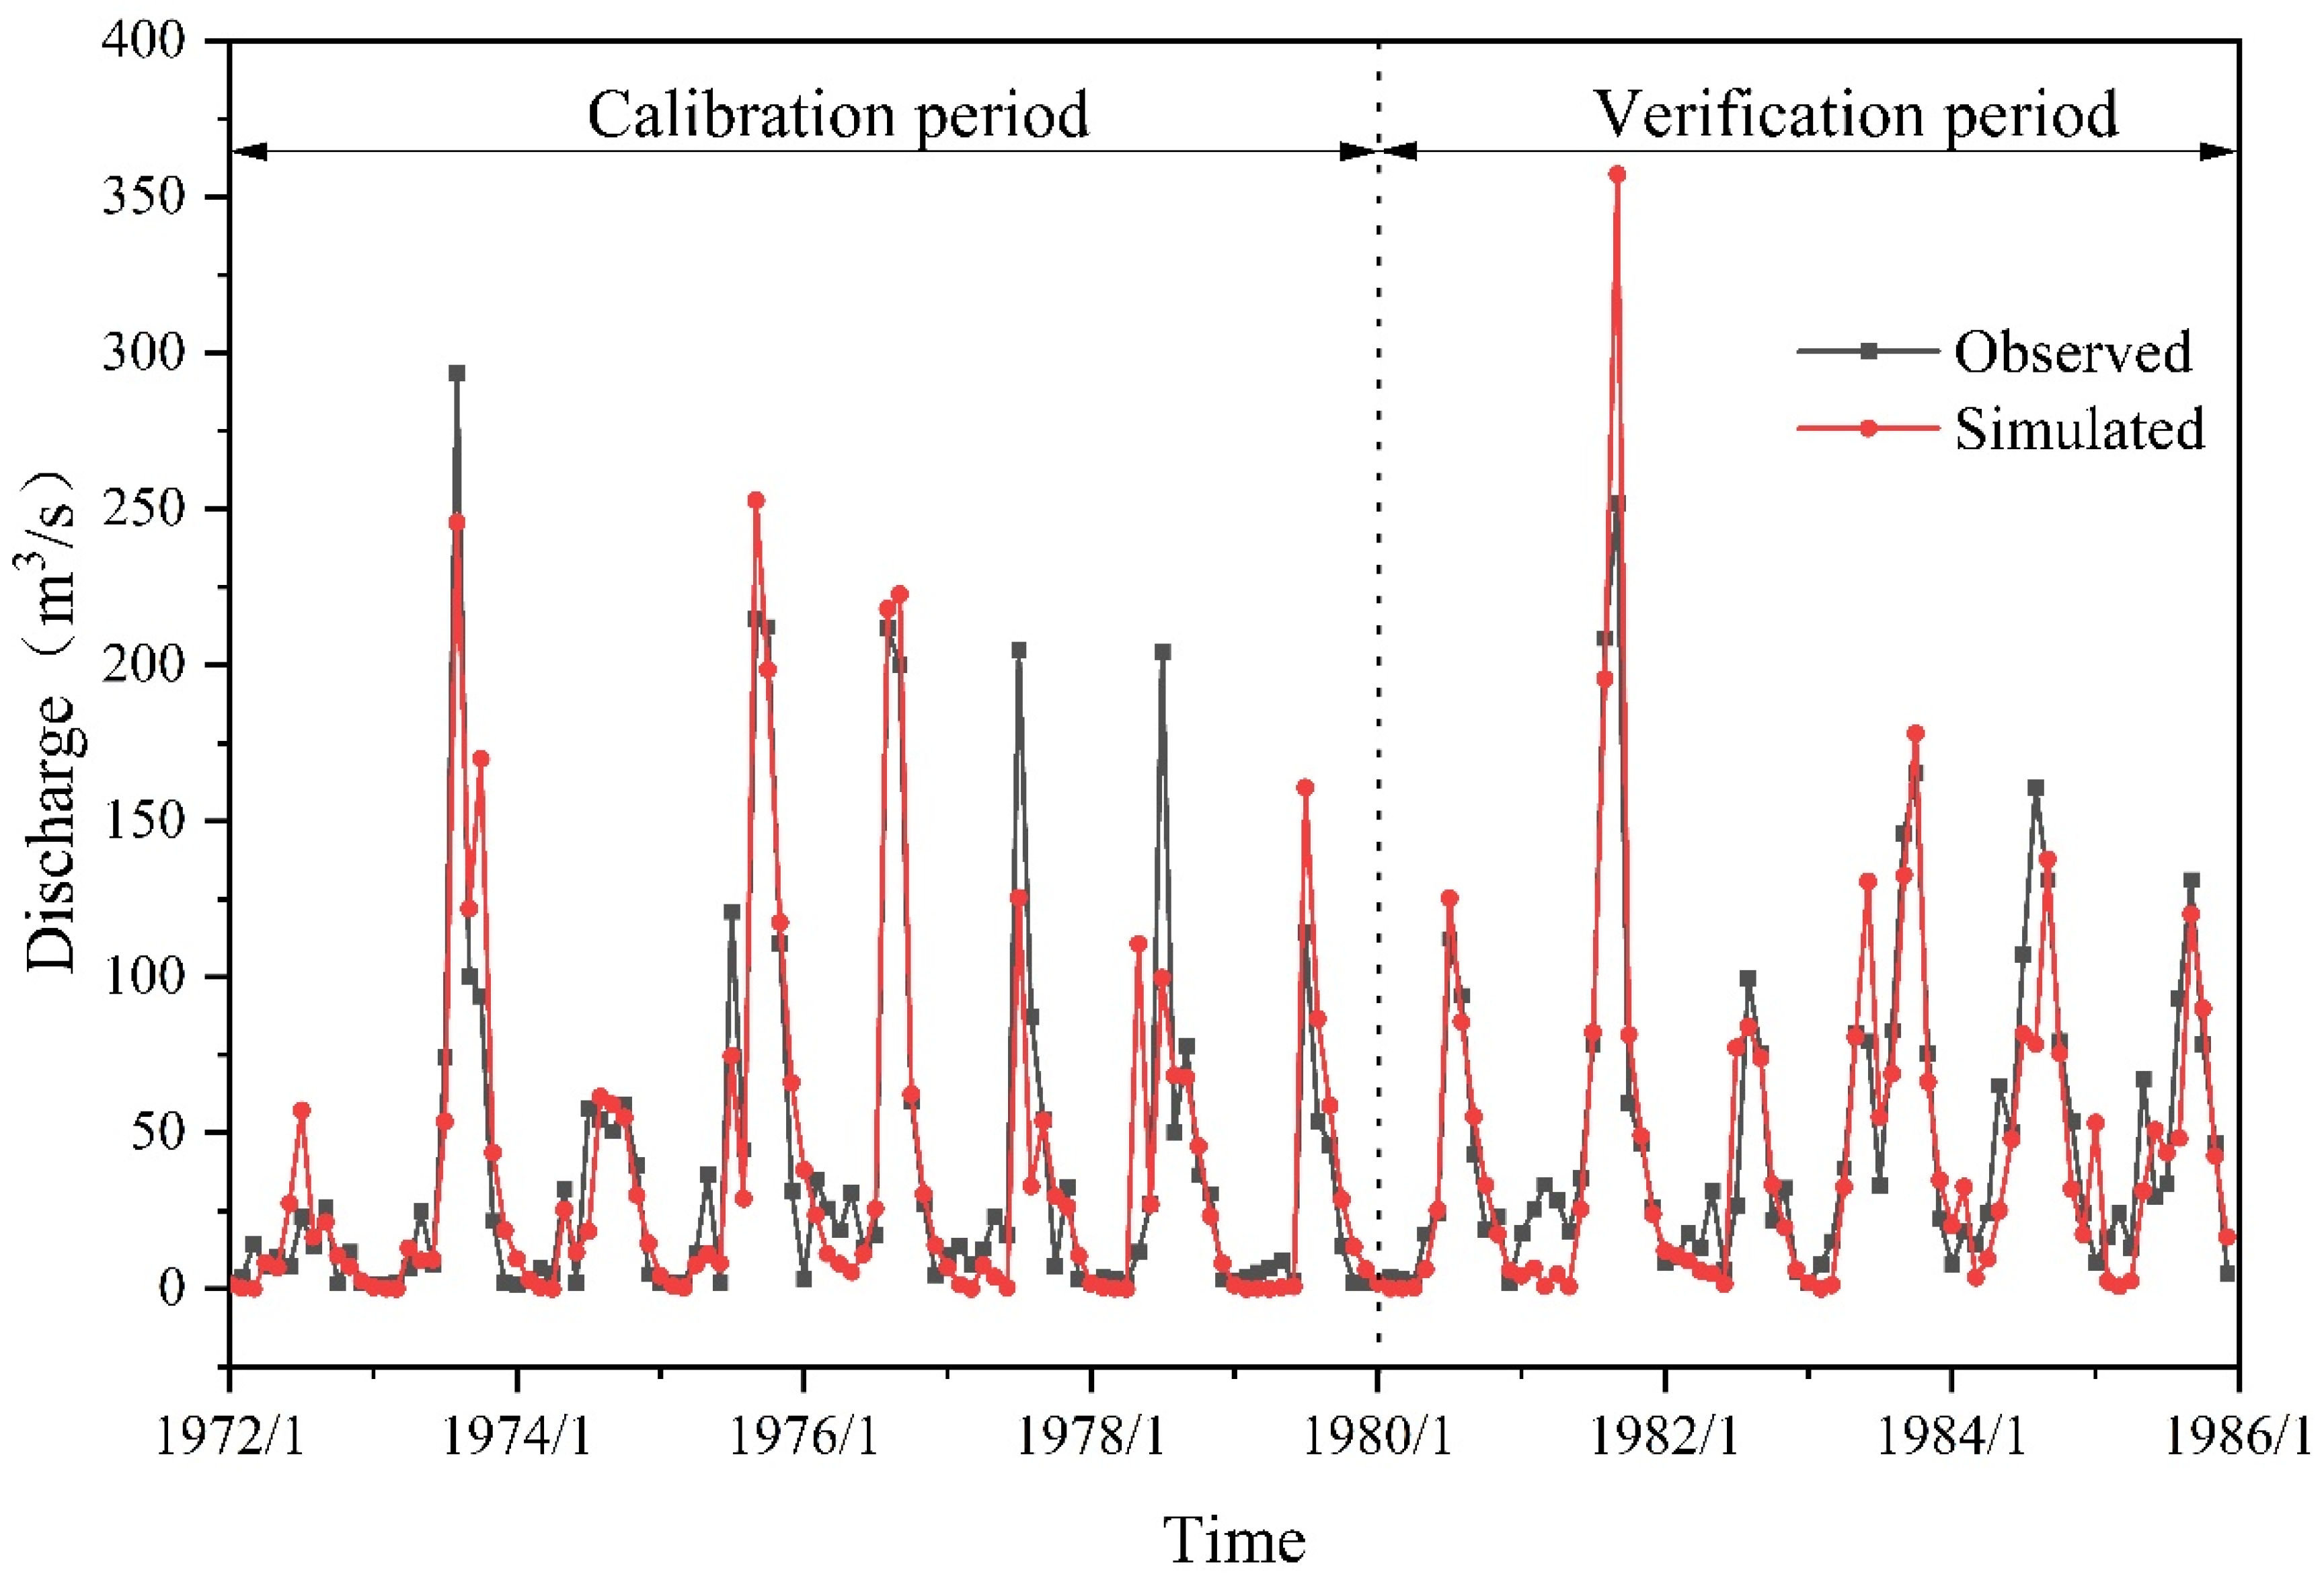
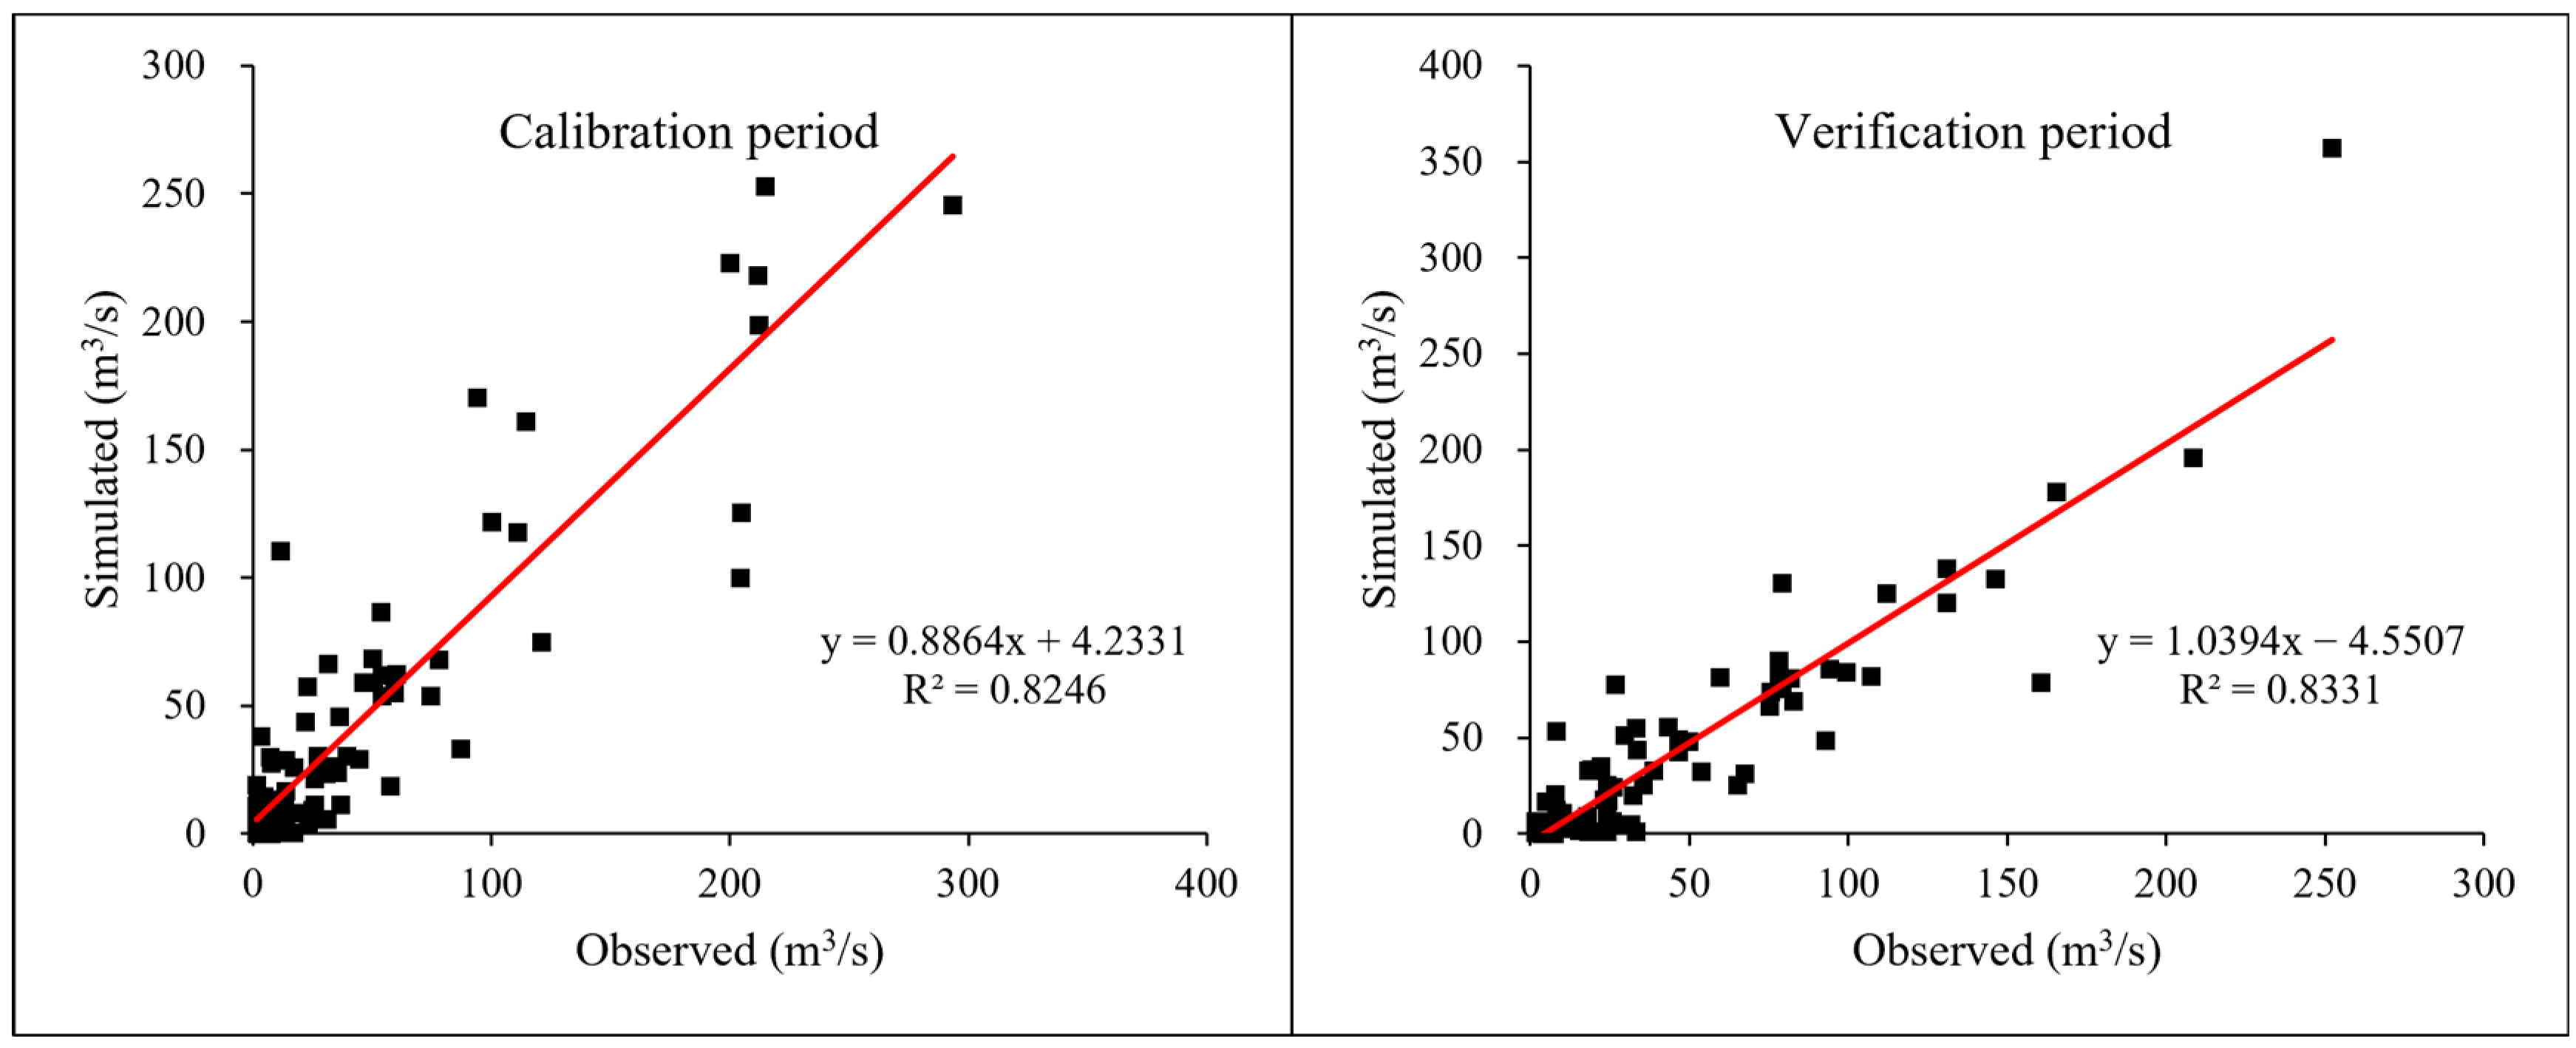
3.1. Model Applicability Evaluation
3.2. Attribution Analysis of Runoff Change in the Jing River Catchment
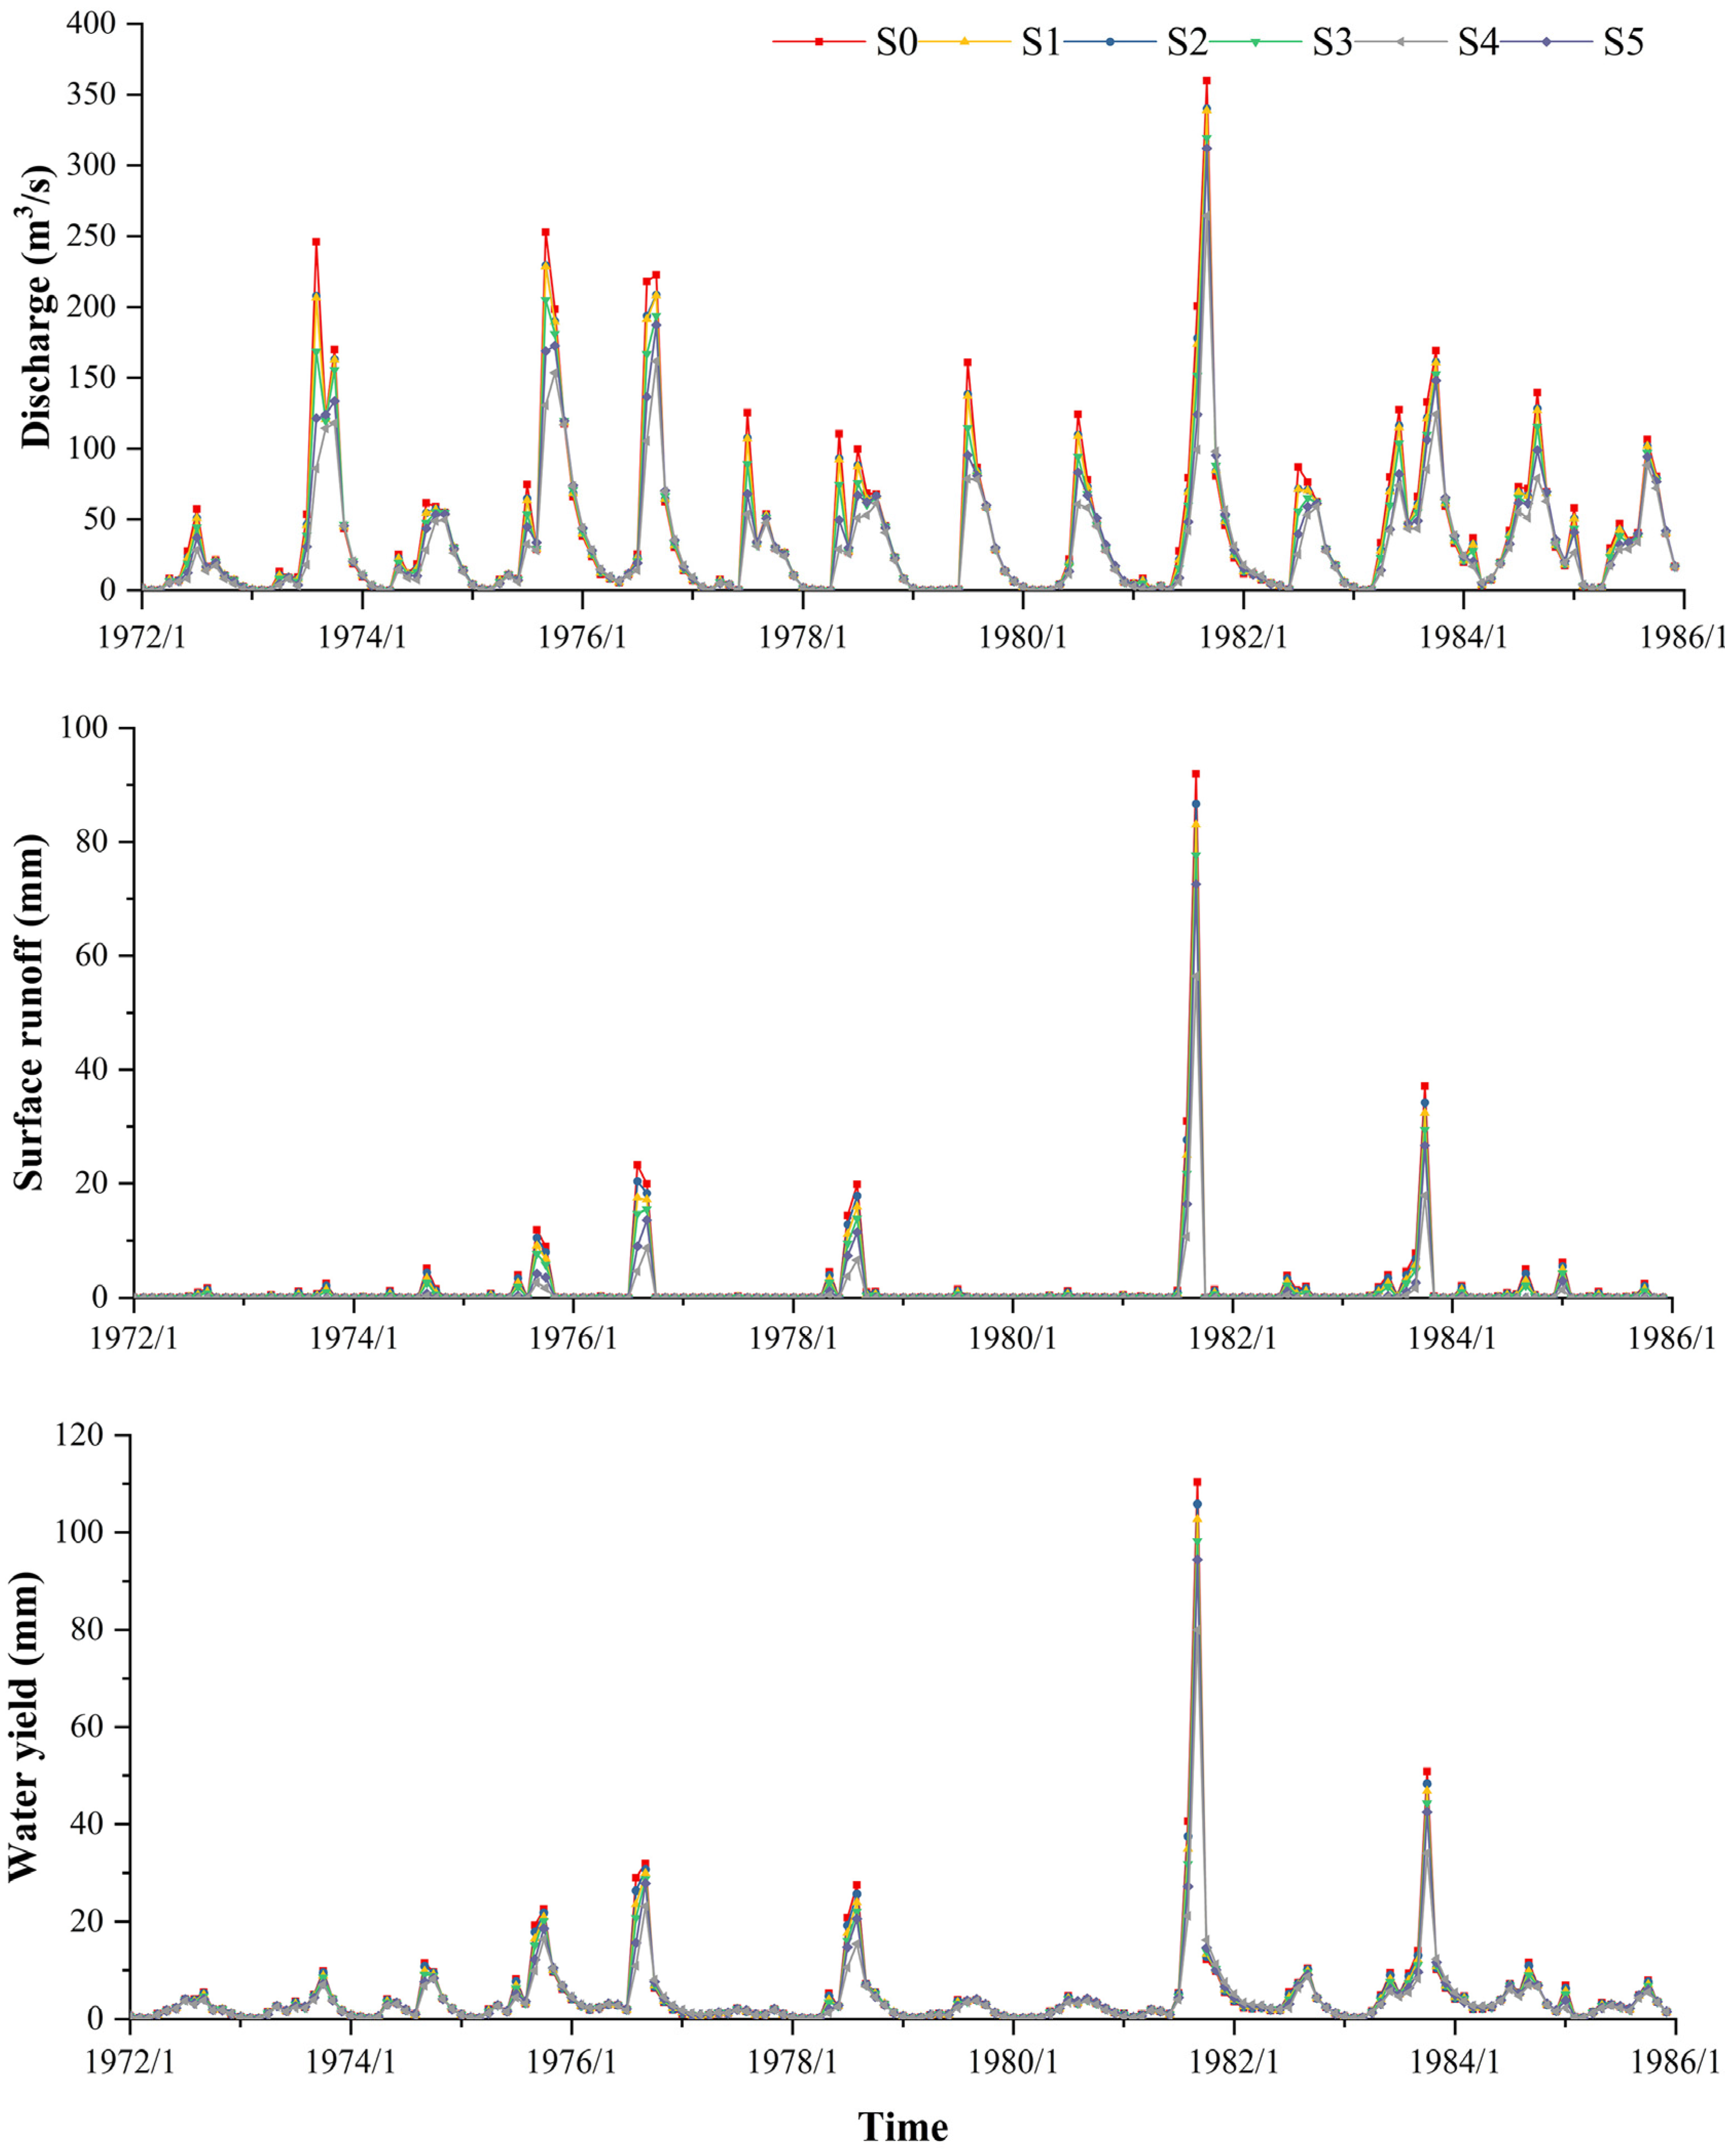
3.3. Runoff Simulation under Different Soil and Water Conservation Measures
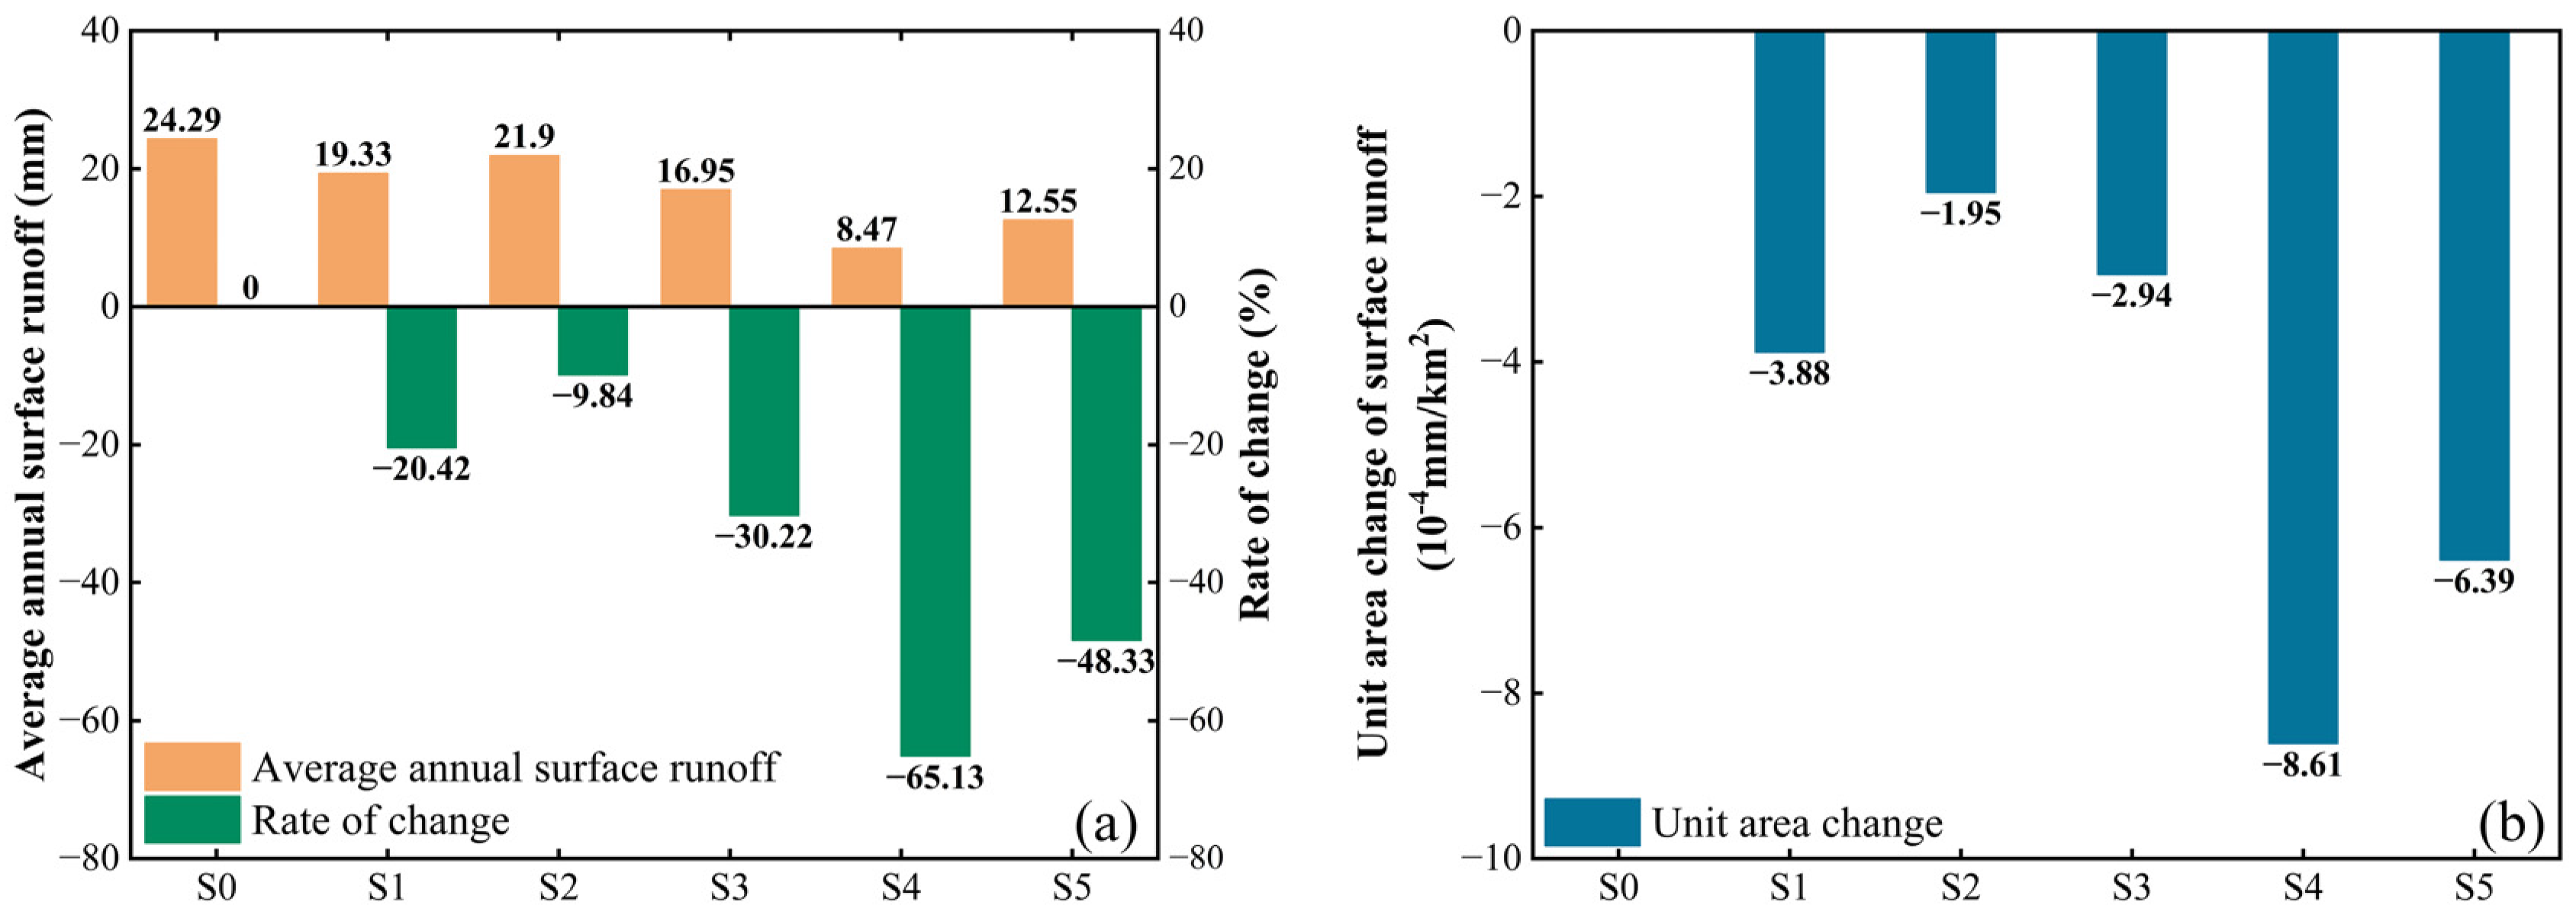
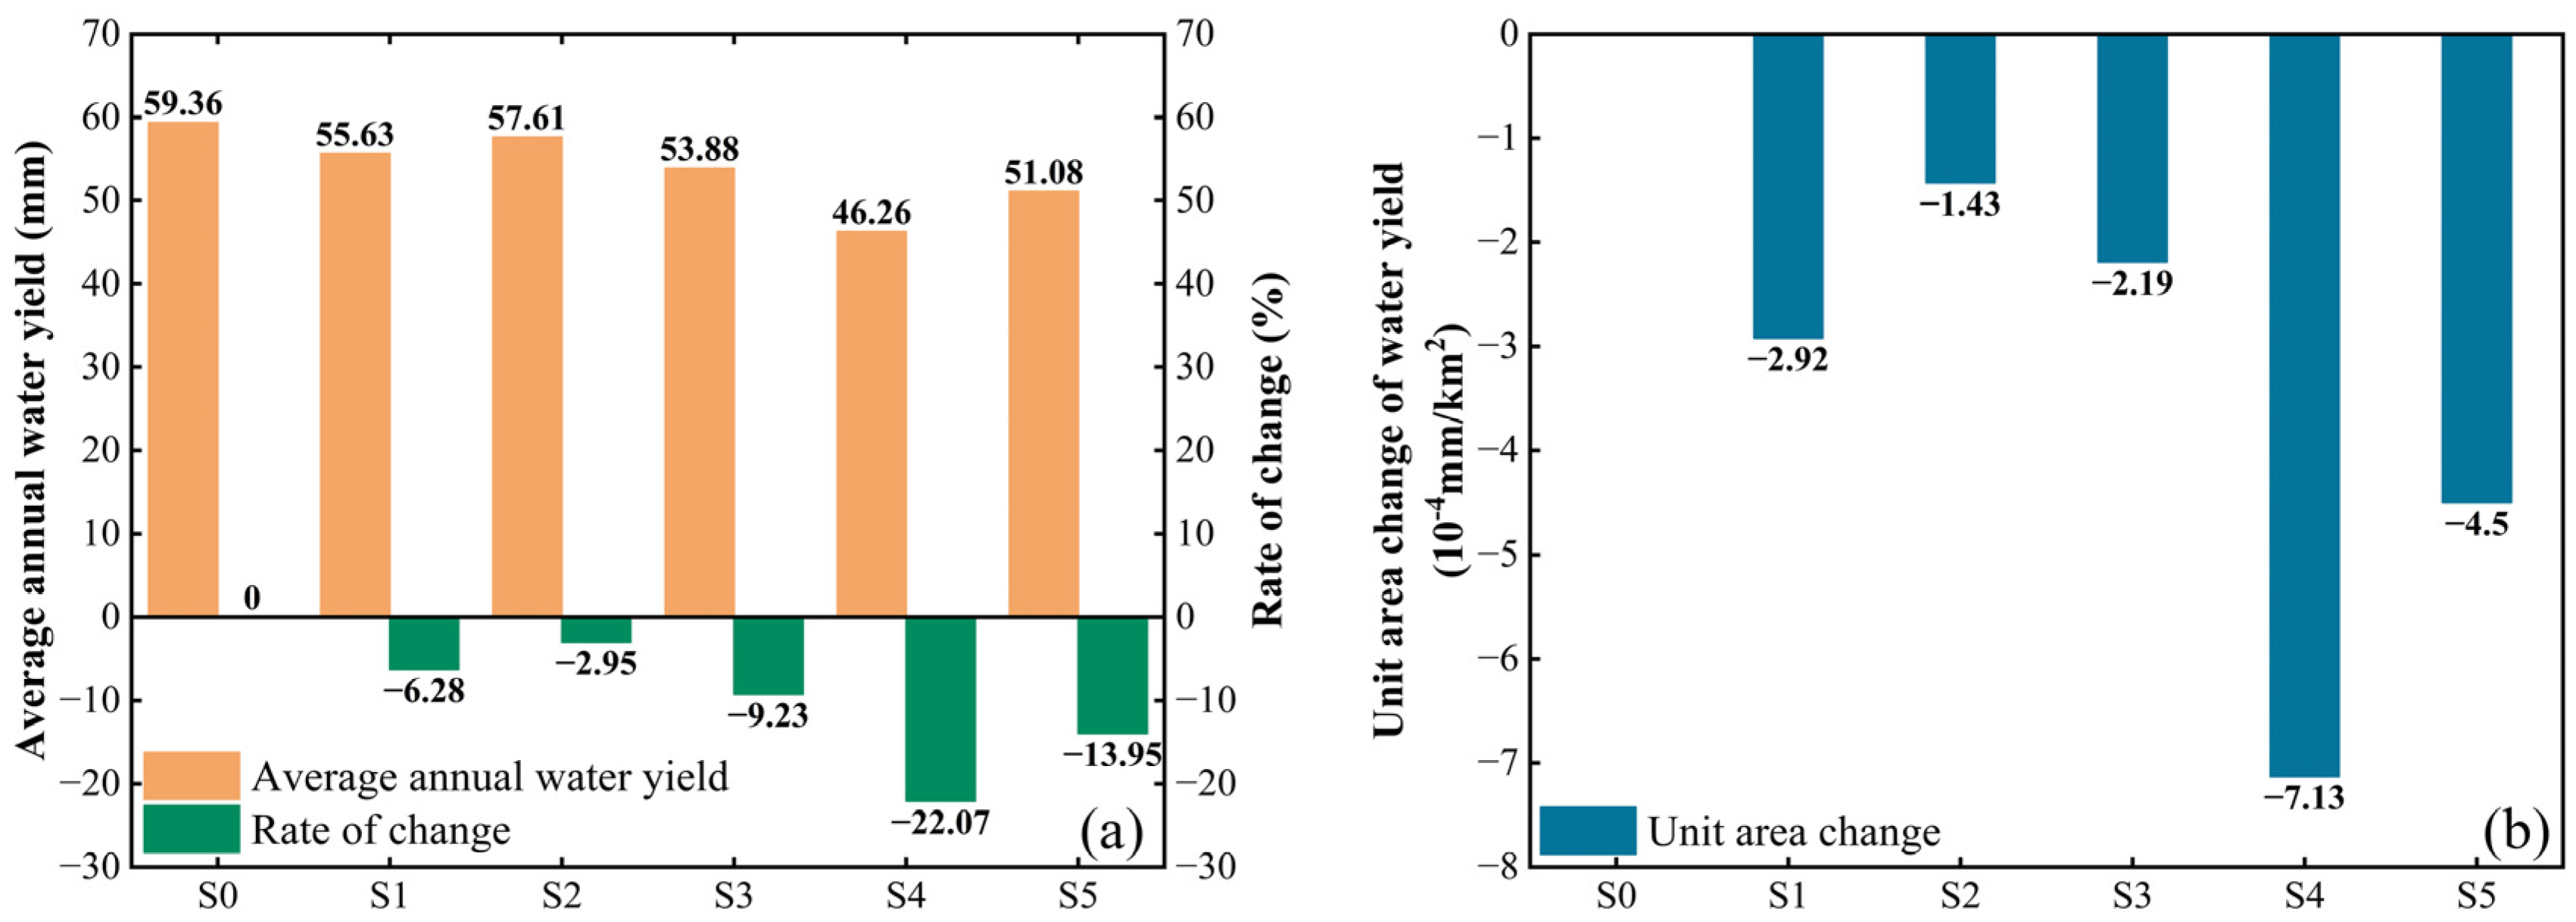
3.4. Influence of Different Soil and Water Conservation Measures on Runoff Change
4. Discussion
4.1. Attribution Analysis
4.2. Analysis of the Influence of Different Soil and Water Conservation Measures on Runoff Change
5. Conclusions
Supplementary Materials
Author Contributions
Funding
Data Availability Statement
Acknowledgments
Conflicts of Interest
References
- Bai, X.; Zhao, W. Impacts of climate change and anthropogenic stressors on runoff variations in major river basins in China since 1950. Sci. Total Environ. 2023, 898, 165349. [Google Scholar] [CrossRef] [PubMed]
- Li, L.; Ni, J.; Chang, F.; Yue, Y.; Frolova, N.; Magritsky, D.; Borthwick, A.G.L.; Ciais, P.; Wang, Y.; Zheng, C.; et al. Global trends in water and sediment fluxes of the world’s large rivers. Sci. Bull. 2020, 65, 62–69. [Google Scholar] [CrossRef]
- Salmoral, G.; Willaarts, B.A.; Troch, P.A.; Garrido, A. Drivers influencing streamflow changes in the Upper Tuna basin, Spain. Sci. Total Environ. 2015, 503, 258–268. [Google Scholar] [CrossRef] [PubMed]
- Wang, S.; Fu, B.; Piao, S.; Lü, Y.; Ciais, P.; Feng, X.; Wang, Y. Reduced sediment transport in the Yellow River due to anthropogenic changes. Nat. Geosci. 2016, 9, 38–41. [Google Scholar] [CrossRef]
- Ge, J.; Pitman, A.J.; Guo, W.; Zan, B.; Fu, C. Impact of revegetation of the Loess Plateau of China on the regional growing season water balance. Hydrol. Earth Syst. Sci. 2020, 24, 515–533. [Google Scholar] [CrossRef]
- Yu, Y.; Yu, P.; Wang, Y.; Wan, Y.; Wang, B.; Han, X.; Tu, X.; Li, J.; Xu, L.; Wang, X.; et al. Natural revegetation has dominated annual runoff reduction since the Grain for Green Program began in the Jing River Basin, Northwest China. J. Hydrol. 2023, 625, 129978. [Google Scholar] [CrossRef]
- Huang, T.; Liu, Y.; Wu, Z.; Xiao, P.; Wang, J.; Sun, P. Quantitative analysis of runoff alteration based on the Budyko model with time-varying underlying surface parameters for the Wuding River Basin, Loess Plateau. Ecol. Indic. 2024, 158, 111377. [Google Scholar] [CrossRef]
- Senbeta, T.B.; Romanowicz, R.J. The role of climate change and human interventions in affecting watershed runoff responses. Hydrol. Process. 2021, 35, e14448. [Google Scholar] [CrossRef]
- Ni, Y.; Lv, X.; Yu, Z.; Wang, J.; Ma, L.; Zhang, Q. Intra-annual variation in the attribution of runoff evolution in the Yellow River source area. Catena 2023, 225, 107032. [Google Scholar] [CrossRef]
- Liu, Y.; Guan, Z.; Tian, J.; Liu, R.; Guan, R. Runoff change and its driving factors in Jinghe River Basin in recent 70 years. Arid Land Geogr. 2022, 45, 17–26. (In Chinese) [Google Scholar]
- Li, Z.; Ning, T.; Li, J.; Yang, D. Spatiotemporal variation in the attribution of streamflow changes in a catchment on China’s Loess Plateau. Catena 2017, 158, 1–8. [Google Scholar] [CrossRef]
- Ji, G.; Yue, S.; Zhang, J.; Huang, J.; Guo, Y.; Chen, W. Assessing the Impact of Vegetation Variation, Climate and Human Factors on the Streamflow Variation of Yarlung Zangbo River with the Corrected Budyko Equation. Forests 2023, 14, 1312. [Google Scholar] [CrossRef]
- Gao, P.; Mu, X.M.; Wang, F.; Li, R. Changes in streamflow and sediment discharge and the response to human activities in the middle reaches of the Yellow River. Hydrol. Earth Syst. Sci. 2011, 15, 1–10. [Google Scholar] [CrossRef]
- Song, J.; Yang, Z.; Xia, J.; Cheng, D. The impact of mining-related human activities on runoff in northern Shaanxi, China. J. Hydrol. 2021, 598, 126235. [Google Scholar] [CrossRef]
- Feng, X.; Fu, B.; Piao, S.; Wang, S.; Ciais, P.; Zeng, Z.; Lü, Y.; Zeng, Y.; Li, Y.; Jiang, X.; et al. Revegetation in China’s Loess Plateau is approaching sustainable water resource limits. Nat. Clim. Change 2016, 6, 1019–1022. [Google Scholar] [CrossRef]
- Nunes, J.P.; Bernard-Jannin, L.; Rodríguez Blanco, M.L.; Santos, J.M.; Coelho, C.d.O.A.; Keizer, J.J. Hydrological and Erosion Processes in Terraced Fields: Observations from a Humid Mediterranean Region in Northern Portugal. Land Degrad. Dev. 2018, 29, 596–606. [Google Scholar] [CrossRef]
- Sultan, D.; Tsunekawa, A.; Haregeweyn, N.; Adgo, E.; Tsubo, M.; Meshesha, D.T.; Masunaga, T.; Aklog, D.; Ebabu, K.J.P.G. Analyzing the runoff response to soil and water conservation measures in a tropical humid Ethiopian highland. Phys. Geogr. 2017, 38, 423–447. [Google Scholar] [CrossRef]
- Berihun, M.L.; Tsunekawa, A.; Haregeweyn, N.; Dile, Y.T.; Tsubo, M.; Fenta, A.A.; Meshesha, D.T.; Ebabu, K.; Sultan, D.; Srinivasan, R. Evaluating runoff and sediment responses to soil and water conservation practices by employing alternative modeling approaches. Sci. Total Environ. 2020, 747, 141118. [Google Scholar] [CrossRef]
- Ran, Q.; Chen, X.; Hong, Y.; Ye, S.; Gao, J. Impacts of terracing on hydrological processes: A case study from the Loess Plateau of China. J. Hydrol. 2020, 588, 125045. [Google Scholar] [CrossRef]
- Li, J.; Gao, J.E.; Zhang, Y.; Shao, H. Effects of Terrace on Runoff and Ecological Base Flow of Jinghe Watershed in Loess Plateau Region. Bull. Soil Water Conserv. 2015, 35, 106–110+116. (In Chinese) [Google Scholar]
- Mesfin, S.; Almeida Oliveira, L.A.; Yazew, E.; Bresci, E.; Castelli, G. Spatial Variability of Soil Moisture in Newly Implemented Agricultural Bench Terraces in the Ethiopian Plateau. Water 2019, 11, 2134. [Google Scholar] [CrossRef]
- Wang, N.; Bi, H.; Peng, R.; Zhao, D.; Liu, Z. Disparities in soil and water conservation functions among different forest types and implications for afforestation on the Loess Plateau. Ecol. Indic. 2023, 155, 110935. [Google Scholar] [CrossRef]
- Peng, H.; Jia, Y.; Niu, C.; Gong, J.; Hao, C.; Gou, S. Eco-hydrological simulation of soil and water conservation in the Jinghe River Basin in the Loess Plateau, China. J. Hydro-Environ. Res. 2015, 9, 452–464. [Google Scholar] [CrossRef]
- Hu, P.; Cai, T.; Sui, F.; Duan, L.; Man, X.; Cui, X. Response of Runoff to Extreme Land Use Change in the Permafrost Region of Northeastern China. Forests 2021, 12, 1021. [Google Scholar] [CrossRef]
- Freeze, R.A.; Harlan, R.L. Blueprint for a physically-based, digitally-simulated hydrologic response model. J. Hydrol. 1969, 9, 237–258. [Google Scholar] [CrossRef]
- Jiao, Y.; Lei, H.; Yang, D.; Huang, M.; Liu, D.; Yuan, X. Impact of vegetation dynamics on hydrological processes in a semi-arid basin by using a land surface-hydrology coupled model. J. Hydrol. 2017, 551, 116–131. [Google Scholar] [CrossRef]
- Yang, D.; Herath, S.; Musiake, K. Comparison of different distributed hydrological models for characterization of catchment spatial variability. Hydrol. Process. 2000, 14, 403–416. [Google Scholar] [CrossRef]
- Chen, Y.; Xu, C.-Y.; Chen, X.; Xu, Y.; Yin, Y.; Gao, L.; Liu, M. Uncertainty in simulation of land-use change impacts on catchment runoff with multi-timescales based on the comparison of the HSPF and SWAT models. J. Hydrol. 2019, 573, 486–500. [Google Scholar] [CrossRef]
- Liu, Z.; Rong, L.; Wei, W. Impacts of land use/cover change on water balance by using the SWAT model in a typical loess hilly watershed of China. Geogr. Sustain. 2023, 4, 19–28. [Google Scholar] [CrossRef]
- Boufala, M.H.; El Hmaidi, A.; Essahlaoui, A.; Chadli, K.; El Ouali, A.; Lahjouj, A. Assessment of the best management practices under a semi-arid basin using SWAT model (case of M’dez watershed, Morocco). Model. Earth Syst. Environ. 2021, 8, 713–731. [Google Scholar] [CrossRef]
- Arabi, M.; Frankenberger, J.R.; Engel, B.A.; Arnold, J.G. Representation of agricultural conservation practices with SWAT. Hydrol. Process. 2008, 22, 3042–3055. [Google Scholar] [CrossRef]
- Ben Khelifa, W.; Strohmeier, S.; Benabdallah, S.; Habaieb, H. Evaluation of bench terracing model parameters transferability for runoff and sediment yield on catchment modelling. J. Afr. Earth Sci. 2021, 178, 104177. [Google Scholar] [CrossRef]
- Adi, K.A.; Serur, A.B.; Meskele, D.Y. Sediment yield responses to land use land cover change and developing best management practices in the upper Gidabo dam watershed. Sustain. Water Resour. Manag. 2023, 9, 68. [Google Scholar] [CrossRef]
- Yang, K.; Lu, C. Evaluation of land-use change effects on runoff and soil erosion of a hilly basin—The Yanhe River in the Chinese Loess Plateau. Land Degrad. Dev. 2018, 29, 1211–1221. [Google Scholar] [CrossRef]
- Hu, J.; Wu, Y.; Wang, L.; Sun, P.; Zhao, F.; Jin, Z.; Wang, Y.; Qiu, L.; Lian, Y. Impacts of land-use conversions on the water cycle in a typical watershed in the southern Chinese Loess Plateau. J. Hydrol. 2021, 593, 125741. [Google Scholar] [CrossRef]
- Bai, J.; Zhou, Z.; Li, J.; Liu, T.; Zhu, Q.; Zheng, T. Predicting soil conservation service in the Jinghe River Basin under climate change. J. Hydrol. 2022, 615, 128646. [Google Scholar] [CrossRef]
- Huang, S.; Li, P.; Huang, Q.; Leng, G. Copula-based identification of the non-stationarity of the relation between runoff and sediment load. Int. J. Sediment Res. 2017, 32, 221–230. [Google Scholar] [CrossRef]
- Huang, C.; Yang, Q.; Huang, W. Analysis of the Spatial and Temporal Changes of NDVI and Its Driving Factors in the Wei and Jing River Basins. Int. J. Environ. Res. Public Health 2021, 18, 11863. [Google Scholar] [CrossRef] [PubMed]
- Zhang, X.; Yu, X.; Wu, S.; Zhang, M.; Li, J. Response of land use/land cover change to hydrological dynamics in typical wastershed in Loess gullied-hilly region of China. Acta Ecol. Sin. 2007, 27, 414–423. (In Chinese) [Google Scholar] [CrossRef]
- Zhao, G.; Mu, X.; Wen, Z.; Wang, F.; Gao, P. Soil erosion, conservation, and eco-environment changes in the loess plateau of China. Land Degrad. Dev. 2013, 24, 499–510. [Google Scholar] [CrossRef]
- Xu, C.; Jiang, Y.; Su, Z.; Liu, Y.; Lyu, J. Assessing the impacts of Grain-for-Green Programme on ecosystem services in Jinghe River basin, China. Ecol. Indic. 2022, 137, 108757. [Google Scholar] [CrossRef]
- Luo, Q.; Zhen, L.; Hu, Y. The Effects of Restoration Practices on a Small Watershed in China’s Loess Plateau: A Case Study of the Qiaozigou Watershed. Sustainability 2020, 12, 8376. [Google Scholar] [CrossRef]
- Shi, P.; Zhang, Y.; Ren, Z.; Yu, Y.; Li, P.; Gong, J. Land-use changes and check dams reducing runoff and sediment yield on the Loess Plateau of China. Sci. Total Environ. 2019, 664, 984–994. [Google Scholar] [CrossRef] [PubMed]
- Zhao, G.; Mu, X.; Jiao, J.; Gao, P.; Sun, W.; Li, E.; Wei, Y.; Huang, J. Assessing response of sediment load variation to climate change and human activities with six different approaches. Sci. Total Environ. 2018, 639, 773–784. [Google Scholar] [CrossRef] [PubMed]
- Weber, K.; Stewart, M. A critical analysis of the cumulative rainfall departure concept. Ground Water. 2004, 42, 935–938. [Google Scholar] [PubMed]
- Dosdogru, F.; Kalin, L.; Wang, R.; Yen, H. Potential impacts of land use/cover and climate changes on ecologically relevant flows. J. Hydrol. 2020, 584, 124654. [Google Scholar] [CrossRef]
- Lin, B.; Chen, X.; Yao, H.; Chen, Y.; Liu, M.; Gao, L.; James, A. Analyses of landuse change impacts on catchment runoff using different time indicators based on SWAT model. Ecol. Indic. 2015, 58, 55–63. [Google Scholar] [CrossRef]
- Moriasi, D.N.; Arnold, J.G.; Van Liew, M.W.; Bingner, R.L.; Harmel, R.D.; Veith, T.L. Model Evaluation Guidelines for Systematic Quantification of Accuracy in Watershed Simulations. Trans. ASABE 2007, 50, 885–900. [Google Scholar] [CrossRef]
- Neitsch, S.L.; Arnold, J.G.; Kiniry, J.R.; Williams, J.R. Soil and Water Assessment Tool Theoretical Documentation Version 2009; Texas Water Resources Institute: College Station, TX, USA, 2011; pp. 98–120. [Google Scholar]
- Kaini, P.; Artita, K.; Nicklow, J.W. Optimizing Structural Best Management Practices Using SWAT and Genetic Algorithm to Improve Water Quality Goals. Water Resour. Manag. 2012, 26, 1827–1845. [Google Scholar] [CrossRef]
- Arnold, J.G.; Srinivasan, R.; Muttiah, R.S.; Williams, J.R. Large area hydrologic modeling and assessment part I: Model development1. J. Am. Water Resour. Assoc. 1998, 34, 73–89. [Google Scholar] [CrossRef]
- Liu, Y.R.; Li, Y.P.; Huang, G.H.; Zhang, J.L.; Fan, Y.R. A Bayesian-based multilevel factorial analysis method for analyzing parameter uncertainty of hydrological model. J. Hydrol. 2017, 553, 750–762. [Google Scholar] [CrossRef]
- Gusarov, A.V.; Sharifullin, A.G.; Komissarov, M.A. Contemporary Long-Term Trends in Water Discharge, Suspended Sediment Load, and Erosion Intensity in River Basins of the North Caucasus Region, SW Russia. Hydrology 2021, 8, 28. [Google Scholar] [CrossRef]
- Arantes, L.T.; Carvalho, A.C.P.; Carvalho, A.P.P.; Lorandi, R.; Moschini, L.E.; Di Lollo, J.A. Surface runoff associated with climate change and land use and land cover in southeast region of Brazil. Environ. Chall. 2021, 3, 100054. [Google Scholar] [CrossRef]
- Zhang, X.; Dong, Q.; Cheng, L.; Xia, J. A Budyko-based framework for quantifying the impacts of aridity index and other factors on annual runoff. J. Hydrol. 2019, 579, 124224. [Google Scholar] [CrossRef]
- Gao, X.; Yan, C.; Wang, Y.; Zhao, X.; Zhao, Y.; Sun, M.; Peng, S. Attribution analysis of climatic and multiple anthropogenic causes of runoff change in the Loess Plateau-A case-study of the Jing River Basin. Land Degrad. Dev. 2020, 31, 1622–1640. [Google Scholar] [CrossRef]
- He, Y.; Wang, F.; Mu, X.; Yan, H.; Zhao, G. An Assessment of Human versus Climatic Impacts on Jing River Basin, Loess Plateau, China. Adv. Meteorol. 2015, 2015, 478739. [Google Scholar] [CrossRef]
- Jin, T.; Zhang, X.; Xie, J.; Liang, J.; Wang, T. Study on hydrological response of runoff to land use change in the Jing River Basin, China. Environ. Sci. Pollut. Res. 2023, 30, 101075–101090. [Google Scholar] [CrossRef] [PubMed]
- Dong, W.; Cui, B.; Liu, Z.; Zhang, K. Relative effects of human activities and climate change on the river runoff in an arid basin in northwest China. Hydrol. Process. 2014, 28, 4854–4864. [Google Scholar] [CrossRef]
- Liang, Y.; Gao, G.; Liu, J.; Dunkerley, D.; Fu, B. Runoff and soil loss responses of restoration vegetation under natural rainfall patterns in the Loess Plateau of China: The role of rainfall intensity fluctuation. Catena 2023, 225, 107013. [Google Scholar] [CrossRef]
- Zhang, X.; Yu, G.Q.; Li, Z.B.; Li, P. Experimental Study on Slope Runoff, Erosion and Sediment under Different Vegetation Types. Water Resour. Manag. 2014, 28, 2415–2433. [Google Scholar] [CrossRef]
- Zhang, Q.; Lv, X.; Yu, X.; Ni, Y.; Ma, L.; Liu, Z. Species and spatial differences in vegetation rainfall interception capacity: A synthesis and meta-analysis in China. Catena 2022, 213, 106223. [Google Scholar] [CrossRef]
- Xie, C.; Cai, S.; Yu, B.; Yan, L.; Liang, A.; Che, S. The effects of tree root density on water infiltration in urban soil based on a Ground Penetrating Radar in Shanghai, China. Urban For. Urban Green. 2020, 50, 126648. [Google Scholar] [CrossRef]
- Lü, Y.; Fu, B.; Feng, X.; Zeng, Y.; Liu, Y.; Chang, R.; Sun, G.; Wu, B. A Policy-Driven Large Scale Ecological Restoration: Quantifying Ecosystem Services Changes in the Loess Plateau of China. PLoS ONE 2012, 7, e31782. [Google Scholar] [CrossRef] [PubMed]
- Liu, W.; Wu, J.; Xu, F.; Mu, D.; Zhang, P. Modeling the effects of land use/land cover changes on river runoff using SWAT models: A case study of the Danjiang River source area, China. Environ. Res. 2024, 242, 117810. [Google Scholar] [CrossRef] [PubMed]
- Zhidkin, A.; Fomicheva, D.; Ivanova, N.; Dostál, T.; Yurova, A.; Komissarov, M.; Krása, J. A detailed reconstruction of changes in the factors and parameters of soil erosion over the past 250 years in the forest zone of European Russia (Moscow region). Int. Soil Water Conserv. Res. 2022, 10, 149–160. [Google Scholar] [CrossRef]
- Hammad, A.H.A.; Børresen, T.; Haugen, L.E. Effects of rain characteristics and terracing on runoff and erosion under the Mediterranean. Soil Tillage Res. 2006, 87, 39–47. [Google Scholar] [CrossRef]
- Jia, Z.; Weng, B.; Yan, D.; Peng, H.; Dong, Z. The effects of different factors on soil water infiltration properties in High Mountain Asia: A meta-analysis. Catena 2024, 234, 107583. [Google Scholar] [CrossRef]
- Pascolini-Campbell, M.; Reager, J.T.; Chandanpurkar, H.A.; Rodell, M. A 10 per cent increase in global land evapotranspiration from 2003 to 2019 (Retracted Article). Nature 2021, 593, 543–547. [Google Scholar] [CrossRef]
- Cao, X.; Zheng, Y.; Lei, Q.; Li, W.; Song, S.; Wang, C.; Liu, Y.; Khan, K. Increasing actual evapotranspiration on the Loess Plateau of China: An insight from anthropologic activities and climate change. Ecol. Indic. 2023, 157, 111235. [Google Scholar] [CrossRef]


| Model Evaluation Indexes | R2 | NSE | PBIAS/% |
|---|---|---|---|
| very good | 0.8 < R2 ≤ 1 | 0.75 < NSE ≤ 1 | |PBIAS| ≤ 10 |
| good | 0.7 < R2 ≤ 0.8 | 0.65 < NSE ≤ 0.75 | 10 < |PBIAS| ≤ 15 |
| normal | 0.5 < R2 ≤ 0.7 | 0.5 < NSE ≤ 0.65 | 15 < |PBIAS| ≤ 25 |
| unsatisfactory | R2 ≤ 0.5 | NSE ≤ 0.5 | |PBIAS| > 25 |
| Scenario | Measures | Description |
|---|---|---|
| S0 | No measures | |
| S1 | Building terraces on a 5–15° slope | Reducing the CN2 value by 6 from the existing value on the slope of 5–15° |
| S2 | Building terraces on a 15–25° slope | Reducing the CN2 value by 6 from the existing value on the slope of 15–25° |
| S3 | Building terraces on a 5–25° slope | Reducing the CN2 value by 6 from the existing value on the slope of 5–25° |
| S4 | Changing cultivated land to forest land | Changing all cultivated land in 1980 to forest land by reclassification |
| S5 | Changing cultivated land to grassland | Changing all cultivated land in 1980 to grassland by reclassification |
| Parameter Code | Description | Initial Range | Optimal Value |
|---|---|---|---|
| r__SOL_AWC().sol | Available water capacity of the soil layer | −0.5~0.5 | 0.4889 |
| v__SLSUBBSN.hru | Average slope length | 10~150 | 25.8329 |
| r__CN2.mgt | Initial SCS runoff curve number for moisture condition II | −0.5~0.5 | 0.1461 |
| v__HRU_SLP.hru | Average slope steepness | 0~0.6 | 0.2161 |
| v__RCHRG_DP.gw | Deep aquifer percolation fraction | 0~1 | 0.2821 |
| v__ALPHA_BF.gw | Baseflow alpha factor | 0~1 | 0.0748 |
| r__SOL_BD().sol | Moist bulk density | −0.5~0.5 | 0.2533 |
| v__REVAPMN.gw | Threshold depth of water in the shallow aquifer for “revap” to occur | 0~500 | 175.6100 |
| v__CANMX.hru | Maximum canopy storage | 0~100 | 7.2444 |
| v__SURLAG.bsn | Surface runoff lag time | 1~24 | 3.3209 |
| v__TLAPS.sub | Temperature lapse rate | 0~50 | 46.7875 |
| v__SFTMP.bsn | Snowfall temperature | −5~5 | −2.7349 |
| v__EPCO.hru | Plant uptake compensation factor | 0.01~1 | 0.5588 |
| r__BIOMIX.mgt | Biological mixing efficiency | −0.5~0.5 | −0.3762 |
| r__SOL_Z().sol | Depth from soil surface to bottom of layer | −0.5~0.5 | 0.4978 |
| r__SOL_K().sol | Saturated hydraulic conductivity | −0.8~0.8 | −0.2278 |
| v__GW_REVAP.gw | Groundwater “revap” coefficient | 0.02~0.2 | 0.0637 |
| v__ESCO.hru | Soil evaporation compensation factor | 0.01~1 | 0.1647 |
| Period | Time | NSE | R2 | PBIAS/% |
|---|---|---|---|---|
| Calibration period | 1972–1979 | 0.82 | 0.82 | 0.40 |
| Verification period | 1980–1985 | 0.78 | 0.83 | 5.30 |
| Period | Mean Value of Runoff/108 m3 | Runoff Change/108 m3 | Contribution Rate/% | |||||
|---|---|---|---|---|---|---|---|---|
| Rpre | Rsim | Rpost | ΔR | ΔRc | ΔRω | ηC | ηω | |
| 1997–2019 | 13.72 | 14.84 | 7.44 | −6.28 | 1.12 | −7.40 | 13.15 | −86.85 |
Disclaimer/Publisher’s Note: The statements, opinions and data contained in all publications are solely those of the individual author(s) and contributor(s) and not of MDPI and/or the editor(s). MDPI and/or the editor(s) disclaim responsibility for any injury to people or property resulting from any ideas, methods, instructions or products referred to in the content. |
© 2024 by the authors. Licensee MDPI, Basel, Switzerland. This article is an open access article distributed under the terms and conditions of the Creative Commons Attribution (CC BY) license (https://creativecommons.org/licenses/by/4.0/).
Share and Cite
Li, X.; Mao, R.; Song, J.; Gao, J.; Shi, A.; Xiang, W.; Sun, H. Response of Runoff Change to Soil and Water Conservation Measures in the Jing River Catchment of China. Land 2024, 13, 442. https://doi.org/10.3390/land13040442
Li X, Mao R, Song J, Gao J, Shi A, Xiang W, Sun H. Response of Runoff Change to Soil and Water Conservation Measures in the Jing River Catchment of China. Land. 2024; 13(4):442. https://doi.org/10.3390/land13040442
Chicago/Turabian StyleLi, Xiaoxin, Ruichen Mao, Jinxi Song, Junqing Gao, Aying Shi, Wei Xiang, and Haotian Sun. 2024. "Response of Runoff Change to Soil and Water Conservation Measures in the Jing River Catchment of China" Land 13, no. 4: 442. https://doi.org/10.3390/land13040442
APA StyleLi, X., Mao, R., Song, J., Gao, J., Shi, A., Xiang, W., & Sun, H. (2024). Response of Runoff Change to Soil and Water Conservation Measures in the Jing River Catchment of China. Land, 13(4), 442. https://doi.org/10.3390/land13040442