Abstract
With the rapid growth and development of urban areas, the economy has often been prioritized at the expense of the environment and ecological systems. However, it is essential to delve deeper into the relationship between the economy and the ecological environment. Therefore, this study introduces a comprehensive evaluation system that encompasses economic, ecological, and environmental factors in the Beijing–Tianjin–Hebei urban agglomeration in China. The Criteria Importance Through Inter-criteria Correlation (CRITIC) method is utilized to determine the weights of various indicators, and coupling as well as coupling coordination models are employed to investigate the spatiotemporal trends and interrelationships of the three factors. The results indicate that the economic development index has displayed a consistent uptrend since 2000, with the economic development index from 2015–2020 increasing by approximately four times compared to 2000–2005. The ecological status index has also increased in the last five years, with a rise of about 0.05 from 2015–2020 compared to 2000–2005. The environmental status index has fluctuated but generally increased, with a rise of approximately 5.6 times from 2015–2020 compared to 2000–2005. The coupling degree of the Beijing–Tianjin–Hebei urban agglomeration is relatively high, with intense coupling from 2005–2020, and moderate coupling from 2000–2005. Furthermore, the coupling coordination has continuously improved from mild maladjustment to barely coordinated from 2000 to 2020, indicating the enhancement of the coupling coordination of the three factors. It is crucial to acknowledge that there exists spatial heterogeneity in both the coupling degree and coupling coordination degree. This heterogeneity stems from the uneven progress in economic development, ecological conditions, and environmental status across various cities. Additional endeavors are required to foster the harmonized advancement of these factors across the entire region.
1. Introduction
As urbanization continues to accelerate, urban development has become increasingly strained, presenting significant risks and challenges to sustainable development [1,2,3]. Regional ecology, environment, and economy jointly influence the development of cities [4], and are also closely related to human production, livelihood, and health. Both excessive resource consumption and rapid economic development inevitably impose enormous pressure on the ecosystem, via mechanisms such as air and water pollution [5,6,7]. In 2020, the number of cities with air quality exceeding the second-level standard (excessive) was 133, accounting for 39.5% of the cities across China, which indicates that the air quality problem in China is still very serious. The United Nations’ water resource report also indicates that 3 to 4 million people die each year due to water pollution. On the other hand, the treatment of ecological and environmental pollution also requires economic support. Examining the interaction and coordination between urban ecology, environment, and economy is a fundamental factor in achieving sustainable improvements and promoting green economic development. It also provides a theoretical foundation for achieving high-quality development that yields mutual benefits and win-win outcomes.
In addition, climate change is also an important topic that has attracted much research attention recently [8], and numerous studies have shown that it is closely related to urbanization rate [9]. Global climate issues are a serious impediment to green and sustainable urban development [10].
In order to solve ecological and environmental problems and address the impacts of climate change on human beings, the study of sustainable development is imperative [11,12]. The Sustainable Development Goals Report 2023: Special Edition denotes sustainable cities and communities as a main sustainable development goal [13]. Urban economy, ecology, and environment influence and restrict each other. Studies on the coordination of the relationship between economy, ecology, and environment can provide reliable guidance for the realization of sustainable development goals. Therefore, it is essential to discuss the coordination of environment, economy, and ecology.
In this context, this paper presents a comprehensive evaluation index system of economic development, ecology, and environment in the Beijing–Tianjin–Hebei region and uses the coupling degree model and coupling coordination degree model to evaluate and analyze the coupling relationship among economic development, ecology, and environment. The study presents several differences from previous studies and makes an important contribution to the literature. Firstly, in terms of evaluation content, this study aims to establish an evaluation system that considers the interaction between economic development (i.e., economic structure and resource consumption), ecological conditions (i.e., ecological composition and ecological quality), and environmental conditions (i.e., water environment and atmospheric environment). Secondly, in terms of evaluation indicators, this study focuses on the sources of water consumption and energy consumption. For the environment, the selection of environmental indicators begins with the water and atmospheric environment, which is different from other studies that have focused on environmental damage and protection [14,15]. In addition, the analysis incorporates remote sensing metrics such as SO2 and NO2 emissions, as well as aerosol optical depth, to provide a comprehensive assessment of the environment. Thirdly, from the point of view of analysis, this study analyzes both provincial and prefectural levels.
The focus for this study was on the Beijing–Tianjin–Hebei region because we believe that the Beijing–Tianjin–Hebei region serves as a prototypical urbanized area, characterized by rapid economic growth. Specifically, the Gross Domestic Product (GDP) in this region increased by almost thirteen times between 2000 and 2020. This region has also undergone a significant level of urbanization. The urban area of the Beijing–Tianjin–Hebei region expanded continuously from 2000 to 2020, with the urban space in Beijing increasing by 7.85%, Tianjin by 10.31%, and Hebei by 4.06%. From 2000 to 2015, the urbanization rate of the Beijing–Tianjin–Hebei region increased from 38.99% to 62.72% [16].
2. Literature Review
In recent years, the rapid pace of economic development has led scholars to analyze the complex interrelationships between urban economy, ecology, and environment from various academic perspectives. There are many ways to evaluate these complex relationships. Among them, the Environmental Kuznets Curve (EKC) [17] has emerged as a primary method for qualitative analysis of the complex interrelationships between two or more factors such as urban economy, ecology, and environment. Several studies have suggested via EKC that the relationship between the economy and ecological environment follows an “inverted U-shaped” curve [18]. Nevertheless, the Environmental Kuznets Curve (EKC) postulates the mutual independence of the economy and the ecological environment, neglecting to consider the interrelationships and mutual constraints among the three factors [19]. Additionally, the EKC fails to quantify the degree of coupling coordination between the economic and ecological systems. The pressure–state–response (PSR) model [20,21] considers the causal relationships between indicators by starting with real problems and indicator characteristics and partitioning them into pressure, state, and response categories to construct an evaluation system. The PSR model still does not quantify the relationships between various subsystems, so these are usually quantified by combining the coupling coordination model or other coordination models. In addition, some concepts from mathematics and physics have been introduced in coordination models, such as the correlation model [22], coefficient of variation method [23,24], Euclidean distance method, coupling theory [25,26,27], structural equation model [28], dynamic coupling coordination model [5], and so on. The Energy–Economy–Environment (3E) Coordination Degree Model [29,30] is regarded as one of the most extensively employed comprehensive evaluation models for assessing the degree of coordination among energy, economy, and environment. As research in this field continues to expand, the scope of study is not limited to energy, economy, and environment, but also includes other systems such as the urbanization resources environment system [3]. The Coupling Coordination Model [25,31,32,33] effectively and intuitively reflects the coupling and coordination among various subsystems and multiple systems. It has been widely employed in the coordination and sustainable development of regions undergoing urbanization.
In terms of the scale of the study area, most of the existing studies have focused on one country. Some such countries have included China [34,35], Colombia [36], Russia [37], Pakistan [38], and others. In addition, there have been many studies conducted on “hot” areas, such as the Yellow River basin [39], China’s eco-industrial parks [40], and the urban agglomeration of the Guanzhong Plain [41]. With the gradual development of urbanization, urban agglomeration has gradually become a research hotspot; the Tianshan North slope urban agglomeration [42], Xi’an [43], and other regions have been included in recent studies. Previous studies have predominantly concentrated on analyzing the coordination and development of individual cities, without exploring the changes at different spatial scales across the region. In order to address this gap, the current study focuses on the Beijing–Tianjin–Hebei urban agglomeration and examines the spatial and temporal differences in regional coupling coordination across three distinct levels of analysis: the urban agglomeration as a whole, the provinces within the agglomeration, and the prefecture cities.
Environment only concerns the human living environment, while ecology is the sum of interactions between organisms and the environment within a certain scope. Unlike the environment, ecology not only takes into account human adaptation to the environment, but also considers the entire ecosystem and the interactions within it [44]. It provides a more macroscopic perspective to explain the ecological status of urban agglomerations. In terms of the content of the evaluation system, existing research has typically constructed evaluation systems that treat the ecological environment as a whole [45,46], while neglecting the impacts of ecological structure and quality.
In terms of the selection of evaluation indicators, for economic development, GDP and the proportion of industrial structure are commonly employed as indicators in the literature [46,47,48], but this neglects the intricate interaction between resource consumption and economic development. The Beijing–Tianjin–Hebei region is dominated by primary and secondary industries, complementary to the tertiary industry. The development of primary and secondary industries depends on water and energy. It is necessary to introduce energy consumption as an economic development indicator. In terms of ecological indicators, existing research focuses on ecological quality [49], ecological security [43], and ecological fragility [50]. Ecological composition reflects ecological status more intuitively [51], so it is necessary to introduce this into the ecological evaluation index. With regards to environmental indicators, researchers focus on urban environmental quality [52,53], which is used to describe environmental conditions. However, in the research, an index or indicator [54] is usually used as the indicator, and the environmental indicators are not detailed. However, for the Beijing–Tianjin–Hebei region, atmospheric and water-related environmental problems cannot be ignored.
3. Study Area and Dataset
3.1. Study Area
The Beijing–Tianjin–Hebei region is recognized as a core area within the North China economy, with distinct advantages in terms of economic development. It comprises three provinces and thirteen cities, as depicted in Figure 1. The Beijing–Tianjin–Hebei region has a large population, with a total population of 140,005 million by the end of 2019, accounting for 8.1% of China [55].
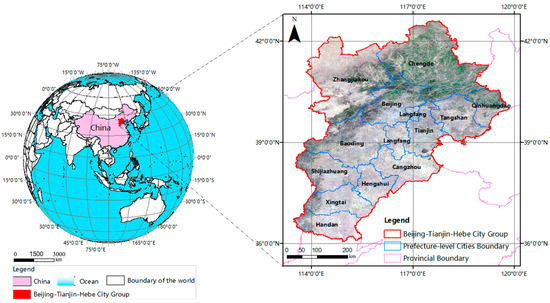
Figure 1.
Study area overview.
Beijing stands out as a leader in economic growth, contributing up to 41.78% of the total GDP of the entire Beijing–Tianjin–Hebei region. Consequently, Beijing has emerged as one of the more economically developed cities in China. However, the rapid expansion of urban areas has resulted in the irrational use of land and has caused prominent conflicts between urbanization and land usage. Between 2000 and 2020, the urban area of Beijing expanded by 7.85%, and the urban area of Tianjin by 10.31%. In contrast, Hebei is characterized by extensive farmland (accounting for approximately 50% of the land use), indicating the need for improved urban development.
The environmental state of the Beijing–Tianjin–Hebei region is primarily characterized by water shortages and water pollution, particularly in Tianjin and Hebei. The Beijing–Tianjin–Hebei region belongs to the resource-type water shortage region [16], and its per capita water resource is only 240 cubic meters, far below the internationally recognized per capita “extreme water shortage standard” of 500 cubic meters [56,57]. In addition, a large amount of sewage is generated while using water resources in this region [58]. Therefore, water pollution and water scarcity have become the biggest obstacles to the sustainable development of the Beijing–Tianjin–Hebei region. Additionally, air pollution frequently occurs and has wide-ranging impacts, directly affecting the quality of life of the region’s inhabitants. Seven of the ten cities with the worst air quality in China are in Hebei, making the Beijing–Tianjin–Hebei region one of the most polluted in the country [59,60].
3.2. Dataset
The data used in this study, including economy data, ecological status data, and environmental status data, are presented in Table 1. The coupling and coordination between the economy, ecology, and environment in the Beijing–Tianjin–Hebei region was analyzed at five-year intervals from 2000 to 2020, in accordance with the region’s economic and social development plans, in order to ensure data uniformity and integration between remote sensing data (e.g., land use data, Fraction Vegetation Coverage (FVC), Aerosol Optical Depth (AOD), and SO2 and NO2 emission data) and statistical data. It appears that the statistical data available in the yearbooks and bulletins are primarily focused on prefecture-level cities within the Beijing–Tianjin–Hebei region. Therefore, it may be more appropriate to use these prefecture-level cities as the collection and statistical units for analyzing and reporting on data within the region.

Table 1.
Data and data sources.
3.2.1. Economic Development Dataset
To establish economic development indicators for the Beijing–Tianjin–Hebei region, this study employed two first-level indicators: economic industrial structure and resource consumption. The economic industrial structure was measured using two components: Gross Domestic Product (GDP) and the proportion of industries. Total GDP is the sum of the value of all final goods and services produced in a region in a year, corrected for the rate of inflation. It was utilized as an indicator of the degree of economic development in the region, while the industrial proportion served as a metric of the economic industrial structure as a proportion of total GDP [5,61]. In the process of economic development, the consumption of energy and water is inevitable, and serves as an important indicator of the industrial structure of the economy [62,63,64]. Therefore, this study used energy and water consumption as key indicators of resource consumption in the Beijing–Tianjin–Hebei region. The data for economic industrial structure and resource consumption were obtained from the Yearbooks of Beijing, Tianjin, and Hebei. Water consumption data were sourced from the water resources bulletin. The statistical data covered the period from 2000 to 2020. It is important to note that missing data were handled using an interpolation method based on data from adjacent years in order to ensure data completeness and consistency.
3.2.2. Ecological Status Dataset
The ecological status dataset used in this study comprised two main components: the ecological composition and the ecological quality. The ecological composition dataset includes data on the spatial proportions of agricultural, ecological, and urban areas. The ecological quality dataset includes data on total water resources and FVC. The spatial proportions data directly and effectively reflect the composition of each component [62]. The total amount of water resources reflects the availability of urban water resources [62,64,65]. Combined with the characteristics of the lack of water resources in the Beijing–Tianjin–Hebei region, the total amount of water resources is used to evaluate the ecological status. FVC reflects the quality and growth status of land table vegetation [66].
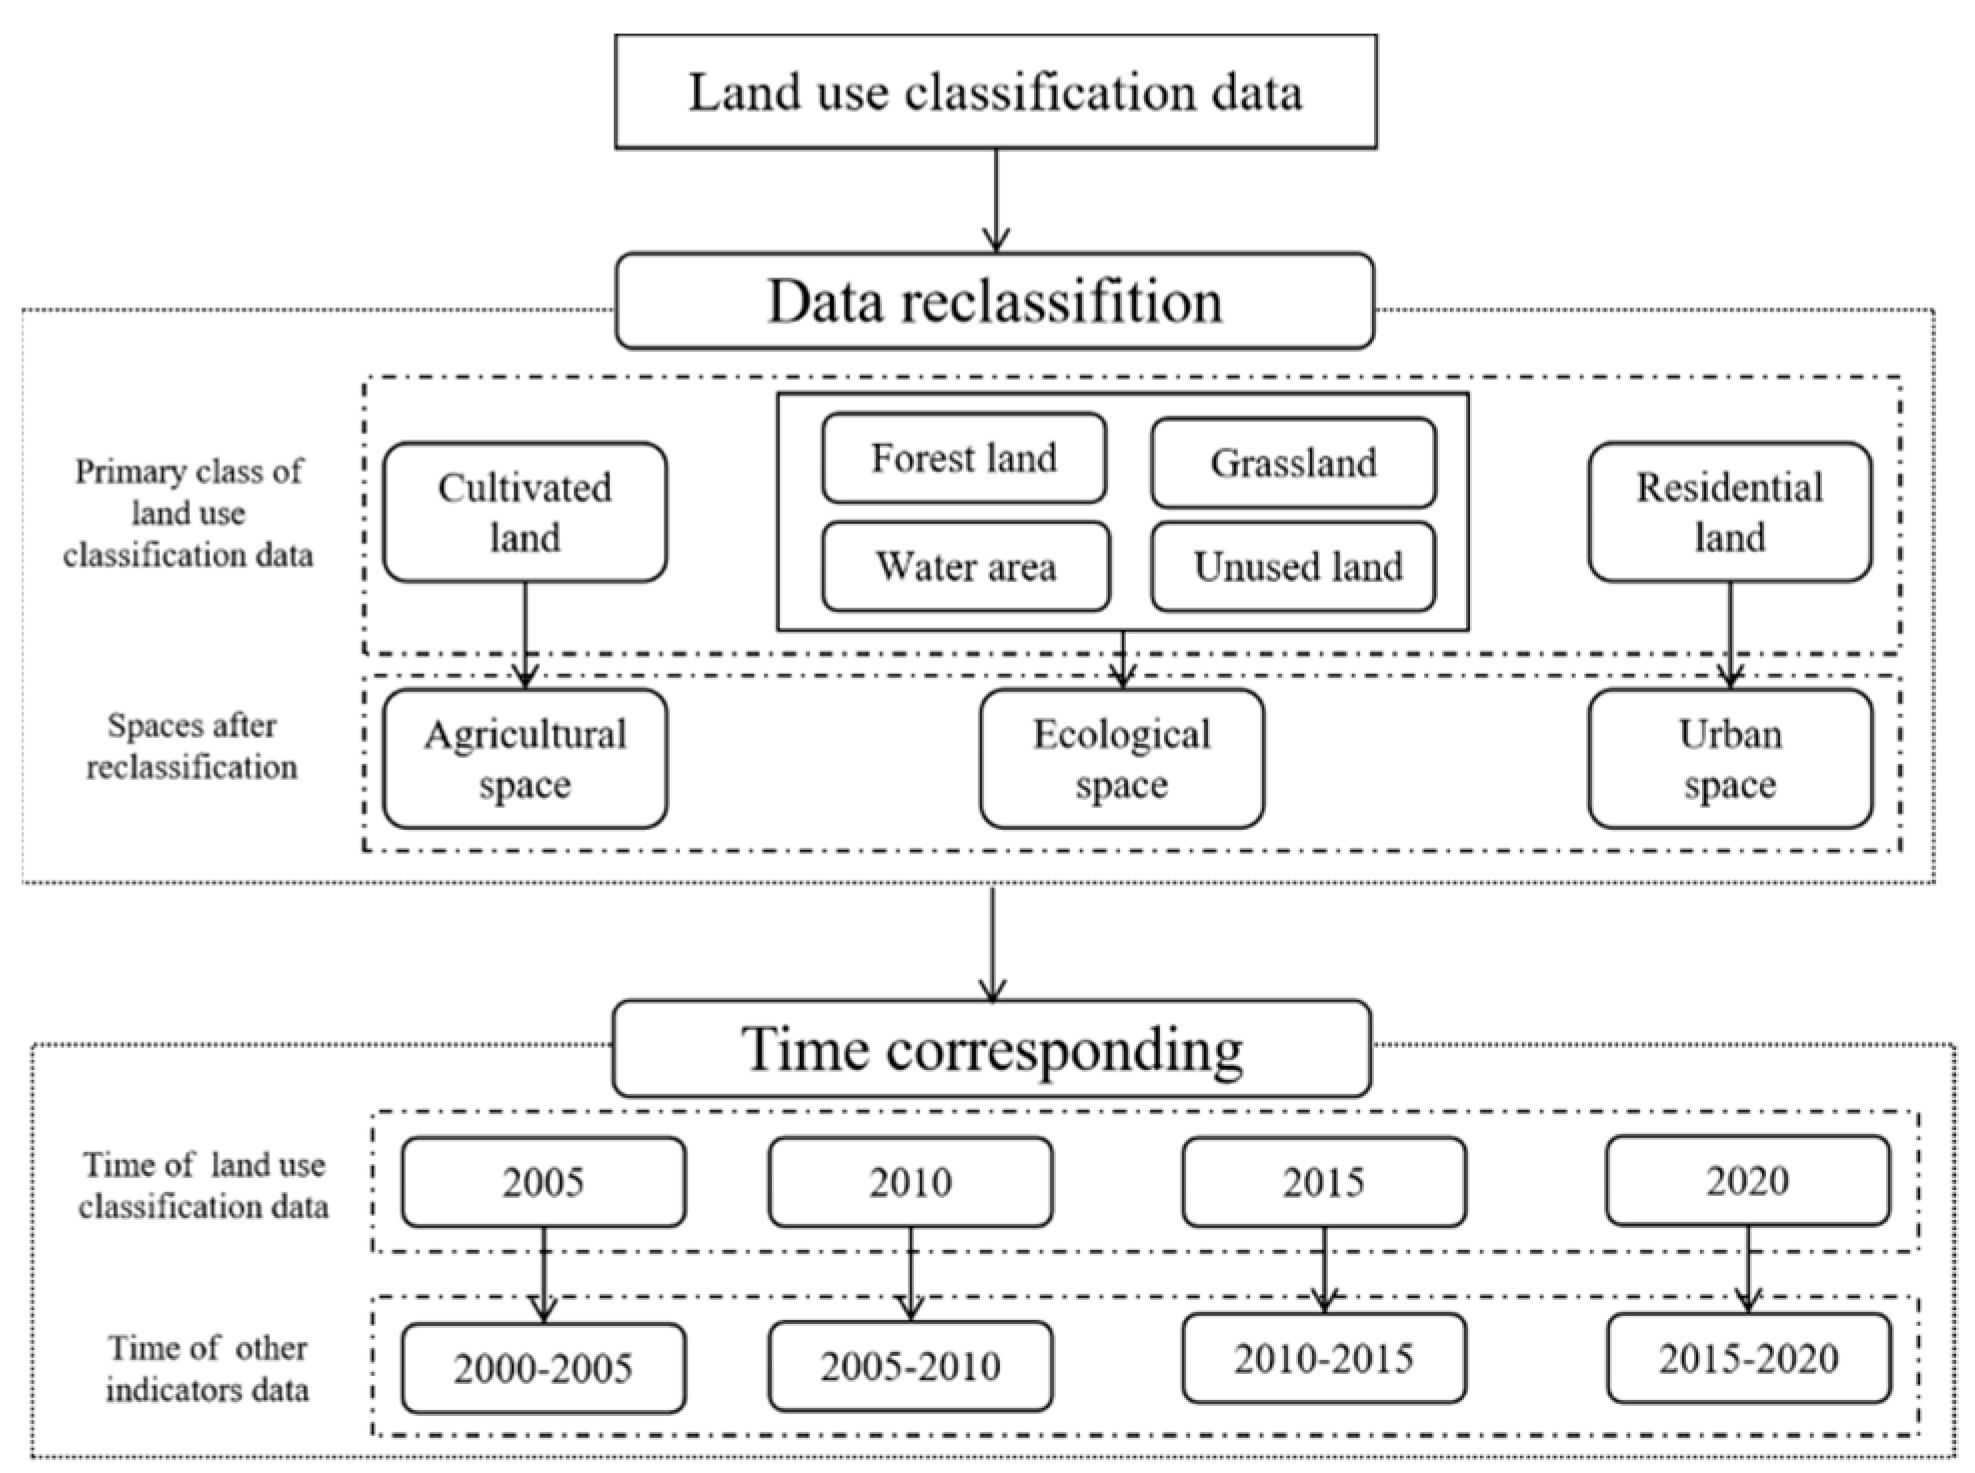
The ecological composition component of the study utilized land use data derived from Landsat remote sensing images with a 30 m spatial resolution. Due to the diverse and complex land usage types, such as arable land, forest, grassland, water, residential land, and unused land, the data needed to be reclassified into three categories: agricultural, ecological, and urban spaces, as illustrated in Figure 2. Arable land was classified as agricultural space, while forest, grassland, water, and unused land were classified as ecological space, and residential land was classified as urban space. Given that the land use status lagged behind various driving factors, data from 2005, 2010, 2015, and 2020 were selected to represent the land use status from 2000–2005, 2005–2010, 2010–2015, and 2015–2020, respectively.
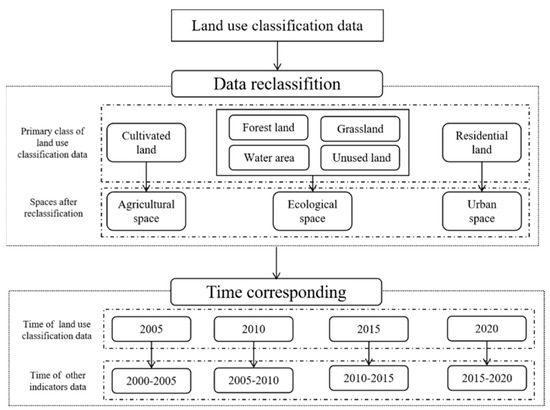
Figure 2.
Reclassification of land use data.
FVC data were derived from the MODIS NDVI product (MOD13Q1) through the pixel dichotomy model from 2000 to 2020, with a temporal and spatial resolution of 16 days and 250 m, respectively. On the other hand, total water resources data were obtained from the Beijing–Tianjin–Hebei Water Resources Bulletin from 2000 to 2020.
3.2.3. Environmental Status Dataset
The environmental status indicators used in this study were mainly focused on atmospheric environment and water environment.
For the atmospheric environment, AOD, sulfur dioxide emissions, nitrogen dioxide emissions, and days with air quality better than Class II were used to assess the level of air pollution in urban areas. The annual average AOD was obtained by processing the optical thickness of MODIS aerosol daily product data (MCD19A2) in the 550 nm band [36] through format conversion, splicing, cropping, and accumulation calculation. Its spatial resolution was 1 km, and the time range considered was from 2000 to 2020. Emissions of sulfur dioxide and nitrogen dioxide were calculated using SO2 and NO2 product data from OMI satellite data spanning from 2005 to 2017. The spatial resolution was 12 km × 24 km, and the time resolution was 16 days. The missing data regarding sulfur dioxide emissions and nitrogen dioxide emissions for the years 2000–2004 and 2018–2020 were supplemented using the ecological and environmental status bulletins. The data on the number of days with air quality better than Class II refers to an air pollution index ranging from 51–100 and the air quality rating being categorized as good. These were obtained from the ecological and environmental status bulletins of Beijing, Tianjin, and Hebei.
For the water environment, the discharge of unit GDP sewage and the proportion of cross-section points with better water quality than Grade III and poorer than Grade V were used to assess the pollution status and water quality in cities. The wastewater discharge data were obtained from the bulletin of ecological environment and water resources, while GDP data were sourced from yearbooks. Data on the proportion of cross-section points with water quality better than Grade III and poorer than Grade V were sourced from the water resources bulletin. The temporal scope of the data spanned from 2000 to 2020, with some missing year data interpolated from the means of adjacent years.
4. Methodology
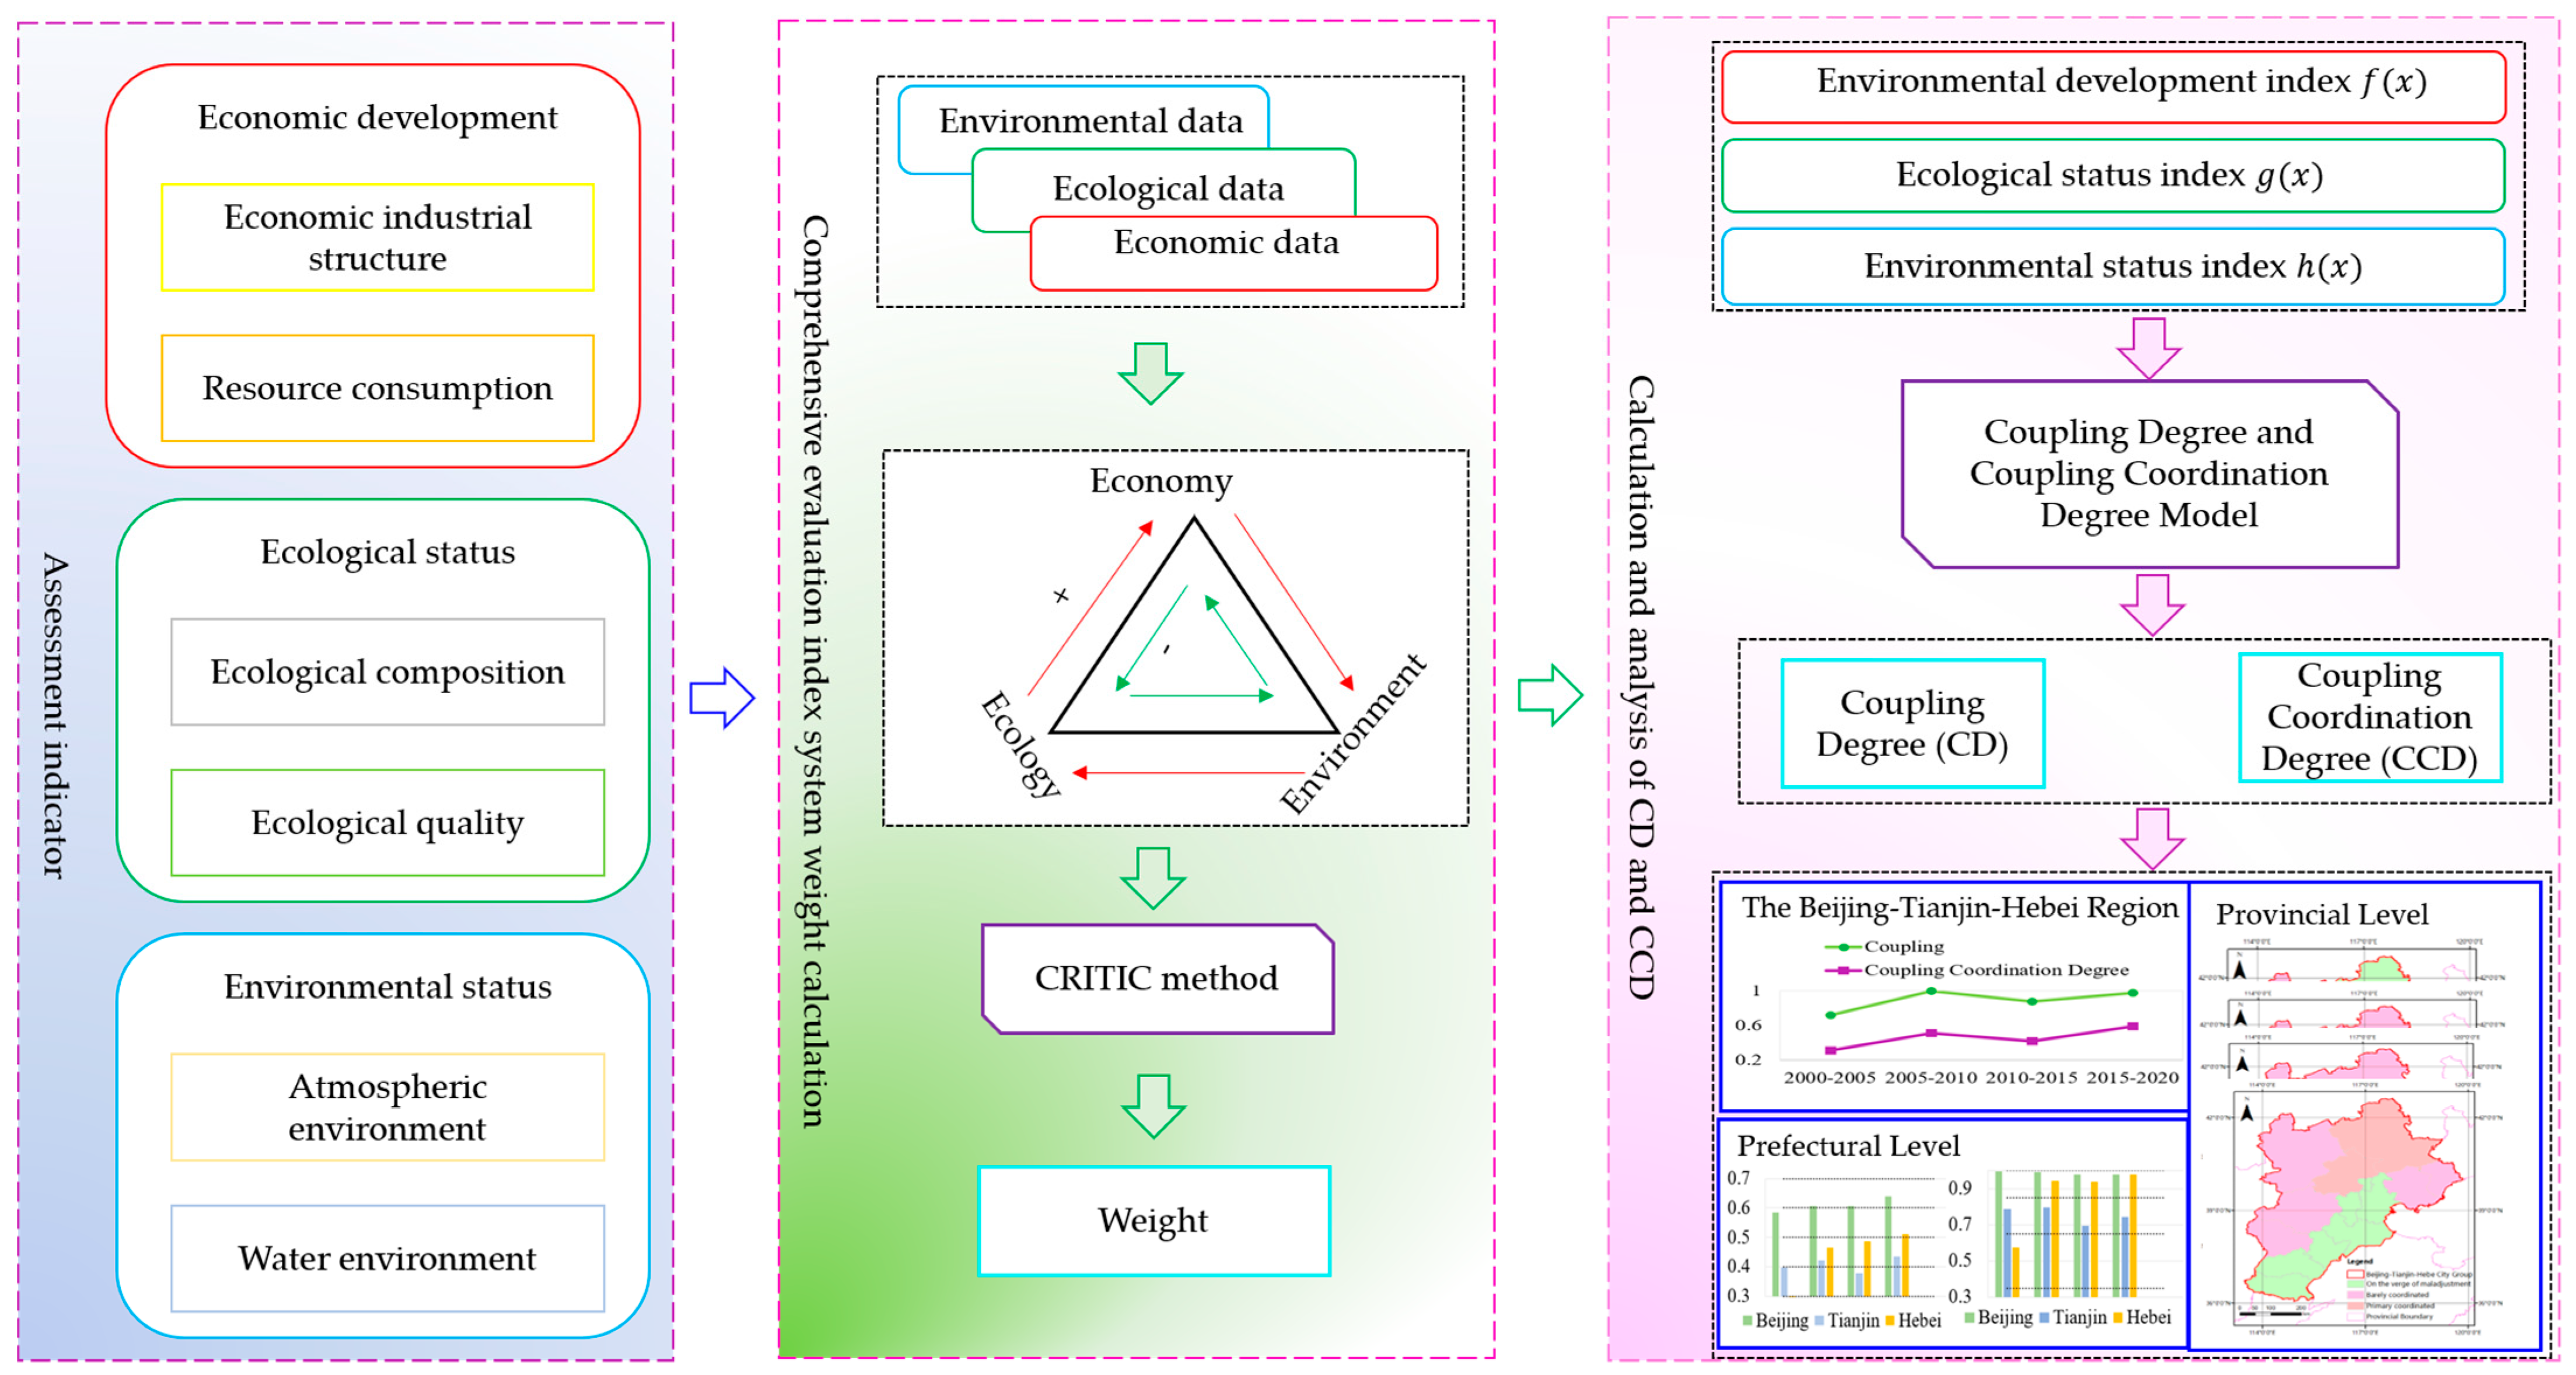
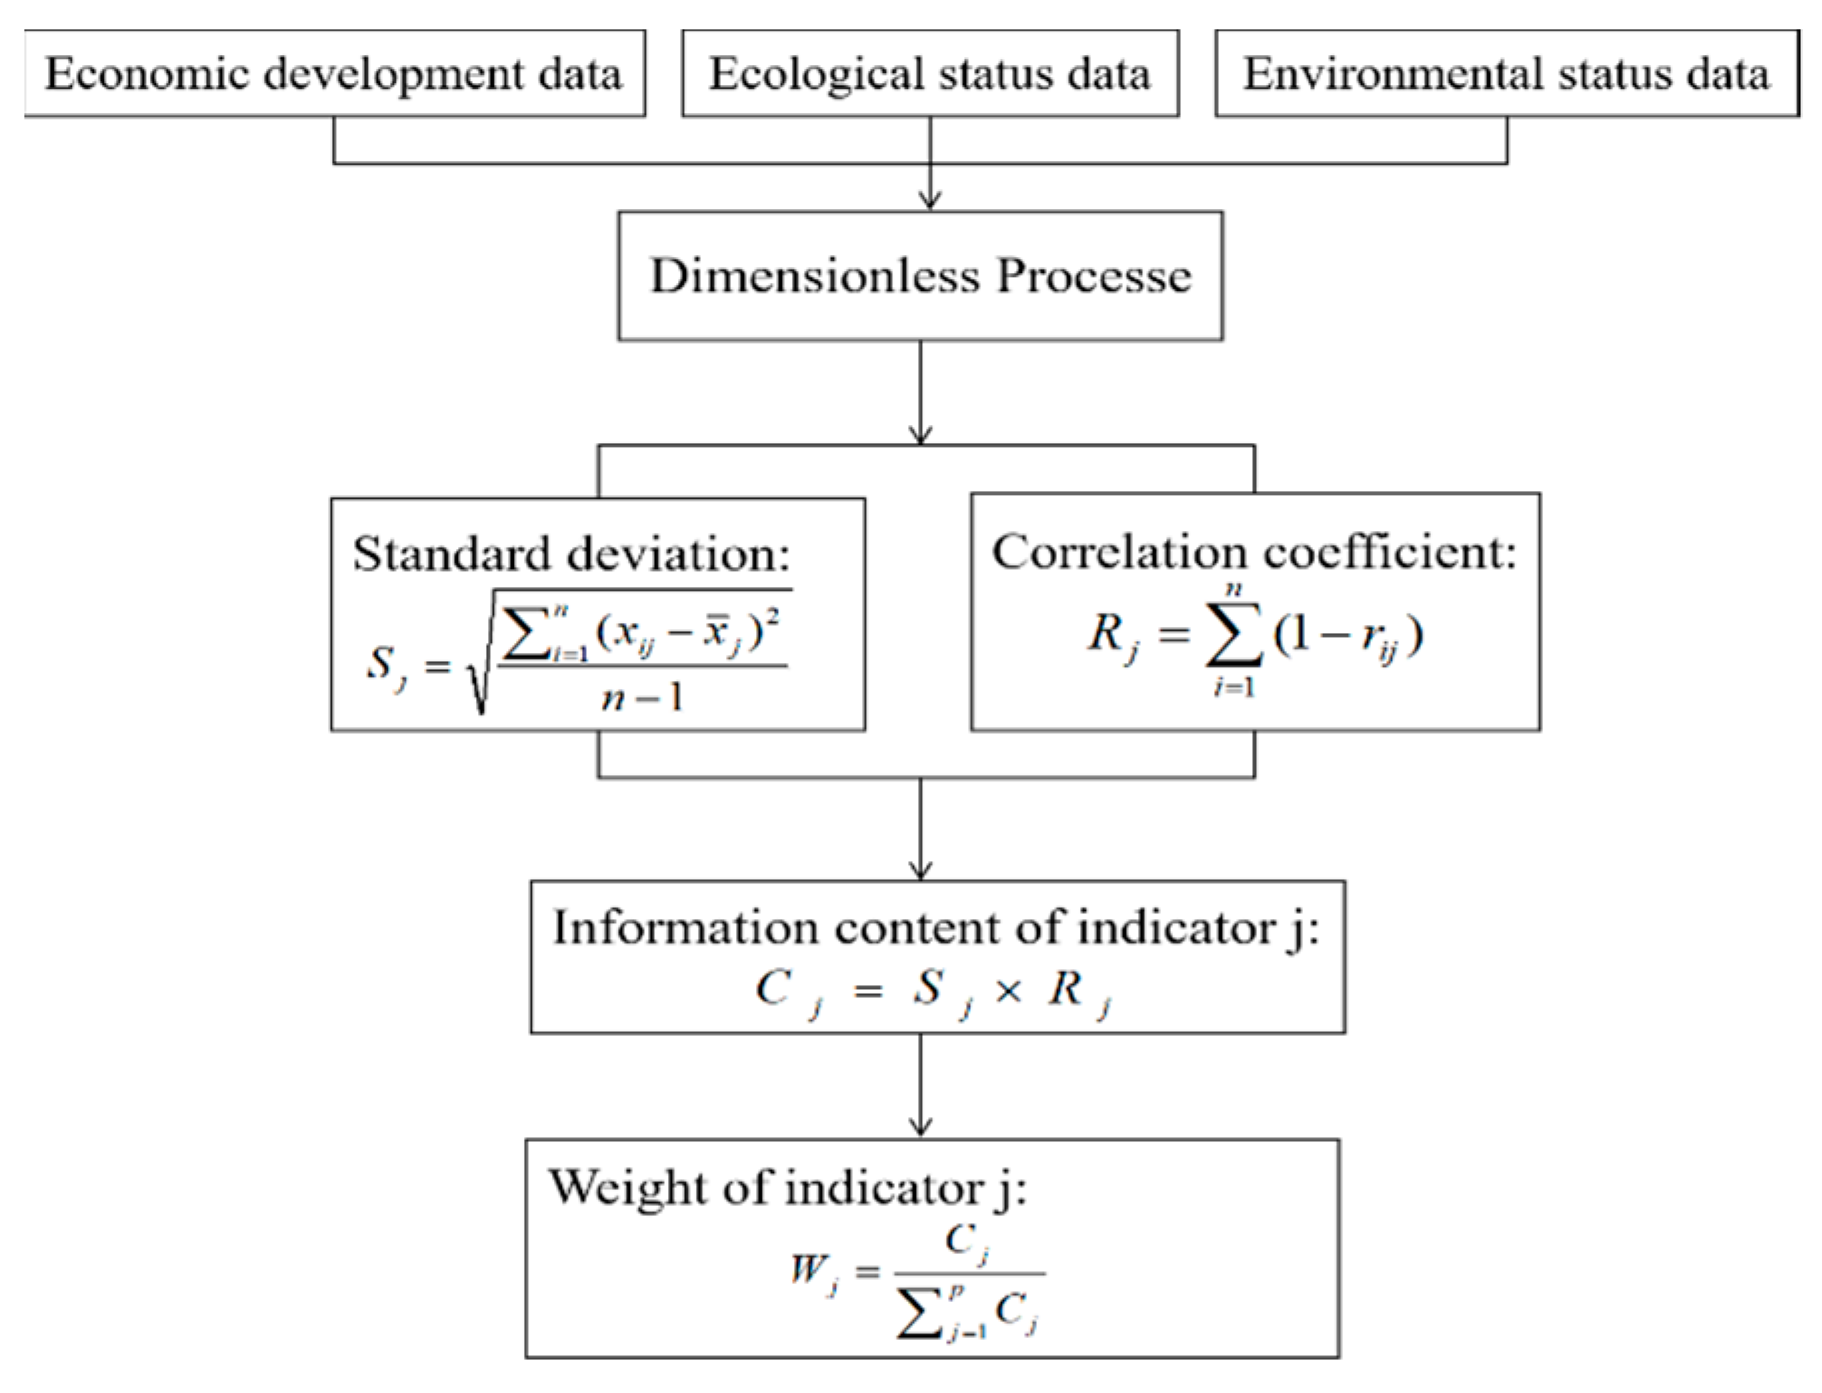
The flow chart of this study is shown as Figure 3. It includes three parts: evaluation index, weight calculation, and calculation and analysis of coupling degree and coupling coordination degree.
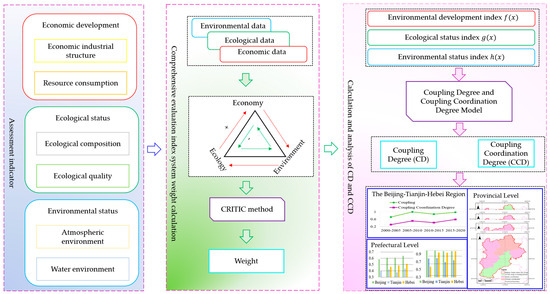
Figure 3.
Research framework flowchart.
4.1. Establish Comprehensive Assessment System
To develop a comprehensive assessment system for ecology, environment, and economy, it is essential to analyze the changes in indicators over time and explore their correlation. Based on a comprehensive consideration of these factors, this study proposes a new comprehensive assessment system. The system evaluates three aspects: economic development, ecological status, and environmental status, with first-level and second-level indicators, as shown in Table 2 and Figure 3. In terms of economic development, the focus is on economic structure and resource consumption, with economic structure (GDP and proportion of primary, secondary, and tertiary industries) indicating the direction of economic development, and resource consumption (water consumption and energy consumption) reflecting changes in industrial structure. For ecological status, the emphasis is on ecological composition and quality, with ecological composition being based on the proportion of urban, ecological, and agricultural spaces, which indicates the differences and conflicts between urban and ecological areas, and ecological quality quantitatively reflecting the state of ecological status. In terms of environmental status, the focus is on atmospheric and water environments, which have the most significant impacts on the overall environment.
Table 2.
Beijing–Tianjin–Hebei comprehensive assessment system.
The CRITIC method [67,68] is an objective weighting approach that comprehensively considers the volatility and conflict between indicators. It is also effective in reducing information overlap between indicators, which is beneficial in obtaining reliable evaluation results [69]. In this study, we utilized the CRITIC method to calculate indicator weights. To address the inconsistency in indicator units, we applied the range method (Formula (1)) to normalize the indicators.
where is the second-level indicator’s value; is the normalized result.
To calculate the weights, two crucial indicators are required: standard deviation and correlation coefficient. The index variability (standard deviation) and index conflict (correlation coefficient) were utilized to represent the information content, and the weights were obtained through normalization, as illustrated in Figure 4. As shown as Figure 4, is the indicator ’s weight; is the indicator ’s weight; is the number of subsystem indicators; is the indicator ’s standard deviation; is the indicator ’s correlation coefficient; is the numbers of indicator ; is the actual score of option relative to criterion ; indicates the correlation coefficient between evaluation indicators and ; and is indicator ’s mean, .
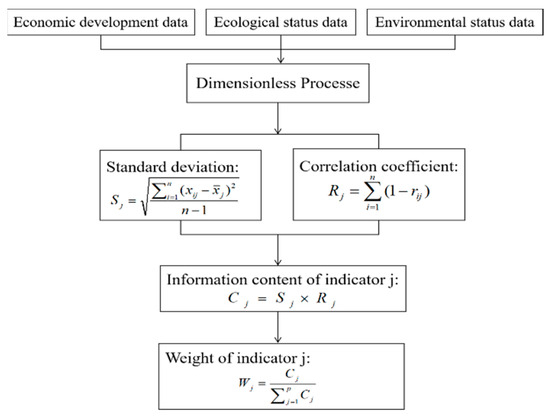
Figure 4.
Flow chart of CRITIC method to calculate weight.
4.2. Establish the Coupling Coordination Evaluation
The degree of coupling (CD) and the degree of coordination of coupling (CCD) reflect the interaction and coordination between indicators, respectively [3,70]. In this study, correlation models were used to explore the relationship between the economy, ecology, and environment [71]. The expressions for the coupling degree and coupling coordination degree are as follows:
Among them, , and can be expressed as:
where , and are indexes of economic development, ecological status, and environmental status, respectively. When the whole system weight was set to one, to achieve a balanced development of economy, ecology, and environment, we took , where , , and respectively represented the number of secondary indicators; , , and were the weights.
The CCD can serve as an indicator of the quality of coordination and relationships among different systems, measure the degree of harmony between various systems, and reflect the sustainability of the region [3,70]. A higher CCD indicates a more coordinated development of the economy, ecology, and environment. To quantitatively classify the coupling degree and coupling coordination degree, the coupling degree was categorized into four levels, and the coupling coordination degree was classified into five levels. The classification scheme used in this study is presented in Table 3 [71].
Table 3.
CD and CCD grading system.
5. Results
According to China’s “Five-Year Plan” [72] and the actual situation regarding land use changes, the results focus on four time periods (2000–2005, 2005–2010, 2010–2015, and 2015–2020).
5.1. Analysis of the Economic, Ecological, and Environmental Changes
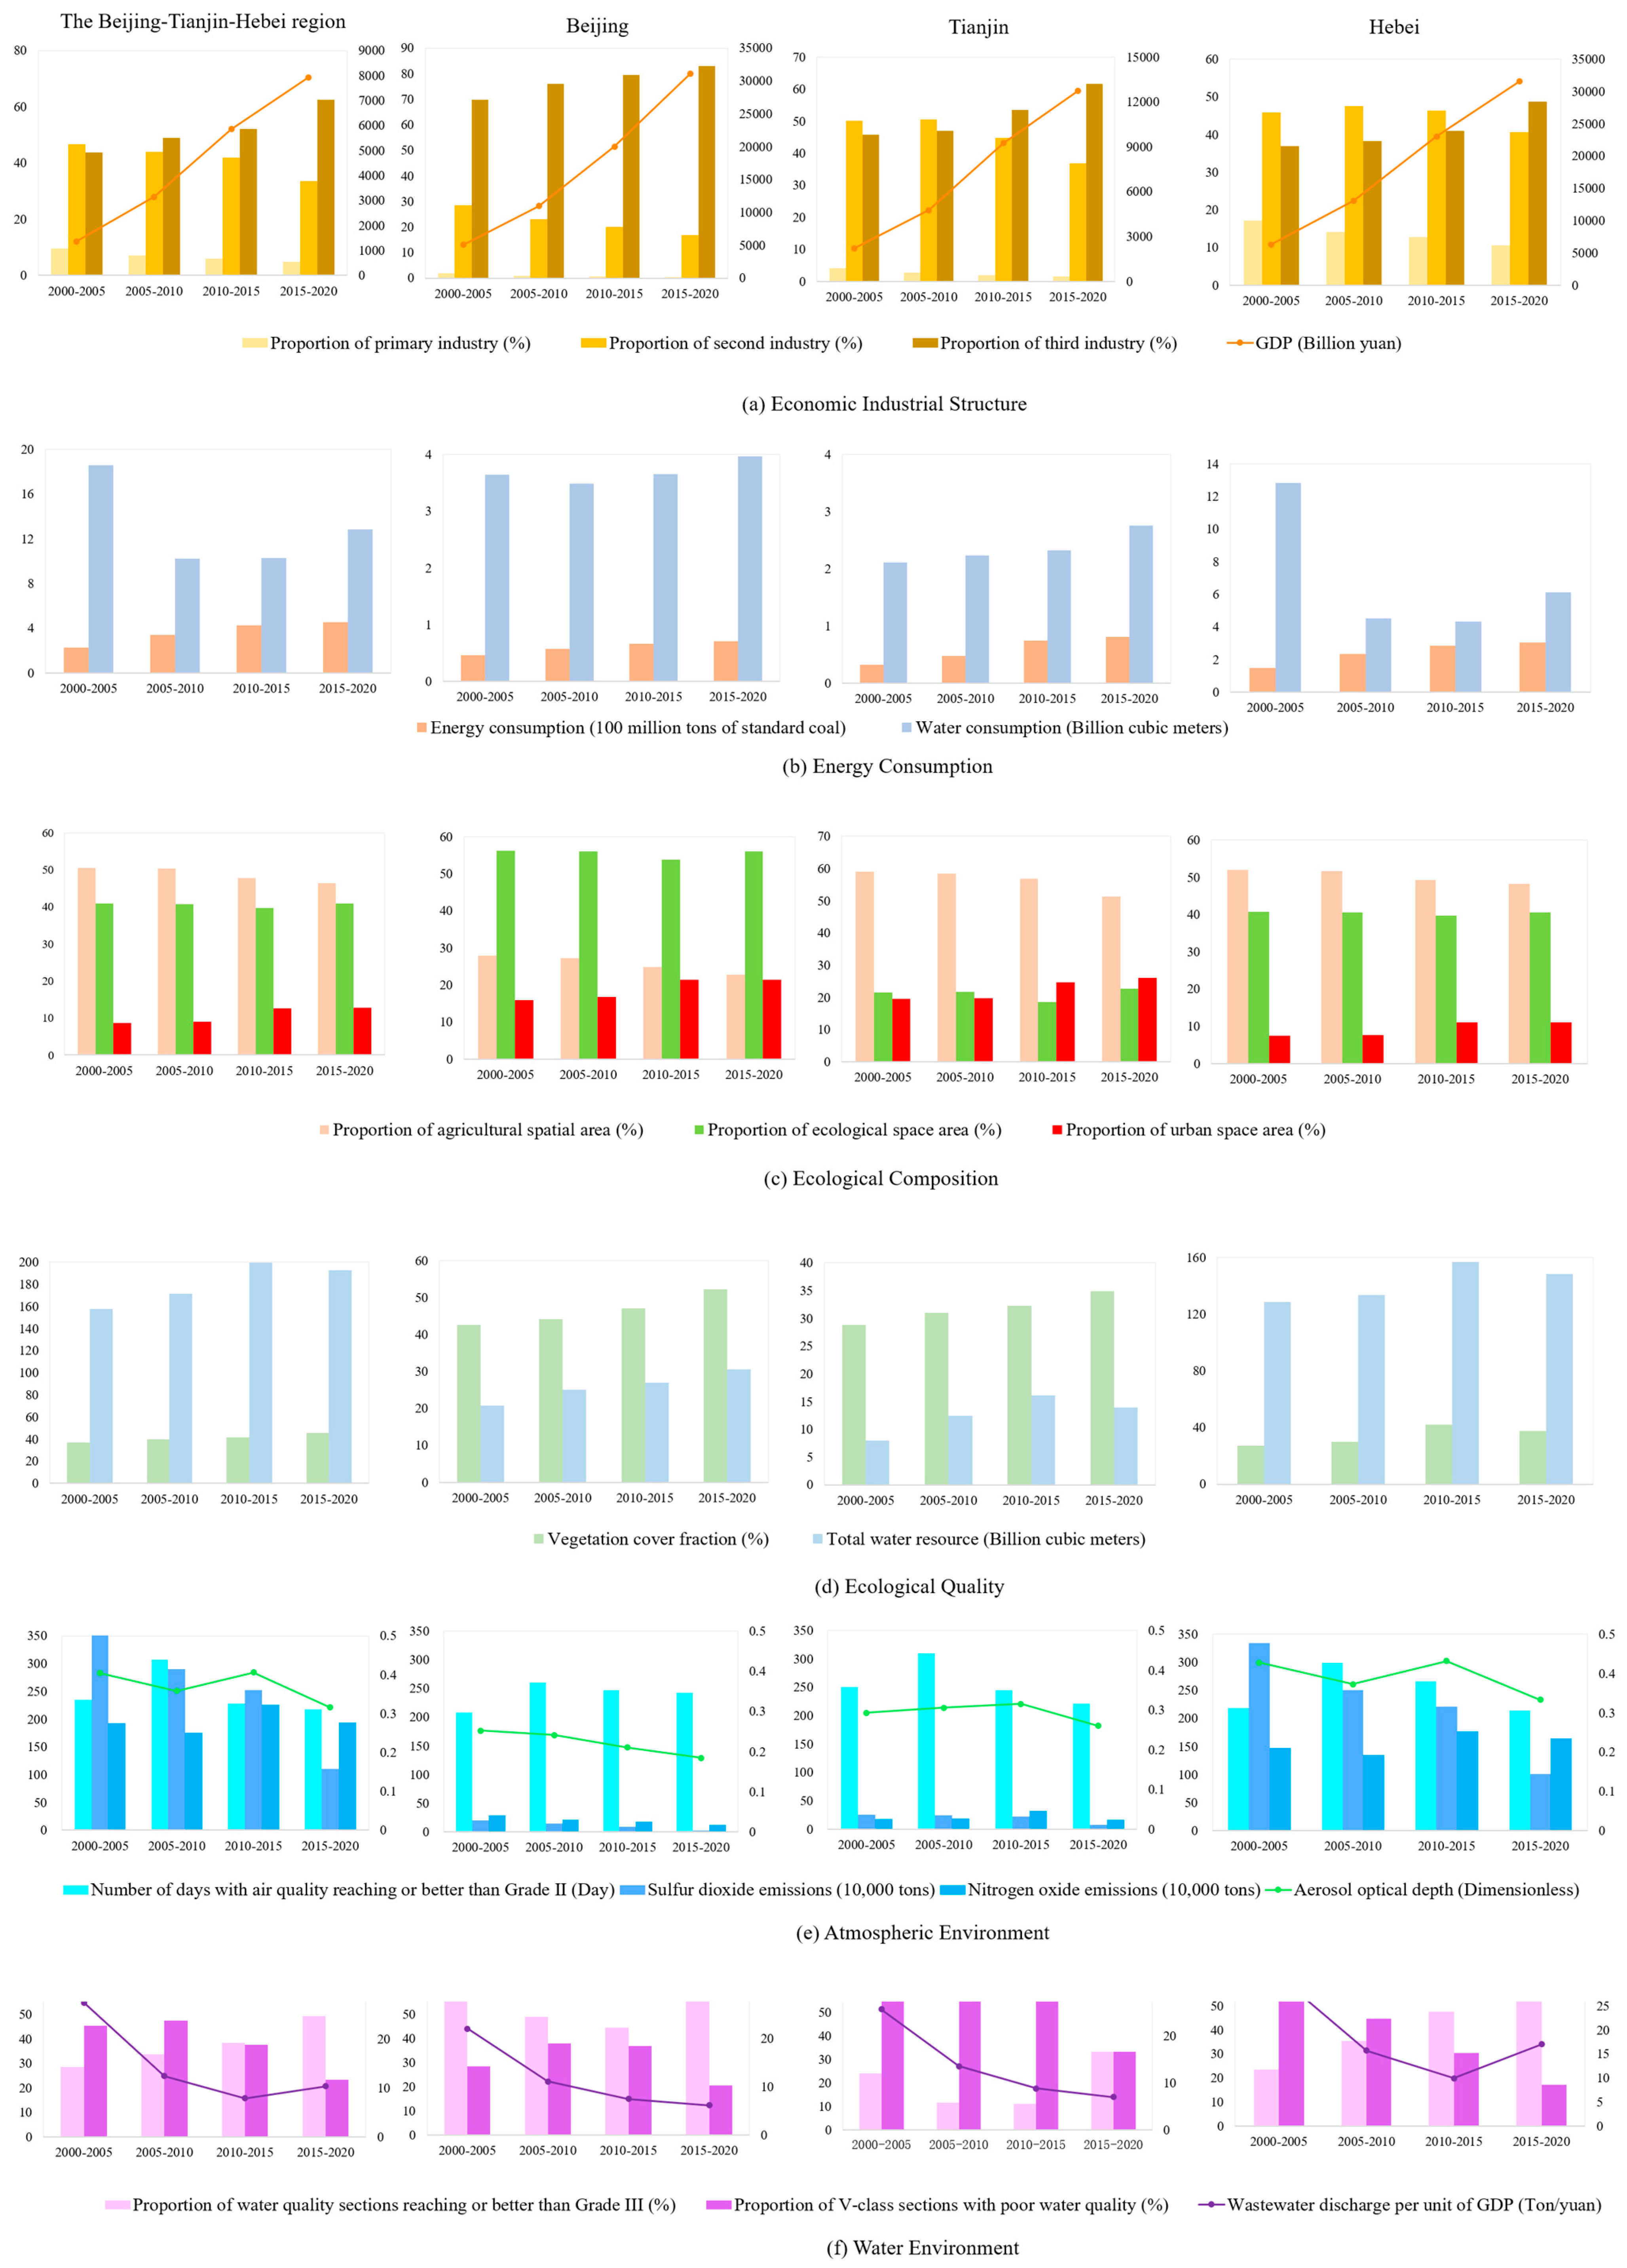
To evaluate the system of economic development, ecological status, and environmental status, we utilized the corresponding indicators to rate and quantify their development status. Figure 5 illustrates the changes in the indicators of economic development, ecological status, and environmental status in the Beijing–Tianjin–Hebei region, the provinces (Beijing, Tianjin, Hebei), and the prefecture-cities of Hebei. The changes in first-order indicators are determined by the secondary indicators. However, due to the large number of prefecture-level cities, we focused our analysis on the secondary indicators of economic development, ecological status, and environmental status represented at the Beijing–Tianjin–Hebei regional level, and at the provincial level (Beijing, Tianjin, and Hebei) (Figure 6).
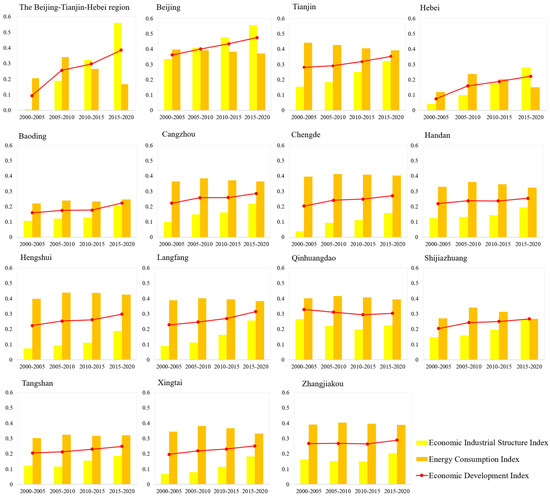
Figure 5.
The changes in economic development status indexes in the Beijing–Tianjin–Hebei region, the provinces (Beijing, Tianjin, and Hebei), and the prefecture-level cities of Hebei.
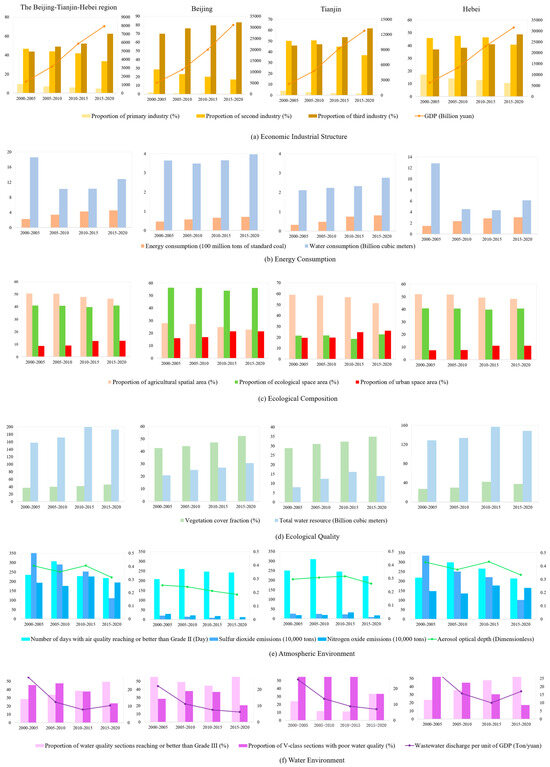
Figure 6.
The changes in second-level indicators of economic, ecological, and environmental status in the Beijing–Tianjin–Hebei region and the individual provinces (Beijing, Tianjin, Hebei).
5.1.1. Analysis of Changes in Economic Development
The evaluation of economic development is quantitatively measured based on the economic development index. A higher economic development index indicates a greater degree of economic development.
Overall, the economic development index has shown an increasing trend, indicating sustained economic growth. The economic industrial structure index has also been trending upward, indicating a continuous optimization of the economy’s industrial structure. This phenomenon is mainly attributed to the continual transition from primary and secondary industries to the tertiary industry, where the service sector is gradually assuming the position of the primary economic industry (Figure 6). The resource consumption index showed an uptrend from 2000 to 2010, followed by a weakening trend from 2010 to 2020. Regarding the changes in the second-level indicators (Figure 6), energy consumption has continued to increase over time, while total water consumption decreased by approximately 800 million cubic meters from 2000 to 2010, and then increased by about 200 million cubic meters from 2010 to 2020. This indicates a continual improvement in resource consumption efficiency [26] since 2010.
The economic development indices for the provinces of Beijing, Tianjin, and Hebei have all shown an increasing trend, with Beijing having the largest increase and Hebei having the smallest. This trend can be attributed to the gradual increase in the proportion of the tertiary industry in the three provinces, as indicated in Figure 6. Additionally, the resource consumption indices for Beijing and Tianjin have shown a slow downtrend, indicating an improvement in resource utilization efficiency in these provinces. It is worth noting that the resource consumption index is closely related to the difference in urban economy and urbanization. Furthermore, the higher energy efficiency of Beijing and Tianjin has contributed to the development of the surrounding cities to some extent [25]. In contrast, Hebei’s resource consumption index showed an uptrend from 2000 to 2010, followed by a downtrend from 2010 to 2020. This indicates that Hebei’s resource utilization efficiency has also improved since 2010. As shown in Figure 5, the water consumption in Hebei decreased from about 1.2 billion cubic meters in 2000–2005 to about 600 million cubic meters in 2015–2020, which is a nearly 50% reduction. This trend can be attributed to the different degrees of urban agglomeration and their impact on economic and industrial structure, as well as resource consumption. In conclusion, the increasing trend in economic development indices for the provinces of Beijing, Tianjin, and Hebei is due to the gradual increase in the proportion of the tertiary industry. Meanwhile, the improvement in resource utilization efficiency in Beijing, Tianjin, and Hebei is evident from the slow downtrend in their resource consumption indices. However, different degrees of urban agglomeration have led to differences in economic and industrial structure and resource consumption among these provinces.
Regarding Hebei’s prefecture-level cities, the economic development of the 11 cities showed an overall upward trend with some fluctuations. With the exception of Qinhuangdao, Tangshan, and Zhangjiakou, the economic industrial structure indexes of other prefecture-level cities have been increasing, indicating continuous optimization of their industrial structure. Qinhuangdao mainly relies on its tertiary industry, due to its status as an important coastal tourism city in Hebei. Tangshan is dominated by secondary industries, and Zhangjiakou is mainly based on the secondary and tertiary industries. Thus, Qinhuangdao, Tangshan, and Zhangjiakou’s economic industrial structures were more stable, resulting in smaller changes in their economic industrial structure index. In terms of resource consumption index, there were differences among the various cities. Baoding, Tangshan, and Zhangjiakou’s resource consumption index increased during 2000–2010, decreased in 2010–2015, and then increased again in 2015–2020. In contrast, other cities had shown a downward trend since 2010. These differences in resource consumption index could be attributed to differences in urban development and industrial structure.
5.1.2. Analysis of Changes in Ecological Status
To assess the ecological status of a region, the ecological status index was employed as a quantitative measure. A higher value on the ecological status index indicates a better ecological status in the region.
As illustrated in Figure 7, the ecological status index for the Beijing–Tianjin–Hebei region has exhibited an increasing-decreasing-increasing trend. Specifically, the ecological composition index showed a downward trend from 2000 to 2015, followed by an upward trend from 2015 to 2020, while the ecological quality index displayed an upward trend over the entire period. The decline in the ecological composition index during 2000–2015 was mainly attributed to the continuous reduction in the proportion of ecological space, which was being encroached upon by urban space. However, the upward trend in the ecological composition index during 2015–2020 can be attributed to the implementation of a policy mandating the return of farmland to forests [73], which led to an increase in the proportion of ecological space. Figure 6 provides additional information on the changes in ecological space and urban space in the region from 2000 to 2020. The proportion of ecological space decreased by 1.32% during this period, but then increased by 1.16%. In contrast, the proportion of urban space increased by 4.70%. In summary, the ecological status index for the Beijing–Tianjin–Hebei region has exhibited a fluctuating trend, with the ecological composition index showing a downward trend during 2000–2015, but an upward trend during 2015–2020. The reduction in the proportion of ecological space was mainly due to the encroachment of urban space, but the policy of returning farmland to forests has helped to reverse this trend in recent years.
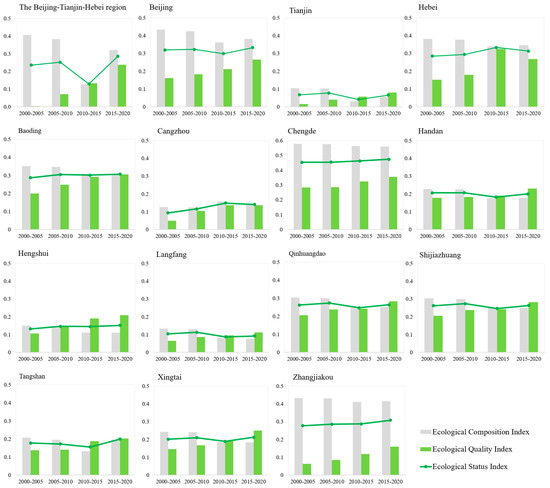
Figure 7.
The changes in ecological status indexes in the Beijing–Tianjin–Hebei region, the provinces (Beijing, Tianjin, and Hebei), and the prefecture-level cities of Hebei.
At the provincial level, the ecological status index for Beijing and Tianjin displayed an increasing-decreasing-increasing trend, while Hebei’s ecological status index exhibited an increasing trend from 2000 to 2015, followed by a decreasing trend from 2015 to 2020. The ecological composition indexes for all three provinces showed a declining trend during 2000–2015, followed by an increasing trend during 2015–2020. The fluctuations in the ecological composition index can be attributed to the proportion of ecological space area, which reflects the degree of ecological space compression and expansion, as depicted in Figure 6. Furthermore, the ecological quality index for all three provinces showed an increasing trend, indicating an improvement in ecological quality over the period under consideration.
The ecological status indexes of cities in the Hebei province exhibited varying trends. Chengde and Zhangjiakou showed an upward trend, while Cangzhou and Qinhuangdao initially increased from 2000–2015, and then declined from 2015–2020. Baoding, Handan, Hengshui, Langfang, Shijiazhuang, and Xingtai had a trend of rising, falling, and then rising again. The ecological status index of Tangshan showed a downtrend from 2000 to 2015, followed by an uptrend from 2015 to 2020. The ecological composition indexes of Baoding, Chengde, Hengshui, Langfang, Langfang, and Xingtai exhibited a downward trend from 2000–2020, while Handan, Shijiazhuang, Tangshan, and Zhangjiakou initially declined from 2000 to 2015, and then increased from 2015 to 2020. Cangzhou showed a trend of declining-uptrend-declining from 2000–2020. Declines in the ecological composition index were attributed to the expansion of urbanization, as urban space occupied ecological space. Qinhuangdao’s ecological quality index showed an uptrend from 2000–2015 but exhibited a slow decline from 2015–2020, while the ecological quality indexes of other prefecture-level cities showed an uptrend. The changes in ecological quality were due to the combined effect of Fraction Vegetation Coverage and total water resources, with FVC being the dominant factor, and total water resources playing an auxiliary role.
5.1.3. Analysis of Changes in Environmental Status
The environmental status index was utilized to quantify the evaluation of environmental status. A higher value on the environmental status index indicates a better environmental status.
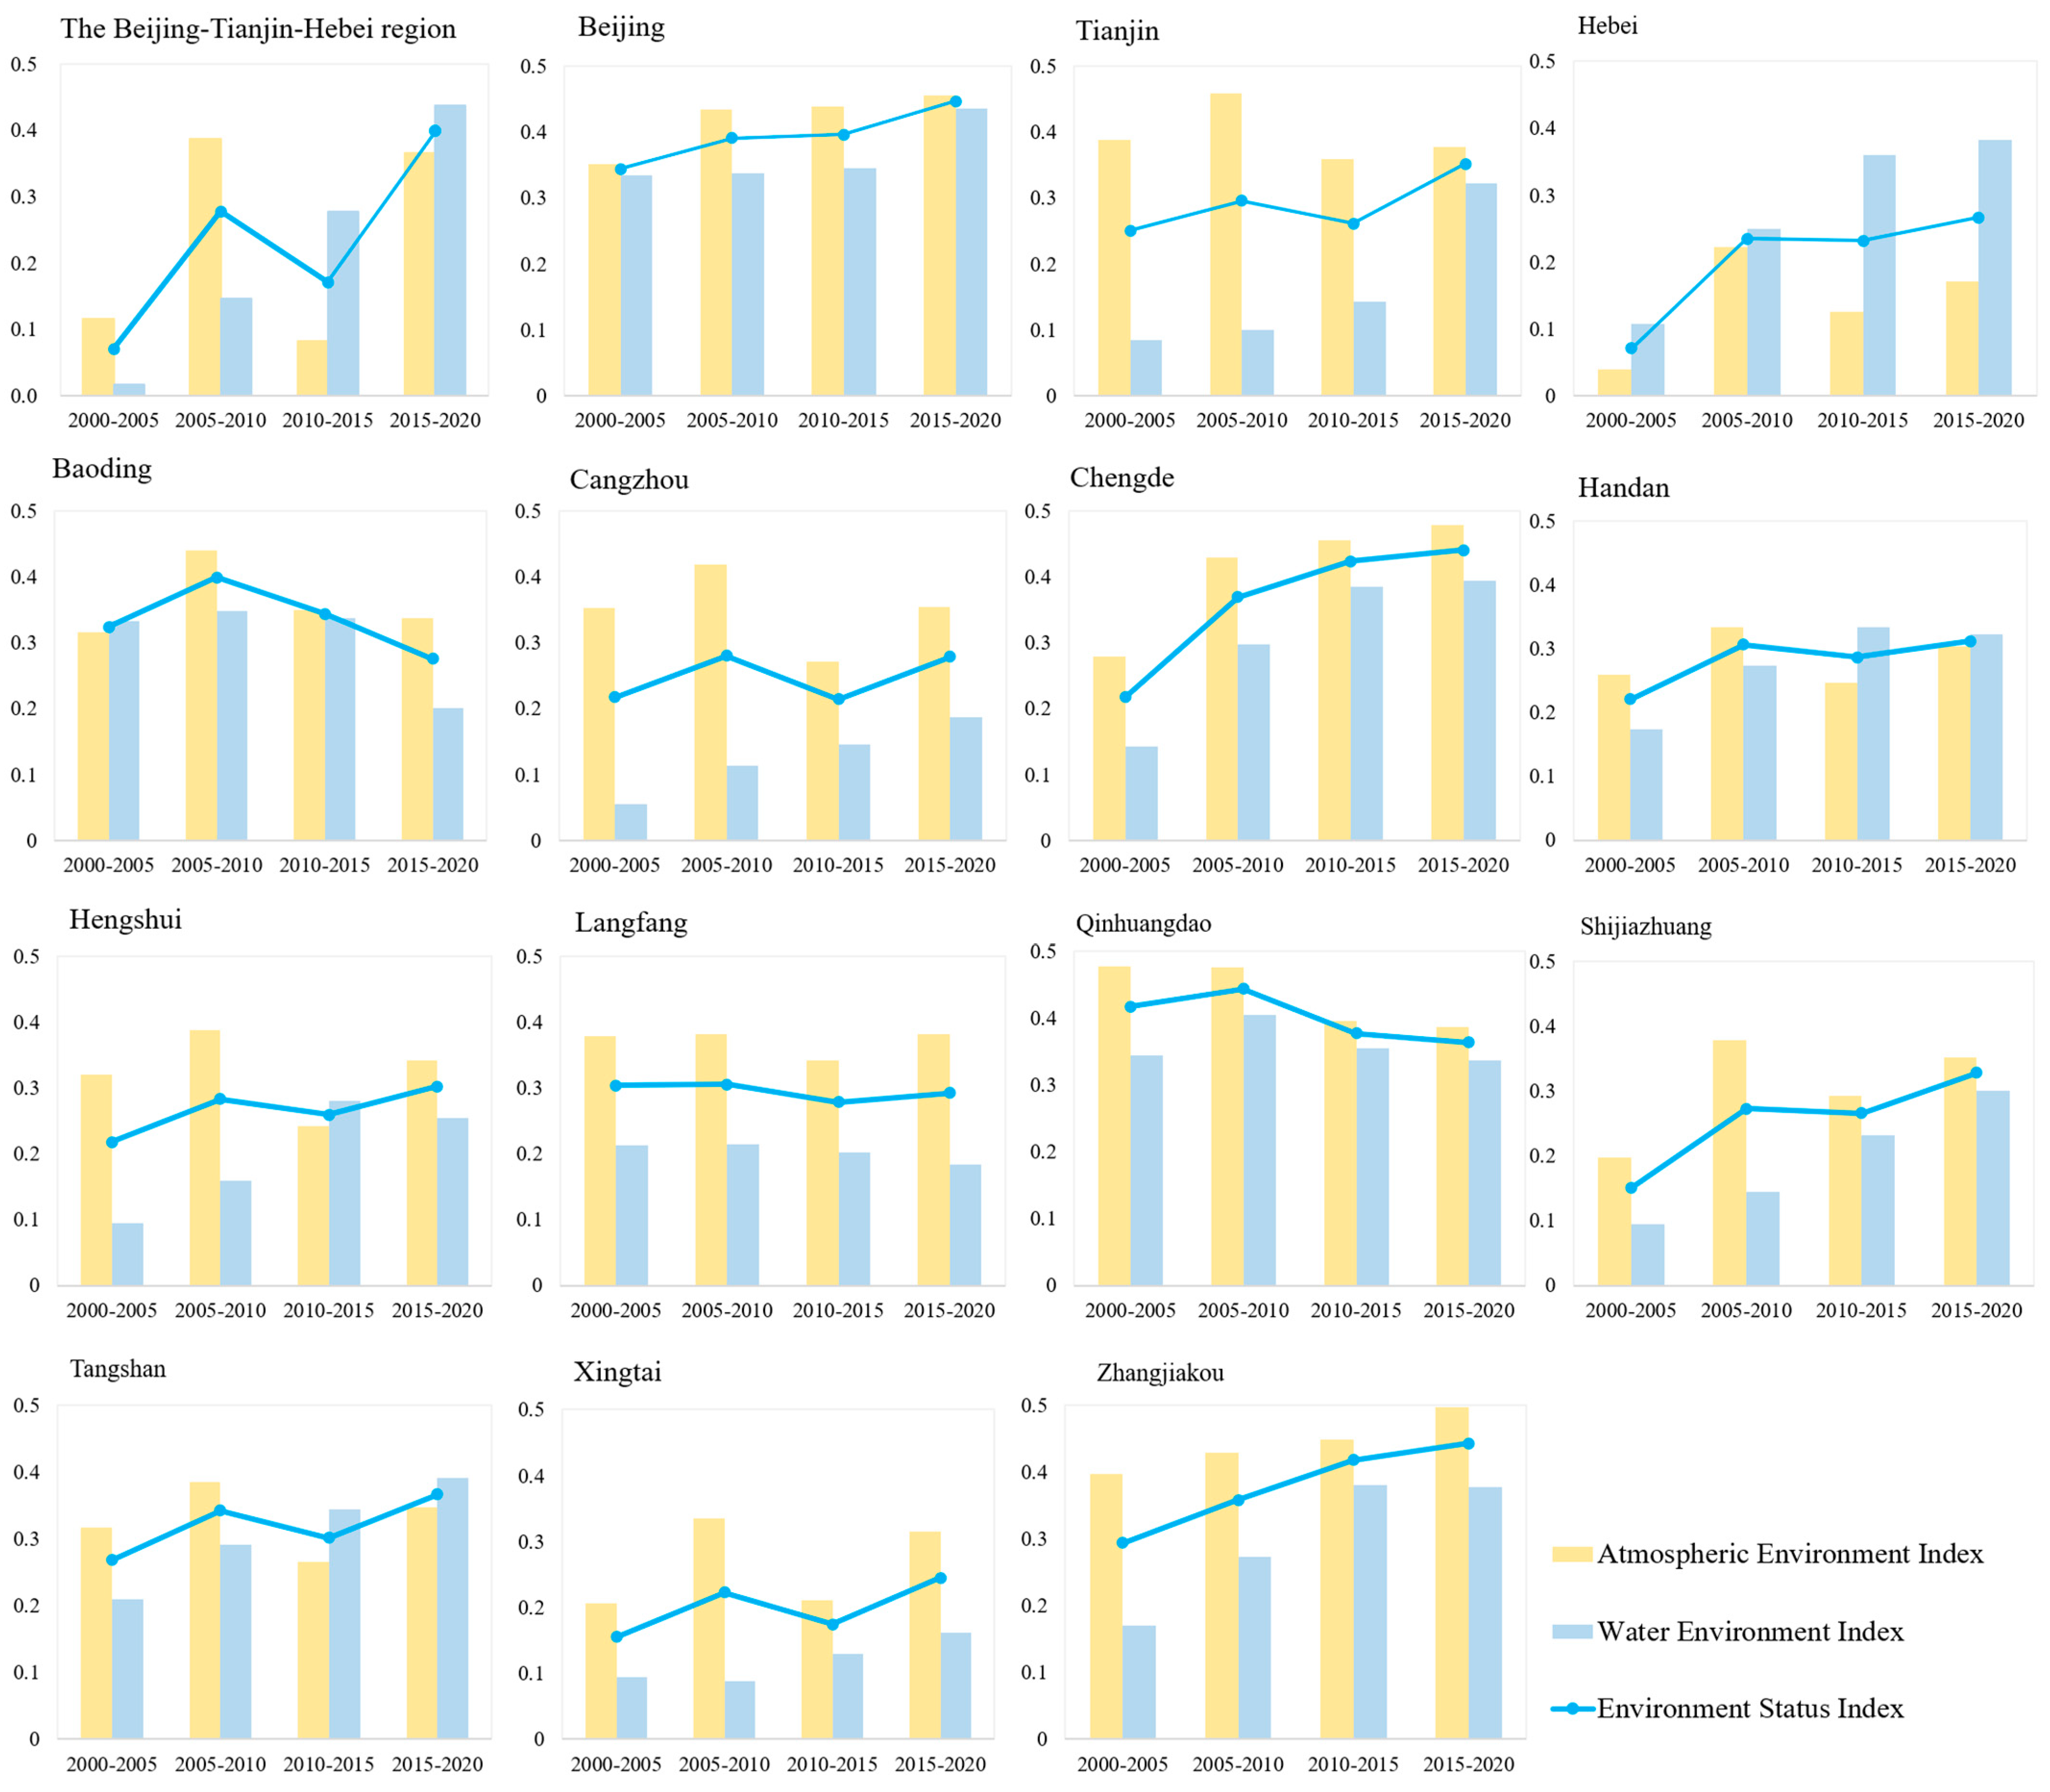
In Figure 8, the environmental status index exhibited a fluctuating and increasing trend. Specifically, the atmospheric environment index displayed an upward-downward-upward trend, suggesting that the atmospheric environment improved continuously during the periods of 2005–2010 and 2015–2020. In 2008, the Beijing–Tianjin–Hebei area and other provinces collaborated to implement the “No. 29 Olympic Games Beijing Air Quality Assurance Measures”, which set higher standards for air quality. Since 2015, with the implementation of the “Beijing-Tianjin Common Development Plan”, the economic and ecological environments of the region have been further strengthened, leading to continuous improvements in environmental conditions. These results indicate that government policies and environmental measures have had a significant positive impact on the environment. Additionally, the water environment index showed an upward trend, reflecting an overall improvement in environmental conditions from 2000 to 2020. This improvement can be attributed to a reduction in wastewater discharge per unit of GDP and the ongoing improvement of water quality.
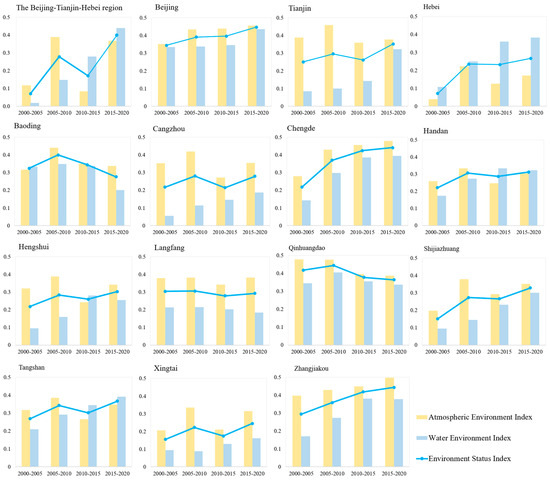
Figure 8.
The changes in environmental status indexes in the Beijing–Tianjin–Hebei region, the provinces (Beijing, Tianjin, and Hebei) and the prefecture-level cities of Hebei.
In the case of provinces, the environmental status index of Beijing and Hebei showed an increasing trend, while Tianjin showed a fluctuating upward trend. Among the three, Beijing had the best environmental status, followed by Tianjin and Hebei. This may be attributed to the fact that Beijing and Tianjin have placed a higher priority on environmental protection and have implemented more effective policies and measures to improve the environment. In terms of atmospheric environment, the atmospheric environment index of Beijing and Tianjin showed a continuous upward trend, while Hebei’s index showed an upward-downward-upward trend. The second-level indicators of atmospheric environment in Beijing and Tianjin were better than those of Hebei, especially in terms of sulfur dioxide and nitrogen dioxide emissions (Figure 6). In terms of water environment, the water environment index of Beijing, Tianjin, and Hebei continued to improve. This may be attributed to the fact that the amount of wastewater discharge per unit of GDP has decreased, and the water quality has improved. Overall, the efforts of government policies and measures have played a significant role in improving the environmental status in the region.
The changes in the environmental status, atmospheric environment, and water environment indices of Hebei prefecture cities exhibited spatial heterogeneity. Baoding and Qinhuangdao showed an uptrend from 2000–2010, but weakened from 2010–2020 in terms of the environmental status index, while Chengde and Zhangjiakou showed an increasing trend from 2000–2020. Cangzhou, Handan, Hengshui, Langfang, Shijiazhuang, Tangshan, and Xingtai exhibited an increased-decreased-increased trend. Regarding the atmospheric environmental index, Cangzhou, Hengshui, Langfang, Shijiazhuang, Tangshan, and Xingtai showed an uptrend-downtrend-uptrend pattern, while Baoding and Handan showed an uptrend-downtrend pattern. Chengde and Zhangjiakou’s atmospheric environment has been consistently increasing in quality since 2000, while Qinhuangdao has experienced a decreasing trend. Concerning the water environmental index, Cangzhou, Chengde, and Shijiazhuang have continued to improve since 2000. Baoding, Langfang, and Qinhuangdao showed an increasing trend from 2000 to 2010, followed by a decreasing trend from 2010 to 2020. Handan, Hengshui, Tangshan, Xingtai, and Zhangjiakou exhibited an increasing trend from 2000 to 2015, followed by a decreasing trend from 2015 to 2020.
The fluctuations in the indexes can be attributed to multiple factors, including government policies, geographical location, and the function of cities. On the one hand, Beijing’s strict environmental protection policies have influenced Baoding, Chengde, Zhangjiakou, and other surrounding cities to improve their environmental conditions. On the other hand, Handan, Shijiazhuang, and Xingtai are heavy industrial cities that require special attention and improvement in terms of environmental protection. Additionally, regional economic development and industrial structure can also play a role in the variation of environmental indexes among cities.
5.2. Spatiotemporal Coupling Changes
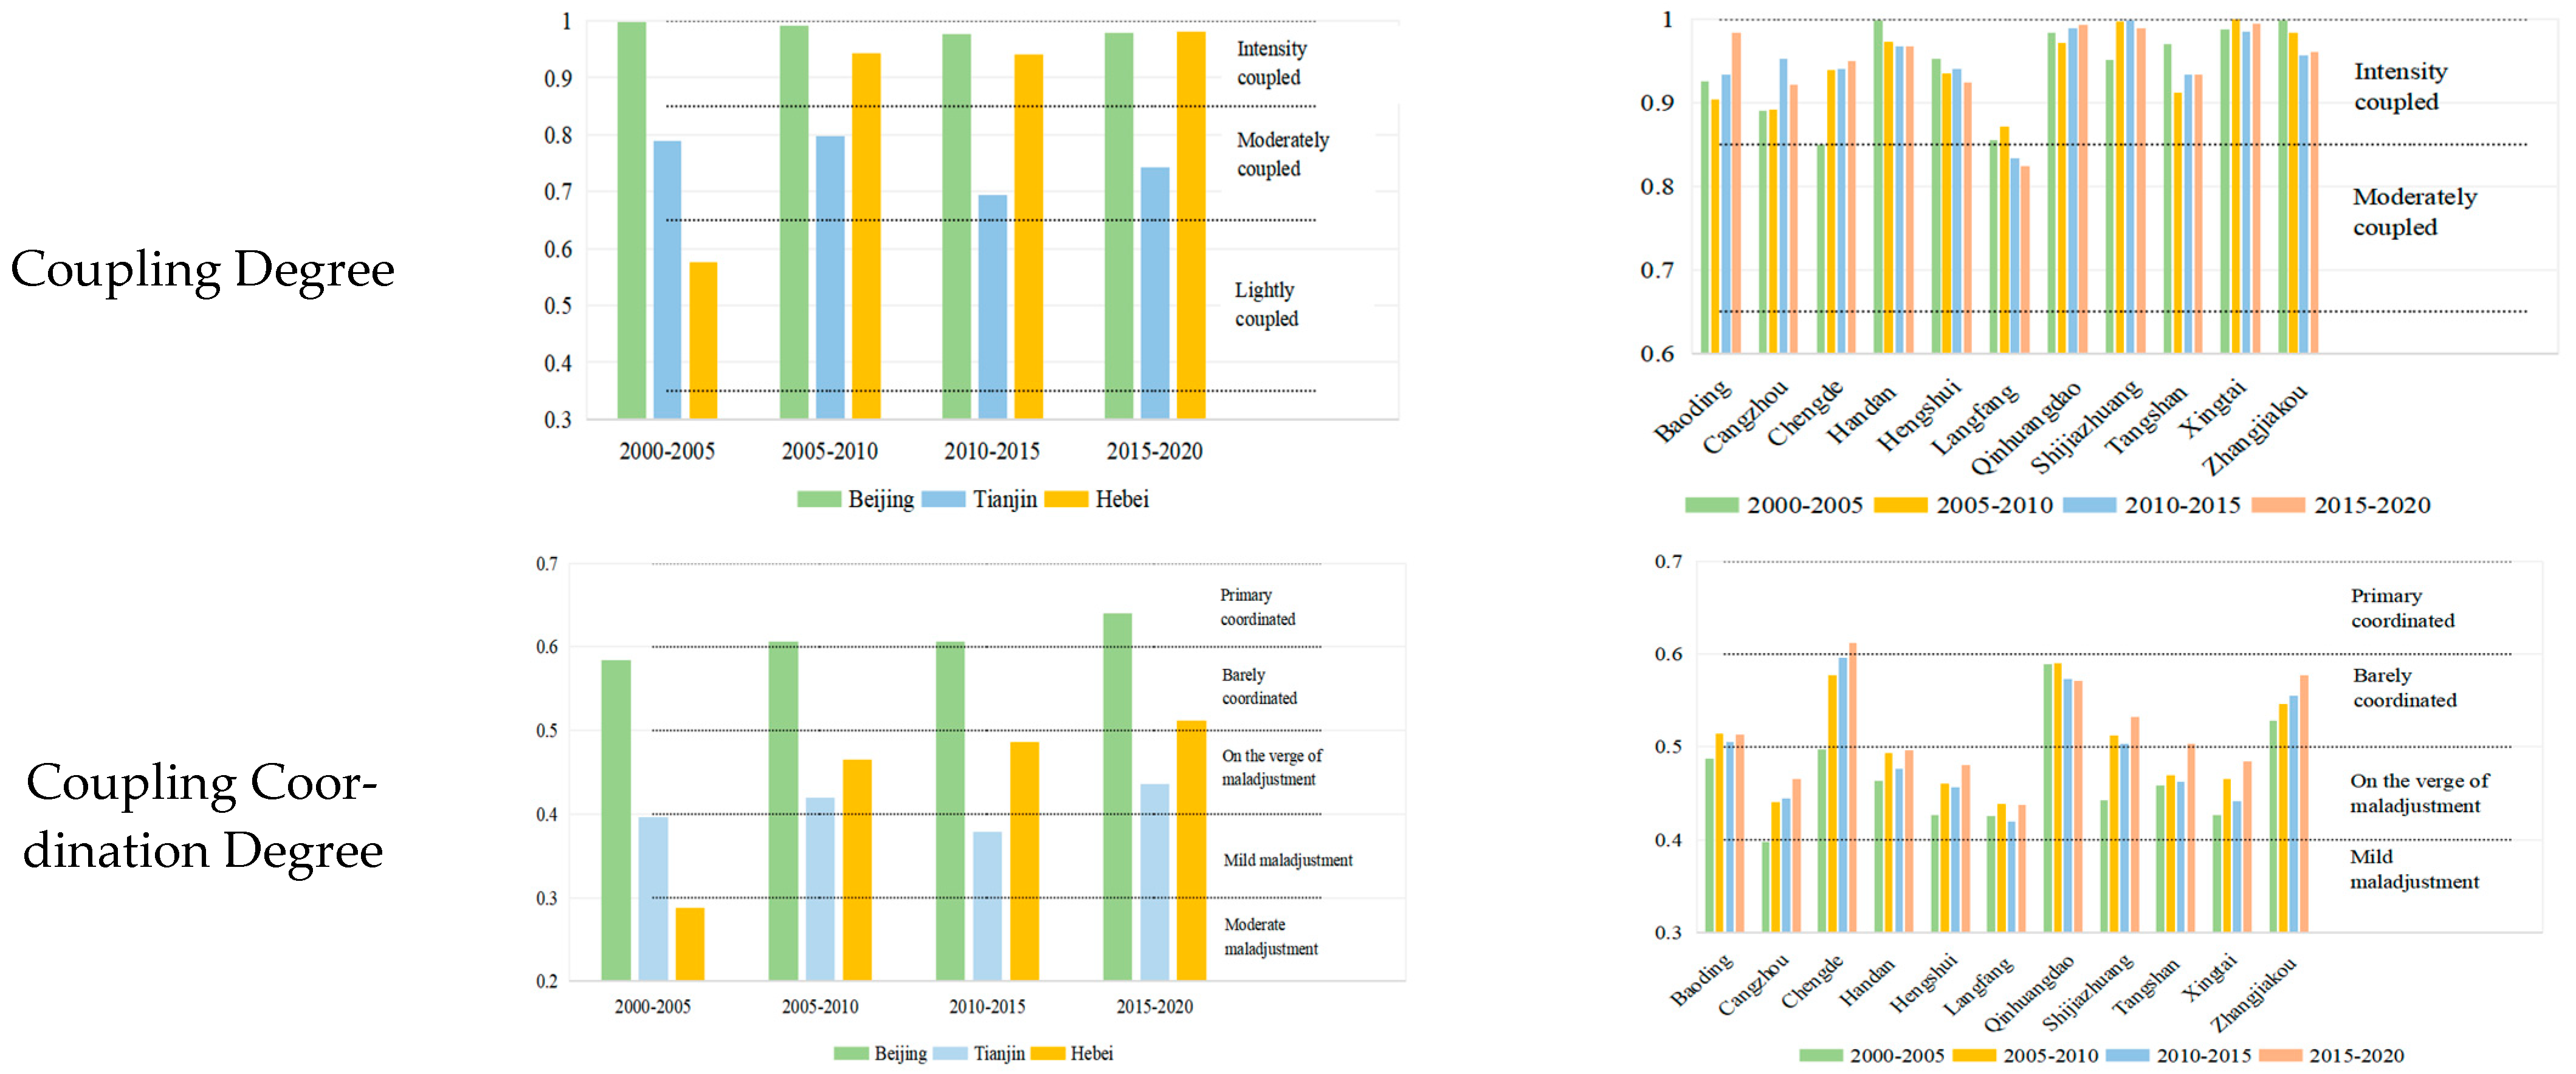
The coupling degree represents the strength of interaction among the economy, ecology, and environment in the Beijing–Tianjin–Hebei region. The overall coupling degree has changed from moderately coupled to intensively coupled since 2005, indicating that the coupling relationship among the economy, ecology, and environment has continuously increased. As shown in Table 4, the coupling degree reached its highest level in 2005–2010, with a value of 0.9981, and then slightly decreased until it became 0.9800 in 2015–2020. The reduction in the coupling degree was mainly due to the asynchronous development of the economy, ecology, and environment [74].
Table 4.
Changes in CD and CCD in the Beijing–Tianjin–Hebei region.
According to Figure 9, with regard to the coupling degree of provinces, Beijing’s CD exceeded 0.97 throughout the period from 2000 to 2020, indicating an intense coupling relationship between economic, environmental, and ecological development in the region. Tianjin’s CD remained around 0.7 from 2000 to 2020, indicating a moderate coupling relationship between these three factors. Hebei’s coupling degree changed over time, with a light coupling relationship between 2000 and 2005, followed by a transition to an intense coupling relationship from 2005 to 2020. This illustrates the changing and diverse dynamics of economic, environmental, and ecological development in different regions.
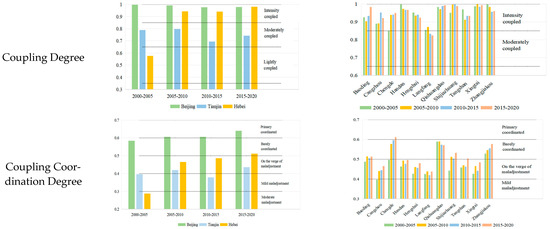
Figure 9.
Changes in the CD and CCD of economy, ecology, and environment.
In terms of the Hebei prefecture cities (Figure 9), all Hebei prefectures except Langfang displayed high levels of intense coupling from the year 2000 through to 2020. Table 5 presents the variation in coupling degree and the relationship between economy, ecology, and environment in Hebei. From 2000 to 2005, six prefecture-level cities in the Hebei province (Baoding, Zhangjiakou, Handan, Langfang, Qinhuangdao, and Tangshan) exhibited a strong coupling relationship, with environmental development surpassing both economic and ecological development. However, between 2005 and 2010, the implementation of environmental policies resulted in an increase in the number of cities where environmental development surpassed economic and ecological development, with nine cities exhibiting this trend. From 2010 to 2015, the economic development of Xingtai, Cangzhou, and Hengshui improved, while Langfang’s coupling degree of economy, ecology, and environment had dropped to a moderately coupled relationship. As of 2020, Langfang’s economic development level had exceeded its environmental and ecological development levels, indicating an unbalanced coupling relationship. Furthermore, Baoding’s ecological status also improved during this time period. These developments demonstrate the changing dynamics of the relationship between economic growth, environmental protection, and ecological sustainability in the Hebei province over the past two decades.
Table 5.
The CD and relationship between economy, ecology, and environment.
5.3. Changes in Spatiotemporal Coupling Coordination
The spatiotemporal changes in coupling coordination between Beijing, Tianjin, and Hebei (as shown in Table 4) demonstrated a fluctuating increase from 2000 to 2020, shifting from mild maladjustment to a state of barely coordinated coupling. This suggests that the coupling coordination between the economy, ecology, and environment has been continually strengthened over the past two decades.
Driven by the economy of Beijing and Tianjin, the urban infrastructure of Hebei has gradually improved, with Beijing showing the most coordinated development in terms of coupling coordination, followed by Hebei, and Tianjin showing the worst degree of coupling coordination (Figure 9). Specifically, Beijing showed a state of bare coordination in 2000–2005 and primary coordination in 2005–2020. Tianjin showed mild maladjustment in 2000–2005 and 2010–2015 and was on the verge of maladjustment in 2005–2010 and 2015–2020. Meanwhile, Hebei exhibited moderate maladjustment in 2000–2005, was on the verge of maladjustment in 2005–2015, and showed bare coordination in 2015–2020.
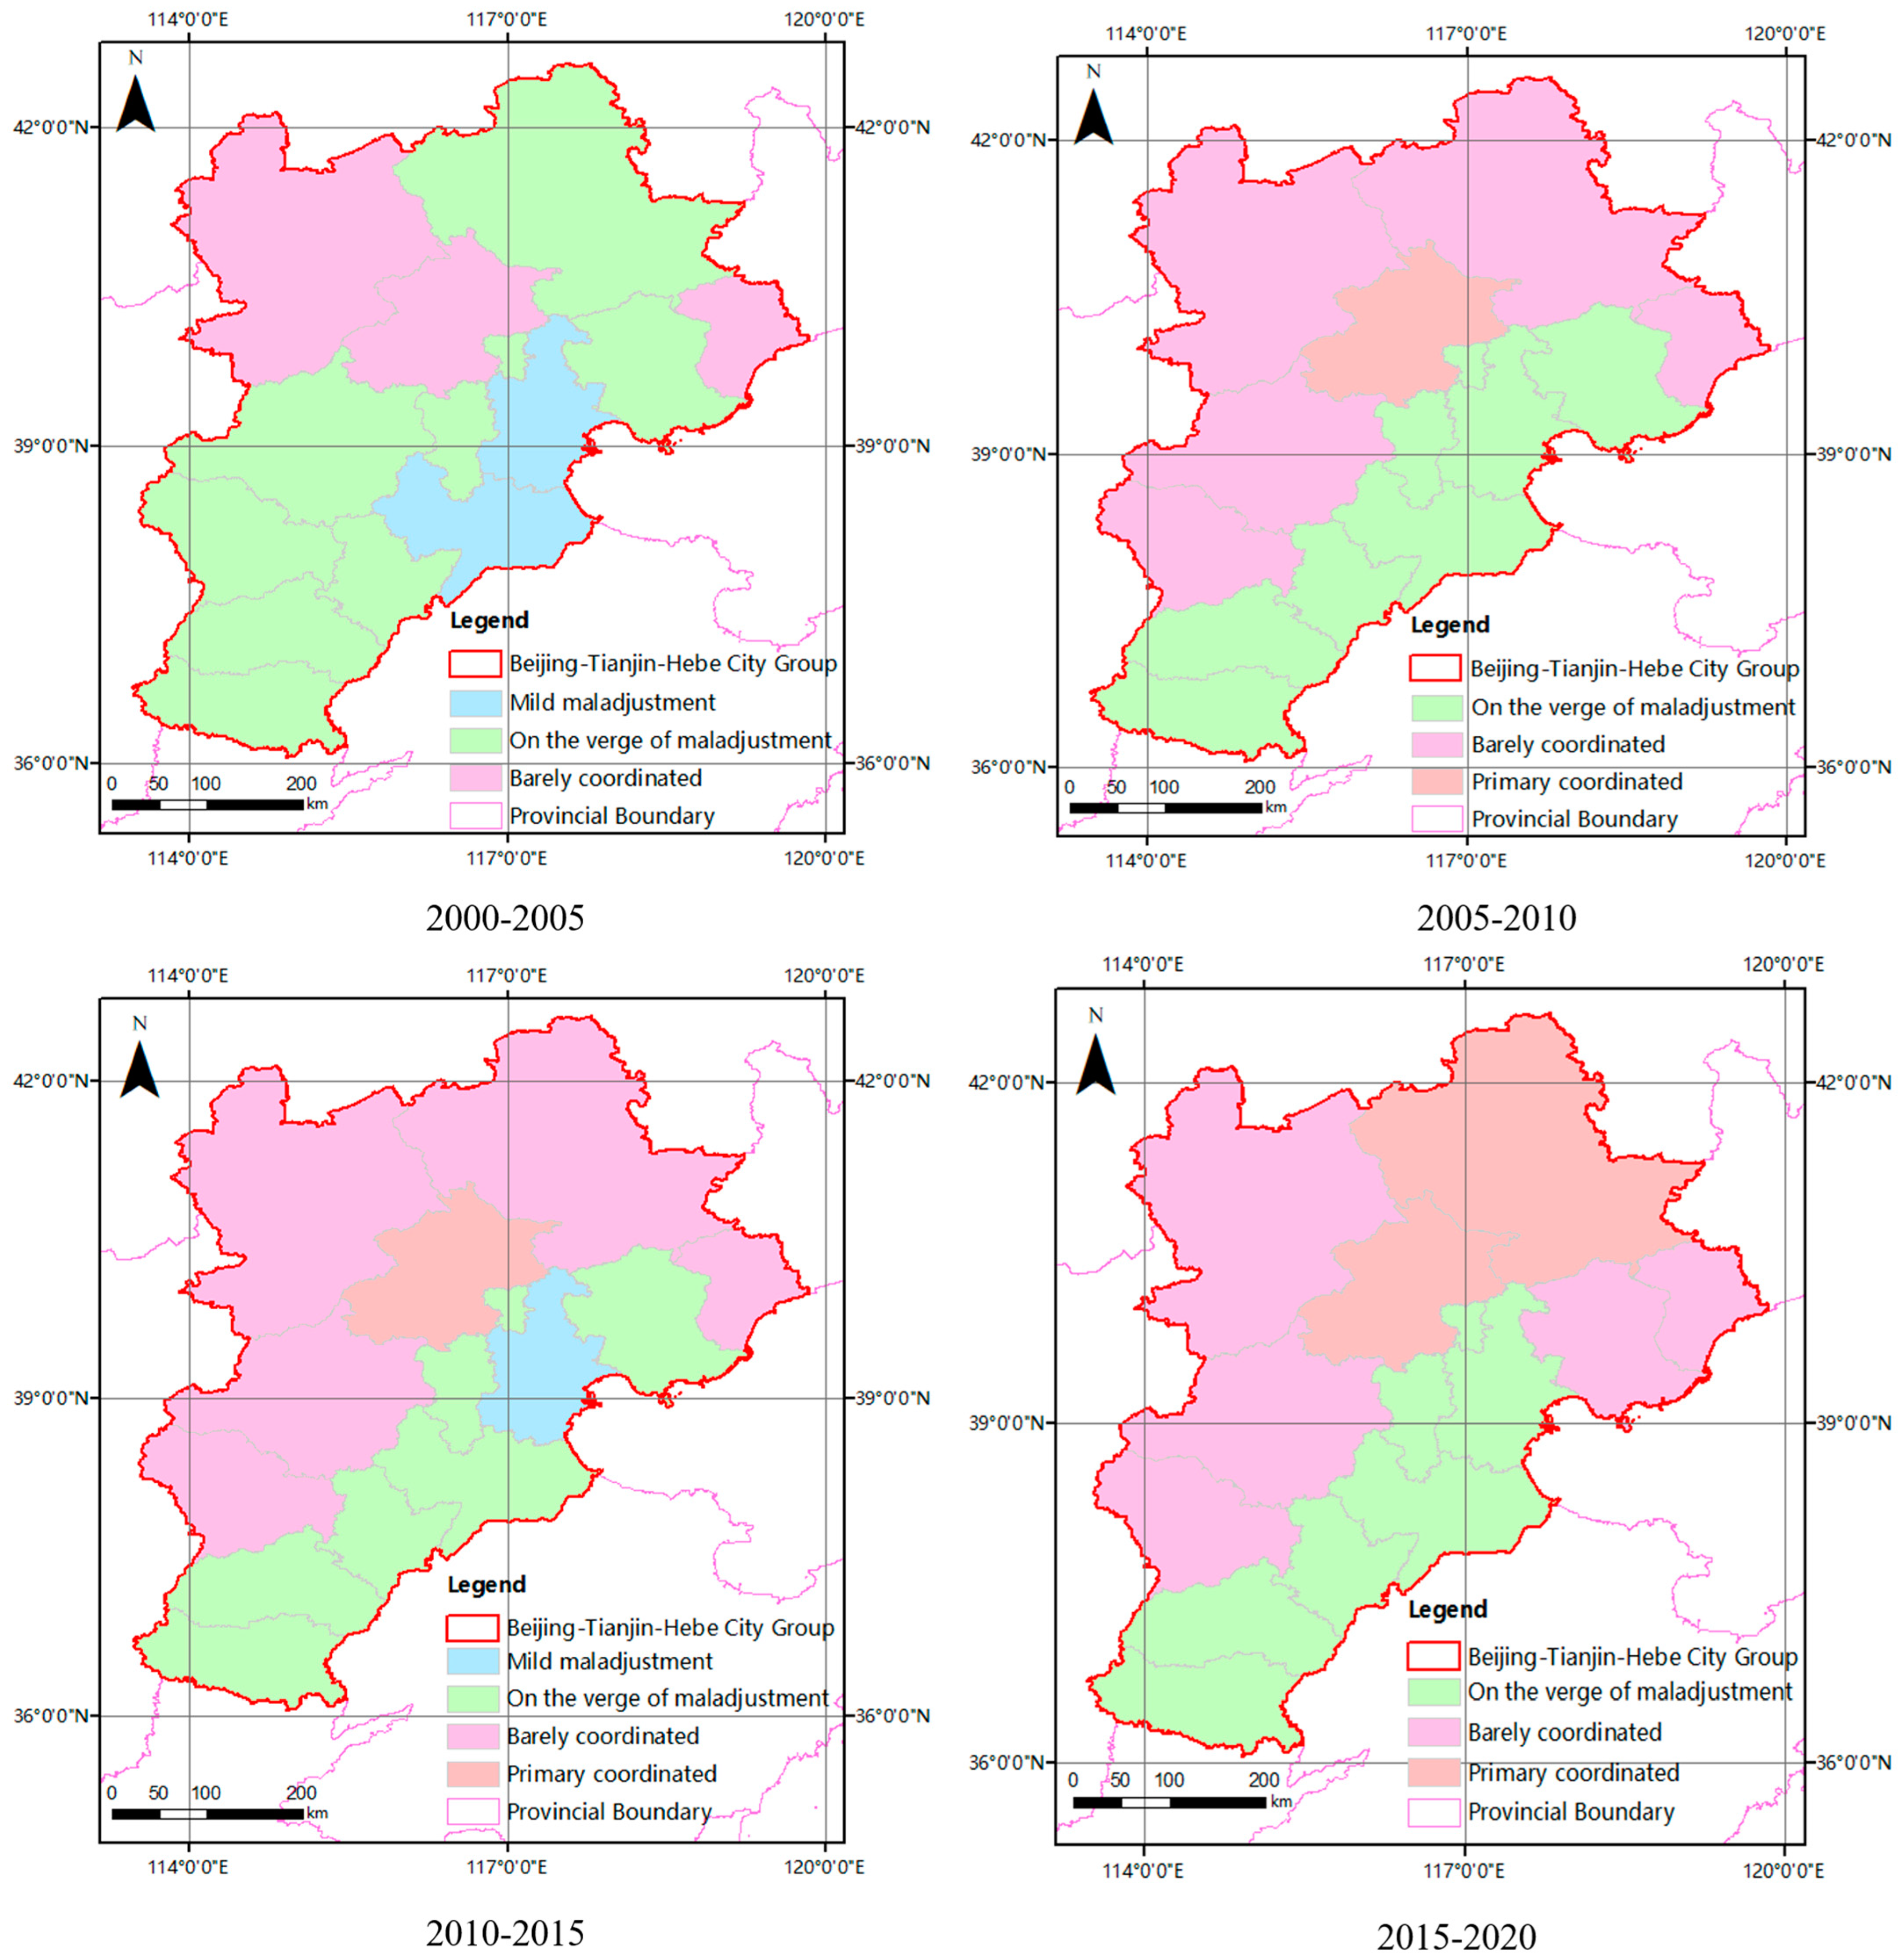
At the level of Hebei prefecture cities (Figure 9 and Figure 10), there were spatiotemporal differences in the CCD. The integration of Beijing–Tianjin–Hebei and the continuous urbanization of all cities contributed to this. Baoding, Cangzhou, and Shijiazhuang experienced a significant increase in CCD from 2005 onwards. Handan, Hengshui, Langfang, Xingtai, and Zhangjiakou’s CCD remained relatively stable between 2000 and 2020, with Zhangjiakou showing barely coordinated development. The other prefecture-level cities were all on the verge of maladjustment. From 2000 to 2020, Chengde underwent several stages, being on the verge of maladjustment, then barely coordinated, and finally primary coordinated development. Tangshan was on the verge of maladjustment between 2000 and 2015, and barely coordinated between 2015 and 2020.
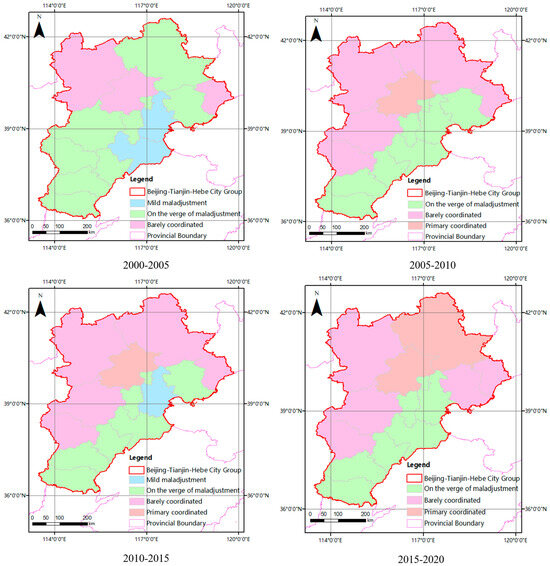
Figure 10.
The spatial changes of the CCD of Beijing, Tianjin, and Hebei’s prefecture cities.
6. Discussion
6.1. The Reasons for Differences in Coupling and Coordination Degrees
The findings of this research, along with prior studies [75], reveal that the exponential alterations in economic development, ecological and environmental status, as well as the degree of coupling (CD) and coordination (CCD), exhibited substantial variations over time and space. The fundamental factor contributing to the coupling coordination of the economy, ecology, and environment was the lack of alignment in their respective developmental trajectories [76]. This can be attributed to several key factors.
The foremost factor responsible for the changes in coupling coordination was the regulatory framework and requirements of instituted policies. For instance, the adoption of the “Beijing-Tianjin Joint Association Development Plan” in 2015 and other related policies have facilitated the integration of the Beijing–Tianjin–Hebei region. The Beijing–Tianjin–Hebei integration is a major strategy proposed by the Chinese government [77], with implications that the Beijing–Tianjin–Hebei region with Beijing, Tianjin, and the central part of Hebei Province as the core should strengthen coordinated development and deepen cooperation in economic, social, and environmental aspects, and form a regional integrated development model of coordinated development and common prosperity. It aims to promote the coordinated development of the Beijing–Tianjin–Hebei region, encourage the optimal allocation of resources, and stimulate the formation of a more efficient, coordinated and sustainable development pattern. The implementation of policies provides a driving force and measurable goals for regional coordinated development [16,60,74]; this can be reflected in the gradual improvement of economic development level (Figure 6 and Figure 7) and ecological environment improvement (Figure 6, Figure 7 and Figure 8).
Secondly, the functional characteristics of cities directly influenced the development trajectory of various subsystems [3,16,22]. For instance, Beijing serves as the political, cultural, transportation, and economic hub of the country, Tianjin is the primary economic center of the Bohai Sea region, and Hebei is primarily known for its heavy industrial activities. In other words, the differences in urban functions in the Beijing–Tianjin–Hebei region result in significant differences in the economy, ecology, and environment of each city.
The significance of cities can manifest in various ways, including their economic, ecological, and environmental impacts. Among the cities in China, Beijing and Tianjin stand out as particularly crucial, due to their status as major centers of commerce [16,51]. Similarly, Shijiazhuang, as the capital of the Hebei province, assumes a central role in regional development and governance. As shown in Figure 6, the difference in economic industrial structure is consistent with this, and the proportion of primary industry in Hebei is higher than that in Beijing and Tianjin, while the proportion of tertiary industry in Beijing and Tianjin is higher than that in Hebei.
The economic significance of Beijing and Tianjin is evident in their positions as major hubs of trade and investment. These cities serve as gateways to international markets, attracting foreign capital and fostering the growth of domestic industries. As such, they play an essential role in driving China’s economic development and modernization. This result is also proved in Figure 5 and Figure 6: Beijing has the fastest economic development, followed by Tianjin, and Hebei has the worst economy.
Moreover, the ecological impact of these cities cannot be ignored. Rapid urbanization and industrialization have resulted in significant environmental challenges, such as air pollution and water scarcity. Addressing these issues requires comprehensive and sustainable strategies that take into account the unique features of each city.
Similarly, as the provincial capital of Hebei, Shijiazhuang plays a vital role in promoting regional development and enhancing environmental protection efforts. By focusing on sustainable growth and adopting innovative approaches to environmental management, Shijiazhuang can set an example for other cities in the province and contribute to China’s broader efforts to promote sustainable development.
In conclusion, the importance of cities like Beijing, Tianjin, and Shijiazhuang can be seen in their economic, ecological, and environmental impacts (Figure 5, Figure 6, Figure 7, Figure 8, Figure 9 and Figure 10). These cities play essential roles in driving China’s development and shaping its future trajectory, making it crucial to prioritize their development and sustainability.
6.2. Sources of Uncertainty
Differences in data sources can significantly impact the results of ecological analyses. In the context of assessing ecological quality, the use of FVC data that does not distinguish between artificial and natural vegetation can be problematic. This is because artificial vegetation may have different ecological functions and properties compared to natural vegetation, and therefore may cause uncertainty when evaluating overall ecological quality.
Moreover, when analyzing ecological patterns, it is essential to differentiate between different types of land use, such as agricultural, ecological, and urban spaces. Failure to do so can lead to an overestimation of ecological quality, as the ecological functions and values of these different spaces may differ significantly. This overestimation, in turn, can lead to differences in the calculation of ecological indicators such as CD and CCD in the Beijing–Tianjin–Hebei region.
The potential for errors in sulfur dioxide and nitrogen dioxide emissions data arises from inconsistencies in data sources. Specifically, the data for emissions from 2005 to 2017 were derived from calculations based on OMI satellite measurements, while data for the years 2000–2004 and 2018–2020 were obtained from the environmental state bulletin. The variation in data sources may ultimately impact assessments of atmospheric environmental changes.
7. Conclusions and Suggestions
7.1. Conclusions
For this study, we selected the Beijing–Tianjin–Hebei region as the study area and developed a comprehensive evaluation system that considered the economy, ecology, and environment. In addition to examining changes in economic and ecological conditions, we also included environmental factors and introduced four indicators (sulfur dioxide emissions, nitrogen dioxide emissions, Aerosol Optical Depth, and the number of days with air quality better than Grade II) to describe the atmospheric environment. We used wastewater discharge and water quality to describe the water environment. Using the CD and CCD models, we analyzed changes in the economy, ecology, and environment from 2000 to 2020, as well as the temporal and spatial variations in CD and CCD. The main research findings were as follows:
The CD in Beijing–Tianjin–Hebei region changed from moderately coupled to intensely coupled, indicating that economic development, ecology, and environment were mutually reinforcing. The entire region has continued to strengthen the CCD of the economy, ecology, and environment since 2000, resulting in a change from moderate maladjustment to bare coordination. From 2000 to 2020, there was asynchronous development among the economy, ecology, and environment in the region, resulting in differences in the CD and CCD of the economy, ecology, and environment. The Beijing–Tianjin–Hebei region exhibited significant differences in CD and CCD at the whole, provincial, and prefecture-level city scales, highlighting the presence of significant spatial heterogeneity in the study results across different scales of analysis.
Regarding the economy, the study area exhibited an overall upward trend, with continuous optimization of the economic industrial structure and improved resource utilization efficiency. Beijing showed the most significant improvement in economic development, followed by Tianjin, while Hebei’s economic development remained relatively slow.
Regarding ecological status, the Beijing–Tianjin–Hebei region showed volatility, with continued improvement in ecological quality, but a reduction in ecological space, leading to a downtrend in the ecological pattern index. Beijing and Tianjin had better ecological status than Hebei, and there is a need to improve Hebei’s ecological composition and quality.
Regarding environmental status, the Beijing–Tianjin–Hebei region exhibited an overall upward trend with fluctuations. The atmospheric environment showed a trend of first improvement, then slight deterioration, and finally improvement, while the water environment showed a continuous improvement trend. Beijing had the best environmental conditions, and Tianjin and Hebei need to improve their environmental status.
7.2. Suggestion
By considering the characteristics of coupling coordination among the economy, ecology, and environment, a targeted optimization strategy has been developed to optimize the coupling coordination of the economic–ecological–environmental system and achieve sustainable development in the Beijing–Tianjin–Hebei region. The strategy focuses on three aspects and aims to promote sustainability through targeted interventions.
Firstly, it is recommended to continue ecological environment synergistic governance in the Beijing–Tianjin–Hebei region to further promote regional economic integration, with a focus on Beijing’s green development as a driving force for innovation and development.
Secondly, efforts should be made to promote industrial structure optimization and ecological environment systemization, with a focus on stabilizing and enhancing the ecological and environmental protection results in the Tianjin and Hebei Province, while avoiding a rebound in ecological and environmental quality. Measures must be taken to protect ecology and environment and ensure their stability.
Finally, it is suggested to strengthen scientific and technological innovation, reduce energy waste, alleviate environmental pollution caused by energy use, achieve green utilization of energy, and realize green development. We can also use science and technology to achieve scientific environmental governance and environmental restoration.
This study also has some limitations, with the uncertainty of the data being the main factor. This may have caused grading errors in the coordination evaluation results and affected the final decision results. It is suggested that a variety of methods are employed to compare and verify the data, select more accurate evaluation indicators, and test the reliability of the data.
Author Contributions
Conceptualization, Y.Z., P.H. and J.J.; Formal analysis, Y.Z.; Data curation, Y.Z., P.H., J.J., J.Z. and Y.C.; Writing—original draft, Y.Z. All authors have read and agreed to the published version of the manuscript.
Funding
This research received no external funding.
Data Availability Statement
The original contributions presented in the study are included in the article, further inquiries can be directed to the corresponding author.
Conflicts of Interest
The authors declare no conflicts of interest.
References
- Huang, J.C.; Na, Y.; Guo, Y. Spatiotemporal characteristics and driving mechanism of the coupling coordination degree of urbanization and ecological environment in Kazakhstan. J. Geogr. Sci. 2020, 30, 1802–1824. [Google Scholar] [CrossRef]
- Zhao, G.L.; Liang, R.F.; Li, K.F.; Wang, Y.M.; Pu, X.C. Study on the coupling model of urbanization and water environment with basin as a unit: A study on the Hanjiang Basin in China. Ecol. Indic. 2021, 131, 108130. [Google Scholar] [CrossRef]
- Cui, X.G.; Fang, C.L.; Liu, H.M.; Liu, X.F. Assessing sustainability of urbanization by a coordinated development index for an urbanization-resources-environment complex system: A case study of jing-jin-ji region, china. Ecol. Indic. 2019, 96, 383–391. [Google Scholar] [CrossRef]
- Feng, Y.X.; Li, G.D. Interaction between urbanization and eco-environment in the Tibetan Plateau. J. Geogr. Sci. 2021, 31, 298–324. [Google Scholar] [CrossRef]
- Li, J.C.; Yuan, W.H.; Qin, X.N.; Qi, X.X.; Meng, L. Coupling coordination degree for urban green growth between public demand and government supply in urban agglomeration: A case study from China. J. Environ. Manag. 2022, 304, 114209. [Google Scholar] [CrossRef] [PubMed]
- Peng, B.H.; Sheng, X.; Wei, G. Does environmental protection promote economic development? From the perspective of coupling coordination between environmental protection and economic development. Environ. Sci. Pollut. Res. 2020, 27, 39135–39148. [Google Scholar] [CrossRef] [PubMed]
- Sun, Y.; Zhang, X.; Peng, H.; Zhou, W.T.; Jiang, A.N.; Zhou, F.; Wang, H.; Zhang, W.S. Development of a coupled model to simulate and assess arsenic contamination and impact factors in the Jinsha River Basin, China. J. Environ. Sci. 2025, 147, 50–61. [Google Scholar] [CrossRef]
- Lee, C.C.; Wang, F.; Chang, Y.F. Towards net-zero emissions: Can green bond policy promote green innovation and green space? Energy Econ. 2023, 121, 106675. [Google Scholar] [CrossRef]
- Zhu, P.; Zhang, Z.J.; Lin, B. Understanding spatial evolution of global climate change risk: Insights from convergence analysis. J. Clean. Prod. 2023, 413, 137423. [Google Scholar] [CrossRef]
- Gao, S.; Jiang, J.; Zhu, S.; Aslam, B.; Wang, W. Nonlinear influence of per capi-ta carbon emissions, newborn birth rate, renewable energy, industrialization, and eco-nomic growth on urbanization: New evidence from panel threshold model. Energy Strategy Rev. 2024, 51, 101305. [Google Scholar] [CrossRef]
- Ghita, S.I.; Saseanu, A.S.; Gogonea, R.M.; Huidumac-Petrescu, C.E. Perspectives of ecological footprint in European context under the impact of information society and sustainable development. Sustainability 2018, 10, 3224. [Google Scholar] [CrossRef]
- Uzar, U. The Relationship between Institutional Quality and Ecological Footprint: Is There a Connection? Natural Resources Forum; Blackwell Publishing Ltd.: Oxford, UK, 2021; Volume 45, pp. 380–396. [Google Scholar]
- United Nations (UN). The Sustainable Development Goals Report: Special Edition; United Nations: New York, NY, USA, 2023. Available online: https://unstats.un.org/sdgs/report/2023/The-Sustainable-Development-Goals-Report-2023.pdf (accessed on 26 March 2024).
- Chen, X.H.; Zhou, F.Y.; Hu, D.B.; Yi, G.D.; Cao, W.Z. An improved evaluation method to assess the coordination between mineral resource exploitation, economic development, and environmental protection. Ecol. Indic. 2022, 138, 108808. [Google Scholar] [CrossRef]
- Luo, D.; Liang, L.D.; Wang, Z.B.; Chen, L.K.; Zhang, F.M. Exploration of coupling effects in the Economy–Society–Environment system in urban areas: Case study of the Yangtze River Delta Urban Agglomeration. Ecol. Indic. 2021, 128, 107858. [Google Scholar]
- Xiang, M.; Zhang, S.; Ruan, Q.; Tang, C.; Zhao, Y. Definition and calculation of hierarchical ecological water requirement in areas with substantial human activity—A case study of the Beijing–Tianjin-Hebei region. Ecol. Indic. 2022, 138, 108740. [Google Scholar] [CrossRef]
- Yasin, I.; Ahmad, N.; Chaudhary, M.A. The impact of financial development, political institutions, and urbanization on environmental degradation: Evidence from 59 less-developed economies. Environ. Dev. Sustain. 2021, 23, 6698–6721. [Google Scholar] [CrossRef]
- Yasin, I.; Ahmad, N.; Chaudhary, M.A. Catechizing the Environmental-Impression of Urbanization, Financial Development, and Political Institutions: A Circumstance of Ecological Footprints in 110 Developed and Less-Developed Countries. Soc. Indic. Res. 2020, 147, 621–649. [Google Scholar] [CrossRef]
- Wang, J.; Zhao, M.; Zhong, W.; Li, J.B.; Zheng, C.Y. Coupling Relationship of Urban Development and the Eco-Environment in Guanzhong Region, China. Sustainability 2022, 14, 2969. [Google Scholar] [CrossRef]
- Qiao, R.; Li, H.M.; Han, H. Spatio-temporal coupling coordination analysis between urbanization and water resource carrying capacity of the provinces in the yellow river basin, China. Water 2021, 13, 376. [Google Scholar] [CrossRef]
- Wan, J.; Zhang, L.W.; Yan, J.P.; Wang, X.M.; Wang, T. Spatial-temporal characteristics and influencing factors of coupled coordination between urbanization and eco-environment: A case study of 13 urban agglomerations in China. Sustainability 2020, 12, 8821. [Google Scholar] [CrossRef]
- Wang, Y.; Liu, H.; Chen, X.H.; Song, Y.T. Evolution characteristics and division of regional types of correlation coupling of urban-rural systems: A case study of the three provinces of Northeast China. Sci. Geogr. Sin. 2020, 40, 1150–1159. (In Chinese) [Google Scholar]
- Guo, A.J.; Zhang, Y.N.; Zhong, F.L.; Jiang, D.W. Spatiotemporal patterns of ecosystem service value changes and their coordination with economic development: A case study of the yellow river basin, china. Int. J. Environ. Res. Public Health 2020, 17, 8474. [Google Scholar] [CrossRef] [PubMed]
- Xia, K.; Guo, J.K.; Han, Z.L.; Dong, M.R.; Xu, Y. Analysis of the scientific and technological innovation efficiency and regional differences of the land–sea coordination in China’s coastal areas. Ocean. Coast. Manag. 2019, 172, 157–165. [Google Scholar] [CrossRef]
- Ren, F.; Yu, X. Coupling analysis of urbanization and ecological total factor energy efficiency-A case study from Hebei province in China. Sustain. Cities Soc. 2021, 74, 103183. [Google Scholar] [CrossRef]
- Zhang, Z.X.; Li, Y. Coupling coordination and spatiotemporal dynamic evolution between urbanization and geological hazards-a case study from China. Sci. Total Environ. 2020, 728, 138825. [Google Scholar] [CrossRef] [PubMed]
- Zheng, J.; Hu, Y.J.; Boldanov, T.; Bazarzhapov, T.; Meng, D.; Li, Y.; Dong, S.C. Comprehensive assessment of the coupling coordination degree between urbanization and ecological environment in the Siberian and Far East Federal Districts, Russia from 2005 to 2017. PEERJ 2020, 8, e9125. [Google Scholar] [CrossRef] [PubMed]
- Chen, M.; Chen, H.Q. Study on the coupling relationship between economic system and water environmental system in Beijing based on structural equation model. Appl. Ecol. Environ. Res. 2019, 17, 617–632. [Google Scholar] [CrossRef]
- Wu, H.L.; Peng, D.X.; Wang, L. Model for sustainable development based on system dynamics and energy–economy-environment coordination: A case study of Beijing, China. Energy Sci. Eng. 2021, 9, 828–842. [Google Scholar] [CrossRef]
- Kong, L.Y.; Xu, X.D.; Wang, W.; Wu, J.X.; Zhang, M.Y. Comprehensive evaluation and quantitative research on the living protection of traditional villages from the perspective of “production–living–ecology”. Land 2021, 10, 570. [Google Scholar] [CrossRef]
- Liang, L.; Zhang, F.; Wu, F.; Chen, Y.X.; Qin, K.Y. Coupling coordination degree spatial analysis and driving factor between socio-economic and eco-environment in northern China. Ecol. Indic. 2022, 135, 108555. [Google Scholar]
- Wang, S.J.; Cui, Z.T.; Lin, J.J.; Xie, J.Y.; Su, K. The coupling relationship between urbanization and ecological resilience in the Pearl River Delta. J. Geogr. Sci. 2022, 32, 44–64. [Google Scholar] [CrossRef]
- Xu, D.; Yang, F.; Yu, L.; Zhou, Y.Y.; Li, H.X.; Ma, J.J.; Huang, J.C.; Wei, J.; Xu, Y.; Zhang, C. Quantization of the coupling mechanism between eco-environmental quality and urbanization from multisource remote sensing data. J. Clean. Prod. 2021, 321, 128948. [Google Scholar] [CrossRef]
- Chen, Q.; Qi, P.; Deng, L. Stay or return? The role of city environment and digital economy in migrants in China. Front. Environ. Sci. 2024, 11, 1322955. [Google Scholar] [CrossRef]
- He, L.; Du, X.; Zhao, J.; Chen, H. Exploring the coupling coordination rela-tionship of water resources, socio-economy and eco-environment in China. Sci. Total Environ. 2024, 918, 170705. [Google Scholar] [CrossRef] [PubMed]
- Grilli, G.; Cantillo, T.; Turner, K.; Erazo, J.; López, M.A.M.; Parra, J.S.V.; Cardona, F.G.; Ferrini, S. A decision support procedure for the bioeconomy transition: A colombian case study. J. Environ. Manag. 2024, 352, 120042. [Google Scholar] [CrossRef]
- Akberdina, V.; Lavrikova, Y.; Vlasov, M. Environmental financing: Does digital economy matter? Front. Environ. Sci. 2024, 11, 1268286. [Google Scholar] [CrossRef]
- Tanveer, A.; Song, H.; Faheem, M.; Daud, A. Caring for the environment. How do deforestation, agricultural land, and urbanization degrade the environment? Fresh insight through the ARDL approach. Environ. Dev. Sustain. 2024, 1–36. [Google Scholar] [CrossRef]
- Li, Y.; Lv, Y.; Zhang, Z.; Feng, X.; Chen, X. Coupling coordination evaluation of “Three Waters” system and impulse response analysis in the Yellow River Basin. Sustain. Cities Soc. 2024, 102, 105174. [Google Scholar] [CrossRef]
- Gao, J.Q.; Li, D.; Qiao, G.H.; Jia, Q.R.; Li, S.R.; Gao, H.L. Circular economy strategies in supply chains, enhancing resource efficiency and sustainable development goals. Environ. Sci. Pollut. Res. 2024, 31, 8751–8767. [Google Scholar] [CrossRef] [PubMed]
- Yang, Y.; Cai, Z. Ecological security assessment of the Guanzhong Plain urban agglomeration based on an adapted ecological footprint model. J. Clean. Prod. 2020, 260, 120973. [Google Scholar] [CrossRef]
- Zhu, C.; Fang, C.; Zhang, L.; Wang, X. Simulating the interrelationships among population, water, ecology, and economy in urban agglomerations based on a system dynamics approach. J. Clean. Prod. 2024, 439, 140813. [Google Scholar] [CrossRef]
- Wang, B.; Zhu, J.; Gao, M.; Xie, J.; Yang, L.; Lu, N.; Wang, B. Do the protection and harnessing of river systems promote the society, economy, and ecological environment of cities? A case study of Xi’an, China. Sustain. Cities Soc. 2023, 97, 104761. [Google Scholar] [CrossRef]
- Breuste, J.; Qureshi, S.; Li, J. Applied urban ecology for sustainable urban environment. Urban Ecosyst. 2013, 16, 675–680. [Google Scholar] [CrossRef]
- Yan, X.; Chen, M.; Chen, M.Y. Coupling and Coordination Development of Australian Energy, Economy, and Ecological Environment Systems from 2007 to 2016. Sustainablity 2019, 11, 6568. [Google Scholar] [CrossRef]
- Liu, K.; Qiao, Y.R.; Shi, T.; Zhou, Q. Study on coupling coordination and spatiotemporal heterogeneity between economic development and ecological environment of cities along the Yellow River Basin. Environ. Sci. Pollut. Res. 2021, 28, 6898–6912. [Google Scholar] [CrossRef] [PubMed]
- Shi, T.; Yang, S.Y.; Zhang, W.; Zhou, Q. Coupling coordination degree measurement and spatiotemporal heterogeneity between economic development and ecological environment—Empirical evidence from tropical and subtropical regions of China. J. Clean. Prod. 2020, 244, 118739. [Google Scholar] [CrossRef]
- Han, H.; Guo, L.; Zhang, J.Q.; Zhang, K.Z.; Cui, N.B. Spatiotemporal analysis of the coordination of economic development, resource utilization, and environmental quality in the Beijing-Tianjin-Hebei urban agglomeration. Ecol. Indicators 2021, 127, 1–13. [Google Scholar] [CrossRef]
- Ariken, M.; Zhang, F.; Liu, K.; Fang, C.; Kung, H.T. Coupling coordination analysis of urbanization and eco-environment in Yanqi Basin based on multi-source remote sensing data. Ecol. Indic. 2020, 114, 106331. [Google Scholar] [CrossRef]
- He, G.; Bao, K.; Wang, W.; Zhu, Y.; Li, S.; Jin, L. Assessment of ecological vul-nerability of resource-based cities based on entropy-set pair analysis. Environ. Technol. 2021, 42, 1874–1884. [Google Scholar] [CrossRef] [PubMed]
- Zhang, X.; Simayi, Z.; Yang, S.; Mamitimin, Y.; Shen, F.; Zhang, Y. Vulnerability Assessment of Ecological–Economic–Social Systems in Urban Agglomerations in Arid Regions—A Case Study of Urumqi–Changji–Shihezi Urban Agglomeration. Sustainability 2023, 15, 5414. [Google Scholar] [CrossRef]
- Kazazi, A.K.; Rabiei-Dastjerdi, H.; McArdle, G. Emerging paradigm shift in urban indicators: Integration of the vertical dimension. J. Environ. Manag. 2022, 316, 115234. [Google Scholar] [CrossRef] [PubMed]
- Romero, H.; Vásquez, A.; Fuentes, C.; Salgado, M.; Schmidt, A.; Banzhaf, E. Assessing urban environmental segregation (UES). The case of Santiago de Chile. Ecol. Indic. 2012, 23, 76–87. [Google Scholar] [CrossRef]
- Carlsen, L.; Bruggemann, R. Environmental perception in 33 European coun-tries: An analysis based on partial order. Environ. Dev. Sustain. 2020, 22, 1873–1896. [Google Scholar] [CrossRef]
- Liu, A.H.; Ye, Z.L. China Statistical Yearbook; China Statistics Press: Beijing, China, 2020. [Google Scholar]
- China Renewable Energy Engineering Institute. Investigation and Evaluation of China’s Water Resources and Their Development and Utilization; China Water & Power Press: Beijing, China, 2014. [Google Scholar]
- Wada, Y.; Van Beek LP, H.; Viviroli, D.; Dürr, H.H.; Weingartner, R.; Bierkens, M.F. Global monthly water stress: 2. Water de-mand and severity of water stress. Water Resour. Res. 2011, 47. [Google Scholar] [CrossRef]
- Ren, Q.; Li, H. Spatiotemporal effects and driving factors of water pollutants discharge in Beijing–Tianjin–Hebei region. Water 2021, 13, 1174. [Google Scholar] [CrossRef]
- Yan, D.; Zhou, M.; Diao, Y.; Yang, M. Air pollution in China: Spatial patterns and spatial coupling with population and economy. Front. Environ. Sci. 2022, 10, 1040131. [Google Scholar] [CrossRef]
- Zhu, L.; Gan, Q.; Liu, Y.; Yan, Z. The impact of foreign direct investment on SO2 emissions in the Beijing-Tianjin-Hebei region: A spatial econometric analysis. J. Clean. Prod. 2017, 166, 189–196. [Google Scholar] [CrossRef]
- Fu, S.Z.; Zhuo, H.M.; Song, H.; Wang, J.C.; Ren, L.J. Examination of a coupling coordination relationship between urbanization and the eco-environment: A case study in Qingdao, China. Environ. Sci. Pollut. Res. 2020, 27, 23981–23993. [Google Scholar] [CrossRef] [PubMed]
- Sun, X.; Zhu, B.K.; Zhang, S.; Zeng, H.; Li, K.; Wang, B.; Dong, Z.F.; Zhou, C.C. New indices system for quantifying the nexus between economic-social development, natural resources consumption, and environmental pollution in China during 1978–2018. Sci. Total Environ. 2022, 804, 150180. [Google Scholar] [CrossRef] [PubMed]
- Liu, J.P.; Tian, Y.; Huang, K.; Yi, T. Spatial-temporal differentiation of the coupling coordinated development of regional energy-economy-ecology system: A case study of the Yangtze River Economic Belt. Ecol. Indic. 2021, 124, 107394. [Google Scholar] [CrossRef]
- Tan, S.K.; Liu, Q.; Han, S.Y. Spatial-temporal evolution of coupling relationship between land development intensity and resources environment carrying capacity in China. J. Environ. Manag. 2022, 301, 113778. [Google Scholar] [CrossRef] [PubMed]
- Zhang, J.X.; Ma, L. Urban ecological security dynamic analysis based on an innovative emergy ecological footprint method. Environ. Dev. Sustain. 2021, 23, 16163–16191. [Google Scholar] [CrossRef]
- Cui, L.; Zhao, Y.H.; Liu, J.C.; Wang, H.; Han, L.; Li, J.; Sun, Z. Vegetation Coverage Prediction for the Qinling Mountains Using the CA-Markov Model. ISPRS Int. J. Geo-Inf. 2021, 10, 679. [Google Scholar] [CrossRef]
- Abdel-Basset, M.; Mohamed, R. A novel plithogenic TOPSIS-CRITIC model for sustainable supply chain risk management. J. Clean. Prod. 2020, 247, 119586. [Google Scholar] [CrossRef]
- Krishnan, A.R.; Kasim, M.M.; Hamid, R.; Ghazali, M.F. A Modified CRITIC Method to Estimate the Objective Weights of Decision Criteria. Symmetry 2021, 13, 973. [Google Scholar] [CrossRef]
- Ruan, D.M.; Bian, J.M.; Wang, Q.; Wu, J.J.; Yu, Y.X.; Gu, Z.Q. Application of Modified Cloud Model-Level Eigenvalue Method in water quality evaluation. J. Hydrol. 2021, 603, 126980. [Google Scholar] [CrossRef]
- Fan, Y.P.; Fang, C.L.; Zhang, Q. Coupling coordinated development between social economy and ecological environment in Chinese provincial capital cities-assessment and policy implications. J. Clean. Prod. 2019, 229, 289–298. [Google Scholar] [CrossRef]
- Chang, Q.L.; Sha, Y.Y.; Chen, Y. The Coupling Coordination and Influencing Factors of Urbanization and Ecological Resilience in the Yangtze River Delta Urban Agglomeration, China. Land 2024, 13, 111. [Google Scholar] [CrossRef]
- Li, J.C. China Industry and Commerce Administration Yearbook; China Industry and Commerce Press: Beijing, China, 2007; pp. 548–552. [Google Scholar]
- National Forestry and Grassland Administration. China Forestry and Grassland Yearbook; China Forestry Press: Beijing, China, 2008.
- Liao, M.L.; Chen, Y.; Wang, Y.J.; Lin, M.S. Study on the Coupling and Coordination Degree of High-quality Economic Development and Ecological Environment in Beijing-Tianjin-Hebei Region. Appl. Ecol. Environ. Res. 2019, 17, 11069–11083. [Google Scholar] [CrossRef]
- Zhao, Y.B.; Wang, S.J.; Ge, Y.J.; Liu, Q.; Liu, X. The spatial differentiation of the coupling relationship between urbanization and the eco-environment in countries globally: A comprehensive assessment. Ecol. Model. 2017, 360, 313–327. [Google Scholar] [CrossRef]
- Zuo, Z.L.; Guo, H.X.; Cheng, J.H.; Li, Y. How to achieve new progress in ecological civilization construction? Based on cloud model and coupling coordination degree model. Ecol. Indic. 2021, 127, 107789. [Google Scholar] [CrossRef]
- Ming, Z. Yearbook of Around Bo Hai Sea Region Economy; Bohai Rim Regional Economic Yearbook Editorial Committee: Tianjin, China, 2019. [Google Scholar]


Disclaimer/Publisher’s Note: The statements, opinions and data contained in all publications are solely those of the individual author(s) and contributor(s) and not of MDPI and/or the editor(s). MDPI and/or the editor(s) disclaim responsibility for any injury to people or property resulting from any ideas, methods, instructions or products referred to in the content. |
© 2024 by the authors. Licensee MDPI, Basel, Switzerland. This article is an open access article distributed under the terms and conditions of the Creative Commons Attribution (CC BY) license (https://creativecommons.org/licenses/by/4.0/).