Abstract
In the realm of sustainable city development, evaluating the spatial vitality of urban green spaces (UGS) has become increasingly pivotal for assessing public space quality. This study delves into the spatial heterogeneity of park vitality across diverse urban landscapes at a city scale, addressing limitations inherent in conventional approaches to understanding the dynamics of park vitality. Leveraging geotagged check-in data from 65 parks in the study case of Changsha City, a quantitative analysis was undertaken to assess spatial vitality. The investigation incorporated data concerning internal and external factors influencing park vitality, employing the Multi-scale Geographically Weighted Regression (MGWR) model to dissect nuanced spatial heterogeneity. The research uncovers notable spatial discrepancies in factors influencing park vitality across diverse urban areas, emphasizing the reliance on adjacent residential communities and internal commercial amenities provision. These dependencies correspond with economic development differences among urban locales, revealing distinct geographic trends. This study has a novel perspective and methodology for investigating urban park vitality, providing significant insights for urban green space planning and management. It emphasizes the necessity of acknowledging spatial diversity in urban park planning and design by incorporating the distinct socio-economic characteristics of each urban zone, which is crucial for both urban planners and policymakers.
1. Introduction
Globally, including in China (the most populous developing nation), urbanization rates have significantly increased, soaring from 30% in 1996 to 65% in 2022, presenting challenges such as unequal resource distribution and unplanned urban expansion [1,2,3]. Urban parks, as a crucial component of the urban ecosystem, play an indispensable role in mitigating urban challenges such as the heat island effect, environmental quality degradation, and increased stress among urban residents resulting from intense urbanization. Furthermore, urban parks offer spaces for leisure, entertainment, and social interaction, acting as a vital catalyst for community revitalization and urban development [4,5,6,7].
Currently, scholars focus not only on the quantity of Urban Green Spaces (UGS) within cities, but also on the impact of UGS on surrounding residents post-construction. The influence of different urban parks on the urban environment varies, as does their frequency of use as public infrastructure. To accurately describe this impact, various indicators have been employed by different scholars. Notably, the concept of urban spatial vitality proposed by Montgomery and Jacobs has received widespread recognition within the academic community. This concept characterizes the vitality of urban spaces as activities related to the number of people within and around streets or communities [8,9].
In UGS vitality research, accurately assessing vitality is challenging due to varying analytical scales, datasets, and methodologies [6,10,11]. Traditional quantitative models such as questionnaire surveys, field observations, and drone surveys [12,13,14] provide authentic data, but are limited by time, resources, and potential biases [15]. Information technology and increased smartphone usage have enabled social platforms’ open API interfaces (e.g., Twitter, Weibo, Dazhong Dianping) to extract geospatial data for understanding spatial preferences and urban vitality [16,17,18,19]. This data is abundant, extensive, and easily accessible, proving useful in urban studies across cities like Birmingham [20] and Oslo [21]. Heatmaps and mobile phone signaling data also contribute to spatial vitality research [22,23,24]. However, global models, while providing macro-level insights, may not capture spatial heterogeneity as highlighted by the Second Law of Geography [25,26], leading to potential discrepancies when applied to specific local contexts [27].
With the deepening research on urban spatial vitality, an increasing number of scholars are focusing on the causes of the differences in the vitality of UGS. Against this backdrop, scholars in the fields of geography and urban planning generally believe that spatial heterogeneity is a key concept in explaining this phenomenon [28]. It delineates the variance and disparity in spatial attribute values across diverse geographical locales. This heterogeneity mirrors the impact of factors such as the natural environment, socioeconomic conditions, and human endeavors on the spatial layout, serving as a fundamental theory for comprehending and examining geographical phenomena [29,30,31].
In the face of such complex and diverse spatial variations, accurately identifying key factors is a prerequisite for enhancing the vitality of UGS. The Geographically Weighted Regression (GWR) model, a local regression analysis approach, performs local regressions on all independent variables within the same bandwidth to unearth the spatial relationships between independent and dependent variables. This model has found extensive applications in disciplines such as geography and economics [32,33]. Research shows that, compared to the global model, the GWR model has a higher fitting degree [34,35,36]. However, UGS vitality is influenced by a complex mix of factors like population, economy, environment, and transportation, which exhibit spatial heterogeneity and vary across scales [22,37,38]. Therefore, an analytical method that effectively addresses spatial heterogeneity and scale effects is essential for accurately assessing park vitality [23]
Fotheringham’s introduction of the Multiscale Geographical Weighted Regression (MGWR) has provided a leap forward in spatial heterogeneity analysis by overcoming the fixed bandwidth constraint of the traditional GWR [24], permitting an individual bandwidth application for each variable. This advancement enhances the accuracy of such analysis, substantiated by numerous studies demonstrating the MGWR model’s superior fitting, precision, and practicality relative to the GWR model [39,40,41]. Amidst dynamic shifts in urban landscapes and the behavioral patterns of residents, the integration of urban parks’ dynamic nature and MGWR’s capabilities allows tailored updating strategies to be formulated based on the spatial heterogeneity of different space vitality influencers. This method transcends the traditional approach of relying on global model “averages” to develop a strategy. It optimizes the GWR model’s fitness, grounding the research in reality and thus amplifying the experimental authenticity. Furthermore, this more profound insight into the urban park’s operational principles aids in reducing both the temporal and technical costs associated with urban park updates.
Extant scholarly discourse on UGS vitality has achieved a commendable degree of maturity. Yet, many of these studies still need to tackle the spatial variations in the impact of different determinants on UGS vitality, suggesting an opportunity for more comprehensive and rigorous investigation. The study aims to explore the spatial vitality of UGS in Changsha City, employing the MGWR model alongside multi-source, voluminous datasets, including Baidu Huiyan vitality data and Amap geospatial information. By assessing the spatial heterogeneity of influencing factors, the research seeks to enhance the precision of evaluating UGS vitality and inform tailored strategies for urban park planning. Using Changsha as a case study, this research offers a novel approach to examining urban park vitality. It facilitates a deeper understanding of the global patterns and regional disparities in the vitality of urban green spaces, thereby providing valuable insights for other international cities.
The remainder of this paper proceeds in the following way. Section 2 offers a comprehensive review of vitality and spatial heterogeneity studies. Section 3 delineates the study area and delineates the data sources utilized in this research, and further expounds on the analytical framework and procedural methodology employed in the investigation. Section 4 presents the findings from the ordinary least squares (OLS), GWR, and MGWR analyses. Section 5 delves into a discussion of the outcomes and underlying reasons for spatial heterogeneity. Section 6 encapsulates the critical discoveries of the study and proposes avenues for future research endeavors.
2. Literature Review
2.1. Space Vitality
Urban vitality is a pivotal concept, intricately linked to the intensity of activities within public spaces, particularly at the street and community levels [42]. Jacobs conceptualizes urban vitality as the continuity and diversity of street life over 24 h [9]. Conversely, Montgomery characterizes urban vitality as the volume of pedestrian traffic in streets or communities and their adjacent areas across different time intervals [43]. This notion underscores the dynamic and interactive nature of public spaces, mirroring the activities and interactions of individuals within urban settings. Urban vitality extends beyond mere population movements and gatherings; it encompasses various economic, cultural, and social dimensions. It is a crucial metric for assessing the quality of urban life and the capacity for sustainable development. Researchers delineate vitality through diverse factors such as heatmap data [44], mobile signaling data [44], nighttime light data [45], and online check-in data [42,46].
One of the defining characteristics of urban spatial vitality is the population fluctuation within a space due to variables such as time and weather [47]. Location-based services (LBS) data hold distinct advantages over traditional social check-in or survey data: firstly, social check-in data fail to capture the dynamic population changes within a space over time, whereas LBS data can accurately depict the population flow within a space during different periods; secondly, check-in data only represent the habits of a subset of the population, and cannot account for all participants in a space. In the era of information, LBS data can encompass a broader range of individuals, thereby providing a more authentic reflection of the number of people in a space.
In this research, we utilize heat data from Baidu Huiyan as the data source for park vitality analysis. Baidu Huiyan leverages big data technology to collect and analyze users’ location information and search behavior on Baidu Maps, producing heat maps that depict the density of people and the intensity of activities. This operational principle enables Baidu Huiyan to capture the dynamic changes of heat thoroughly, offering a wealth of representative and timely data. Its feasibility has been demonstrated in various fields [48,49]. For the study of the spatial heterogeneity of park vitality, Baidu Huiyan’s heat map data can unveil the spatial distribution characteristics of vitality across different regions, providing a scientific foundation for a deeper comprehension of park vitality.
2.2. Spatial Heterogeneity
Spatial heterogeneity is a fundamental concept in geography, urban planning, and related disciplines, characterized by the uneven distribution and variability of attributes, characteristics, or phenomena across diverse geographic locations or spatial scales [28]. This concept plays an integral role in understanding the complexity inherent in spatial patterns and processes, acknowledging that distinct regions may display unique attributes due to environmental conditions, socio-economic dynamics, and human interventions. The significance of spatial heterogeneity lies in its capacity to enhance the understanding of spatial relationships and interactions, challenging the presumption of spatial homogeneity, which can result in overly simplified models and inaccurate depictions of reality [50]. By embracing spatial heterogeneity, researchers and planners are empowered to develop more accurate and contextually relevant analyses, models, and strategies.
Spatial heterogeneity has gained widespread application in the domain of spatial relationship analysis, including in areas such as urban public health [51], housing prices and the built environment [52], social equity [53], and soil environmental analysis [54]. In the context of urban vitality analysis, research typically centers on urban landscapes, streets, or morphologies [55,56]. However, previous studies have often neglected a crucial aspect: the vitality of parks as urban public spaces, along with their influencing factors, can display spatial heterogeneity in response to changes in the surrounding economy, activities, and population structure [38,57]. More research is needed on the spatial heterogeneity of urban park vitality. While traditional analysis methods (such as global regression, surveys, and interviews) can provide detailed analyses of the vitality and its influencing factors for parks across an entire city, these results may not be suitable for specific parks. They cannot be extrapolated to a broader context.
2.3. Factors Affecting UGS Spatial Vitality
Investigating the influence of internal or external factors on park vitality is a research domain that has been explored previously. Scholars across various regions have introduced diverse analytical perspectives on park vitality in their respective study areas, considering the disparities in national customs, economic development levels, urbanization processes, and population structures. For instance, research has been conducted in Poland [58], Berlin and Salzburg [59], and Melbourne, Australia [12]. The surrounding population and economic activities significantly influence the vitality of parks; for example, parks equipped with playgrounds are favored by children [60], while serene environments are preferred by older people [12]. Moreover, factors such as accessibility, economic environment, and residential and office areas, all contribute to park vitality [61,62,63]. Nonetheless, there are variations in the factors affecting park vitality between different cities and even among parks within the same city. Regrettably, the spatial heterogeneity analysis of park vitality and its influencing factors remains insufficient.
Since adopting the reform and opening-up policy in 1978, China has witnessed a substantial rise in urbanization rates and a rapid expansion of urban permanent populations. Accompanying large-scale population movements, cities’ economic stratification and spatial distribution differences have become increasingly pronounced, particularly in major cities such as Beijing and Shanghai [64,65]. These transformations have resulted in variations in the surrounding environment, population structure, and economic activities of urban parks. In contrast to Western cities, the swift development of Chinese cities has attracted a considerable influx of migrant workers, amplifying park vitality’s spatial heterogeneity [66]. Research indicates that distinct age and gender groups exhibit differing demands for parks [12,60]. Consequently, considering the alterations in population structure and spatial distribution, analyzing UGS vitality and its influencing factors from a spatial heterogeneity perspective, and devising corresponding renewal strategies are imperative for enhancing the vitality of UGS.
Research on the spatial heterogeneity of park vitality conducted in China offers distinctive insights for the global academic community. The swift urbanization and population mobility patterns in China starkly contrast with the racial geographical segregation in the United States [67], immigration issues in Europe [68], and urban expansion in Australia [69], thereby unveiling the diversity of park vitality across different socio-economic contexts. In Chinese cities, the spatial heterogeneity of park vitality is predominantly influenced by internal population structures and economic activities. In contrast, in American and European cities, park vitality is significantly shaped by racial and immigration factors. By examining these varied influencing factors, researchers can attain a more holistic understanding of the intricacies of park vitality and devise targeted park planning and management strategies for cities worldwide. Thus, research on park vitality in China guides domestic urban planning and offers valuable insights for tackling similar challenges internationally.
3. Methodology
3.1. Study Area
Changsha, the capital city of the Hunan Province in China, administers six districts (Furong, Tianxin, Yuelu, Kaifu, Yuhua, Wangcheng) and one county (Changsha County), encompassing a total population of 10 million across 11,819 km2 as of the close of 2022 (Changsha Statistical Yearbook). As the vibrant political, economic, and cultural hub of Hunan Province, Changsha has drawn a substantial migratory population for work and residence. However, juxtaposed with the population influx and the swift urban development, the urban park construction area expanded only modestly, from 575 km2 in 2001 to 2797 km2 by 2020. Considering the lower population density on the city’s periphery, and the predominance of large forest parks resulting in lesser spatial utilization, this study primarily focuses on the principal urban area of Changsha, precisely within the perimeters of the Changsha Ring Expressway.
The delineated study area encompasses a total of 152 UGS. However, the scope of this research does not extend to diminutive community parks, given their relatively limited expanse and influence when juxtaposed with the city’s comprehensive spatial domain. These smaller entities exhibit negligible spatial heterogeneity within their constrained service radius, rendering them incongruent with the study’s foundational aim to scrutinize urban parks that cater to the populace across more expansive vicinities. Consequently, this investigation excludes small-scale pocket parks and community parks. In stark contrast, municipal parks, characterized by their extensive service range, heightened user participation, and a myriad of influencing factors present a more compelling case for analyzing spatial heterogeneity in factors affecting UGS vitality. In alignment with the stipulations of the “Standard for the Planning of Urban Green Space (GB/T51346-2019)”, this study meticulously selects 65 parks from the study region as the focal point of its analytical endeavors.
This study is focused on the main urban area within the Changsha Ring Expressway (Figure 1), guided by the following academic considerations: Firstly, this region is characterized by a high concentration of economic activities and population density, highlighting the significance of parks in the daily lives of urban residents. Furthermore, the abundance and diversity of park resources in this area provide a comprehensive data foundation for examining the spatial heterogeneity of park vitality. Ultimately, by concentrating on the urban core, this research aims to enhance the precision and practical value of the study, deepening the understanding of the characteristics and influencing factors of urban park vitality, thereby contributing specific and targeted insights to the formulation of relevant policies and renewal strategies.
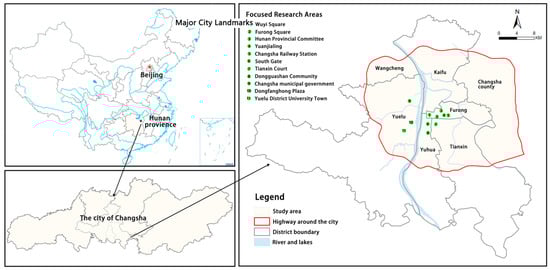
Figure 1.
Changsha City: location and research scope.
3.2. Study Framework
Figure 2 illustrates the spatial heterogeneity assessment framework and procedures for UGS vitality and its influencing factors. The assessment framework includes three steps, as detailed below.
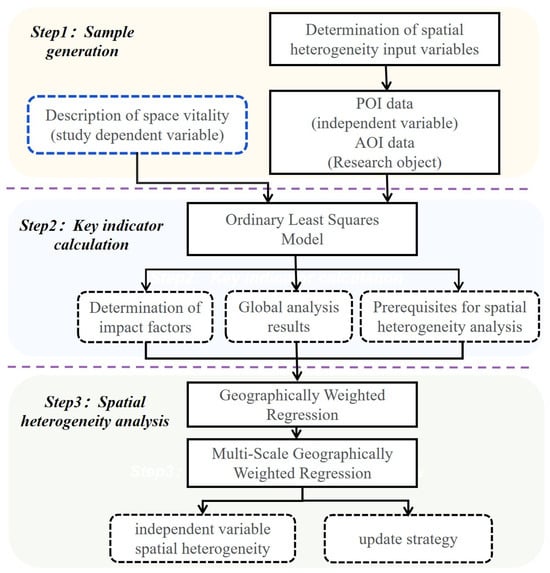
Figure 2.
Framework of the spatial heterogeneity assessment.
In step1, the process involves acquiring spatial location data pertinent to UGS vitality and its influencing factors within the urban confines of Changsha City. At this juncture, it is imperative to identify the specific nature and category of data pertinent to UGS vitality and the contributory elements that should be encompassed within the dataset. Given the necessity for an extensive dataset, the utilization of publicly accessible API interfaces is employed to facilitate the aggregation of large-scale data. The harvested data must undergo meticulous cleansing and calibration to maintain the experimental integrity. A comprehensive outline of these procedural steps will be delineated in Section 2.2.
In step2, an Ordinary Least Squares (OLS) regression is employed to conduct a global analysis of UGS vitality in conjunction with selected spatial vitality determinants. This approach is primarily adopted to circumvent the potential multicollinearity issues among the influencing factors, which could compromise the integrity of subsequent spatial heterogeneity analyses. Concurrently, this step facilitates a comprehensive understanding of the overarching analytical context.
In step3, the influencing factors, having been rectified for multicollinearity through the application of OLS, are subsequently processed through GWR and MGWR models, respectively. This process involves a comparative reliability analysis of the experimental data outcomes derived from both models, thereby elucidating the spatial heterogeneity of factors influencing park vitality in Changsha City. The empirical findings are then leveraged to inform targeted refinement strategies for UGS in subsequent interventions.
3.3. Data Resources
3.3.1. AOI and POI Data
This research initially necessitates the acquisition of fundamental spatial data about UGS within the study locale. Consequently, this article employs AOI and POI datasets to depict the UGS and its adjacent amenities, and amalgamates them for subsequent analysis via a Geographic Information System (GIS) platform. AOI data, a prevalent form of spatial data in digital cartography, encompasses essential attributes like name, address, category, and geographical coordinates. It also includes boundary coordinate information, rendering it a comprehensive tool for depicting two-dimensional geographic entities on maps. Like AOI data, POI data provides essential information, including name, address, category, and coordinates. It is known for its substantial volume, extensive coverage, precision, and ease of acquisition [70]. Therefore, the utilization of AOI and POI data within the GIS platform effectively delineates the spatial information of urban UGS and its adjacent facilities, thereby offering crucial data support for conducting spatial analysis of urban UGS resources.
Acquiring AOI and AOI data is primarily facilitated through various navigation platforms, including but not limited to Baidu Maps, Amap, and Google Maps [10,15,20]. For this study, AOI and POI data about UGS was meticulously sourced via the open API interface of Amap (https://lbs.amap.com/, accessed on 1 October 2023). As China’s leading electronic map, navigation, and Location-Based Services (LBS) platform, Amap boasts an average daily active user count exceeding 100 million. This substantial user base reflects the platform’s extensive reach and utility and corroborates the high quality of its sample data. This feature has garnered widespread recognition and endorsement within the academic community (Figure 3).
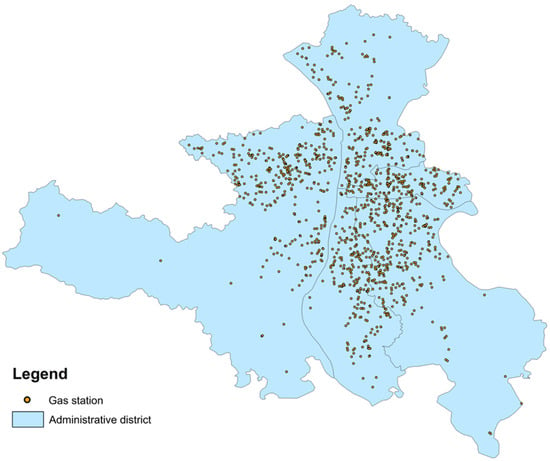
Figure 3.
POI and AOI data examples: gas stations’ POI data and administrative division AOI data at five districts in Changsha.
3.3.2. UGS Vitality Data Source
In the wake of the relentless advancements in information technology, Baidu, a titan in China’s internet industry, holds numerous apps and the geospatial big data platform Baidu Huiyan under its aegis. Baidu Huiyan registers an astounding average of 120 billion location requests daily, supporting 1.1 billion active hardware devices monthly. Many scholars have harnessed the potential of the Baidu Huiyan platform, conducting diverse analyses across several cities in China and establishing the precision and effectiveness of the platform’s data. This study also taps into the city population geographic big data platform of Baidu Huiyan (https://huiyan.baidu.com, accessed on 10 October 2023) to extract real-time population distribution data for Changsha City for 2022. This data is a derivative of the statistics collated from terminal positioning data that invokes the Baidu Map Location SDK. Initially, Baidu Map sections the entire nation into 200 × 200 m grids based on the Baidu Mercator coordinate system (bdmc09), tallying the number of terminals that engaged the location SDK over a particular time frame (defaulted to one hour on the platform). Importantly, all stages of data handling have been anonymized, ensuring individuals’ privacy is not compromised (Figure 4).
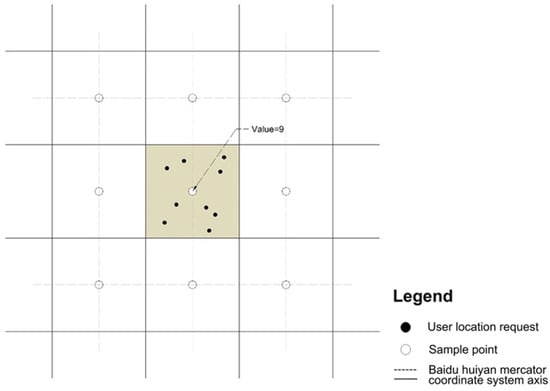
Figure 4.
Baidu Huiyan vitality data crawling principle.
3.3.3. Descriptive Statistics of Key Variables
As shown in Table 1, upon contemplating the independent variables that bear upon the UGS vitality, we categorize them into three groups: (1) external factors, (2) internal factors, and (3) landscape factors. External factors primarily pertain to the facilities around the park, which are capable of ushering in a primary pedestrian flux, such as residential areas, commercial facilities, subway stations, bus stops, and public service amenities. Because the principal users of various urban parks hail from the active population or permanent residents in a specific periphery, previous studies have unveiled a potent correlation between economic-commercial activities and the intensity of population activities [71,72,73]. Concurrently, it has been discovered that commercial facilities and public service amenities can significantly influence the vitality of urban parks [74,75]. The ongoing advancement in urban transportation has underscored the significance of accessibility as a pivotal determinant of UGS vitality. This rationale has led to including urban public transportation facilities, specifically subway stations and bus stops, as independent variables in our research. [76]. Another significant user demographic for UGS involves the permanent residents in the surrounding areas, hence their inclusion in our scope of consideration.

Table 1.
Reasons for selecting independent variables and crawling keywords.
Internal factors encompass: park entrance, open space (like scenic spots, squares and viewpoints), sports facilities, public toilets and business. The selection of variables impacting the internal UGS vitality is based on the distinctive participation priorities of various demographic groups in park spaces and the variable spatial vitality generated by different facilities within the park. Studies have revealed that sports amenities, such as sandpits and open fitness facilities, often lure a younger audience, thus contributing to significant spatial vitality [77,78]. On the other hand, open spaces conducive to socialization, leisure areas, and commercial zones also foster spatial vitality concentration [74,79,80].
The selection of the search radius for retrieving POI data significantly impacts the accuracy of spatial heterogeneity analysis. Both larger and smaller search ranges may result in discrepancies with real-world situations and potentially compromise the fidelity of overall distribution. Drawing upon insights from previous research, this study conducted multiple experiments to determine the optimal search radius values [81,82,83]. This ensures that the analysis results retain greater detail and effectively portray the spatial distribution characteristics of spatial heterogeneity. The search range of each influencing factor is shown in Table 2.
Table 2.
Description of the POI’s search radius.
Landscape elements relate to the motivations that drive citizens to visit parks. Generally, a park is designed around a single theme, but preferences for landscape types vary across different age groups. For instance, studies have indicated that the needs of older adults [12,81] and adolescents [82] for park spaces and landscape elements [59] are distinct. Environments that inspire a sense of safety all influence spatial vitality [14]. Typically, urban parks are themed around water or forest sceneries, or a combination of various themes. However, it is not feasible to directly compare riverside, lakeside, or vegetation landscapes or quantify multiple coexisting thematic landscape elements. Thus, this study disregards landscape factors and concentrates on quantifiable internal and external factors when analyzing UGS vitality.
3.4. Analysis Model
3.4.1. Global Analysis Model
A stepwise regression technique has been employed to address the issue of multicollinearity among the variables. This involves systematically introducing variables; each time a new variable is added, an evaluation of each of the variables already incorporated into the regression model is conducted, and those deemed insignificant are removed. This ensures that every variable within the resulting subset of independent variables carries significance. This procedure is repeated in numerous steps until no further variables can be incorporated. By this stage, all variables within the regression model hold significant relevance to the dependent variable while minimizing the collinearity among factors. The Ordinary Least Squares (OLS) model is a global regression model, the results are displayed as panel data, representing mathematical significance only and excluding the geographic spatial attributes of the explanatory and dependent variables. The corresponding formula is as follows:
In this model, represents the observed value of the dependent variable at the position, is the estimated intercept, denotes the observed value of the explanatory variable at the position, is the estimated value of the parameter, and ε(i) is the random error term, with . The OLS model posits that all variables are spatially constant. Nonetheless, the same variable may not reflect the same influence due to geographical disparities or environmental variations. Under such circumstances, the “average value” of all variables, as depicted by the OLS results, may not apply to specific regions.
3.4.2. Spatial Heterogeneity Analysis Model
Compared to the OLS model, the GWR approach considers the spatial heterogeneity of variables and presupposes non-smooth spatial fluctuations. At its core, GWR captures spatial variations by calibrating a multivariate regression model consisting of a set of local linear models at any number of positions. It allows for different geographic relationships and “borrowing” data from nearby locations [50,51]. The equation is as follows:
In the equation, are the specified coordinates of observation point in space; represents the intercept value at location ; is the local coefficient for each explanatory variable at location , and is the random error at that location. As a local regression model, GWR results heavily depend on selecting criteria for goodness-of-fit. The Akaike Information Criterion (AIC), renowned for its high level of fit, has been chosen for this study. The bi-square kernel function is employed to select data borrowing and bandwidth. The reasoning is twofold: firstly, the nearest neighbor definition of proximity is more stable for irregular spatial sampling; secondly, the interpretation of the bi-square kernel function is that the bandwidth is the number of nearest neighbors, and any data beyond the bandwidth has zero impact on the observation point [23]. Minimizing the corrected Akaike Information Criterion (AICc) allows us to select the optimal bandwidth parameter, which balances model variance and bias [50].
When examining the factors that influence the spatial vitality of urban parks, GWR applies a uniform bandwidth to multiple variables for search computations. However, different influencing factors and activities pertain to different spatial scales. The MGWR improves upon GWR by allowing varying bandwidths to study relationships instead of the same bandwidth across the entire research area. This approach allows for better capture of independent variables’ spatial heterogeneity and reduces parameter estimation errors [38]. The formula is as follows:
where signifies the bandwidth of the th variable estimated using the bi-square kernel function, stands for the MGWR estimate at the location , and is the random error term. MGWR calibrates via a back-fitting algorithm, with the bandwidth selection criterion being the Akaike information criterion, which is consistent with GWR. As suggested by Yu et al., the bi-square kernel function is chosen as the optimal bandwidth for independent variables in MGWR, given the usage of the GWR model as the basis [84].
The back-fitting algorithm is typically utilized to calibrate generalized weighted models, assuming that all other terms are known and calibrating each term in the model more smoothly [24]. The convergence criterion for the MGWR back-fitting algorithm is the residual sum of squares (RSS). The formula follows:
where is the convergence criterion, represents the residual sum of squares calculated from the previous step, and stands for the residual sum of squares calculated for the next step.
4. Results
4.1. UGS Vitality Analysis
In this study, the measurement of urban park vitality is predicated upon in-park check-in data. Specifically, three representative time points for check-ins were selected, and the data from these time points were superimposed to indicate the park’s vitality for that day. This approach accounts for the utilization of the park during different periods, and can more comprehensively reflect the level of activity within the park. Furthermore, to obtain a more stable and reliable measurement of park vitality, the data were aggregated over seven consecutive days to yield a weekly measure of park vitality. This method of continuous superposition mitigates daily fluctuations. It captures the trend of park vitality over time, providing adequate data support for analyzing the spatial heterogeneity of urban park vitality.
Considering the climatic conditions of Changsha City, this study identified three pivotal time points (9 a.m., 1 p.m., and 7 p.m.). By employing superposition analysis on these temporal datasets, the fundamental vitality distribution of parks in Changsha City was computed (Figure 5).
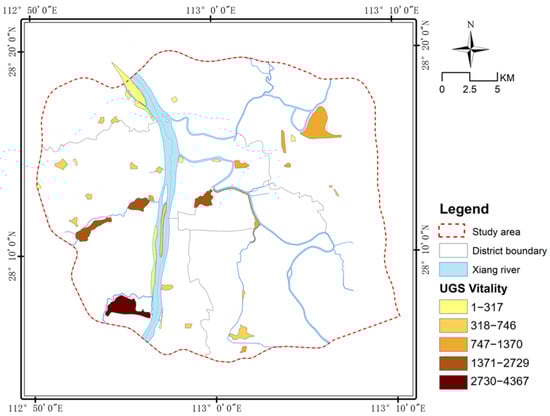
Figure 5.
UGS Vitality analysis in Changsha.
The findings of this investigation elucidate pronounced spatial heterogeneity in the vitality of urban parks within Changsha City. Specifically, parks west of the Xiangjiang River near commercial and residential developments manifest heightened vitality levels. Moreover, the University Town precinct, notably West Lake Park, a hub of dense student population, demonstrates robust vitality. Comparatively, parks in the northwest region exhibit notably diminished vitality compared to their counterparts in the southern region west of the Xiangjiang River. This disparity is primarily attributable to the predominant presence of industrial parks in the northwest and its relatively later stage of development.
Further analysis indicates that the vitality of park spaces in the eastern Xiangjiang area could be much higher. Moreover, as the developmental focus of Changsha City is primarily directed towards the area west of the Xiangjiang River, the population density surrounding parks in the eastern sector of the Xiangjiang River, except the central urban area, needs to be more extensive. This demographic distribution significantly contributes to the overall low vitality observed in the parks of this eastern region.
4.2. Statistical Tests
As shown in Table 3 and Table 4, the global model generated a high , thereby substantiating that a significant proportion of park vitality can be elucidated by the independent variables chosen in this study. All VIF values of the elected independent variables are below 7.5, suggesting an absence of prominent collinearity problems among the independent variables. Given the study’s relatively small number of observation points (n = 65), a t-test was used to ascertain statistical significance. A t-test value of 1.96 was established. The findings demonstrate that only the internal commercial facilities of the UGS exhibit statistical significance. The relative lack of statistical significance could be attributable to spatial heterogeneity, manifesting in inconsistent internal and external facilities across parks of divergent types, regions, and sizes. Moreover, the primary audience attracted by each park varies, leading to a reduction in statistical significance. A review of the aforementioned data reveals that the most influential factor with statistical significance is the internal commercial facilities of the park, showing a robust positive correlation with park vitality. Following this are the UGS’s internal sports facilities and external public buildings. Conversely, the most significant negative correlation factor is the open space facilities within the UGS, trailed by the park’s external transport facilities and dining establishments.
Table 3.
OLS analysis result.
Table 4.
Comparison of three analysis models.
4.3. Spatial Heterogeneity Analysis of Impact Factors
This investigation has implemented three statistical methodologies, namely OLS, GWR, and MGWR, to analyze the intricate relationship between UGS vitality and a spectrum of internal and external determinants (Table 4). These models allow us to dissect the research problem from varying angles and granularities, thus bestowing us a more holistic understanding of the factors shaping park vitality and their corresponding impact levels. The findings from each model will be meticulously dissected in the following in-depth analyses to decipher the implications and influences of these results for the research into park vitality and the practical sphere of UGS planning.
The OLS results operate on the premise that the influence of independent variables on the static state of park vitality within the research locale is acknowledged. However, in the context of spatial heterogeneity, the implementation of GWR was chosen for our investigation. In comparison to the OLS model, which yielded an of 0.745 and an AIC of 117.601, the GWR model enhanced the to 0.854 and reduced the AIC to 98.477. Moreover, the MGWR model, transcending the fixed bandwidth constraints of GWR, is also incorporated into this study. Despite no change in its the adjusted ascended from 0.794 in GWR to 0.801, coupled with a decrease in AIC from 98.477 in GWR to 95.383. The GWR model, vis-à-vis the OLS model, furnishes a more nuanced picture by augmenting model fitting and minimizing the information criterion, thereby unveiling potential divergent relationships between park vitality and its influencers across varying geographical locations. The MGWR model, surpassing the limitations of GWR, designates the optimal bandwidth for each explanatory variable individually, facilitating a more detailed examination of the spatial heterogeneity of each influence factor. Hence, on the whole, MGWR emerges as more befitting for the research at hand.
Table 5 reveals a notable discrepancy in bandwidth search between the internal commercial facilities of parks and the residential neighborhoods, whereas the bandwidths for other impact factors remain identical. This could suggest that in the research area, the internal commercial facilities of parks and the facilities in residential neighborhoods external to the parks exhibit a more significant density difference compared to other independent variables, necessitating different bandwidths for processing. Given the slight bandwidth difference between MGWR and GWR, their adjusted value and AIC differences are similarly minimal. However, this still sufficiently demonstrates the superior applicability of the MGWR model to this study.
Table 5.
Both MGWR and GWR rely on adaptive bandwidth for their calculations.
4.3.1. Internal Factors
The spatial distribution of the estimated coefficients of the internal variables selected is depicted in Figure 6, where different colors represent the impact of various factors on the vitality of UGS. From the results of the MGWR model, the internal influencing factors show significant regional differences in their impact on the vitality of Changsha’s UGS; that is, spatial non-stationarity exists.
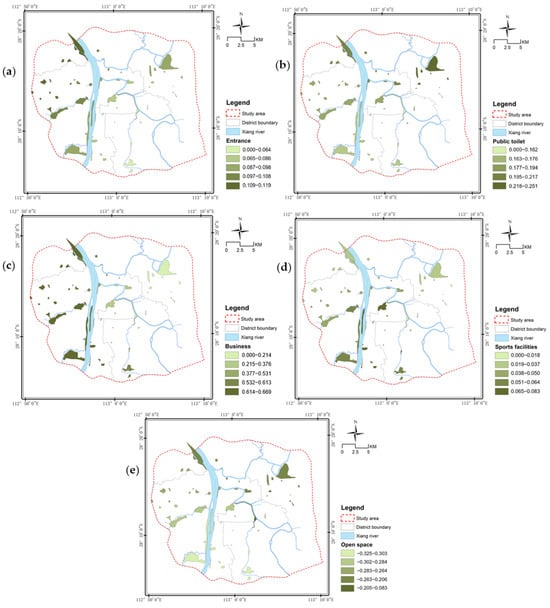
Figure 6.
Spatial heterogeneity analysis of internal factors influencing park vitality: (a) entrance; (b) public toilet; (c) business; (d) sport facilities; (e) open space.
Looking at the results of each influencing factor, these variables show spatial heterogeneity in their impact on UGS vitality in different regions. For example, business and public toilets positively correlate with the dependent variable. In contrast, open space has a negative correlation with UGS vitality. In addition, the effects of sports facilities, entrances, and exits on vitality show similar trends, with significant differences in spatial distribution.
In terms of the influence of internal business on UGS vitality, the southwestern region demonstrates a stronger positive correlation compared to the central urban and northeastern areas. Due to the relatively recent development of Changsha County in the northeast region, the divergent trends between the southwestern and northeastern sectors suggest that urban parks in the southwest area of Changsha are more effective at attracting visitors and stimulating park vitality through their business, like catering and commercial features. Interestingly, data indicates that the presence of public toilets, which also positively correlates with urban park vitality, exerts a significantly more substantial impact in the northeastern and central city regions than in the southwestern region, signifying that the influence of public toilets on park vitality contrasts starkly with that of business on spatial vitality.
The effects of sports facilities and entrance–exit points on urban park vitality do not exhibit a uniformly positive correlation across different spatial distributions. For example, sports facilities mainly promote the park’s vitality in the central area along the Xiang River in eastern Changsha. As they move away from the Xiang River, their effects tend to decrease. However, the beneficial impact of entrance and exit points on enhancing the vitality of UGS is mainly reflected in the northwest area of Changsha, which gradually decreases from north to south.
4.3.2. External Factors
In the context of external indicators (Figure 7), our analysis identified three significant factors—the presence of external public facilities, residential communities, and nearby companies—all of which predominantly demonstrate a positive correlation with the vitality of UGS in Changsha City. Regarding the impact of external transportation facilities on park vitality, although they have a common inhibitory effect on vitality, their spatial distribution differs from that of external catering facilities and enterprises. The influence in the Northeast is significantly more potent than in the central city and southwest. In addition, residential community factors have the most substantial impact on park vitality, with the overall pattern showing a high in the west and a low in the east.
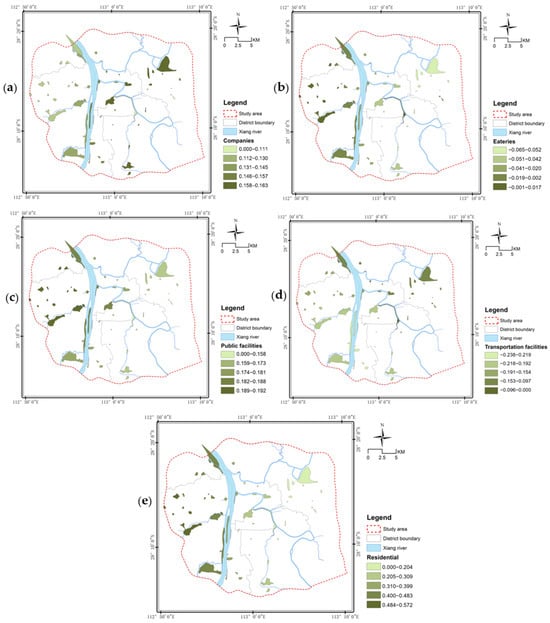
Figure 7.
Spatial heterogeneity analysis of external factors influencing park vitality: (a) companies; (b) eateries; (c) public facilities; (d) transportation facilities; (e) residential.
5. Discussions
A deep understanding of the interplay between the vitality of UGS and their associated influencing factors bears considerable relevance for our nuanced appreciation of urban development and its “micro” environmental contexts. Notably, existing investigations focus on the holistic vitality of urban green spaces, often neglecting the spatial non-stationarity of their influential factors. Consequently, these studies generally employ an “average” to represent the weight of the influencing factors on the vitality of a city’s green spaces, be they comprehensive, specific, or regional, thereby suggesting updated strategic approaches. However, shifts in the surrounding milieu may render the results derived from global models inapplicable to particular parks. This critical observation underpins the motivation for exploring the spatial heterogeneity of the factors affecting park vitality.
5.1. Accuracy Improvement of UGS Vitality Assessment
The use of MGWR necessitates an extensive amount of observational point data, and its integration with network information big data can maximize the advantages inherent in each. On the one hand, alongside economic and societal advancement, the utilization of mobile phones and their social applications is on the rise. The spatial vitality, represented as a dependent variable, is quantified by the count of individuals accessing the network within a given area, providing a more realistic representation of spatial vitality [85]. On the other hand, POI data with spatial location enables an effective enumeration of spatial vitality influencing factors within the research boundary. Consequently, the employment of MGWR to compute and scrutinize big data with spatial location attributes is predicted to yield superior fitting outcomes compared to both global and GWR models. This assertion has been corroborated across various disciplines [39,40,41].
This investigation employs a suite of analytical models, namely the OLS, GWR, and MGWR, to meticulously probe the intricate nexus between park vitality and an array of intrinsic and extrinsic determinants. It entails a comparative evaluation of the UGS activity simulations yielded by these distinct models. The MGWR model distinguishes itself by exhibiting heightened sensitivity to spatial heterogeneity and robust multi-scale analytical capabilities within this analytical framework. These attributes contribute substantially to the enhancement of model fitting and precision. This enhancement is quantitatively evidenced by a marked increment in the adjusted value, which ascends to 0.801, and a concurrent reduction in the AIC to 95.383, thereby affirming the superior performance of the MGWR model over its OLS and GWR counterparts in capturing the dynamics of UGS vitality.
The MGWR model’s prowess lies in its capacity to discern and elucidate nuanced disparities in the spatial distribution of diverse influencing elements, including, but not limited to, internal commercial amenities within parks and adjacent external real estate developments. This capability accentuates the regional specificity and local nuances of these variables. By meticulously calibrating the optimal bandwidth for each explanatory variable, the MGWR model transcends the mere representation of spatial heterogeneity in park vitality. It profoundly augments the model’s proficiency in elucidating and predicting park vitality’s spatial dynamics. Consequently, given its pronounced efficacy in unraveling complex spatial interrelations and elevating simulation precision, the MGWR model is unequivocally validated as the preeminent methodological choice for this research endeavor.
This study takes Changsha, China as a case to explore the spatial heterogeneity of urban park vitality and its influencing factors. Interestingly, from the perspective of spatial heterogeneity, the findings of this study are consistent with the results of research in other regions of the world, such as sports facilities in Melbourne parks [86], commercial facilities in Shanghai parks [87], sports facilities and open spaces in Singapore studies [77], and public transportation in Seoul studies [88]. However, this study breaks through the scale limitations of traditional research, allowing for a more precise description of the differences in park vitality and its influencing factors in different urban areas. Additionally, the vitality of parks in Changsha and their influencing factors are significantly impacted by economic activities, which contrasts sharply with characteristics such as racial segregation in the United States [67], immigration issues in European cities [68], or urban expansion in Australia [69], reflecting the specificity of this study. Nevertheless, the universality is manifested in that the vitality of parks and their influencing factors in different regions all exhibit variations due to social, racial, economic, cultural, and other factors. Therefore, this study not only provides profound insights into the spatial heterogeneity of park vitality in Changsha but also offers important references and inspirations for other regions studying the spatial heterogeneity of park vitality and its influencing factors.
Overall, the determinants influencing urban park vitality do not manifest uniform impacts across disparate spatial domains [89,90]. In the context of the evolving urban and economic landscape, examining elements influencing urban park vitality necessitates the incorporation of dynamic perspectives. The MGWR model, in comparison to its counterparts, is particularly adept at capturing the spatial non-stationarity inherent in factors affecting urban park vitality. It comprehensively accounts for spatial heterogeneity, thereby facilitating the attainment of simulations more aligned with empirical realities. This nuanced approach ensures that the model reflects the spatially variable nature of influencing factors and underscores the dynamic interplay of these factors within the urban fabric, resulting in a more nuanced and authentic representation of UGS vitality.
5.2. Effect of Urban Spatial Structure on the Heterogeneity of UGS Vitality
Considering the urban spatial structure, the trajectory of commerce and sports facilities’ development in Changsha City has been profoundly dictated by its inherent geographical conditions.
Traditionally, Changsha’s bustling commercial zones have predominantly unfurled along the banks of the Xiang River. As the ancient city walls were dismantled and large-scale road infrastructures were erected in modern times, there was a notable southeastward shift and expansion of the city’s area and populace. This shift became particularly pronounced post-2000, with the urban residential areas gradually moving eastward following the successful completion of the Wuyi Avenue expansion project. The current urban planning strategy, an iteration of the 2014 blueprint, revolves around the “Wuyi square” central axis and multiple auxiliary centers evolving synchronously. This strategic approach has given rise to mature urban sections like Yuelu University Science and Technology City and Huangxing Commercial Sub-center.
Under this framework, the western region is home to a cluster of universities, a predominantly young and middle-aged demographic, and comprehensively outfitted campus sports facilities. Conversely, the eastern region leans heavily towards commercial shopping, fostering a vibrant tourism economy with commercial streets densely interspersed. This stark contrast in the business orientation and demographic profile of Changsha’s Xiang riverbanks prompts noticeable discrepancies in the impact and correlation of the internal metrics on the vitality of the city’s eastern and western divisions. This nuanced observation underscores the heterogeneous nature of UGS preferences across different city regions.
The results unveiled by the MGWR bolster a trend wherein the variables under study depict pronounced heterogeneity in their influences on urban park vitality across spatial distribution, with each singular variable showcasing a clear linear trend within the urban spatial distribution. For instance, dining and shopping positively correlate with urban park vitality, with their influence intensifying from northeast to southwest in spatial distribution—a pattern echoed by other metrics. This insinuates the crucial role of urban location in impacting the efficacy of dependent variables on park vitality, thus underlining that any renewal strategies for Changsha’s UGS must prioritize the variability of a single factor’s influence on park vitality across diverse regions.
These results likely arise from differences in population demographics, economic composition, and transportation conditions among varying regions. For instance, Changsha exhibits a balanced pattern in the city center, with stark job-residential separation in the city outskirts [91]. The westward Yuelu District has universities, implying a broad educational distribution. The eastern Furong District—hosting Wuyi Square, Yuanjialing, and the railway station also presents its commercial structure’s highest concentration of large-scale integrated shopping centers. Such findings further underline the significance of examining spatial heterogeneity in UGS usage for subsequent construction.
5.3. Heterogeneous Differences in Factors Affecting UGS Vitality
The analytical outcomes derived from the MGWR model’s assessment of factors impacting UGS vitality are comprehensively tabulated in Table 6. Notably, within the ambit of internal indicators’ influence on vitality, open spaces predominantly correlate negatively with the vitality of urban green spaces in Changsha City. This finding diverges from established research paradigms yet does not inherently contradict other scholarly works that identify a positive linkage between open spaces and spatial vitality. In this context, ‘open space’ pertains to areas within urban parks designated for activities such as rest, social interaction, and other quotidian engagements, encompassing plazas, open grasslands, and sheltered bridges. Prior research predominantly pivots on the premise that open spaces foster interpersonal interactions and pauses, concluding a psychological experiential perspective. While prevailing studies advocate that open spaces are instrumental in attracting individuals, the empirical observations in actual park design suggest that an overabundance of open spaces may inadvertently lead to the dispersal of individuals, thereby attenuating the vibrancy of these spaces. This phenomenon aligns with the insights garnered from previous scholarly investigations [75].
Table 6.
Summary statistics for MGWR parameter estimates.
Contrastingly, amenities such as catering and commercial facilities serve as focal points for congregation, thereby amplifying the density of spatial vitality. This phenomenon underpins the observed positive correlation between indicators of catering businesses and park vitality in internal assessments. A noteworthy observation from the study is the predominantly positive correlation between the selected dependent variables and the northeastern quadrant of the study area. This pattern may be intricately linked to the temporal dynamics of urban development. Relative to the central urban core and the southwestern district, the northeastern sector is a later entrant in urban evolution, characterized by comparatively lower population density and infrastructural development. This area’s burgeoning demographic, fueled by urban–rural migration and the swift expansion of suburbs and emergent towns, has precipitated an escalating demand for multifunctional UGS. This trend underscores the heightened necessity for amenities within parks, resonating with the community’s evolving requirements. The observed correlation suggests that the internal park facilities, as delineated in the study, play a pivotal role in catalyzing the vitality of green spaces in the northeastern region. The research findings imply that the construction of internal indices, as conceptualized and implemented in this study, is instrumental in nurturing and enhancing the vibrancy of local green spaces, particularly in the burgeoning northeastern areas, thereby underscoring the efficacy of strategic amenity placement in fostering dynamic and lively UGS.
Previous research hinged on the notion that open spaces stimulate interpersonal interaction and dwell time, emphasizing psychosocial perception-based results [27,59,79]. Despite the conventional wisdom that open spaces effectively draw crowds, actual park development with a surplus of open spaces could lead to an overdispersion of individuals, suppressing vitality and aligning with prior investigations [75]. Conversely, dining and commercial facilities that can effectively concentrate people and elevate spatial vitality density may explain why such indices positively correlate with park vitality internally [74]. Notably, the selected dependent variables generally correlate positively with the northeastern region, potentially linked to its developmental timeline. Relative to the central and southwestern districts, the northeast experienced delayed development, with its population density and infrastructure level being relatively low. However, with the surge in urban-rural migration in recent years, rapidly expanding suburbs and newly developed towns face an escalating demand for multifunctional UGS.
Consequently, the higher demand for UGS infrastructure among participants suggests that the selected internal metrics could effectively kindle green space vitality in the northeastern region. As observed from the external factors, the vitality of UGS in Changsha City predominantly hinges on elements such as public infrastructure, external eateries, housing communities, and companies. This observation aligns seamlessly with prior studies [87,92,93], reiterating that residents from neighboring communities and corporate personnel persist as the primary contributors to UGS. Particularly in the northeast, the presence of companies significantly bolsters vitality. This might be attributed to this region’s dense concentration of industries and vocational institutions, where personnel from surrounding companies form a crucial segment of UGS participants.
Concurrently, the south witnesses a notable concentration of municipal public infrastructures, contributing more significantly to UGS vitality. While transportation facilities seemingly exert a suppressive impact on UGS vitality across all areas, their inhibitory influence is comparatively less pronounced in the northeast, indicating the indispensable nature of public transportation facilities, such as subway stations, particularly for urban parks farther from the city center. The suppressive role of transportation facilities on UGS vitality can be deciphered from the spatial patterns of Changsha’s job–housing distribution, which is marked by significant commuting distance and time disparities. With a high frequency of population movement and dense residential communities, especially in the southwest, which has a dearth of office facilities, the problem of job-housing segregation becomes pronounced. This intensifies the commuting pressures on residents, thereby triggering a negative impact on park vitality—an effect most conspicuous in the southwest. Conversely, in the southeast and northeast regions, public infrastructure and businesses have effectively addressed local employment concerns, thereby centralizing job-housing and minimizing the impact of commuting.
In summary, findings from the MGWR study underline the considerable spatial variations in how the chosen independent variables influence the vitality of UGS. From an urban developmental history perspective, the increasing urban migration and peripheral expansion have amplified the differential manifestations of urban population characteristics, economic conditions, and transportation facilities across various urban regions. These evolving regional disparities and urban growth have resulted in heterogeneous park space needs, further echoed in the diverse promoting effects of different built environment indicators on UGS vitality. The diversity of parkgoers and the evolving nature of the surrounding built environments necessitate a fresh evaluation of the varied roles of different indices in stimulating park vitality during the construction of urban parks in diverse regions.
6. Conclusions
This study innovatively utilizes the MGWR model and multi-source big data, including Baidu Huiyan vitality data and Amap geospatial data, to investigate the spatial vitality of urban green spaces at the city scale. The research reveals marked spatial heterogeneity in factors influencing park vitality across diverse urban sectors, providing insights into intricate spatial patterns and dependencies between park vitality, residential communities, and commercial amenities. This methodological advancement beyond traditional frameworks enhances precision in assessing UGS vitality, offering valuable guidance for urban planners and policymakers. The study highlights the importance of recognizing and incorporating spatial heterogeneity in urban park planning, catering to dynamic urban evolution and economic development levels.
Furthermore, the methodologies and outcomes of this study hold considerable importance for park planning in Chinese urban centers, particularly Changsha, and offer novel perspectives and tools for investigating park vitality in other international cities. By examining the characteristics and determinants of park vitality across various countries and regions, this research contributes to a deeper comprehension of the global patterns and regional disparities in urban green space vitality. Consequently, it provides valuable references for planning and managing urban green spaces worldwide.
The research highlights factors influencing UGS vitality, both internal and external facilities, in Changsha’s case study. These factors exhibit non-uniform spatial distributions, such as eateries impacting more from the northeast to the southwest, while sports facilities show an east–west divergence. The MGWR model outperforms traditional ones, offering nuanced insights for tailored UGS strategies. The study suggests prioritizing multifunctional UGS in Changsha’s northeast for enhanced vitality, emphasizing minimal influence from augmenting transportation infrastructure. A customized approach is advocated for addressing specific human resource needs in different areas.
The limitations of our study primarily stem from potential inaccuracies in spatial vitality data due to errors in data location features and potential underrepresentation of particular demographic groups, notably older people and children. There is a recommendation to explore and implement novel data collection methods to address these limitations in future research. Such efforts aim to ensure a more comprehensive and representative dataset, ultimately enhancing the precision of UGS updates, fostering improved park environments, and contributing positively to urban dwellers’ overall quality of life.
Author Contributions
Conceptualization, L.Q. and W.Z.; methodology, L.Q. and W.Z.; software, L.Q. and W.Z.; validation, L.Q., W.Z. and K.P.; formal analysis, L.Q. and K.P.; investigation, L.Q. and W.Z.; resources, R.Z.; data curation, W.Z.; writing—original draft preparation, L.Q., W.Z. and K.P.; writing—review and editing, R.Z.; visualization, W.Z.; supervision, R.Z.; project administration, R.Z.; funding acquisition, R.Z. All authors have read and agreed to the published version of the manuscript.
Funding
This research was funded by the Department of Natural Resources of Hunan Province for a major science and technology project “Research on Key Technologies of Land Spatial Planning and Monitoring and Supervision in Hunan Province” (202201) and National Natural Science Foundation of China (No. 52278059).
Data Availability Statement
The original contributions presented in the study are included in the article; further inquiries can be directed to the corresponding author.
Conflicts of Interest
The authors declare no conflicts of interest.
References
- Wang, X.-J. Analysis of problems in urban green space system planning in China. J. For. Res. 2009, 20, 79–82. [Google Scholar] [CrossRef]
- Liu, C.; Cao, M.; Yang, T.; Ma, L.; Wu, M.; Cheng, L.; Ye, R. Inequalities in the commuting burden: Institutional constraints and job-housing relationships in Tianjin, China. Res. Transp. Bus. Manag. 2022, 42, 100545. [Google Scholar] [CrossRef]
- Zhang, Y.; Mao, W.; Zhang, B. Distortion of government behaviour under target constraints: Economic growth target and urban sprawl in China. Cities 2022, 131, 104009. [Google Scholar] [CrossRef]
- Park, S.H.; Petrunoff, N.A.; Wang, N.X.; van Dam, R.M.; Sia, A.; Tan, C.S.; Müller-Riemenschneider, F. Daily park use, physical activity, and psychological stress: A study using smartphone-based ecological momentary assessment amongst a multi-ethnic Asian cohort. Ment. Health Phys. Act. 2022, 22, 100440. [Google Scholar] [CrossRef]
- Deng, Z.; Chen, Y.; Yang, J.; Causone, F. AutoBPS: A Tool for Urban Building Energy Modeling to Support Energy Efficiency Improvement at City-Scale. Energy Build. 2023, 282, 112794. [Google Scholar] [CrossRef]
- Martins, B. Where to construct new urban green spaces to be at the recommended distance from users and to complement existing ones? A study in five cities of northern Portugal. Urban For. Urban Green. 2022, 72, 127571. [Google Scholar] [CrossRef]
- Wang, J.; Zhang, Y.; Zhang, X.; Song, M.; Ye, J. The spatio-temporal trends of urban green space and its interactions with urban growth: Evidence from the Yangtze River Delta region, China. Land Use Policy 2023, 128, 106598. [Google Scholar] [CrossRef]
- Montgomery, J. Making a city: Urbanity, vitality and urban design. J. Urban Des. 1998, 3, 93–116. [Google Scholar] [CrossRef]
- Jacobs, J. The Death and Life of Great American Cities. The Failure of Town Planning; The Ohio State University Press: New York, NY, USA, 1961; p. 71. [Google Scholar]
- Zhang, Z.; Xiao, Y.; Luo, X.; Zhou, M. Urban human activity density spatiotemporal variations and the relationship with geographical factors: An exploratory Baidu heatmaps-based analysis of Wuhan, China. Growth Change 2020, 51, 505–529. [Google Scholar] [CrossRef]
- Yang, J.; Deng, Z.; Guo, S.; Chen, Y. Development of Bottom-up Model to Estimate Dynamic Carbon Emission for City-Scale Buildings. Appl. Energy 2023, 331, 120410. [Google Scholar] [CrossRef]
- Veitch, J.; Ball, K.; Rivera, E.; Loh, V.; Deforche, B.; Best, K.; Timperio, A. What entices older adults to parks? Identification of park features that encourage park visitation, physical activity, and social interaction. Landsc. Urban Plan. 2022, 217, 104254. [Google Scholar] [CrossRef]
- Park, K.; Ewing, R. The usability of unmanned aerial vehicles (UAVs) for measuring park-based physical activity. Landsc. Urban Plan. 2017, 167, 157–164. [Google Scholar] [CrossRef]
- Lis, A.; Zalewska, K.; Pardela, Ł.; Adamczak, E.; Cenarska, A.; Bławicka, K.; Brzegowa, B.; Matiiuk, A. How the amount of greenery in city parks impacts visitor preferences in the context of naturalness, legibility and perceived danger. Landsc. Urban Plan. 2022, 228, 104556. [Google Scholar] [CrossRef]
- Shi, P.; Xiao, Y.; Zhan, Q. A Study on spatial and temporal aggregation patterns of urban population in wuhan city based on baidu heat map and POI data. Int. Rev. Spat. Plan. Sustain. Dev. 2020, 8, 101–121. [Google Scholar] [CrossRef] [PubMed]
- Chuang, I.-T.; Benita, F.; Tunçer, B. Effects of urban park spatial characteristics on visitor density and diversity: A geolocated social media approach. Landsc. Urban Plan. 2022, 226, 104514. [Google Scholar] [CrossRef]
- Huai, S.; Chen, F.; Liu, S.; Canters, F.; Van de Voorde, T. Using social media photos and computer vision to assess cultural ecosystem services and landscape features in urban parks. Ecosyst. Serv. 2022, 57, 101475. [Google Scholar] [CrossRef]
- Liu, Y.; Hu, J.; Yang, W.; Luo, C. Effects of urban park environment on recreational jogging activity based on trajectory data: A case of Chongqing, China. Urban For. Urban Green. 2022, 67, 127443. [Google Scholar] [CrossRef]
- Kong, L.; Liu, Z.; Pan, X.; Wang, Y.; Guo, X.; Wu, J. How do different types and landscape attributes of urban parks affect visitors’ positive emotions? Landsc. Urban Plan. 2022, 226, 104482. [Google Scholar] [CrossRef]
- Roberts, H.V. Using Twitter data in urban green space research: A case study and critical evaluation. Appl. Geogr. 2017, 81, 13–20. [Google Scholar] [CrossRef]
- Lang, W.; Lang, H.; Hui, E.C.M.; Chen, T.; Wu, J.; Jahre, M. Measuring urban vibrancy of neighborhood performance using social media data in Oslo, Norway. Cities 2022, 131, 103908. [Google Scholar] [CrossRef]
- Veitch, J.; Carver, A.; Abbott, G.; Giles-Corti, B.; Timperio, A.; Salmon, J. How active are people in metropolitan parks? An observational study of park visitation in Australia. BMC Public Health 2015, 15, 1–8. [Google Scholar] [CrossRef] [PubMed]
- Oshan, T.M.; Fotheringham, A.S. A Comparison of Spatially Varying Regression Coefficient Estimates Using Geographically Weighted and Spatial-Filter-Based Techniques. Geogr. Anal. 2018, 50, 53–75. [Google Scholar] [CrossRef]
- Fotheringham, A.S.; Yang, W.; Kang, W. Multiscale geographically weighted regression (MGWR). Ann. Am. Assoc. Geogr. 2017, 107, 1247–1265. [Google Scholar] [CrossRef]
- Forati, A.M.; Ghose, R.; Mantsch, J.R. Examining Opioid Overdose Deaths across Communities Defined by Racial Composition: A Multiscale Geographically Weighted Regression Approach. J. Urban Health 2021, 98, 551–562. [Google Scholar] [CrossRef] [PubMed]
- Foresman, T.; Luscombe, R. The second law of geography for a spatially enabled economy. Int. J. Digit. Earth 2017, 10, 979–995. [Google Scholar] [CrossRef]
- Samsudin, R.; Yok, T.P.; Chua, V. Social capital formation in high density urban environments: Perceived attributes of neighborhood green space shape social capital more directly than physical ones. Landsc. Urban Plan. 2022, 227, 104527. [Google Scholar] [CrossRef]
- Tobler, W. On the first law of geography: A reply. Ann. Assoc. Am. Geogr. 2004, 94, 304–310. [Google Scholar] [CrossRef]
- Cao, X.; Shi, Y.; Zhou, L.; Tao, T.; Yang, Q. Analysis of factors influencing the urban carrying capacity of the shanghai metropolis based on a multiscale geographically weighted regression (MGWR) model. Land 2021, 10, 578. [Google Scholar] [CrossRef]
- Sisman, S.; Aydinoglu, A.C. A modelling approach with geographically weighted regression methods for determining geographic variation and influencing factors in housing price: A case in Istanbul. Land Use Policy 2022, 119, 106183. [Google Scholar] [CrossRef]
- Chien, Y.-M.C.; Carver, S.; Comber, A. Using geographically weighted models to explore how crowdsourced landscape perceptions relate to landscape physical characteristics. Landsc. Urban Plan. 2020, 203, 103904. [Google Scholar] [CrossRef]
- Zhou, Q.; Wang, C.; Fang, S. Application of geographically weighted regression (GWR) in the analysis of the cause of haze pollution in China. Atmos. Pollut. Res. 2019, 10, 835–846. [Google Scholar] [CrossRef]
- Senyel Kurkcuoglu, M.A. Analysis of the energy justice in natural gas distribution with Multiscale Geographically Weighted Regression (MGWR). Energy Rep. 2023, 9, 325–337. [Google Scholar] [CrossRef]
- Permai, S.D.; Christina, A.; Gunawan, A.A.S. Fiscal decentralization analysis that affect economic performance using geographically weighted regression (GWR). Procedia Comput. Sci. 2021, 179, 399–406. [Google Scholar] [CrossRef]
- Wu, D. Spatially and temporally varying relationships between ecological footprint and influencing factors in China’s provinces Using Geographically Weighted Regression (GWR). J. Clean. Prod. 2020, 261, 121089. [Google Scholar] [CrossRef]
- Chen, T.-L.; Lin, Z.-H. Impact of land use types on the spatial heterogeneity of extreme heat environments in a metropolitan area. Sustain. Cities Soc. 2021, 72, 103005. [Google Scholar] [CrossRef]
- Cohen, D.A.; Marsh, T.; Williamson, S.; Derose, K.P.; Martinez, H.; Setodji, C.; McKenzie, T.L. Parks and physical activity: Why are some parks used more than others? Prev. Med. 2010, 50, S9–S12. [Google Scholar] [CrossRef] [PubMed]
- McCormack, G.R.; Rock, M.; Toohey, A.M.; Hignell, D. Characteristics of urban parks associated with park use and physical activity: A review of qualitative research. Health Place 2010, 16, 712–726. [Google Scholar] [CrossRef] [PubMed]
- Xue, C.; Chen, X.; Xue, L.; Zhang, H.; Chen, J.; Li, D. Modeling the spatially heterogeneous relationships between tradeoffs and synergies among ecosystem services and potential drivers considering geographic scale in Bairin Left Banner, China. Sci. Total. Environ. 2023, 855, 158834. [Google Scholar] [CrossRef] [PubMed]
- Lu, B.; Ge, Y.; Shi, Y.; Zheng, J.; Harris, P. Uncovering drivers of community-level house price dynamics through multiscale geographically weighted regression: A case study of Wuhan, China. Spat. Stat. 2023, 53, 100723. [Google Scholar] [CrossRef]
- Mansour, S.; Al Kindi, A.; Al-Said, A.; Al-Said, A.; Atkinson, P. Sociodemographic determinants of COVID-19 incidence rates in Oman: Geospatial modelling using multiscale geographically weighted regression (MGWR). Sustain. Cities Soc. 2021, 65, 102627. [Google Scholar] [CrossRef] [PubMed]
- Wu, C.; Ye, X.; Ren, F.; Du, Q. Check-in behaviour and spatio-temporal vibrancy: An exploratory analysis in Shenzhen, China. Cities 2018, 77, 104–116. [Google Scholar] [CrossRef]
- Montgomery, J. Editorial Urban Vitality and the Culture of Cities. Plan. Pract. Res. 1995, 10, 101–110. [Google Scholar] [CrossRef]
- Mohammed, A.; Khan, A.; Santamouris, M. Numerical evaluation of enhanced green infrastructures for mitigating urban heat in a desert urban setting. Build. Simul. 2023, 16, 1691–1712. [Google Scholar] [CrossRef]
- Zhou, L.; Shi, Y.; Zheng, J. Business circle identification and spatiotemporal characteristics in the main urban area of yiwu city based on POI and night-time light data. Remote Sens. 2021, 13, 5153. [Google Scholar] [CrossRef]
- Yue, Y.; Zhuang, Y.; Yeh, A.G.-O.; Xie, J.-Y.; Ma, C.-L.; Li, Q.-Q. Measurements of POI-based mixed use and their relationships with neighbourhood vibrancy. Int. J. Geogr. Inf. Sci. 2017, 31, 658–675. [Google Scholar] [CrossRef]
- Song, Y.; Huang, B.; Cai, J.; Chen, B. Dynamic assessments of population exposure to urban greenspace using multi-source big data. Sci. Total. Environ. 2018, 634, 1315–1325. [Google Scholar] [CrossRef] [PubMed]
- Deng, Z.; Zhu, Y.; Liu, M.; Wang, S. Using Big Data for a Comprehensive Evaluation of Urban Vitality: A Case Study of Guangzhou, China. In Proceedings of the 2022 5th International Conference on Artificial Intelligence and Big Data (ICAIBD), Chengdu, China, 27–30 May 2022; pp. 361–368. [Google Scholar]
- Gibbs, H.; Liu, Y.; Pearson, C.A.B.; Jarvis, C.I.; Grundy, C.; Quilty, B.J.; Diamond, C.; Eggo, R.M.; Simons, D.; Gimma, A.; et al. Changing travel patterns in China during the early stages of the COVID-19 pandemic. Nat. Commun. 2020, 11, 5012. [Google Scholar] [CrossRef] [PubMed]
- Oshan, T.M.; Li, Z.; Kang, W.; Wolf, L.J.; Fotheringham, A.S. MGWR: A python implementation of multiscale geographically weighted regression for investigating process spatial heterogeneity and scale. ISPRS Int. J. Geo-Inf. 2019, 8, 269. [Google Scholar] [CrossRef]
- Iyanda, A.E.; Osayomi, T. Is there a relationship between economic indicators and road fatalities in Texas? A multiscale geographically weighted regression analysis. GeoJournal 2021, 86, 2787–2807. [Google Scholar] [CrossRef]
- Gong, S.; Cartlidge, J.; Bai, R.; Yue, Y.; Li, Q.; Qiu, G. Geographical and temporal huff model calibration using taxi trajectory data. GeoInformatica 2020, 25, 485–512. [Google Scholar] [CrossRef]
- Soltani, A.; Pettit, C.J.; Heydari, M.; Aghaei, F. Housing price variations using spatio-temporal data mining techniques. J. Hous. Built Environ. 2021, 36, 1199–1227. [Google Scholar] [CrossRef]
- Wang, Q.; Jiang, D.; Gao, Y.; Zhang, Z.; Chang, Q. Examining the Driving Factors of SOM Using a Multi-Scale GWR Model Augmented by Geo-Detector and GWPCA Analysis. Agronomy 2022, 12, 1697. [Google Scholar] [CrossRef]
- Wang, X.; Zhang, Y.; Yu, D.; Qi, J.; Li, S. Investigating the spatiotemporal pattern of urban vibrancy and its determinants: Spatial big data analyses in Beijing, China. Land Use Policy 2022, 119, 106162. [Google Scholar] [CrossRef]
- Pfiester, L.M.; Thompson, R.G.; Zhang, L. Spatiotemporal exploration of Melbourne pedestrian demand. J. Transp. Geogr. 2021, 95, 103151. [Google Scholar] [CrossRef]
- Yujia, Z.; Chengzhao, W.U. Identification of Main Influencing Factors on Urban Park Overall Satisfaction: Based on Analysis of Users of Different Age Groups. Landsc. Archit. 2021, 28, 57–62. [Google Scholar]
- Sen, A.; Nagendra, H. Local community engagement, environmental placemaking and stewardship by migrants: A case study of lake conservation in Bengaluru, India. Landsc. Urban Plan. 2020, 204, 103933. [Google Scholar] [CrossRef]
- Voigt, A.; Kabisch, N.; Wurster, D.; Haase, D.; Breuste, J. Structural diversity: A multi-dimensional approach to assess recreational services in urban parks. AMBIO 2014, 43, 480–491. [Google Scholar] [CrossRef] [PubMed]
- Veitch, J.; Ball, K.; Flowers, E.; Deforche, B.; Timperio, A. Children’s ratings of park features that encourage park visitation, physical activity and social interaction. Urban For. Urban Green. 2021, 58, 126963. [Google Scholar] [CrossRef]
- Lin, J.; Cromley, R.G. Evaluating geo-located Twitter data as a control layer for areal interpolation of population. Appl. Geogr. 2015, 58, 41–47. [Google Scholar] [CrossRef]
- Longley, P.A.; Frank Goodchild, M. Geographic Information Science and Systems. International Encyclopedia of Human Geography, 2nd ed.; John Wiley & Sons: New York, NY, USA, 2019. [Google Scholar]
- Shen, Y.; Karimi, K. Urban function connectivity: Characterisation of functional urban streets with social media check-in data. Cities 2016, 55, 9–21. [Google Scholar] [CrossRef]
- Hao, P.; He, S. What is holding farmers back? Endowments and mobility choice of rural citizens in China. J. Rural. Stud. 2022, 89, 66–72. [Google Scholar] [CrossRef]
- Shi, R.; Yeh, A.G.-O. Do similar social groups have similar mobility in a city? Social areas and mobility in Shenzhen, China. Cities 2023, 138, 104350. [Google Scholar] [CrossRef]
- Gu, H.; Lin, Y.; Shen, T. Do you feel accepted? Perceived acceptance and its spatially varying determinants of migrant workers among Chinese cities. Cities 2022, 125, 103626. [Google Scholar] [CrossRef]
- Osypuk, T.L.; Galea, S.; McArdle, N.; Acevedo-Garcia, D. Quantifying separate and unequal: Racial-Ethnic distributions of neighborhood poverty in metropolitan America. Urban Aff. Rev. 2009, 45, 25–65. [Google Scholar] [CrossRef] [PubMed]
- Lichter, D.T.; Parisi, D.; Ambinakudige, S. The Spatial Integration of Immigrants in Europe: A Cross-National Study. Popul. Res. Policy Rev. 2020, 39, 465–491. [Google Scholar] [CrossRef]
- James, A.; Rowley, S.; Davies, A.; ViforJ, R.O.; Singh, R. Population growth and mobility in Australia: Implications for housing and urban development policies. AHURI Final. Rep. 2021, 82. [Google Scholar] [CrossRef]
- Jiang, S.; Alves, A.; Rodrigues, F.; Ferreira, J., Jr.; Pereira, F.C. Mining point-of-interest data from social networks for urban land use classification and disaggregation. Comput. Environ. Urban Syst. 2015, 53, 36–46. [Google Scholar] [CrossRef]
- Huang, L.; Li, Q.; Yue, Y. Activity identification from GPS trajectories using spatial temporal POIs attractiveness. In Proceedings of the 2nd ACM SIGSPATIAL International Workshop on Location Based Social Networks, San Jose, CA, USA, 2 November 2010. LBSN 2010-Held in Conjunction with ACM SIGSPATIAL GIS 2010. [Google Scholar]
- Zhong, J.; Li, Z.; Sun, Z.; Tian, Y.; Yang, F. The spatial equilibrium analysis of urban green space and human activity in Chengdu, China. J. Clean. Prod. 2020, 259, 120754. [Google Scholar] [CrossRef]
- Jia, T.; Ji, Z. Understanding the functionality of human activity hotspots from their scaling pattern using trajectory data. ISPRS Int. J. Geo-Inf. 2017, 6, 341. [Google Scholar] [CrossRef]
- Zhou, C.; An, Y.; Zhao, J.; Xue, Y.; Fu, L. How do mini-parks serve in groups? A visit analysis of mini-park groups in the neighbourhoods of Nanjing. Cities 2022, 129, 103804. [Google Scholar] [CrossRef]
- Lyu, F.; Zhang, L. Using multi-source big data to understand the factors affecting urban park use in Wuhan. Urban For. Urban Green. 2019, 43, 126367. [Google Scholar] [CrossRef]
- Zhang, S.; Zhou, W. Recreational visits to urban parks and factors affecting park visits: Evidence from geotagged social media data. Landsc. Urban Plan. 2018, 180, 27–35. [Google Scholar] [CrossRef]
- Petrunoff, N.A.; Edney, S.; Yi, N.X.; Dickens, B.L.; Joel, K.R.; Xin, W.N.; Sia, A.; Leong, D.; van Dam, R.M.; Cook, A.R.; et al. Associations of park features with park use and park-based physical activity in an urban environment in Asia: A cross-sectional study. Health Place 2022, 75, 102790. [Google Scholar] [CrossRef] [PubMed]
- Zhang, R.; Zhang, C.-Q.; Lai, P.C.; Kwan, M.-P. Park and neighbourhood environmental characteristics associated with park-based physical activity among children in a high-density city. Urban For. Urban Green. 2022, 68, 127479. [Google Scholar] [CrossRef]
- Oviedo, M.; Drescher, M.; Dean, J. Urban greenspace access, uses, and values: A case study of user perceptions in metropolitan ravine parks. Urban For. Urban Green. 2022, 70, 127522. [Google Scholar] [CrossRef]
- Mu, B.; Liu, C.; Mu, T.; Xu, X.; Tian, G.; Zhang, Y.; Kim, G. Spatiotemporal fluctuations in urban park spatial vitality determined by on-site observation and behavior mapping: A case study of three parks in Zhengzhou City, China. Urban For. Urban Green. 2021, 64, 127246. [Google Scholar] [CrossRef]
- Zhai, Y.; Li, D.; Wu, C.; Wu, H. Urban park facility use and intensity of seniors’ physical activity—An examination combining accelerometer and GPS tracking. Landsc. Urban Plan. 2021, 205, 103950. [Google Scholar] [CrossRef]
- L’Aoustet, O.; Griffet, J. The Experience of Teenagers at Marseilles’ Skate Park: Emergence and Evaluation of an Urban Sports Site. Cities 2001, 18, 413–418. [Google Scholar] [CrossRef]
- Mollalo, A.; Vahedi, B.; Rivera, K.M. GIS-based spatial modeling of COVID-19 incidence rate in the continental United States. Sci. Total. Environ. 2020, 728, 138884. [Google Scholar] [CrossRef]
- Yu, H.; Fotheringham, A.S.; Li, Z.; Oshan, T.; Kang, W.; Wolf, L.J. Inference in Multiscale Geographically Weighted Regression. Geogr. Anal. 2020, 52, 87–106. [Google Scholar] [CrossRef]
- Jin, M.; Gong, L.; Cao, Y.; Zhang, P.; Gong, Y.; Liu, Y. Identifying borders of activity spaces and quantifying border effects on intra-urban travel through spatial interaction network. Comput. Environ. Urban Syst. 2021, 87, 101625. [Google Scholar] [CrossRef]
- Rivera, E.; Timperio, A.; Loh, V.H.Y.; Deforche, B.; Veitch, J. Critical factors influencing adolescents’ active and social park use: A qualitative study using walk-along interviews. Urban For. Urban Green. 2021, 58, 126948. [Google Scholar] [CrossRef]
- Huai, S.; Liu, S.; Zheng, T.; Van de Voorde, T. Are social media data and survey data consistent in measuring park visitation, park satisfaction, and their influencing factors? A case study in Shanghai. Urban For. Urban Green. 2023, 81, 127869. [Google Scholar] [CrossRef]
- Lee, S.H.; Kang, J.E. Impact of particulate matter and urban spatial characteristics on urban vitality using spatiotemporal big data. Cities 2022, 131, 104030. [Google Scholar] [CrossRef]
- Tu, W.; Zhu, T.; Xia, J.; Zhou, Y.; Lai, Y.; Jiang, J.; Li, Q. Portraying the spatial dynamics of urban vibrancy using multisource urban big data. Comput. Environ. Urban Syst. 2020, 80, 101428. [Google Scholar] [CrossRef]
- Huang, Y.; Lin, T.; Zhang, G.; Zhu, Y.; Zeng, Z.; Ye, H. Spatial patterns of urban green space and its actual utilization status in China based on big data analysis. Big Earth Data 2021, 5, 391–409. [Google Scholar] [CrossRef]
- Zhuoya, X.; Min, Y.; Yuhan, D.; Bin, D.; Xuan, T. The Exploration of the Jobs-Housing Relationship in Changsha Based on the Perspective of Big Data. Chin. Overseas Archit. 2019, 4, 59–62. [Google Scholar] [CrossRef]
- Fan, Z.; Duan, J.; Lu, Y.; Zou, W.; Lan, W. A geographical detector study on factors influencing urban park use in Nanjing, China. Urban For. Urban Green. 2021, 59, 126996. [Google Scholar] [CrossRef]
- Hamstead, Z.A.; Fisher, D.; Ilieva, R.T.; Wood, S.A.; McPhearson, T.; Kremer, P. Geolocated social media as a rapid indicator of park visitation and equitable park access. Comput. Environ. Urban Syst. 2018, 72, 38–50. [Google Scholar] [CrossRef]
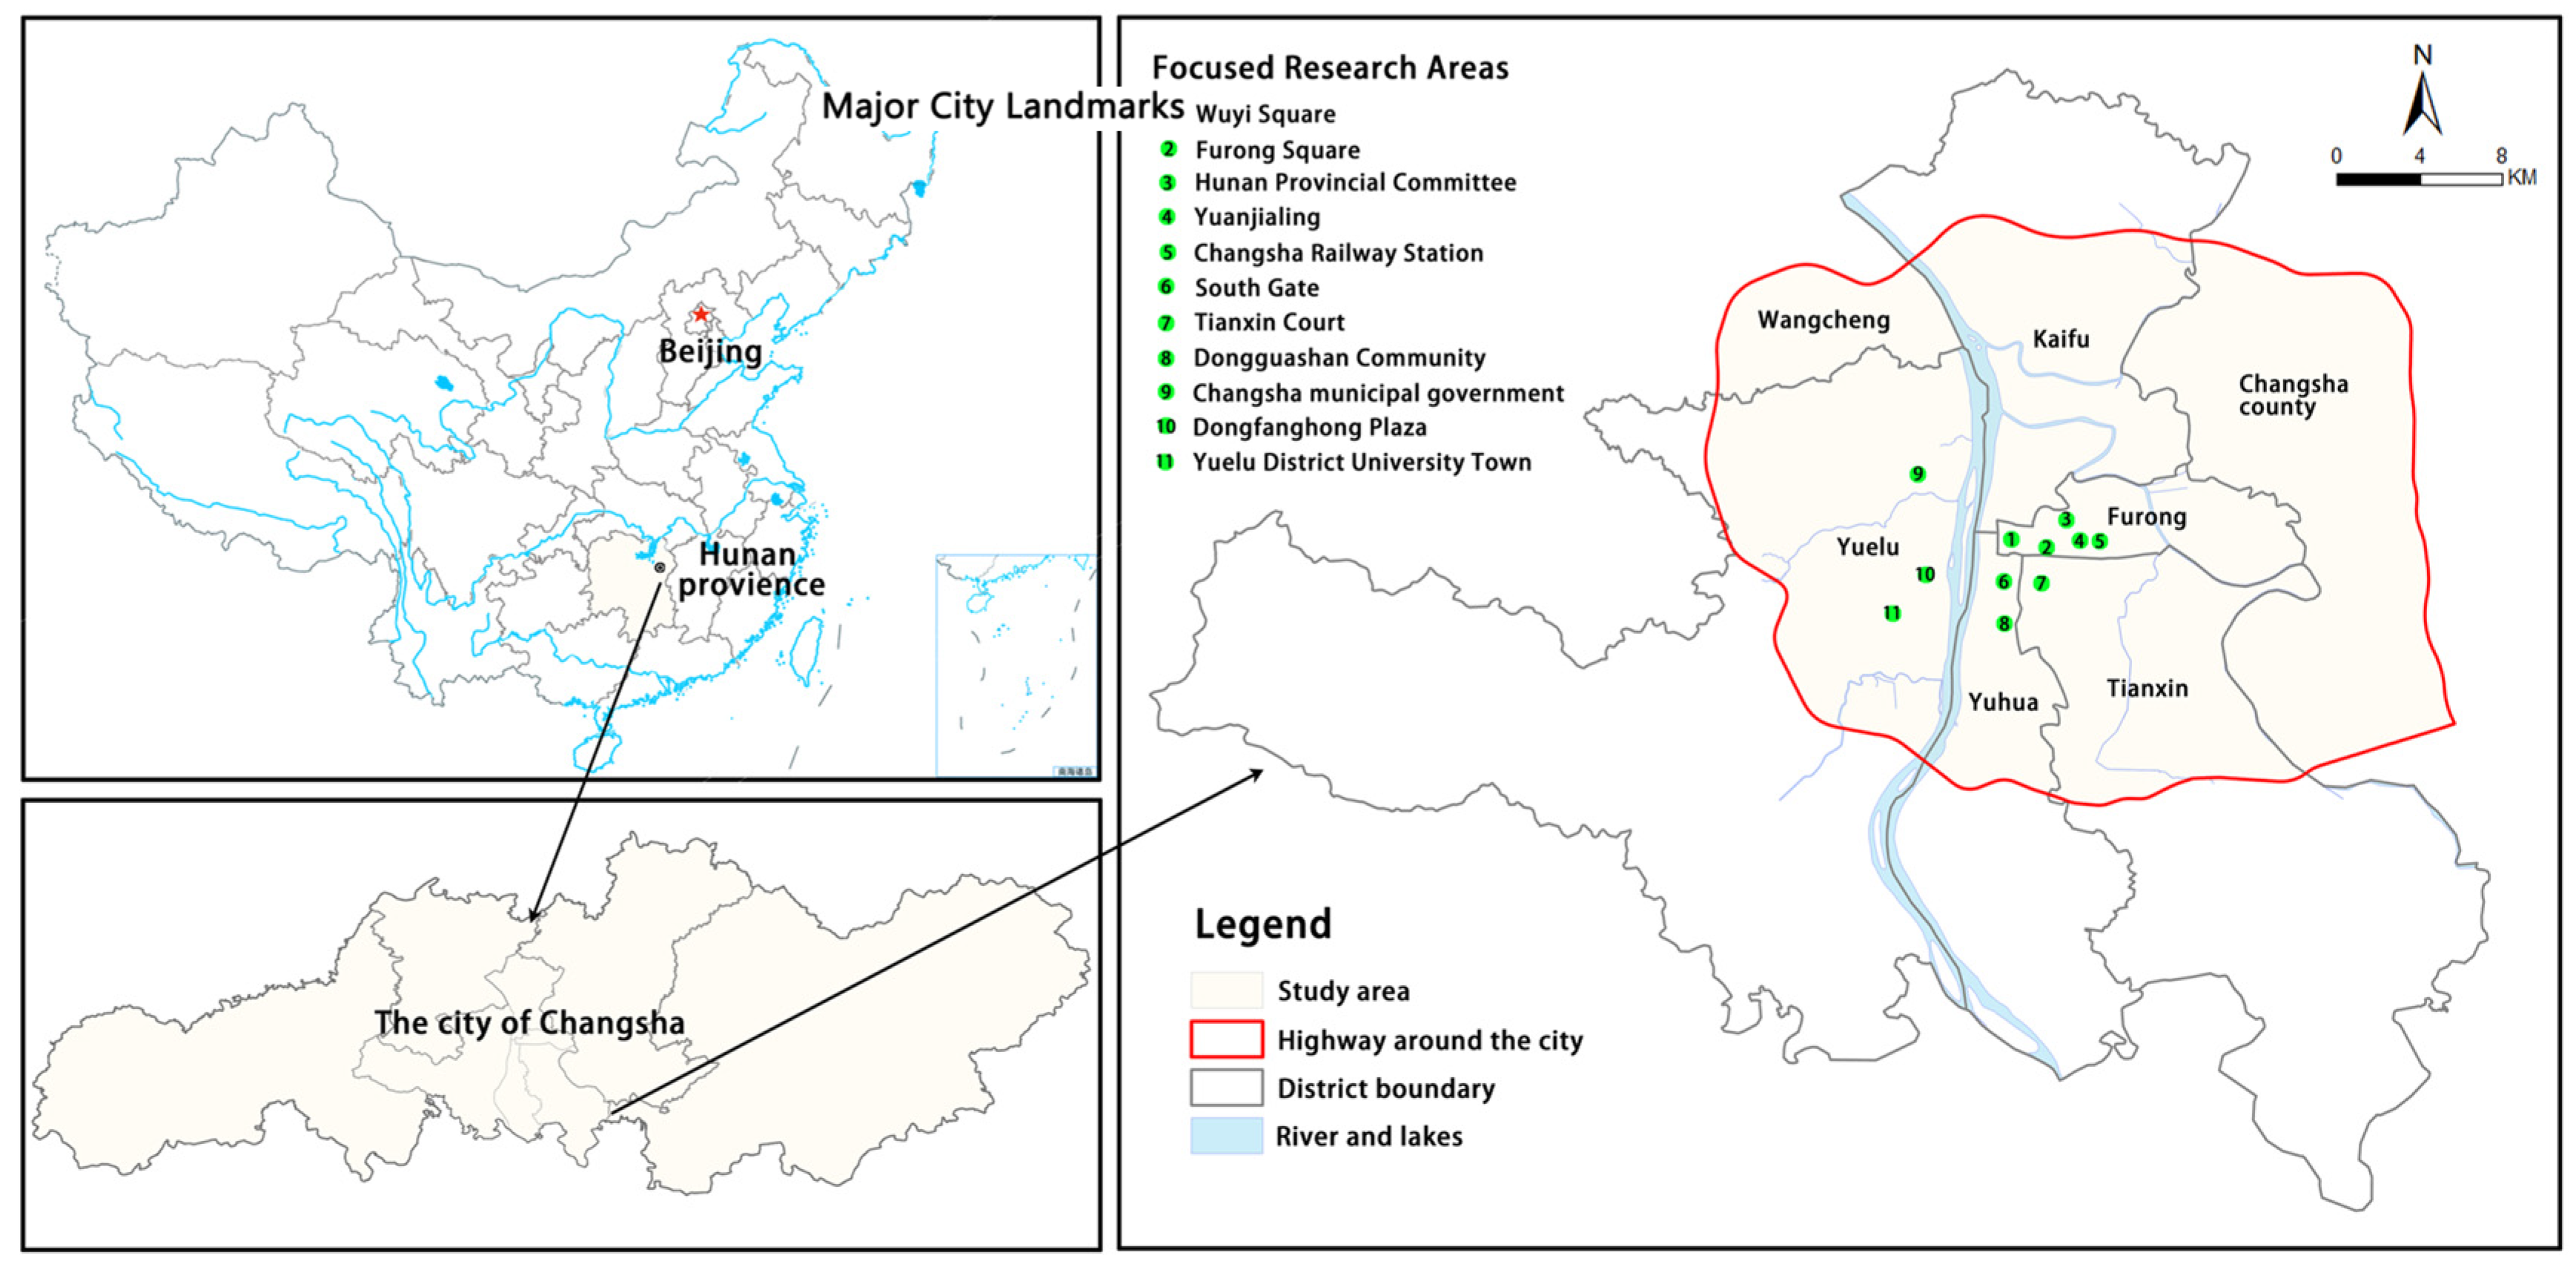
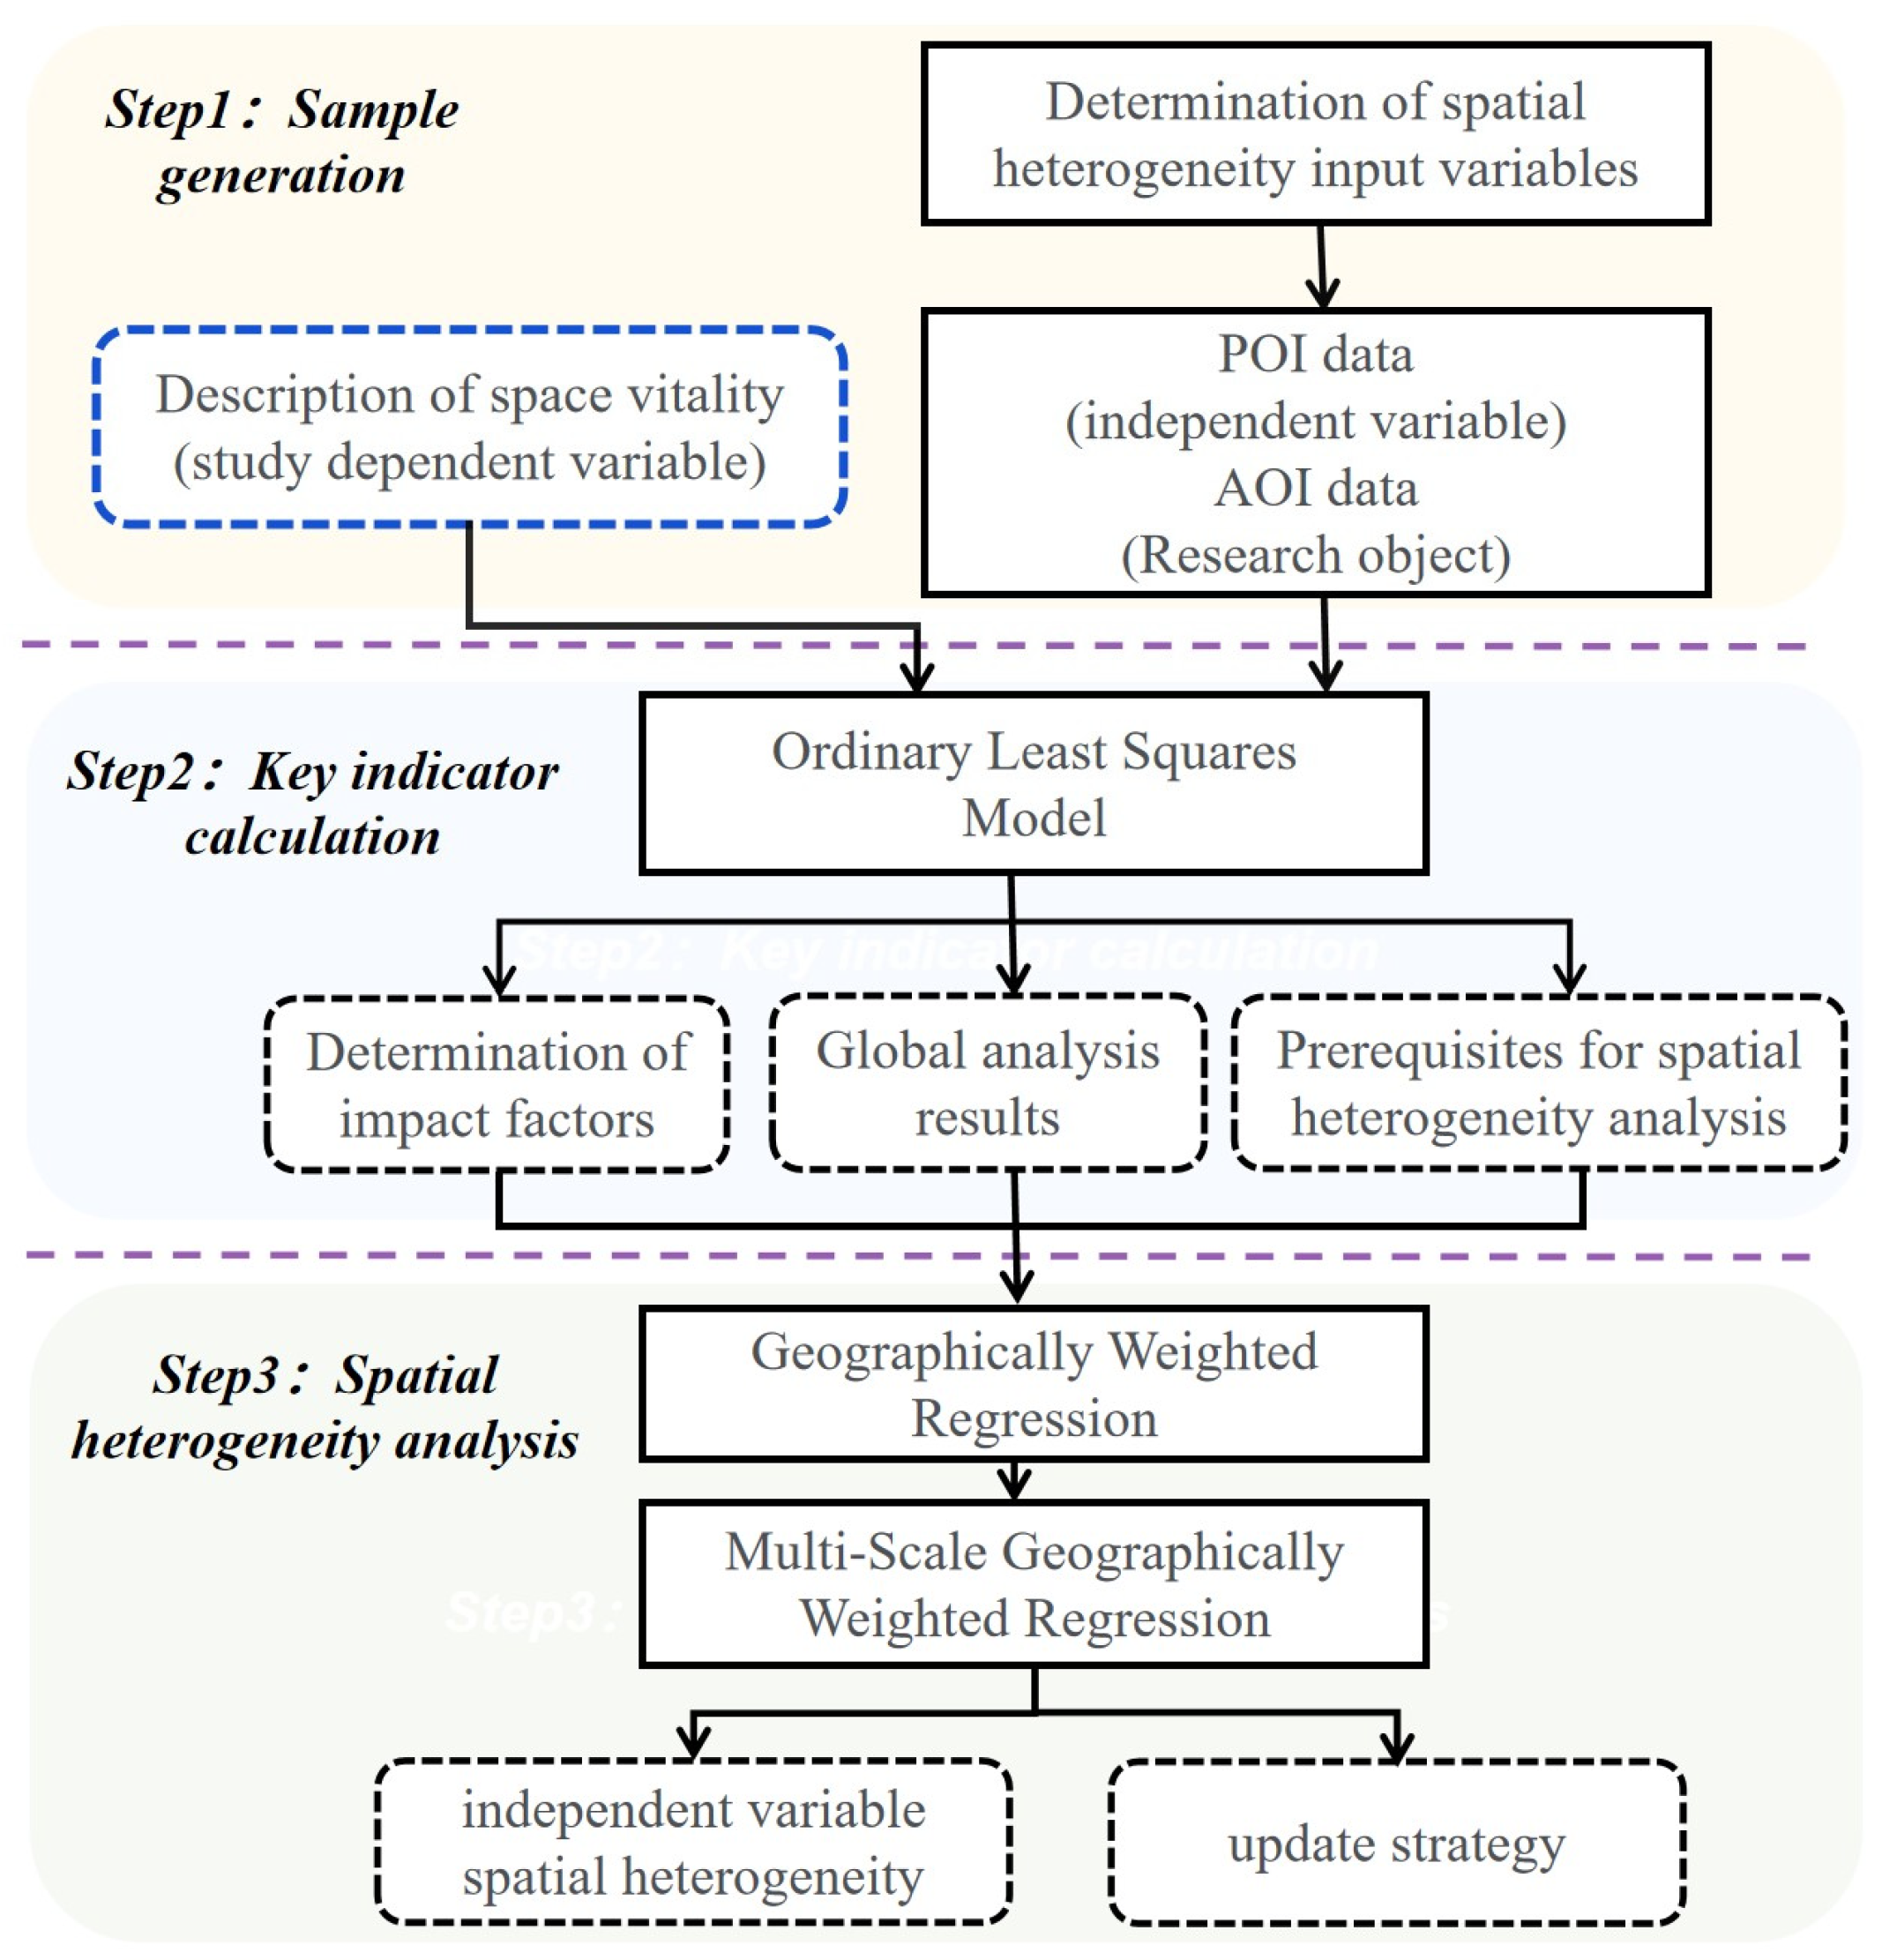

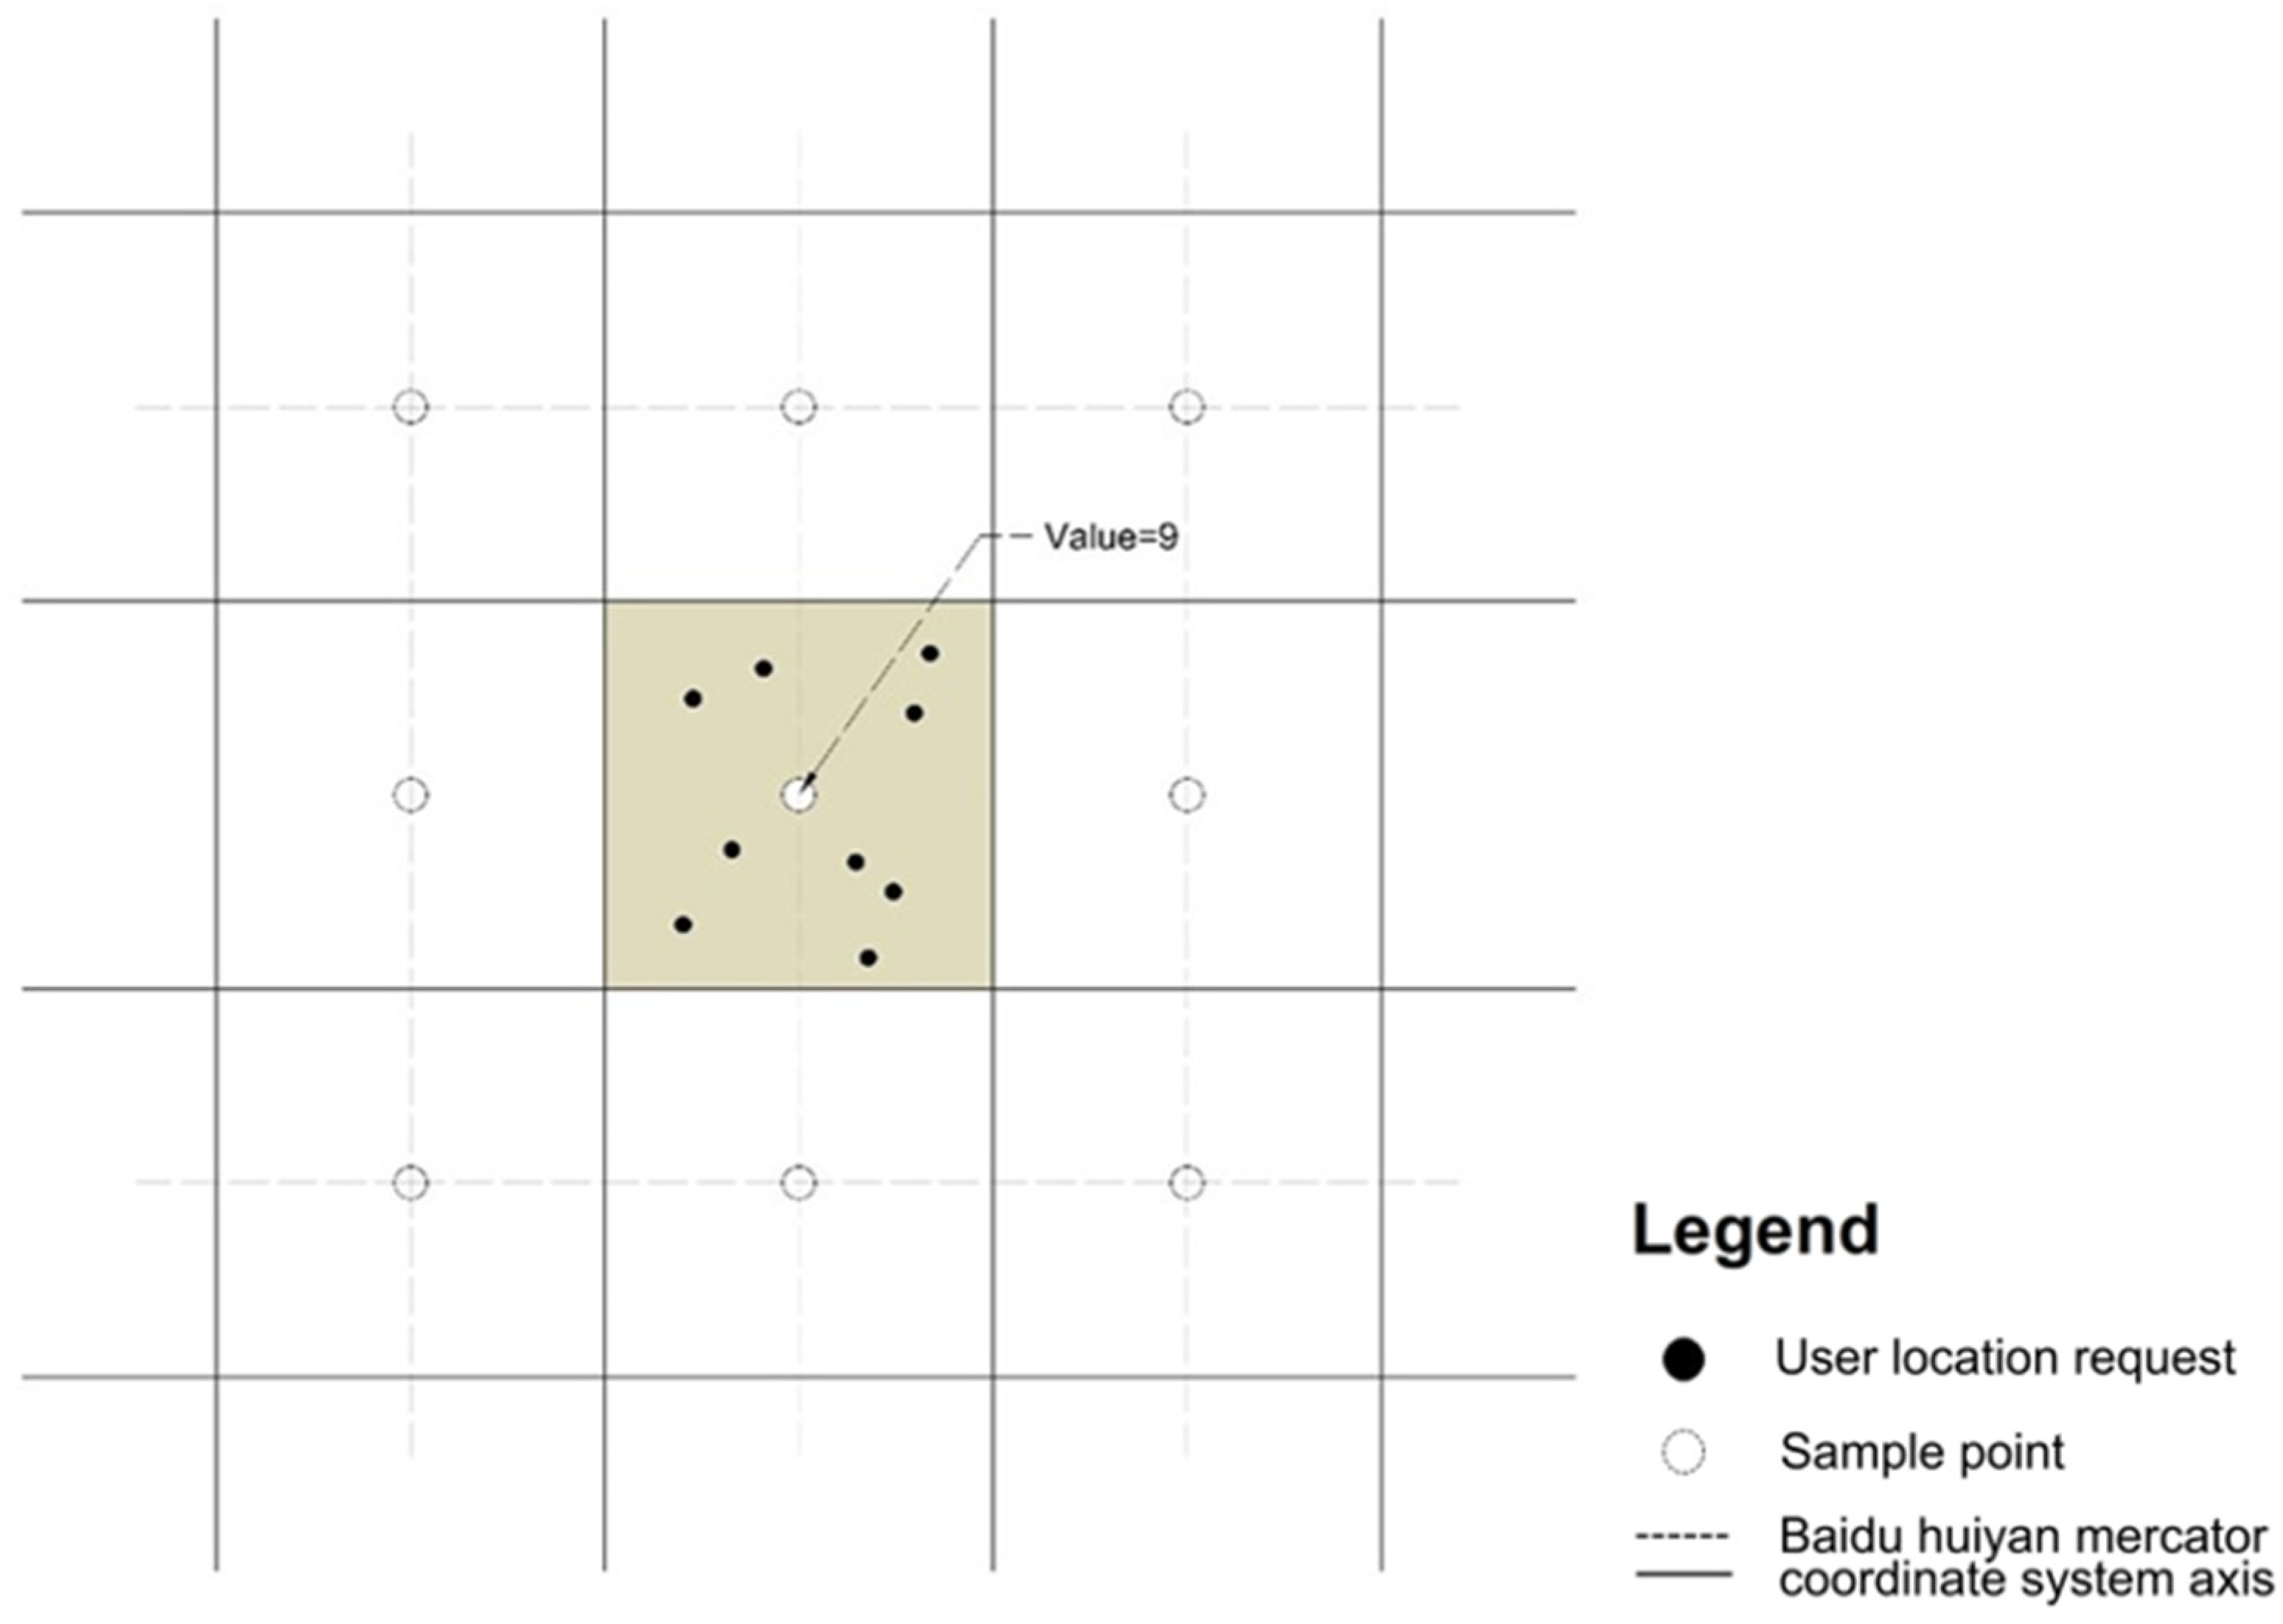

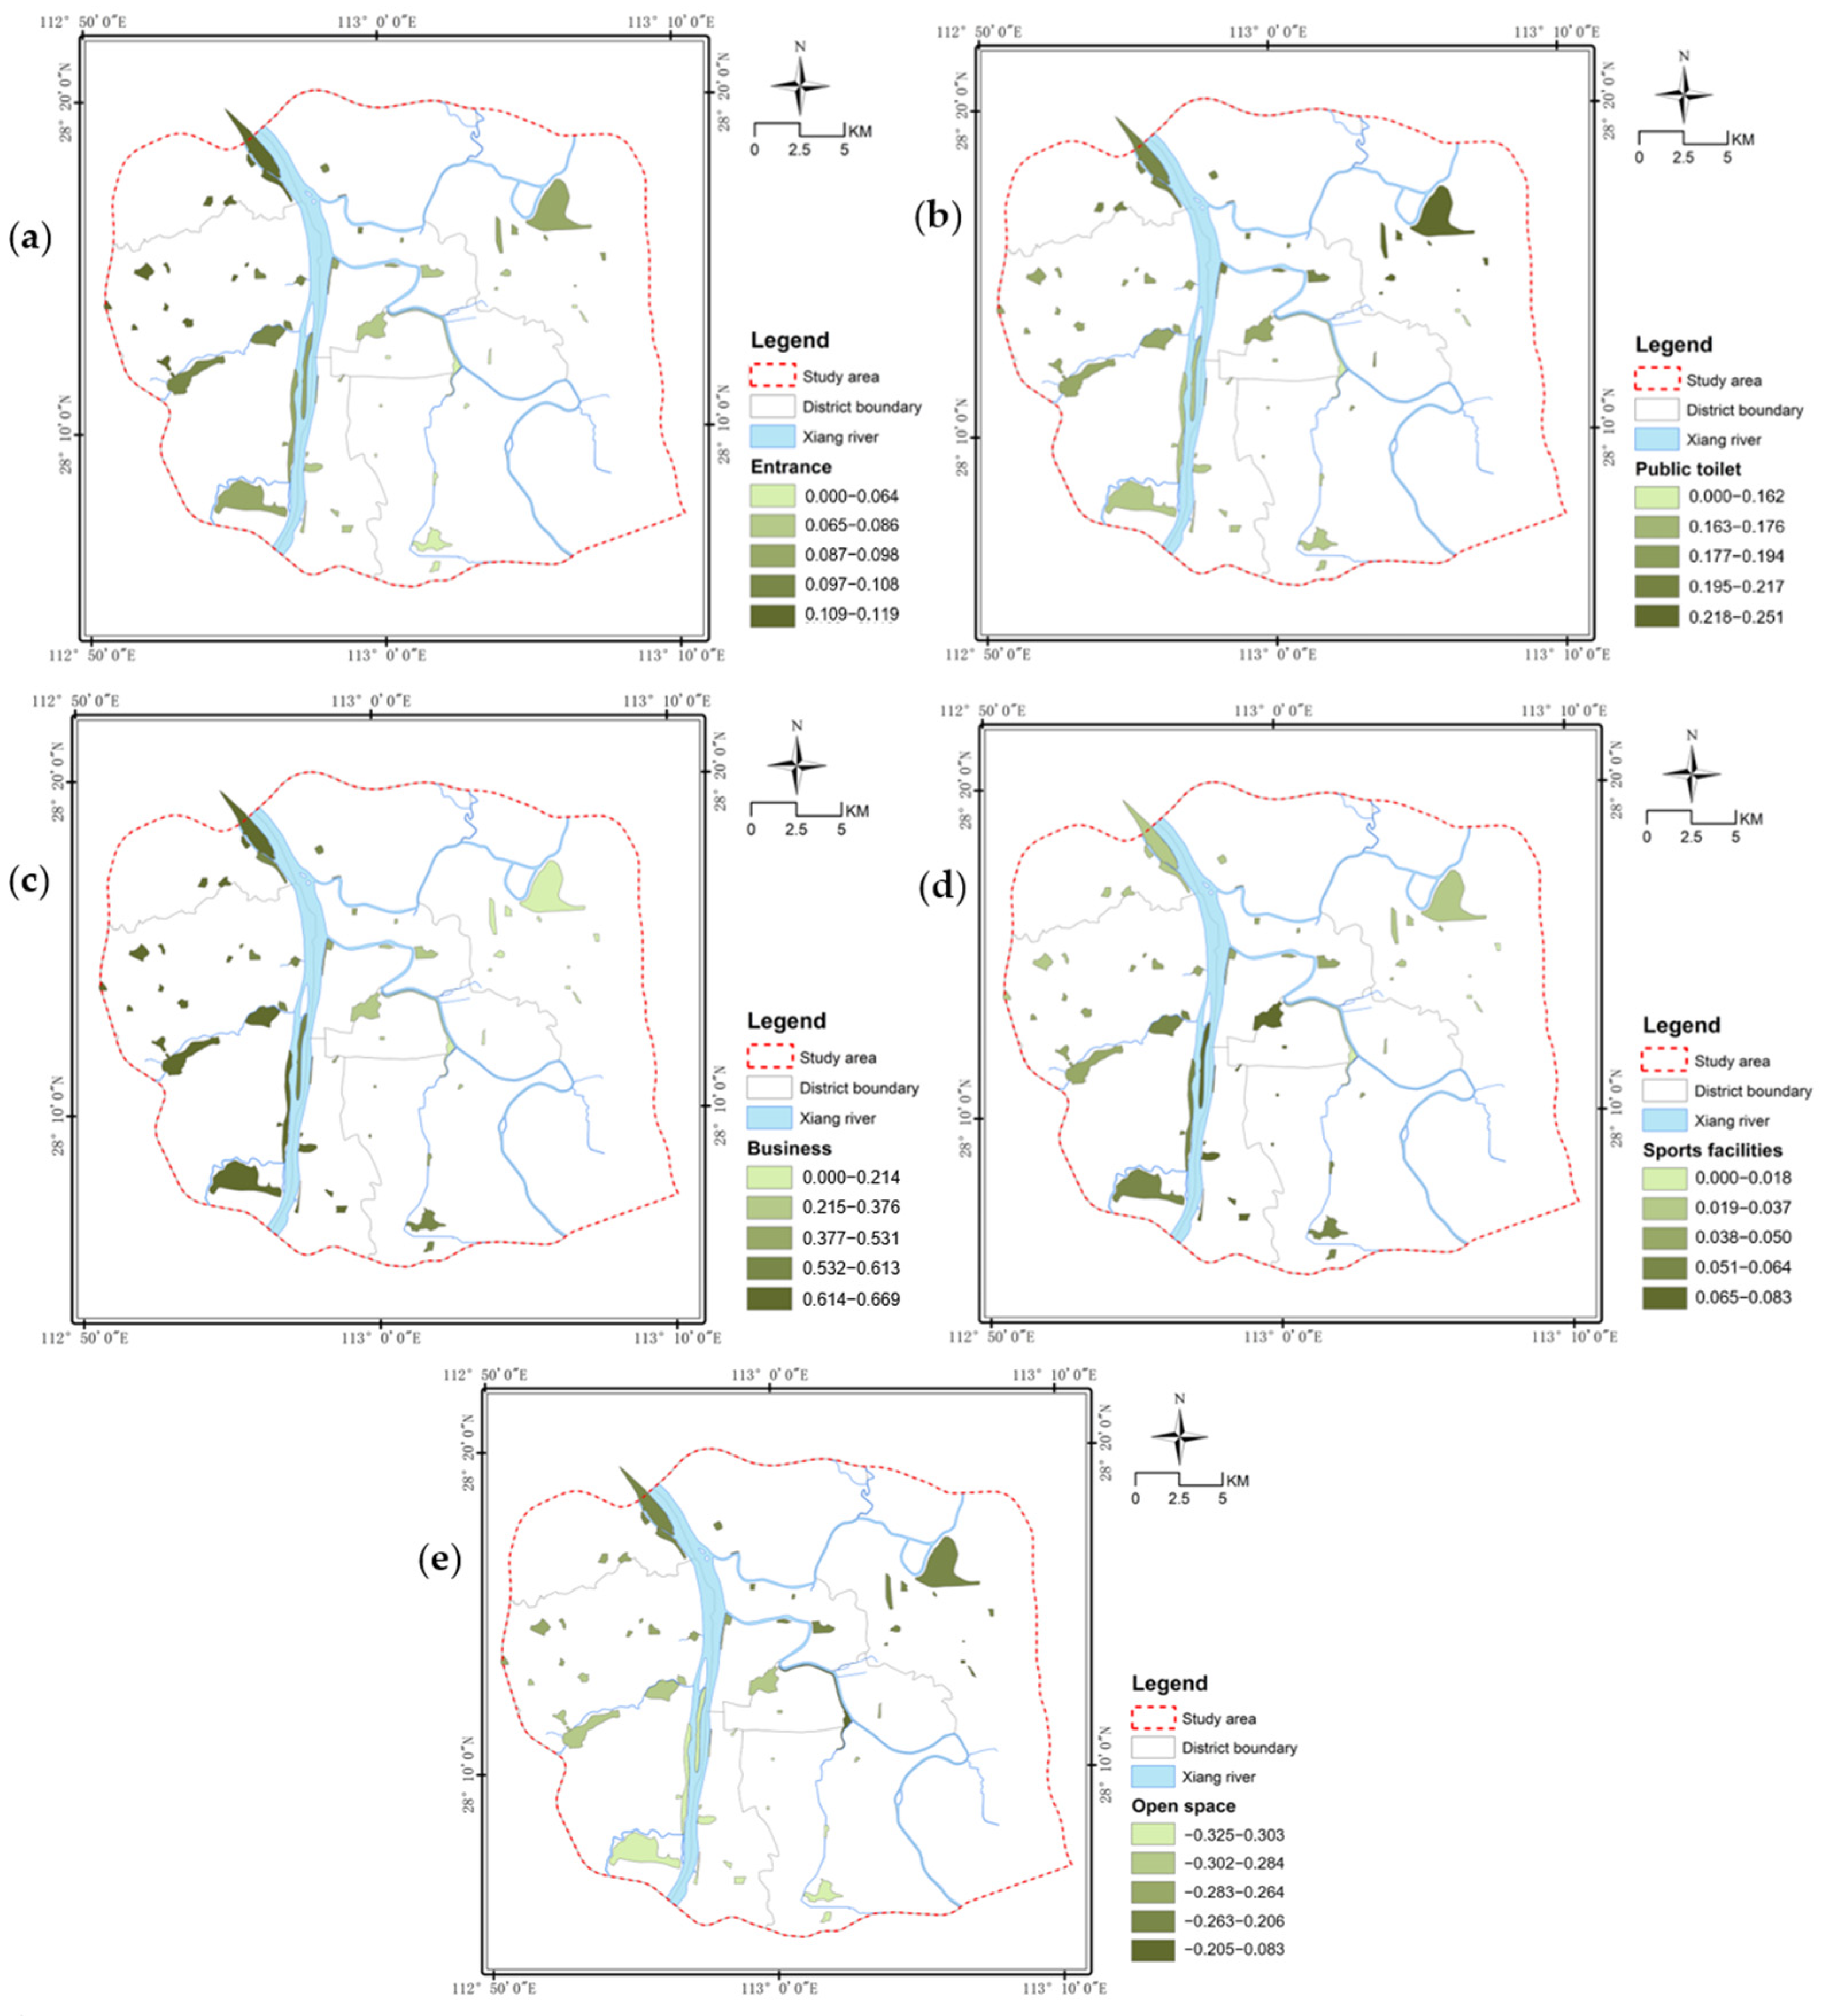
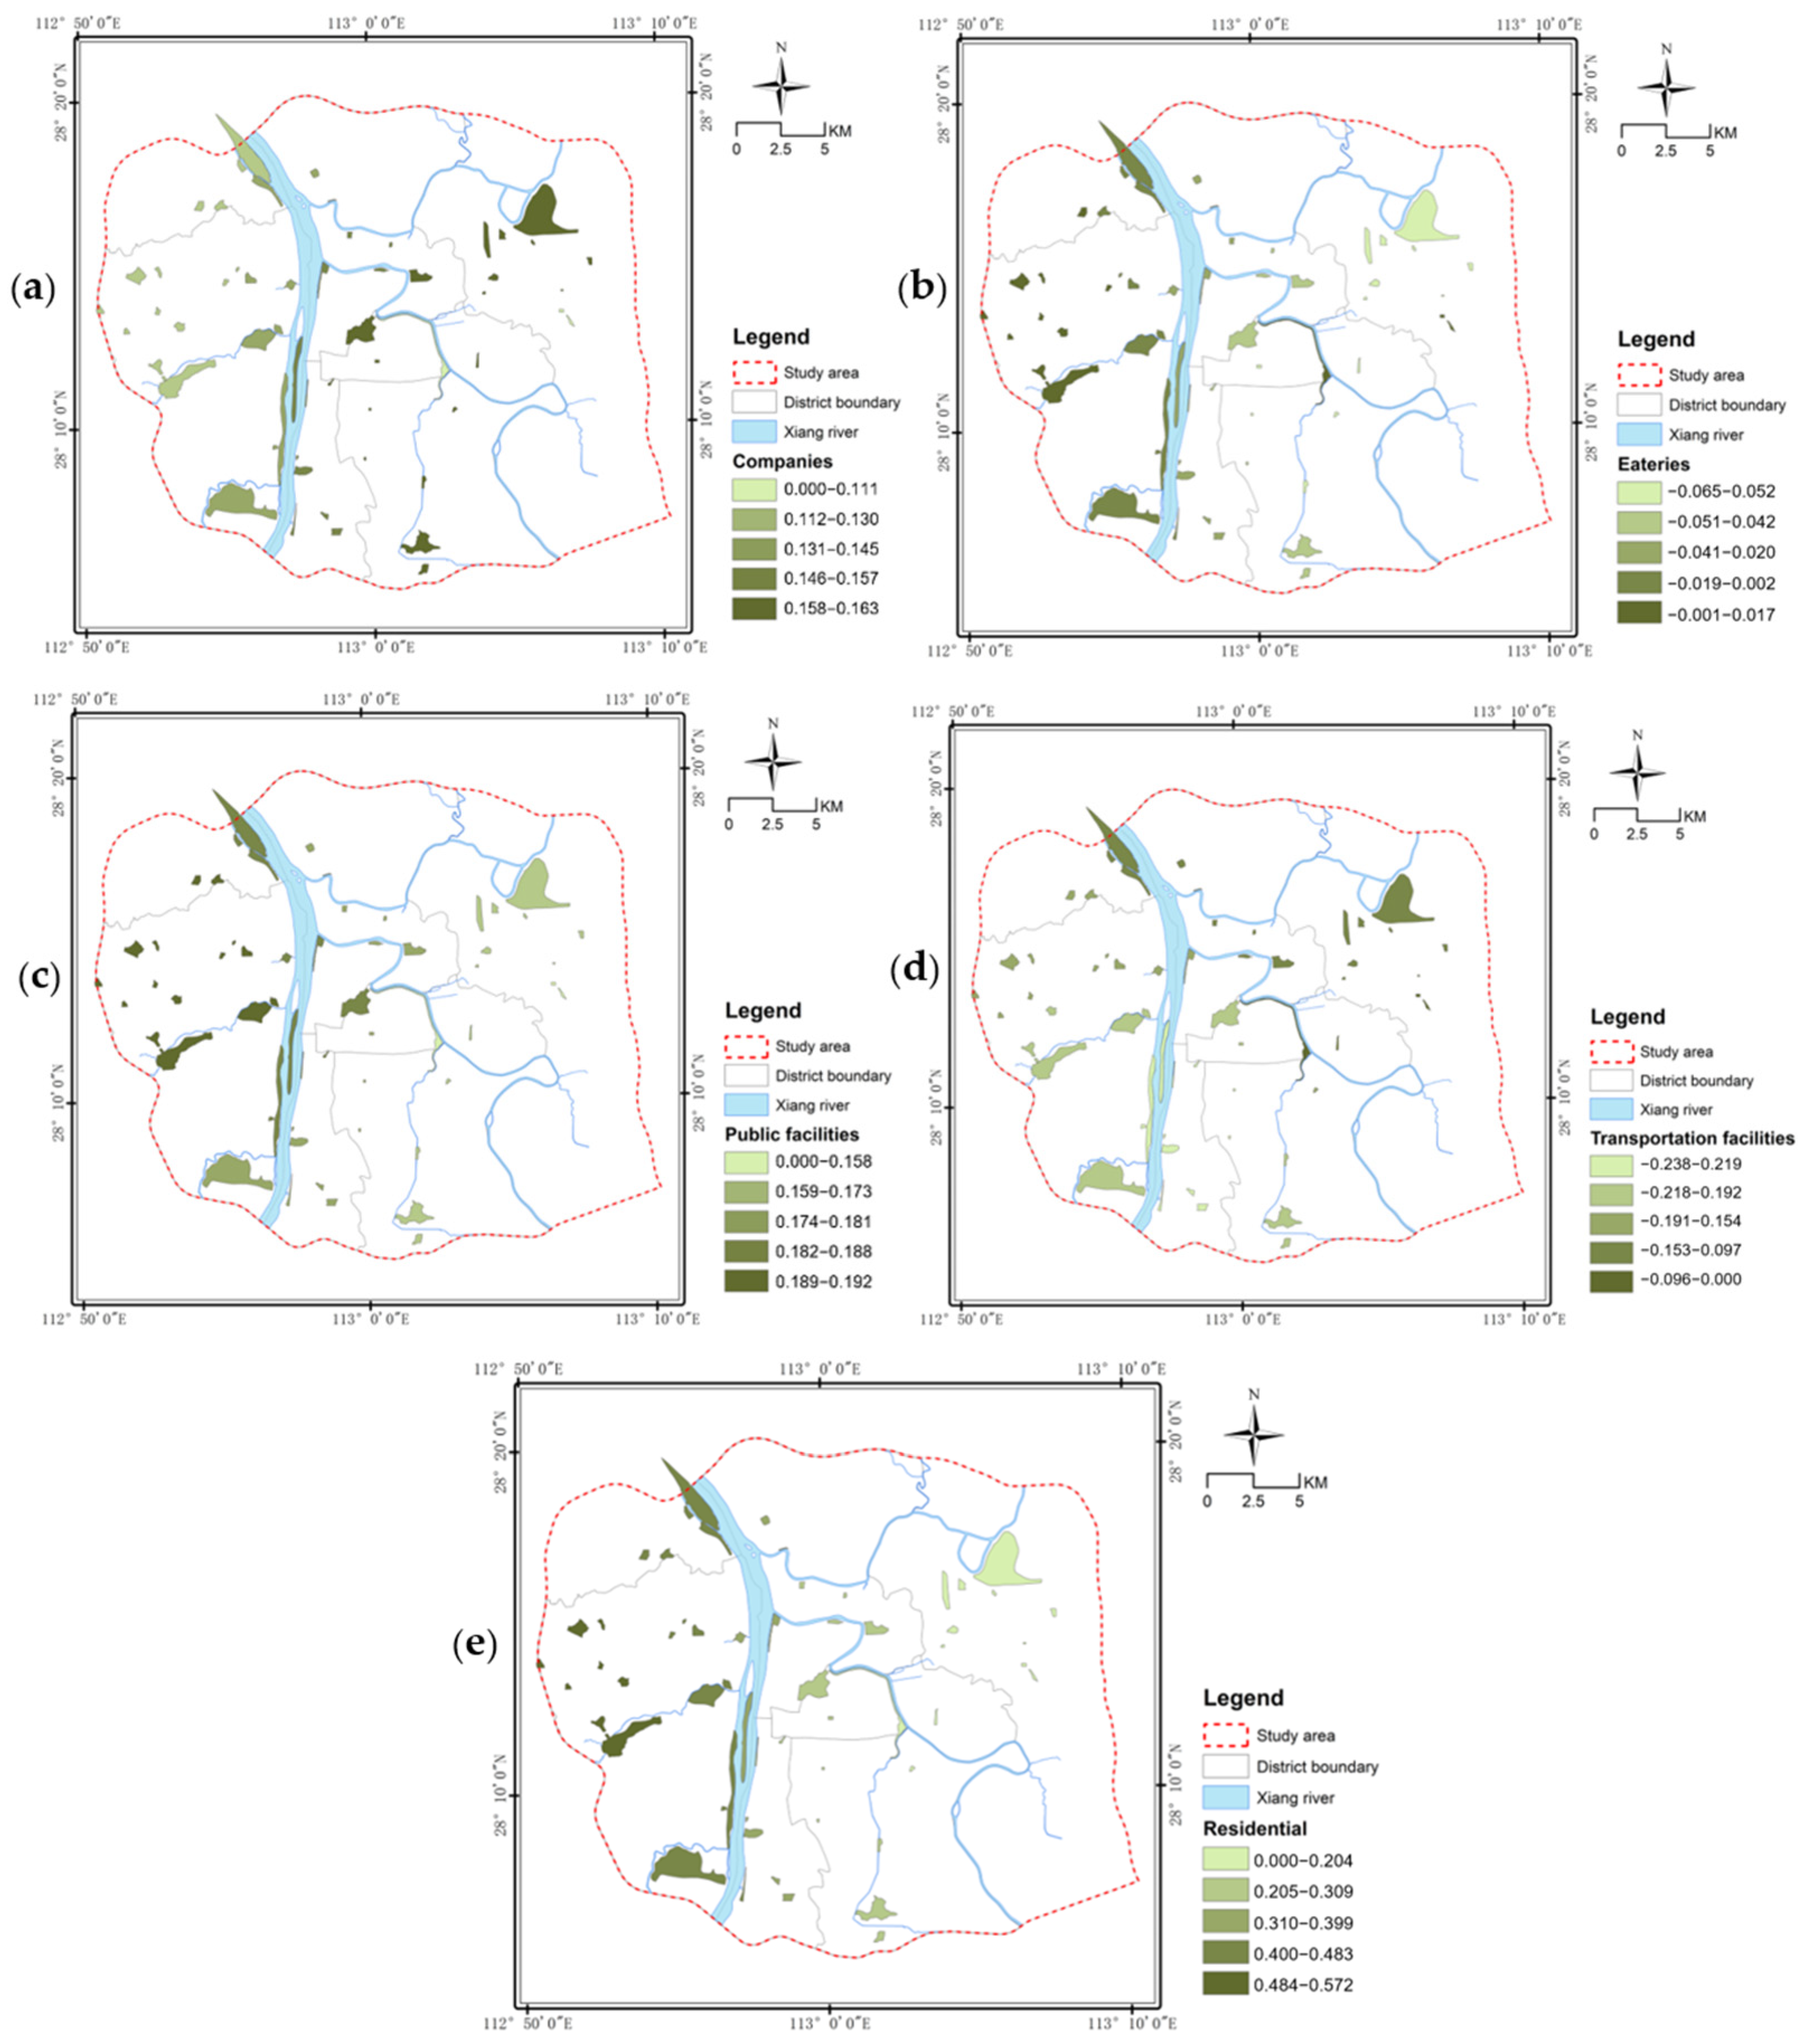
Disclaimer/Publisher’s Note: The statements, opinions and data contained in all publications are solely those of the individual author(s) and contributor(s) and not of MDPI and/or the editor(s). MDPI and/or the editor(s) disclaim responsibility for any injury to people or property resulting from any ideas, methods, instructions or products referred to in the content. |
© 2024 by the authors. Licensee MDPI, Basel, Switzerland. This article is an open access article distributed under the terms and conditions of the Creative Commons Attribution (CC BY) license (https://creativecommons.org/licenses/by/4.0/).