Article

Addition of Biochar and Fertiliser Drives Changes in Soil Organic Matter and Humic Substance Content in Haplic Luvisol

1
Institute of Agronomic Sciences, Faculty of Agrobiology and Food Resources, Slovak University of Agriculture, 949 76 Nitra, Slovakia
2
Institute of Landscape Engineering, Faculty of Horticulture and Landscape Engineering, Slovak University of Agriculture, 949 76 Nitra, Slovakia
3
School of Agriculture, Policy and Development, University of Reading, Reading RG1 1AF, UK
4
Department of Forest Management, Faculty of Forestry and Wood Sciences, Czech University of Life Sciences, 16521 Prague, Czech Republic
*
Author to whom correspondence should be addressed.
Land 2024, 13(4), 481; https://doi.org/10.3390/land13040481
Submission received: 11 March 2024 / Revised: 4 April 2024 / Accepted: 7 April 2024 / Published: 8 April 2024
(This article belongs to the Special Issue Dynamics of Soil Organic Carbon under Land Use and Land Cover Change)

Abstract

:
Humic substances (HSs) constitute a primary component of soil organic matter (SOM) and play a crucial role in soil formation and fertility. However, comprehensive information regarding quantitative and qualitative changes in HS following biochar’s application to soil still needs to be improved. This study reports on the impact of biochar application at rates of 0, 10, and 20 t ha−1 (B0, B10, B20), both with and without nitrogen fertilisation at varying levels (N0, N1, N2), on SOM and HS contents throughout the cropping seasons between 2014 and 2019. The findings reveal changes in SOM and HS contents due to biochar addition and fertilisation. Notably, the most substantial increase in soil organic carbon content was observed in the B20N1 and B10N1 treatments, in stark contrast with the reference B0N0 treatment. A decrease in humification of SOM was noted across all treatments involving biochar, whether alone or combined with different N fertilisation levels. An interesting positive change in HS contents was observed in B10N2, where an increase in humic acids and a decrease in fulvic acids enhanced HS stability and improved HS quality. These findings shed light on the intricate dynamics of SOM and HSs in response to biochar application and nitrogen fertilisation over multiple vegetation seasons of crops on loamy Haplic Luvisols in Central Europe.

1. Introduction

The increase in food production and progress toward the elimination of malnutrition since the 1950s has been driven by the mechanisation of ploughing and other farm operations, the introduction of input-responsive varieties, the use of chemical fertilisers along with herbicides and pesticides, the increase in supplemental irrigation, and reliance on information and communications technology [1]. However, the reverse side of this coin is increased soil degradation, which threatens the long-term sustainability of food production and is intricately tied to the application of many agricultural practices. Addressing these challenges requires concerted efforts and innovation to adapt agricultural practices to safeguard current and future food safety and uphold the principles of environmental sustainability [2,3].
Over recent decades, numerous papers have reported on the existence and properties of Terra Preta Anthrosols, renowned for their high fertility [4]. These soils most likely originate from the low-fertility soils of the Amazon Basin region, improved by purposeful human activity in the distant past [5]. The Terra Preta soils are mainly Oxisols, Ultisols, and Inceptisols, with an anthropic A horizon. Terra Preta soils result from a substantial addition of organic waste materials, including kitchen leftovers, excrements, biomass waste, and charred residues resembling biochar. Soil organisms and fauna partially decompose this organic material, while a significant part remains in the soil for centuries, enhancing its carbon content [6,7]. Terra Preta soils are not the only examples of agricultural soils where humans have increased, rather than degraded, their organic matter content; C-enriched soils with a history of biochar application are found worldwide [8,9,10].
With the established potential for enhancing the fertility of soils by prolonged supply of charred organic materials, ongoing research aims to derive soil amendments from a diverse range of waste biomass [11]. Driven by the increasing effort to divert human waste away from landfills and energy recovery facilities [12], the supply of organic waste will likely increase in future. Biogenic waste represents a promising feed source for charring and subsequent deposition to soils [11]. Biochar, undergoing testing globally under diverse soil-climatic conditions, is now a promising soil additive. Originating from the pyrolysis process—thermal degradation of organic material without oxygen—biochar holds potential for agronomic and environmental applications [13]. Applying biochar to soil has consistently demonstrated benefits for crop growth [14,15] by enhancing fundamental soil properties relevant to plant growth.
Biochar application directly increases the stable organic carbon content in the soil [16,17]. However, any additional C source added to the soil affects the mineralisation of organic matter that is already present. Known as the priming effect, biochar’s addition can enhance or slow down the existing mineralisation rate [18], with varied impacts on the soil environment. Due to its alkaline pH, biochar effectively increases the soil pH, positively influencing its nutrient storage capacity and fostering plants’ growth and development [14,19]. Biochar has emerged as a valuable tool for agroecosystem management, offering a plausible means to effectively elevate soil pH in acidic soils [20]. Furthermore, biochar positively affects soil sorption parameters [21], enhancing soil’s water-holding capacity, influencing the air exchange between the soil and the atmosphere, and elevating its cation-exchange capacity [22]. The positive impacts extend to supporting microbial biomass and composition, with reciprocal alterations as microbes interact with the biochar [23]. Key studies highlight biochar’s role in reducing emissions of CO2 and N2O from agricultural soils to the atmosphere [24,25,26].
Limited knowledge exists regarding the impact of biochar on the properties of humus in the soil [27,28]. The study of humus, a pivotal component of soil, spans over two centuries [29], yet considerable knowledge gaps persist, especially in explaining the humus formation process. Various theories offer differing perspectives, such as Waksman’s lignin-protein theory, Trus’s theory, microbial synthesis, and carbohydrate-amine condensation theory [29]. However, a recent study by Lehmann and Kleiber [30] challenges the conventional understanding, suggesting that humus exists but is an ephemeral property emerging from soil’s interaction with its solution. In this paper, we adhere to the traditional view and consider humus as an integral part of soil organic matter (SOM). Here, humus forms during humification, wherein dead remains transform, lose their original features, and acquire novel, distinct properties [29,31]. Humic substances within humus perform critical functions in soil formation and its physical, nutritional, chemical, biological, and environmental aspects [32,33,34]. Greenland et al. [35] emphasised that optimal conditions for plant growth arise in soils with organic substance contents exceeding 2%, which are well humified and mature, with high contents of condensed aromatic compounds. The influence of biochar on quantitative and qualitative humus parameters and the humification process in the soil remains a significant and unanswered question. Understanding changes in humus parameters following the application of biochar is crucial. For example, biochar may accelerate soil nitrogen dynamics, with direct implications for plant productivity [36]. Notably, soil management practices, including nitrogen fertilisation, impact the properties of humus. Jagadamma et al. [37] highlighted that nitrogen application increases mineralisation, negatively affecting the stability of organic substances and overall SOM quality, including humic substances.
As previously noted, humus is generally considered to be stable in soil, compared to freshly deposited or undecomposed soil organic matter [38,39]. However, we posit that introducing biochar into the soil may disrupt the humus formation process, ultimately impacting its content in the soil. Upon incorporation into the soil, biochar becomes involved in the formation of humic substances, thereby altering the quality of the humus. This field study aimed to quantify the effects of applying biochar, with and without nitrogen fertilisation, on soil organic matter (SOM) and humus parameters over six years. We hypothesise that (H1) a higher biochar application rate will result in a larger increase in humus content, and (H2) an interaction of biochar and nitrogen fertiliser will impact the humification process. Lastly, we hypothesise (H3) that the effect of biochar’s addition on the humification process would diminish over time.

2. Materials and Methods

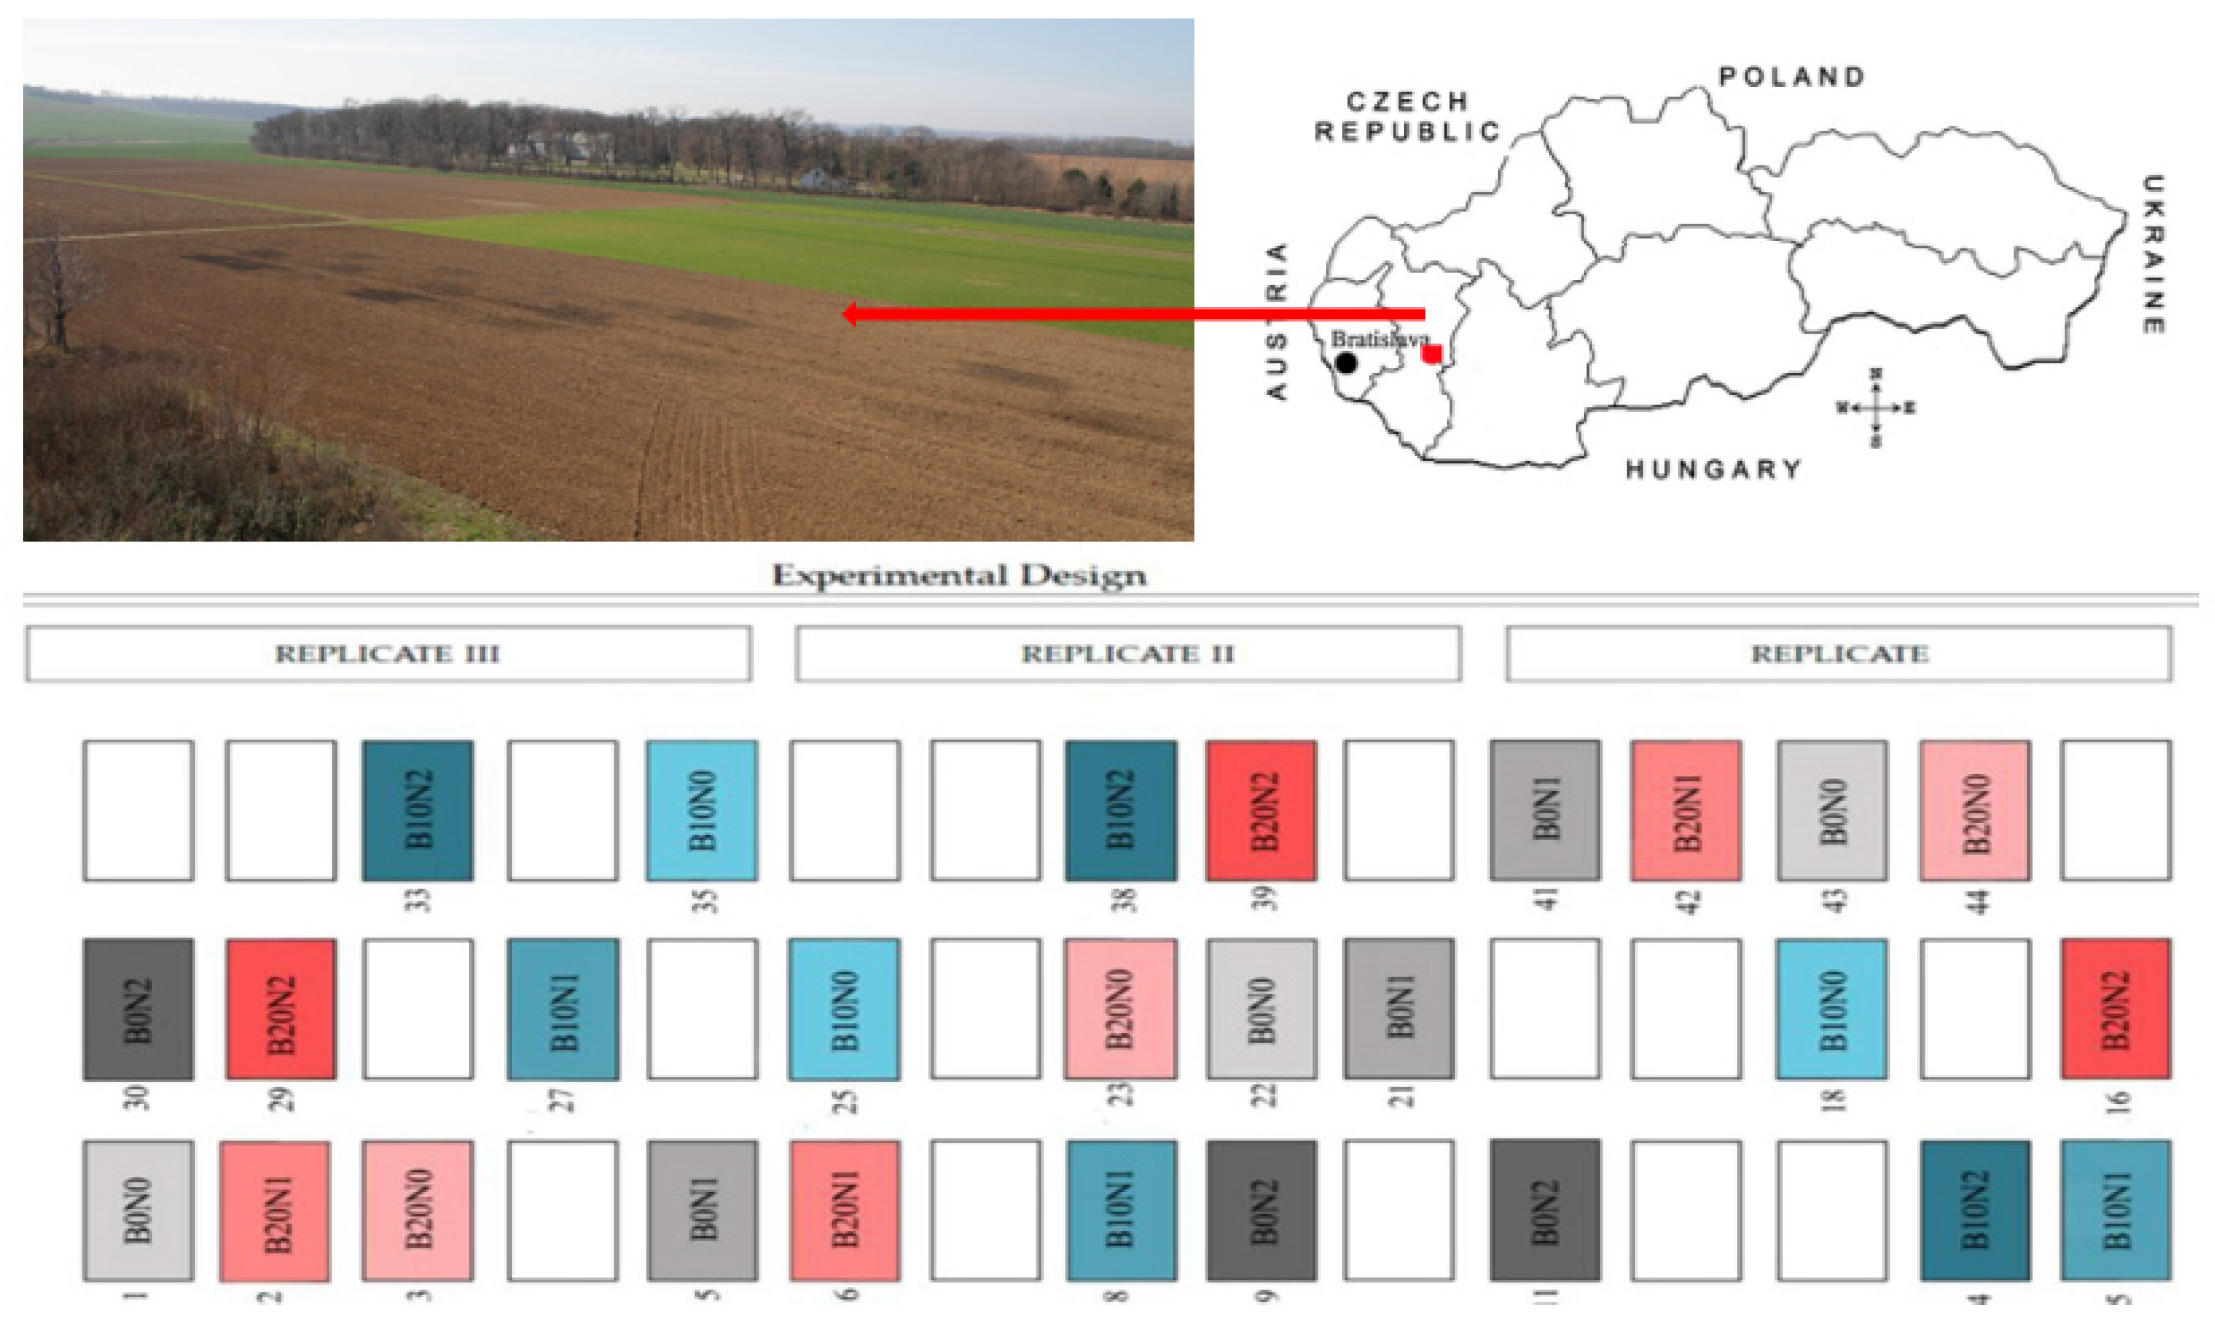
2.1. Site Description

The field experiment took place at the Dolná Malanta Experimental Station of the Slovak University of Agriculture in Nitra, Slovakia (latitude 48°19′00″; longitude 18°09′00″). Situated east of Nitra, on the Žitavská upland, the experimental area is flat terrain with a slight southward incline. This location features a warm lowland climate, warm summers, and brief, dry winters. The long-term average air temperature and precipitation (1991–2020) were 10.7 °C and 559 mm, respectively. The geological substratum comprises earlier rocks rich in fine materials. Young Neogene deposits include diverse clays, loams, and sand gravels overlaid with loess in the Pleistocene epoch. The soil in the experimental field is classified as a Haplic Luvisol according to the World Reference Base for Soil Resources, based on the whole soil morphology profile [40]. The properties of the 0–20 cm soil layer before the experiment setup, on average, were as follows: clay—249 g kg−1, silt—599 g kg−1, sand—152 g kg−1, soil organic carbon—9.13 g kg−1, CEC—142 mmol kg−1, base saturation—85%, and soil pHKCl—5.71.

2.2. Experimental Design

The field experiment was initiated in March 2014, comprising three replicate plots for each treatment. The 27 plots, each measuring 4 × 6 m (24 m2), were randomly distributed across the experimental field (Figure 1). The soil addition treatments were established as follows: application of biochar at rates of 0, 10, and 20 t ha−1 without N fertilisation (B0N0, B10N0, and B20N0, respectively), biochar at the same rates of 0, 10, and 20 t ha−1 in combination with the lower level of N fertilisation (B0N1, B10N1, and B20N1, respectively), and finally, biochar at 0, 10, and 20 t ha−1 with higher N fertilisation (B0N2, B10N2, and B20N2, respectively).
In 2014, biochar was applied manually to the soil surface using rakes in all relevant plots and then incorporated into the 0–10 cm soil layer using a combinator. The three rates of N fertilisation (N0, N1, and N2) were applied separately from the biochar, annually added to the soil surface of each fertilised plot, as relevant for the crop rotation. The biochar utilised in the experiment was produced from a mixture of paper fibre sludge and grain husks (1:1 w/w) through pyrolysis at 550 °C for 30 min in a Pyreg reactor (Pyreg GmbH, Dörth, Germany). The final biochar, as declared by the company (Sonnenerde, Austria), contained an average of 531 g kg−1 of total organic C, 14 g kg−1 of total N, a C:N ratio of 37.9, 57 g kg−1 of Ca, 3.9 g kg−1 of Mg, 15 g kg−1 of K, and 0.77 g kg−1 of Na. It had a specific surface area of 21.7 m2 g−1, an ash content of 38.3%, a pH of 8.8, and particle sizes ranging from 1 to 5 mm. In N-fertilised treatments, a standard N fertiliser, calc-ammonium nitrate with dolomite (LAD 27), was used at the two N fertilisation levels mentioned above (N1 and N2). LAD 27 is a granular mineral fertiliser containing 27% N (13.5% NO3 and 13.5% NH4+), 7% CaO, and 5% MgO. The pellets had a size range of 2–5 mm. Using the balance method, the N doses for the first level were calculated based on the average crop nutrient demand. The second N level added a further 100%, 50%, 50%, 50%, 100%, and 50% N in 2014, 2015, 2016, 2017, 2018, and 2019, respectively (Table 1). The field experiment followed an annual crop rotation sequence: spring barley (Hordeum vulgare L.), maize (Zea mays L.), spring wheat (Triticum aestivum L.), maize (Zea mays L.), spring barley (Hordeum vulgare L.), and maize (Zea mays L.) in 2014, 2015, 2016, 2017, 2018, and 2019, respectively.

2.3. Soil Sampling and Analysis

Soil samples were collected from depths of 0–20 cm across all treatments. Sampling occurred monthly throughout the growing season of planted crops from 2014 to 2019. Specifically, sampling took place in 2014 at 1, 2, 3, and 4 months after biochar application; in 2015 at 13, 14, 15, 16, 17, and 18 months; in 2016 at 26, 27, 28, and 29 months; in 2017 at 38, 39, 40, 41, 42, and 43 months; in 2018 at 50, 51, and 52 months; and in 2019 at 64, 65, 66, 67, and 68 months. Standard soil analysis methods were employed to measure SOM and humus parameters. Soil organic carbon (Corg) was determined using the wet combustion method, involving the oxidation of SOM by a mixture of 0.07 mol L−1 H2SO4 and K2Cr2O7, followed by titration using Mohr’s salt [41]. The group and fraction composition of humic substances (HSs) were determined using a method reported by Belchikova and Kononova, involving extraction with a mixture of 0.01 mol L−1 Na4P2O7, 10 H2O, and 0.1 mol L−1 NaOH [41]. The light absorbance of HSs and humic acids (HAs) at 465 and 650 nm was measured with a Jenway 6400 Spectrophotometer to calculate the colour quotients of humic substances (Q4/6HS) and humic acids (Q4/6HA).

2.4. Statistical Analysis

The data analysis utilised ANOVA tests implemented in the software package Statgraphics Centurion XV.I (Statpoint Technologies, Inc., Washington, DC, USA). Comparisons between samples were conducted using Tukey’s test at a probability level of p = 0.05. Single linear regression analyses were employed to assess trends in SOM and humus parameters during the vegetation seasons of planted crops from 2014 to 2019.

3. Results and Discussion

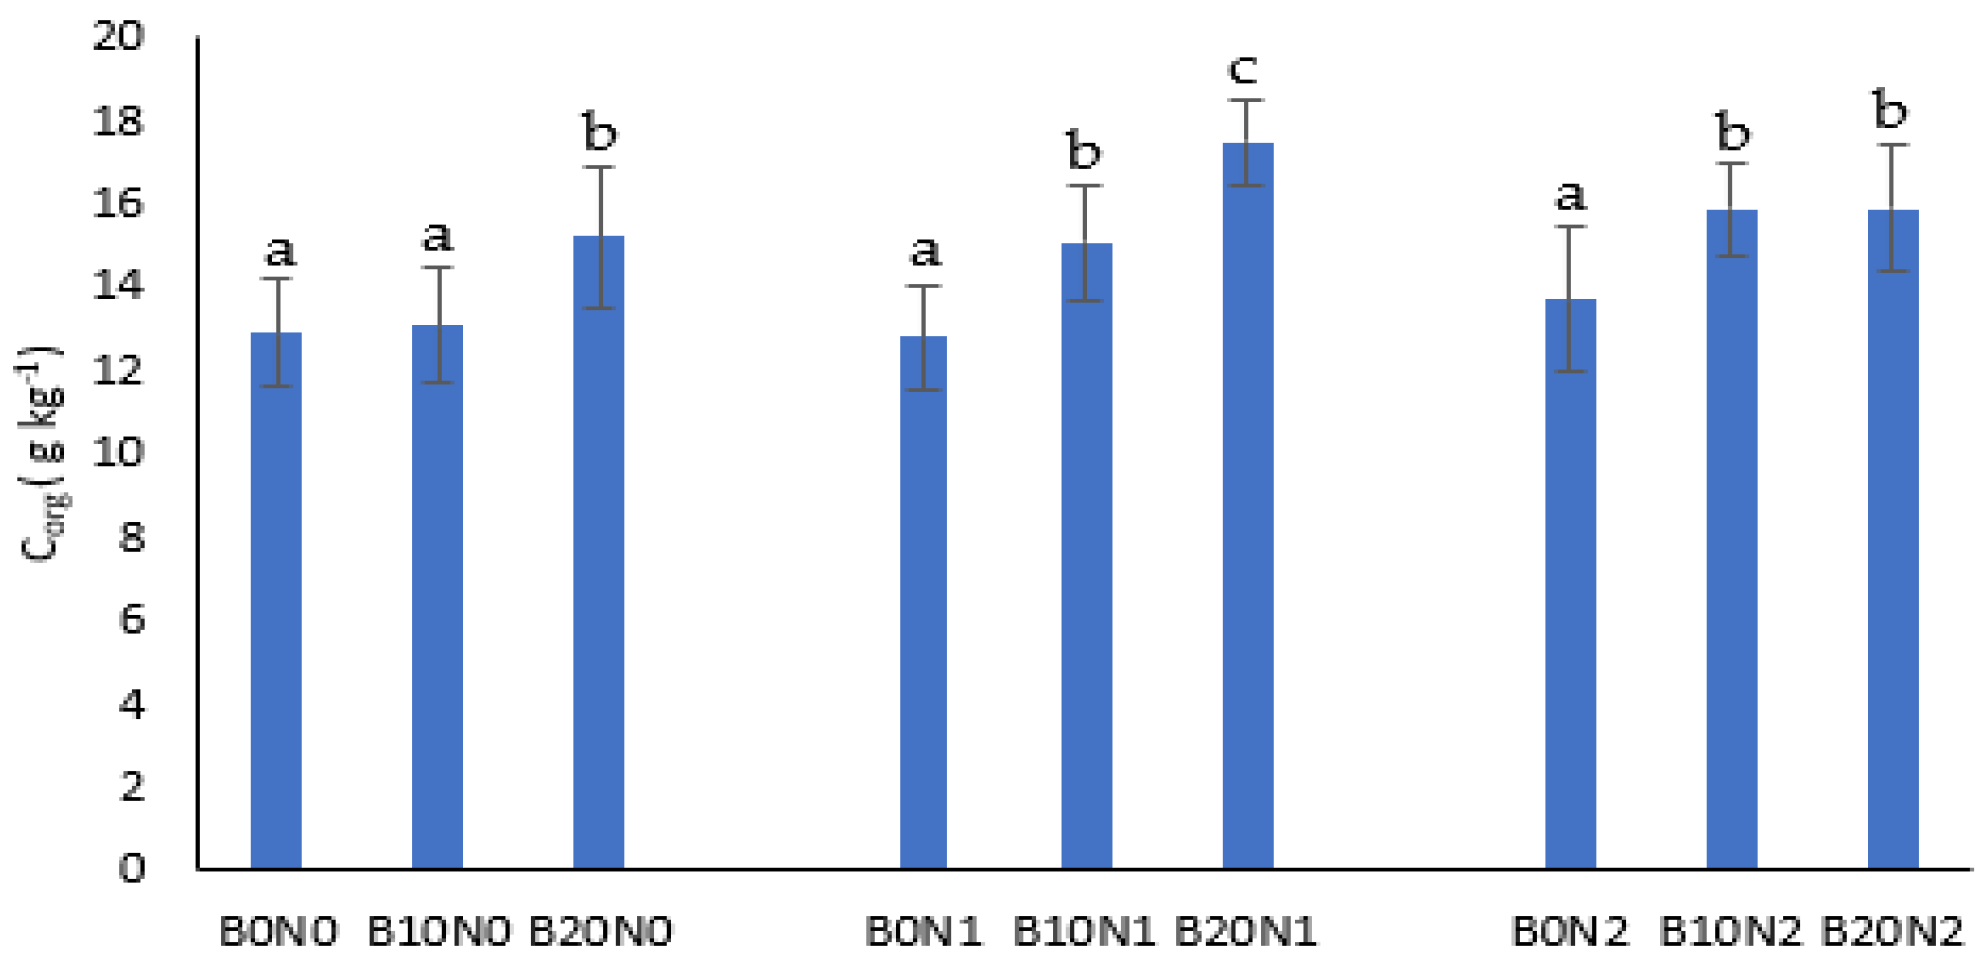
3.1. Effect of Biochar on Soil Organic Matter

The local soil type is Haplic Luvisol, which represents about 11% (265.4 thousand ha) of the total agricultural land in Slovakia [42] and approx. 500–600 mil. ha [40] worldwide; this experiment is thus informative for a substantial proportion of arable soils. Biochar stands out as a widely employed soil ameliorant, recognised for its role in elevating soil organic carbon (Corg) levels [43,44], a trend substantiated by our 6-year study results (Figure 2).
Observations over the six years revealed a significant increase in Corg in non-fertilised treatments, with the B20N0 treatment experiencing a significant increase of 2.46 g kg−1 compared to its control (B0N0). Corg shows an increasing trend with higher biochar application rates, as reported by numerous studies. The accumulation of Corg in soil is influenced by soil management practices and is generally a gradual process, primarily noticeable in the long term, albeit with variations across experimental sites [45]. About 90% of non-pyrolysed carbon entering tilled soil is typically released within a year [46]. However, given that biochar is a source of stabilised organic carbon [43], Corg contents will substantially increase following its addition; this effect is typically observable even after a single application treatment. We saw partial evidence of this process, with our results revealing that the B0N0 and B20N0 treatments significantly increased Corg by 80 and 222 mg kg−1 year−1 over the six years of vegetation seasons, respectively (Table 2). Interestingly, changes in Corg can also occur as a result of changes in soil pH, such as after applying alkaline biochar to an acidic soil. As reported Aydin [14] in a paper on the same experiment, the soil was acidic to start with, and after biochar application its pH significantly increased to neutral. The range of pH observed in this experiments, from slightly acidic to neutral, is likely suitable for most soil microorganisms [47], and SOM increases as a result of plant material deposition and microbial activity.
Combining biochar addition with nitrogen fertilisation may be a promising practice for improving the sustainability of agriculture. One of the reasons for this is a decrease in the soil’s carbon-to-nitrogen (C:N) ratio observed elsewhere [48]. Accordingly, we explored the effects of varying nitrogen fertilisation intensity in conjunction with biochar addition. Corg exhibited significant increases in B10N1 (15.1 ± 1.38 g kg−1) and B20N1 (17.5 ± 1.02 g kg−1) compared to B0N1 (12.8 ± 1.25 g kg−1), as well as in B10N2 (15.9 ± 1.11 g kg−1) and B20N2 (15.9 ± 1.48 g kg−1) compared to B0N2 (13.7 ± 1.75 g kg−1) (Figure 2). While the first level of nitrogen fertilisation, both alone and in combination with biochar, showed no significant linear trend in Corg changes over the six years of vegetation seasons (Table 2), the second level of N fertilisation resulted in a noteworthy linear decline in Corg in the B0N2 and B20N2 treatments. Our results indicate that the B0N2, B10N2, and B20N2 treatments reduced Corg by 159, 78, and 61 mg kg−1 year−1 over the six years of vegetation seasons, respectively. This means that a high dose of N alone or in combination with a higher dose of biochar contributes to more intensive use of SOM or more labile fractions of the organic matter of the biochar itself by soil microorganisms [49], resulting in SOM transformation. The distinctive impact of nitrogen fertilisation on Corg changes after biochar’s application suggests a dependency on the application rates. Notably, a higher biochar rate combined with the second nitrogen level more effectively suppressed Corg mineralisation in the soil than lower biochar rates under the same nitrogen level (N2). This is consistent with findings by Yang et al. [50], who concluded that higher nitrogen fertilisation levels, especially when applied as manure, accelerated the decline of soil organic matter compared to lower nitrogen levels. This effect can be attributed to priming effects, where nitrogen fertilisation stimulates microbial activity, allowing the use of the most labile organic fraction of biochar by microbes, temporarily replacing native Corg as a C source and, eventually, reducing native Corg mineralisation [51].
Overall, the application of biochar in 2014 at a rate of 20 t ha−1 without nitrogen fertilisation (B20N0) led to a significant decrease in extractable humic substances (HSs) in soil organic matter (SOM), compared to the B0N0 and B10N0 treatments (Figure 3). The reduction in HSs in the B20N0 treatment was linked with a significant decrease in the amounts of both humic acids (HAs) and fulvic acids (FAs) in SOM within the same treatment. The most substantial decline in extractable HSs over the six years, including HAs and FAs in SOM, was evident in the B20N0 treatment, followed by B0N0 and B10N0 (Table 2). Significant negative linear relationships were observed between Corg and HSs in SOM (Figure 4), and the strength of the mutual relationship decreased in the following order: B20N0 > B0N0 > B10N0. These results predominantly indicate mineralisation of SOM and elimination of humification between Corg and CHS, but no significant linear trend was determined. These findings imply that a higher dose of biochar, rather than a lower dose, decelerates the humification of SOM after biochar is applied to the soil. This is consistent with the findings of Aydin et al. [14], who observed a similar decreasing trend in the extraction of HSs in SOM after applying 20 t ha−1 of biochar without nitrogen fertiliser.
Combining a higher rate of biochar with both the first and second levels of nitrogen (B20N1 and B20N2, respectively) resulted in a significant decrease in the extraction of HSs, including HAs and FAs (Figure 3). Higher Corg contents corresponded to lower extraction of HSs, HAs, and FAs in SOM in biochar treatments combined with both levels of nitrogen fertilisation (Figure 4). The mineralisation of soil organic carbon can also be inhibited through the sorption of labile carbon onto the biochar surface, subsequently forming relatively stable organic substances [52]. Overall, the extraction of HAs in SOM across all nine treatments did not exceed 40% and ranged from 16.5 to 20.4%. A level of 40% indicates a very high degree of SOM humification, while the range of 10–20% suggests a low level of humification [53]. In our soils, even after applying biochar, organic matter primarily prevailed over humus, meaning that most of the SOM mineralised at the expense of humus formation. Even in unfertilised soil (control), it was constantly replenished through root exudates, plant and root residues, the biomass of microorganisms, etc. [39].

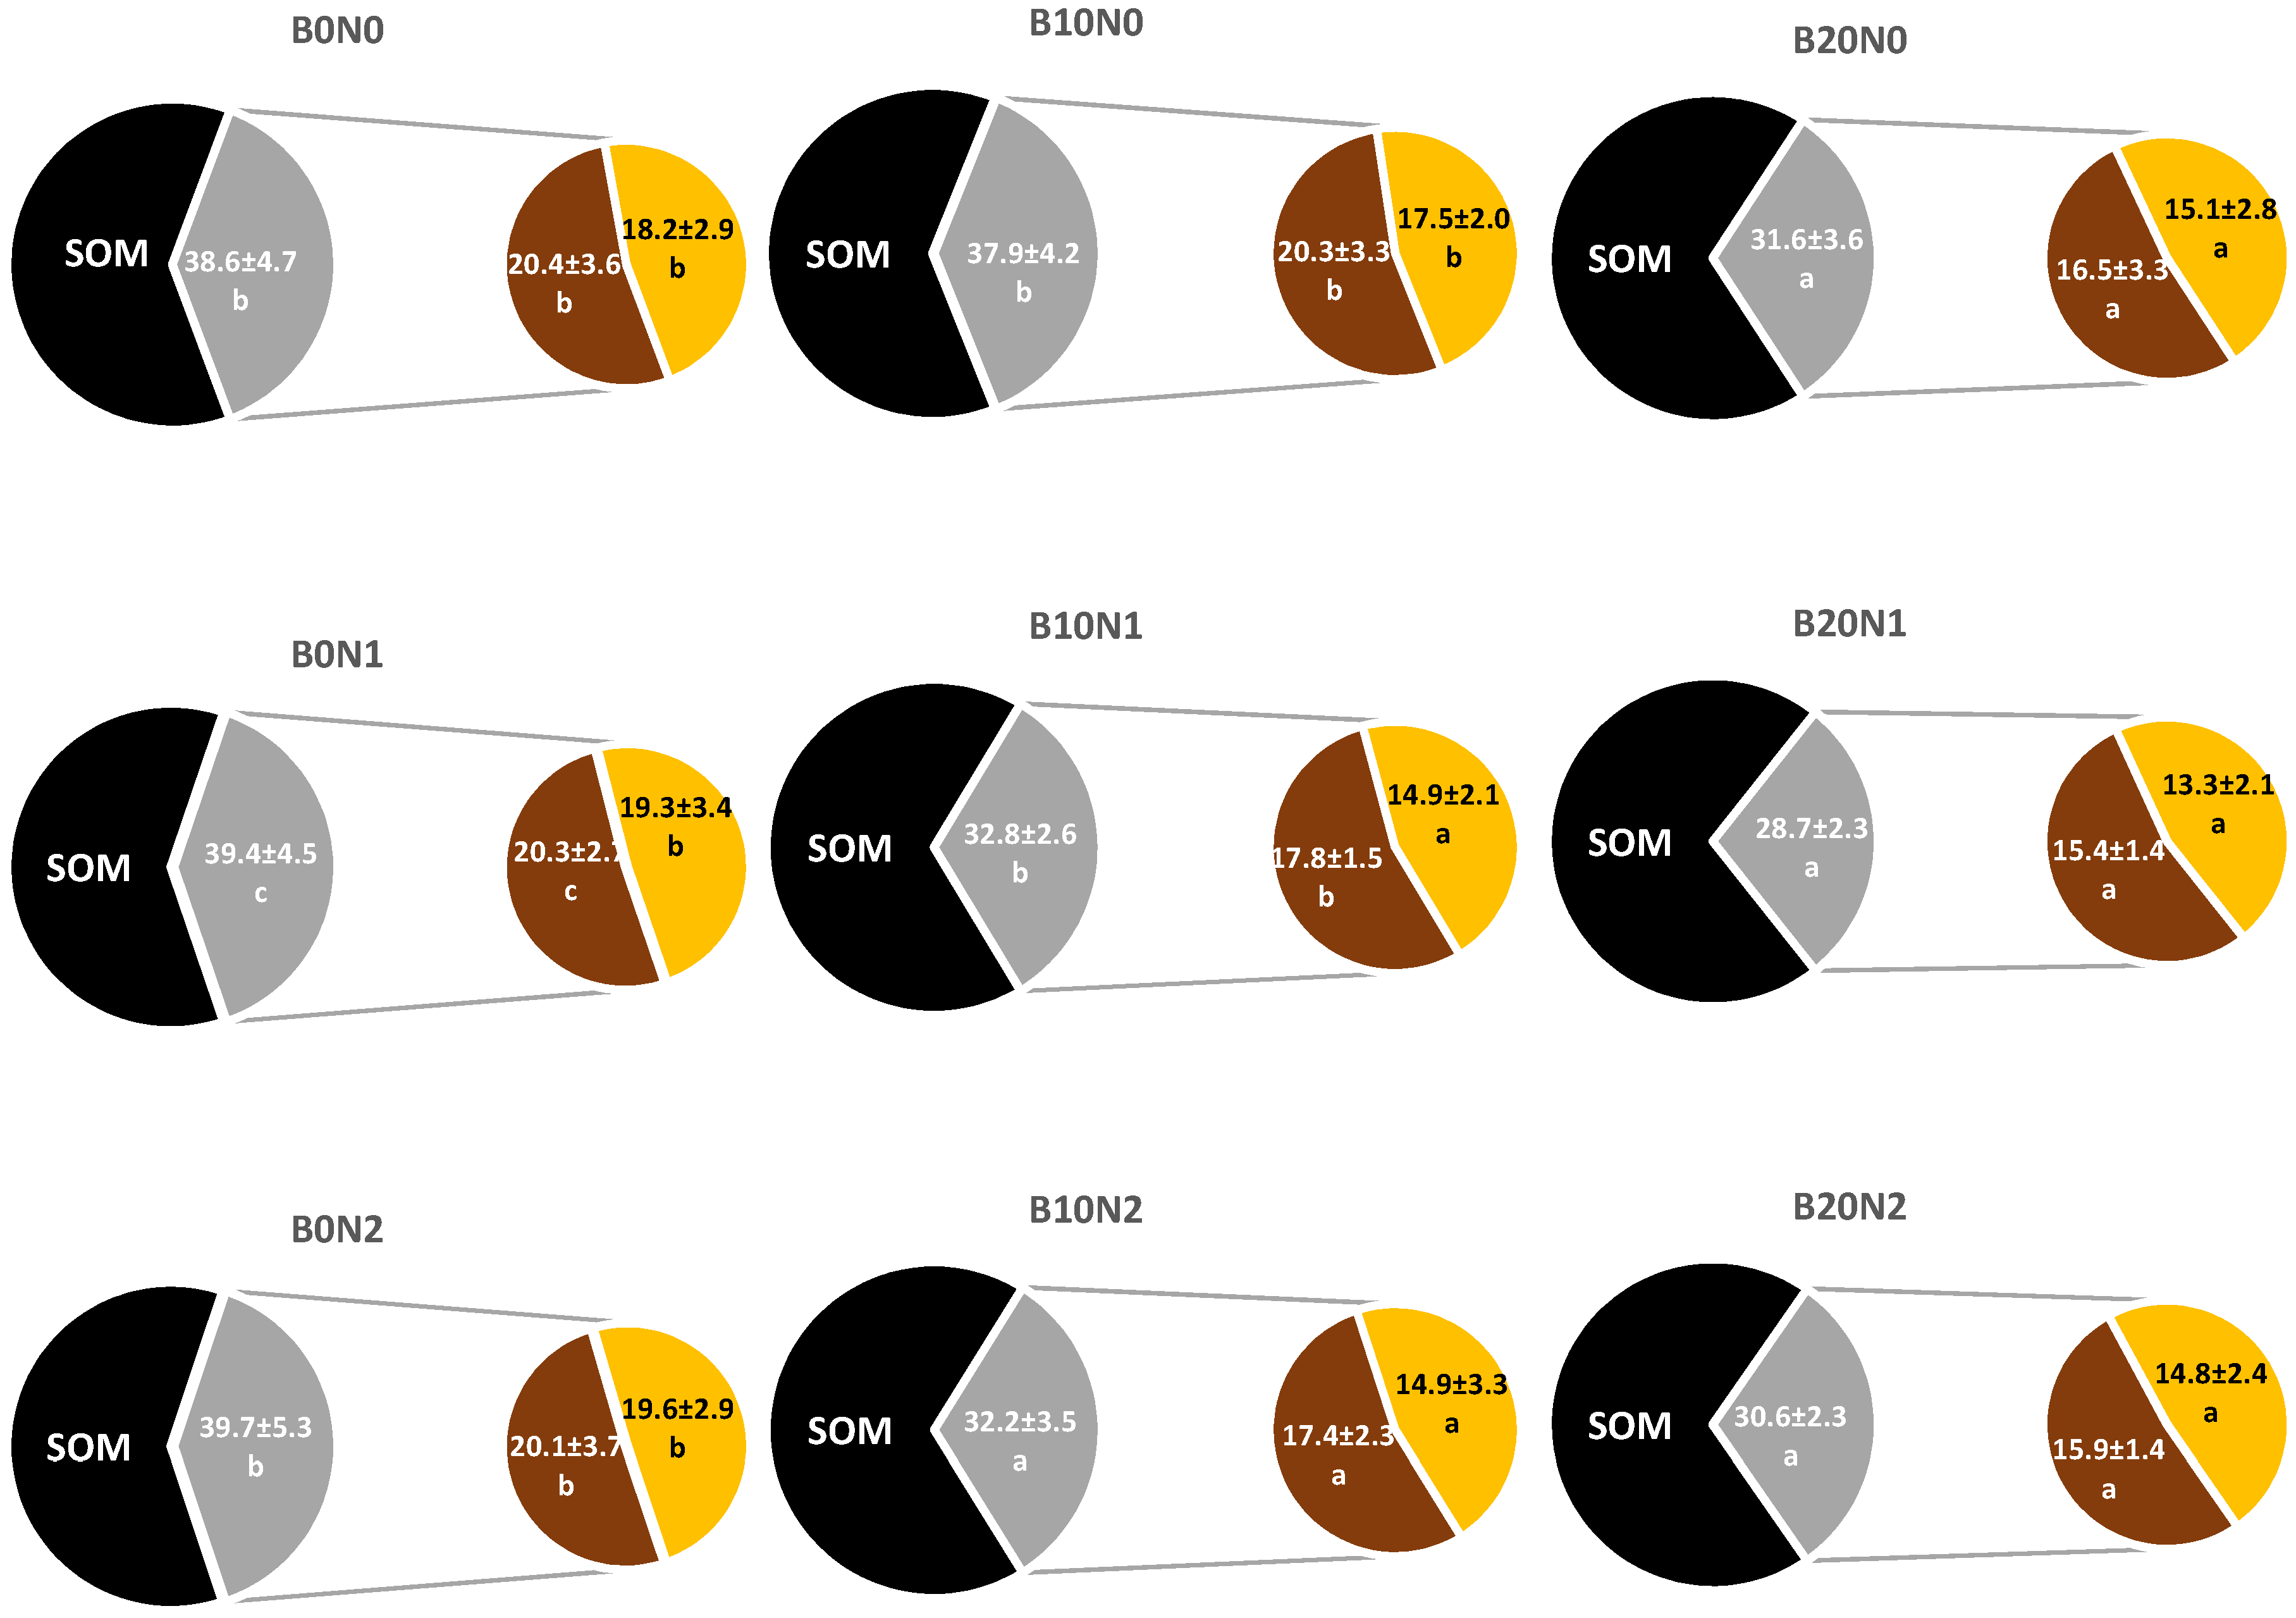
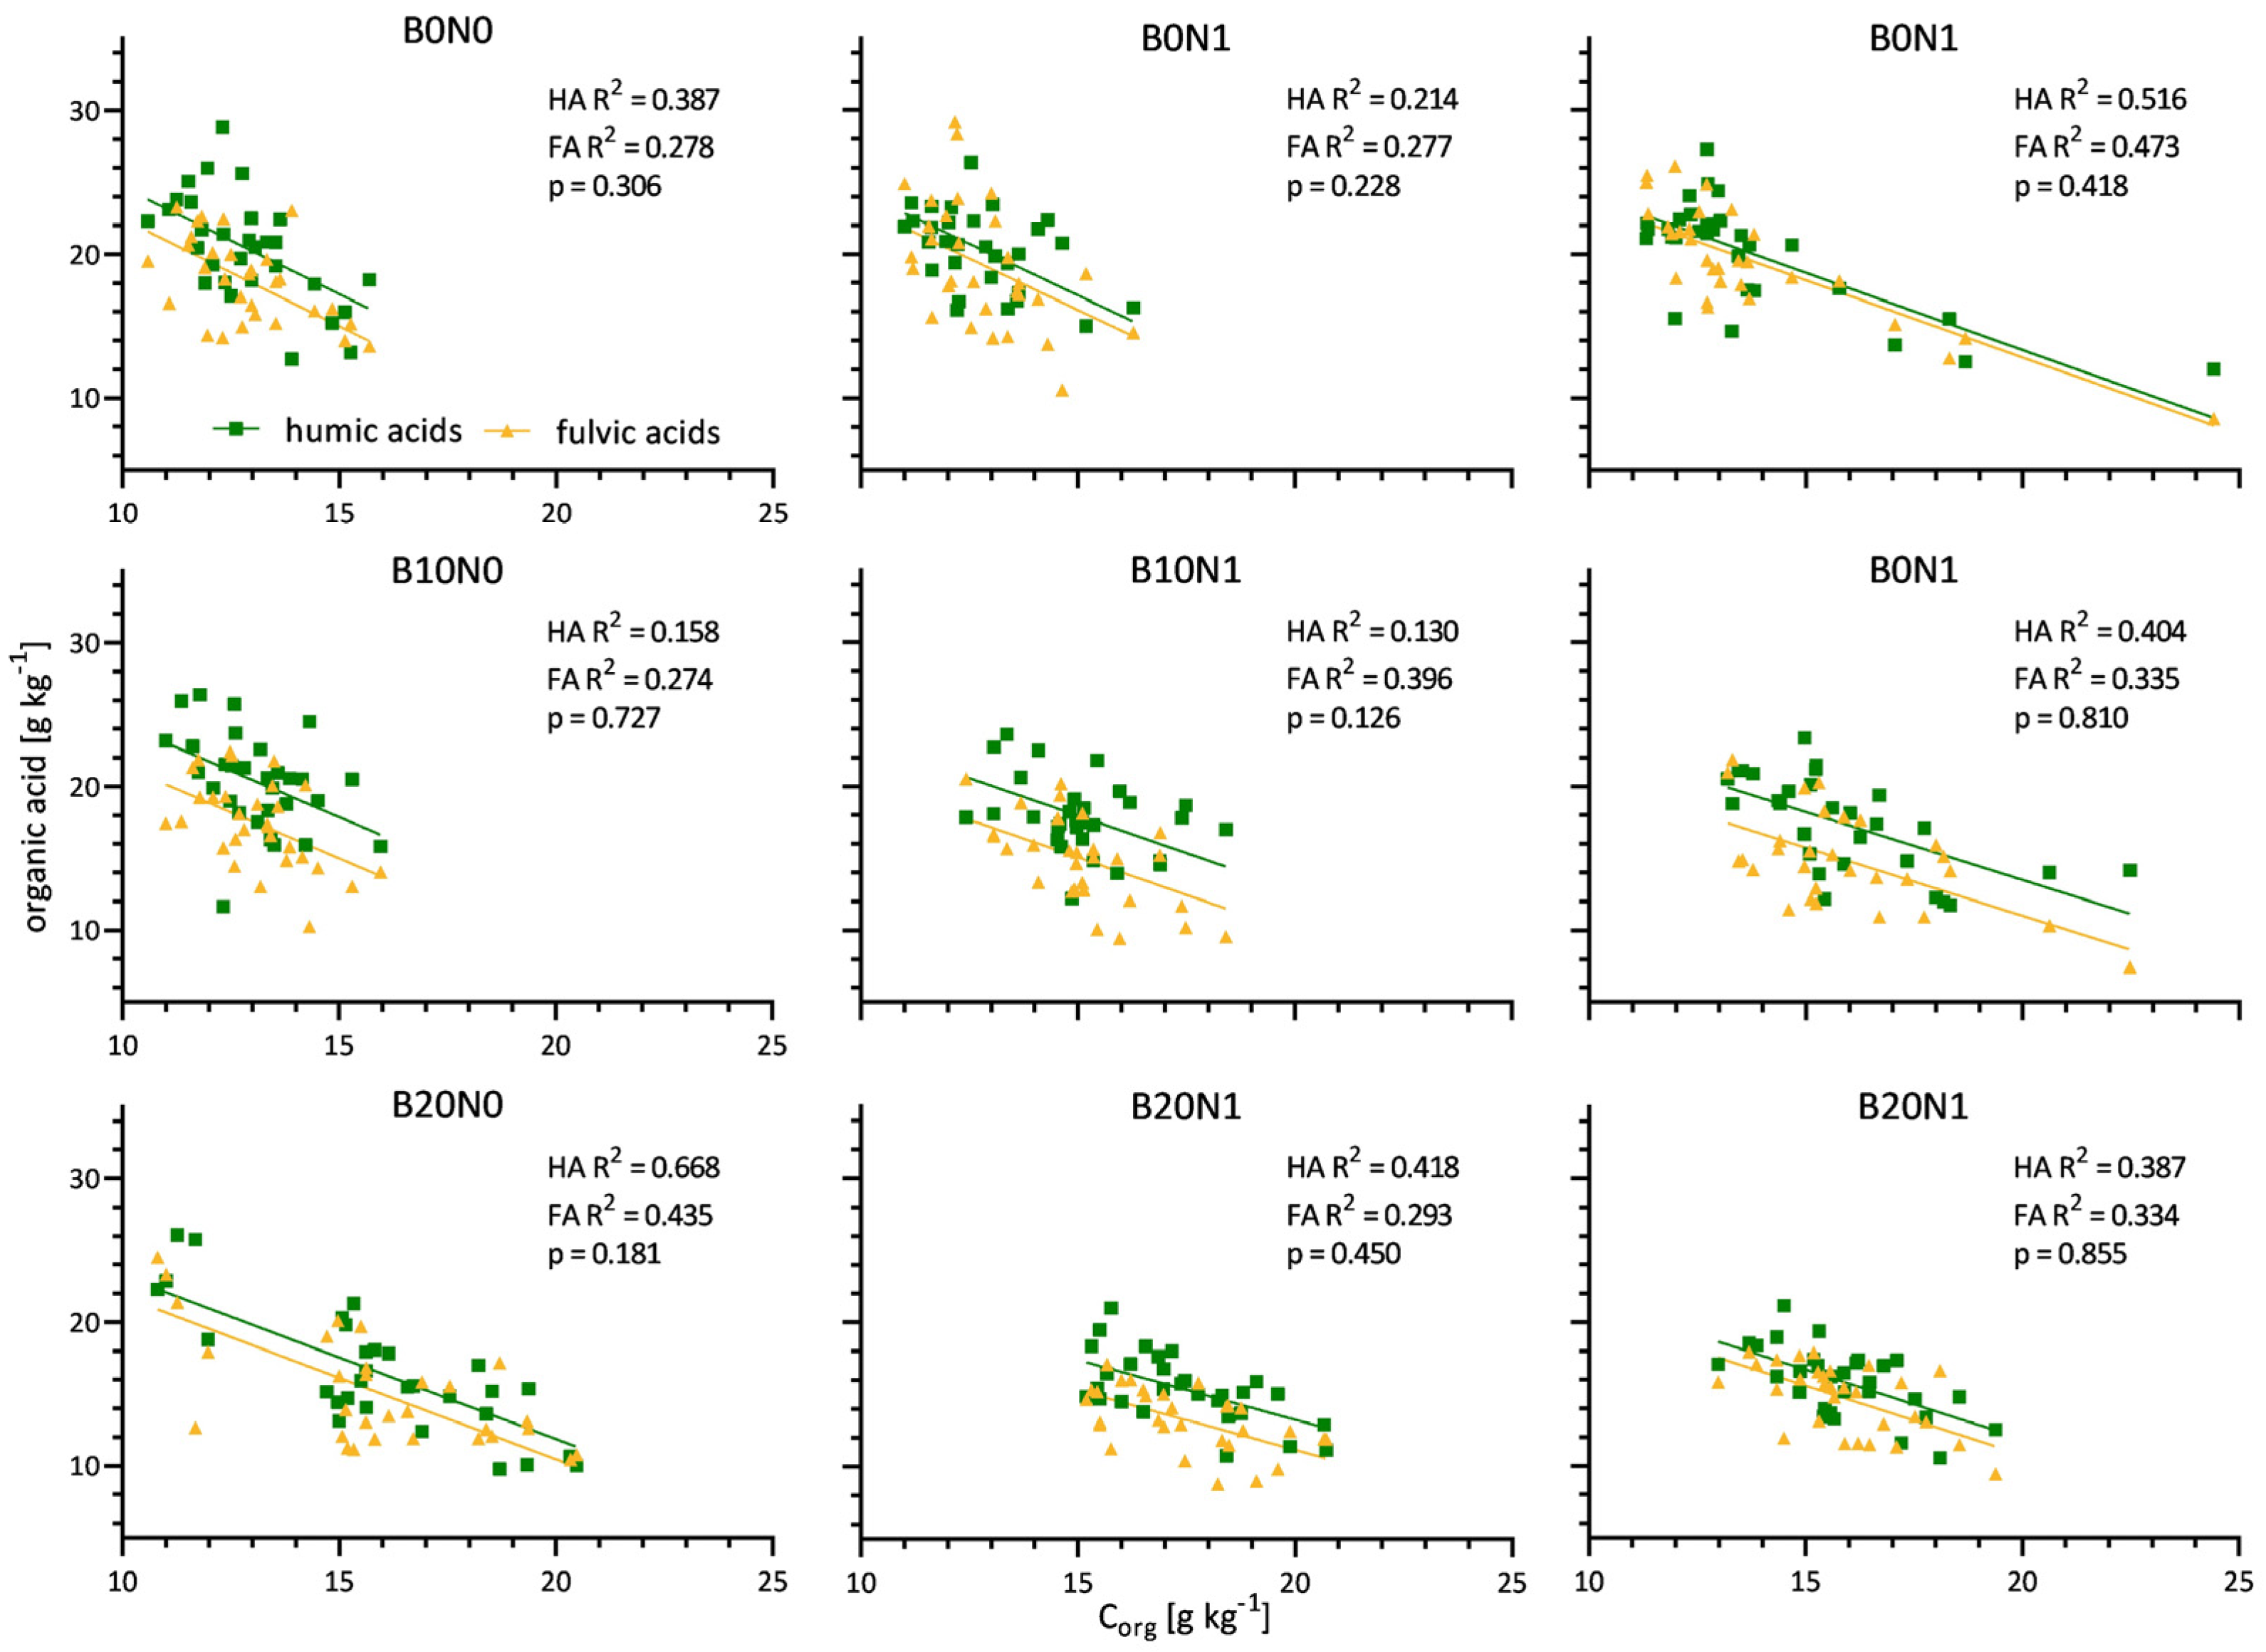
3.2. Effects of Biochar on Humic Substances

Applying organic matter to arable soils, including biochar, has great potential to increase, stabilise, and improve the amount and quality of humic substances in the soil. Predicting the effects of biochar’s addition on HSs is challenging due to its wide-ranging properties [54] and its application to diverse soil types under different climatic conditions. For this reason, little is known about its effects on the speed of humification and the creation of humic substances or their stabilisation in the soils. Several authors have stated that biochar application holds significant potential for forming and stabilising soil humic substances [27,28,55,56,57,58,59,60]—a conclusion supported by our research, but only in the case of both biochar doses combined with the second level of nitrogen fertilisation (Table 3).
However, if it is applied at a dose of 10 or 20 t ha−1 alone, or in combination with the lower level of N fertilisation, to Haplic Luvisols in a mild climate, it has no significant effect on the humic substances in the soil. On the other hand, the B10N2 and B20N2 treatments resulted in significantly lower contents of humic substances (5.07 ± 0.30 and 4.82 ± 0.29 g kg−1, respectively) and fulvic acids (2.33 ± 0.43 and 2.32 ± 0.15 g kg−1, respectively), compared to the reference B0N2 treatment (CHS: 5.28 ± 0.28 g kg−1, CFA 2.60 ± 0.12 g kg−1). The B10N2 treatment contributed to a higher content of humic acids than the B20N2 treatment. In B10N2 and B20N2, the CFA content was significantly reduced by 10 and 9%, respectively, compared to B0N2, which is positive because higher fulvic acid contents may contribute to faster leaching of heavy metals and alkaline cations from soil, compared to situations when the share of CHA predominates. Fulvic acids are very easily soluble, with high levels of migration in soil profiles; they dissociate in solutions much more strongly than humic acids and show a strongly acidic pH [29,31,61]. This suggests that biochar, in conjunction with the higher nitrogen level, decreased the contents of humic substances. However, nitrogen fertilisation at the second level was a stabilising element for humic substances in the soil. By stabilising humic substances after applying both doses of biochar with the higher nitrogen level, the quality of humus in the soil was increased, more strongly in the B10N2 than the B20N2 treatment (Table 3). In all treatments, the colour quotient values indicated more humified and mature organic matter in the soil, with high contents of condensed aromatic compounds and a low representation of aliphatic compounds [31,62]. The molecular weight and degree of condensation of humic substances increased after applying biochar, but this was only statistically significant in the cases of B10N2 and B20N2 compared to B0N2.

4. Conclusions

Our research highlights the potential of biochar to enhance soil organic carbon contents, representing a significant step towards sustainable agriculture. The investigation emphasised that biochar, especially at higher application rates, influences the composition of humic substances, contributing to the complex formation mechanisms of stable soil organic substances. Moreover, this study demonstrates the intricate relationship between biochar, nitrogen fertilisation, and the soil’s ability to form humic substances, albeit potentially impacted by the specific soil and climate conditions. The biochar treatment at the rate of 10 t ha−1 with an increased level of N fertilisation was the optimal solution for reducing mineralisation and supporting humification, thus increasing the quality of humic substances and their stabilisation in Luvisols. In the future, it will be essential to observe the evolution of the biochar’s effects over the years after its application to the soil, as the extent of the effects of biochar and its combination with N fertilisation on SOM and humus may change over time.

Author Contributions

Conceptualisation, V.Š.; methodology, V.Š.; software, V.Š. and M.L.; validation, V.Š., J.H. and M.L.; formal analysis, V.Š.; investigation, V.Š.; resources, J.H.; data curation, V.Š., J.H. and M.L.; writing—original draft preparation, V.Š.; writing—review and editing, J.H. and M.L.; visualisation, V.Š. and M.L.; supervision, V.Š.; project administration, V.Š. and J.H.; funding acquisition, J.H. All authors have read and agreed to the published version of the manuscript.

Funding

This study was supported by the Scientific Grant Agency, grant numbers VEGA 1/0116/21 and VEGA 1/00201/22. Furthermore, this publication results from the implementation of projects by the Slovak Research and Development Agency under contract No. APVV-21-0089.

Data Availability Statement

The datasets generated and analysed during this study are available from the authors upon reasonable request.

Acknowledgments

The authors thank the editor and the reviewers for their constructive comments.

Conflicts of Interest

The authors declare no conflicts of interest. The funders had no role in the study’s design; in the collection, analyses, or the interpretation of the data; in the writing of the manuscript; or in the decision to publish the results.

References

  1. Lal, R. Sequestering carbon and increasing productivity by conservation agriculture. J. Soil Water Conserv. 2015, 70, 55A–62A. [Google Scholar] [CrossRef]
  2. Adenle, A.A.; Wedig, K.; Azadi, H. Sustainable agriculture and food security in Africa: The role of innovative technologies and international organisations. Technol. Soc. 2019, 58, 101143. [Google Scholar] [CrossRef]
  3. Lal, R. Reducing carbon footprints of agriculture and food systems. Carbon Footpr. 2022, 1, 3. [Google Scholar] [CrossRef]
  4. Glaster, B.; Birk, J.J. State of the scientific knowledge on properties and genesis of Anthropogenic Dark Earths in Central Amazonia (terra preta de Índio). GCA 2012, 82, 39–51. [Google Scholar] [CrossRef]
  5. Wilson, K. How biochar works in soil. Biochar J. 2014, 25–33. Available online: www.biochar-journal.org/en/ct/32 (accessed on 20 February 2024).
  6. Lehmann, J.; Joseph, S. Biochar for Environmental Management: Science, Technology and Implementation, 2nd ed.; Routledge: London, UK; New York, NY, USA, 2015; 928p. [Google Scholar]
  7. Vasilchenko, A.V.; Vasilchenko, A.S. Plaggic anthrosol in modern research: Genesis, properties and carbon sequestration potential. Catena 2024, 234, 107626. [Google Scholar] [CrossRef]
  8. Hu, L.; Chao, Z.; Gu, M.; Li, Y.; Xing, B.; Dai, J. Evidence for a Neolithic Age fire-irrigation paddy cultivation system in the lower Yangtze River Delta, China. J. Archaeol. Sci. 2013, 40, 72–78. [Google Scholar] [CrossRef]
  9. Sheil, D.; Basuki, I.; German, L.; Kuyper, T.W.; Limberg, G.; Puri, R.K.; Sellato, B.; van Noordwijk, M.; Wollenberg, E. Do Anthropogenic Dark Earths occur in the interior of Borneo? Some initial observations from East Kalimantan. Forests 2012, 3, 207–229. [Google Scholar] [CrossRef]
  10. Ogawa, M.; Okimori, Y. Pioneering works in biochar research, Japan. Soil Res. 2010, 48, 489–500. [Google Scholar] [CrossRef]
  11. Buss, W.; Graham, M.C.; Shepherd, J.G.; Mašek, O. Suitability of marginal biomass-derived biochars for soil amendment. Sci. Total Environ. 2016, 547, 314–322. [Google Scholar] [CrossRef]
  12. Vaverková, M.D. Landfill impacts on the environment. Geosciences 2019, 9, 431. [Google Scholar] [CrossRef]
  13. Enaime, G.; Lübken, M. Agricultural waste-based biochar for agronomic applications. Appl. Sci. 2021, 11, 8914. [Google Scholar] [CrossRef]
  14. Aydin, E.; Šimanský, V.; Horák, J.; Igaz, D. Potential of biochar to alternate soil properties and crop yields 3 and 4 years after the application. Agronomy 2020, 10, 889. [Google Scholar] [CrossRef]
  15. Khan, S.; Irshad, S.; Mehmood, K.; Hasnain, Z.; Nawaz, M.; Rais, A.; Gul, S.; Wahid, M.A.; Hashem, A.; Abd-Allah, E.F.; et al. Biochar production and characteristics, its impacts on soil health, crop production, and yield enhancement: A review. Plants 2024, 13, 166. [Google Scholar] [CrossRef] [PubMed]
  16. Dong, X.; Guan, T.; Li, G.; Lin, Q.; Zhao, X. Long-term effects of biochar amount on the content and composition of organic matter in soil aggregates under field conditions. J. Soils Sediments 2016, 16, 1481–1497. [Google Scholar] [CrossRef]
  17. Wang, Y.; Yin, Y.; Joseph, J.; Flury, M.; Wang, X.; Tahery, S.; Li, B.; Shang, J. Stabilization of organic carbon in top- and subsoil by biochar application into calcareous farmland. Sci. Total Environ. 2024, 907, 168046. [Google Scholar] [CrossRef] [PubMed]
  18. Whitman, T.; Singh, B.P.; Zimmerman, A.R. Priming effects in biochar-amended soils: Implications of biochar-soil organic matter interactions for carbon storage. In Biochar for Environmental Management; Lehmann, J., Joseph, S., Eds.; Routledge: London, UK; Taylor and Francis Group: New York, NY, USA, 2015; pp. 455–487. [Google Scholar]
  19. Šimanský, V.; Šrank, D.; Juriga, M. Differences in soil properties and crop yields after application of biochar blended with farmyard manure in sandy and loamy soils. Acta Fytotechn. Zootechn. 2019, 22, 21–25. [Google Scholar] [CrossRef]
  20. Horák, J. Testing biochar as a possible way to ameliorate slightly acidic soil at the research field located in the Danubian lowland. Acta Hortic. Reg. 2015, 18, 20–24. [Google Scholar] [CrossRef]
  21. Yuan, J.H.; Xu, R.K. Effects of biochars generated from crop residues on chemical properties of acid soils from tropical and subtropical China. Soil Res. 2012, 50, 570–578. [Google Scholar] [CrossRef]
  22. Igaz, D.; Šimanský, V.; Horák, J.; Kondrlová, E.; Domanová, J.; Rodný, M.; Buchkina, N. Can a single dose of biochar affect selected soil physical and chemical characteristics? J. Hydrol. Hydromech. 2018, 66, 421–428. [Google Scholar] [CrossRef]
  23. Thies, J.E.; Rillig, M.C.; Graber, E.R. Biochar effects on the abundance, activity and diversity of the soil biota. In Biochar for Environmental Management: Science, Technology and Implementation; Lehmann, J., Joseph, S., Eds.; Routledge: London, UK; New York, NY, USA, 2015; pp. 327–388. [Google Scholar]
  24. Liu, H.; Li, H.; Zhang, A.; Rahaman, M.A.; Yang, Z. Inhibited effect of biochar application on N2O emissions is amount and time-dependent by regulating denitrification in a wheat-maise rotation system in North China. Sci. Total Environ. 2020, 721, 137636. [Google Scholar] [CrossRef] [PubMed]
  25. Yang, W.; Feng, G.; Miles, D.; Gao, L.; Jia, Y.; Li, C.; Qu, Z. Impact of biochar on greenhouse gas emissions and soil carbon sequestration in corn grown under drip irrigation with mulching. Sci. Total Environ. 2020, 729, 138752. [Google Scholar] [CrossRef] [PubMed]
  26. Horák, J.; Šimanský, V.; Igaz, D.; Juriga, M.; Aydin, E.; Lukac, M. Biochar—An important component ameliorating the productivity of intensively used soils. Pol. J. Environ. Stud. 2020, 29, 2995–3001. [Google Scholar] [CrossRef] [PubMed]
  27. Mierzwa-Hersztek, M.; Gondek, K.; Kopieć, M.; Ukalska-Jaruga, A. Biochar changes in soil based on quantitative and qualitative humus compounds parameters. Soil Sci. Ann. 2018, 69, 234–242. [Google Scholar] [CrossRef]
  28. Zhang, J.; Lü, F.; Shao, L.; He, P. The use of biochar-amended composting to improve the humification and degradation of sewage sludge. Bioresour. Technol. 2014, 168, 252–258. [Google Scholar] [CrossRef] [PubMed]
  29. Stevenson, J.F. Humus Chemistry; John Wiley & Sons: New York, NY, USA, 1994; 512p. [Google Scholar]
  30. Lehmann, J.; Kleber, M. The contentious nature of soil organic matter. Nature 2015, 528, 60–68. [Google Scholar] [CrossRef] [PubMed]
  31. Weil, R.R.; Brady, N.C. The Nature and Properties of Soils; Pearson Education Limited: London, UK, 2017; 1104p. [Google Scholar]
  32. Poláková, N.; Šimanský, V.; Kravka, M. The influence of soil organic matter fractions in aggregates stabilisation in agricultural and forest soils of selected Slovak and Czech hilly lands. J. Soils Sediments 2018, 18, 2790–2800. [Google Scholar] [CrossRef]
  33. Ćwieląg-Piasecka, I.; Medyńska-Juraszek, A.; Jerzykiewicz, M.; Dębicka, M.; Bekier, J.; Jamroz, E.; Kawałko, D. Humic acid and biochar as specific sorbents of pesticides. J. Soils Sediments 2018, 18, 2692–2702. [Google Scholar] [CrossRef]
  34. Mu, D.; Mu, L.; Geng, X.; Mohamed, T.A.; Wei, Z. Evolution from basic to advanced structure of fulvic acid and humic acid prepared by food waste. Int. J. Biol. Macromol. 2024, 256, 128413. [Google Scholar] [CrossRef]
  35. Greenland, D.J.; Rimmer, D.; Payne, D. Determination of the structural stability class of English and Welsh soil, using a water coherence test. Eur. J. Soil Sci. 1975, 26, 294–303. [Google Scholar] [CrossRef]
  36. Nelissenn, V.; Rütting, T.; Huygens, D.; Staelens, J.; Ruysschaert, G.; Boeckx, P. Maize biochars accelerate short-term soil nitrogen dynamics in a loamy sand soil. Soil Biol. Biochem. 2012, 55, 20–27. [Google Scholar] [CrossRef]
  37. Jagadamma, S.; Lal, R.; Hoeft, R.G.; Nafziger, E.D.; Adee, E.A. Nitrogen fertilisation and cropping system impacts on soil properties and their relationship to crop yield in the central Corn Belt, USA. Soil Till. Res. 2008, 98, 120–129. [Google Scholar] [CrossRef]
  38. Zavarzina, A.G.; Vanifatova, N.G.; Stepanov, A.A. Fractionation of humic acids according to their hydrophobicity, size and charge-dependent mobility by the salting-out method. Eurasian Soil Sci. 2008, 41, 1294–1301. [Google Scholar] [CrossRef]
  39. Váchalová, R.; Kolář, L.; Muchová, Z. Primární Organická Půdní Hmota a Humus, Dvě Složky Půdní Organické Hmoty [Primary Soil Organic Matter and Humus, Two Components of Soil Organic Matter]; SUA: Nitra, Slovakia, 2016; p. 122. (In Czech) [Google Scholar]
  40. World Reference Base for Soil Resources 2014. International Soil Classification System for Naming Soils and Creating Legends for Soil Maps. Update 2015; World Soil Resources Reports No. 106; FAO: Rome, Italy, 2015; Available online: http://www.fao.org/3/i3794en/I3794en.pdf (accessed on 13 June 2021).
  41. Dziadowiec, H.; Gonet, S. Przewodnik Metodyczny do Badań Materii Organicznej Gleb [Methodological Guidebook for the Organic Matter Researches]; PTG: Warszawa, Poland, 1999; pp. 31–34. (In Polish) [Google Scholar]
  42. Šimanský, V.; Polláková, N.; Chlpík, J.; Kolenčík, M. Pôdoznalectvo [Soil Science]; SPU: Nitra, Slovakia, 2018; p. 398. (In Slovak) [Google Scholar]
  43. Agegnehu, G.; Srivastava, A.K.; Bird, M.I. The role of biochar and biochar-compost in improving soil quality and crop performance: A review. Appl. Soil Ecol. 2017, 119, 156–170. [Google Scholar] [CrossRef]
  44. Luo, C.; Yang, J.; Chen, W.; Han, F. Effect of biochar on soil properties on the Loess Plateau: Results from field experiments. Geoderma 2020, 369, 114323. [Google Scholar] [CrossRef]
  45. Campbell, C.A.; Selles, F.; Lafond, G.P.; McConkey, G.B.; Hahn, D. Effect of crop management on C and N in long-term crop rotations after adopting no-tillage management: Comparison of soil sampling strategies. Can. J. Soil Sci. 1998, 78, 55–62. [Google Scholar] [CrossRef]
  46. Erda, L.; Yunfen, L.; Yue, L. Agricultural carbon cycle and greenhouse gas emission in China. Nutr. Cycl. Agroecosyst. 1997, 49, 295–299. [Google Scholar] [CrossRef]
  47. Graham, P.H.; Draeger, K.J.; Ferrey, M.L.; Conroy, M.J.; Hammer, B.E.; Martinez, E.; Aarons, S.R.; Quinto, C. Acid pH tolerance in strains of Rhizobium and Bradyrhizobium, and initial studies on the basis for acid tolerance of Rhizobium tropici UMR1899. Can. J. Microbiol. 1994, 40, 198–207. [Google Scholar] [CrossRef]
  48. Yan, D.; Wang, D.; Yang, L. Long-term effect of chemical fertiliser, straw, and manure on labile organic matter fractions in a paddy soil. Biol. Fertilit. Soils 2007, 44, 93–101. [Google Scholar] [CrossRef]
  49. Yang, X.Y.; Li, P.R.; Zhang, S.L.; Sun, B.H.; Chen, X.P. Long-term-fertilization effects on soil organic carbon, physical properties, and wheat yield of a loess soil. J. Plant Nutr. Soil Sci. 2021, 174, 775–784. [Google Scholar] [CrossRef]
  50. Whitman, T.; Enders, A.; Lehmann, J. Pyrogenic carbon additions to soil counteract positive priming of soil carbon mineralisation by plants. Soil Biol. Biochem. 2014, 73, 33–41. [Google Scholar] [CrossRef]
  51. Singh, B.P.; Cowie, A.L. Long-term infl uence of biochar on native organic carbon mineralisation in a low-carbon clayey soil. Sci. Rep. 2014, 4, 3687. [Google Scholar] [CrossRef] [PubMed]
  52. Jones, D.L.; Rousk, J.; Edwards-Jones, G.; DeLuca, T.H.; Murphy, D.V. Biochar-mediated changes in soil quality and plant growth in a three year field trial. Soil Biol. Biochem. 2012, 45, 113–124. [Google Scholar] [CrossRef]
  53. Grishina, L.G. Humus Formation and Humic State of Soils; MGU: Moscow, Russia, 1986; p. 243. [Google Scholar]
  54. Jindo, K.; Sonoki, T.; Matsumoto, K.; Canellas, L.; Roig, A.; Sanchez-Monedero, M.A. Influence of biochar addition on the humic substances of composting manures. Waste Manag. 2016, 49, 545–552. [Google Scholar] [CrossRef] [PubMed]
  55. Glaser, B.; Lehmann, J.; Zech, W. Ameliorating physical and chemical properties of highly weathered soils in the tropics with charcoal—A review. Biol. Fert. Soils 2002, 35, 219–230. [Google Scholar] [CrossRef]
  56. Lopez-Capel, E.; Zwart, K.; Shackley, S.; Postma, R.; Stenstrom, J.; Rasse, D.P.; Budai, A.; Glaser, B. Biochar properties. In Biochar in European Soils and Agriculture; Shackley, S., Ruysschaert, G., Zwart, K., Glaser, B., Eds.; Routledge: London, UK; New York, NY, USA, 2016; pp. 41–72. [Google Scholar]
  57. Li, H.; Wang, Y.; Wang, T.; Ma, H. Effect of biochar on organic matter conservation and metabolic quotient of soil. Environ. Prog. Sustain. Energy 2015, 34, 1467–1472. [Google Scholar] [CrossRef]
  58. Juriga, M.; Šimanský, V.; Horák, J.; Kondrlová, E.; Igaz, D.; Polláková, N.; Buchkina, N.; Balashov, E. The effect of different rates of biochar and biochar in combination with N fertiliser on the parameters of soil organic matter and soil structure. J. Ecol. Eng. 2018, 19, 153–161. [Google Scholar] [CrossRef]
  59. Orlova, N.; Abakumov, E.; Orlova, E.; Yakkonen, K.; Shahnazarova, V. Soil organic matter alteration under biochar amendment: Study in the incubation experiment on the Podzol soils of the Leningrad region (Russia). J. Soils Sediments 2019, 19, 2708–2716. [Google Scholar] [CrossRef]
  60. Šrank, D.; Šimanský, V. Differences in soil organic matter and humus of sandy soil after application of biochar substrates and combination of biochar substrates with mineral fertilisers. Acta Fytotechn. Zootechn. 2020, 23, 117–124. [Google Scholar] [CrossRef]
  61. Weber, J. Humic substances and their role in the environment. EC Agric. 2020, 1, 3–8. [Google Scholar]
  62. Pansu, M.; Gautheyrou, J.S. Handbook of Soil Analysis. Mineralogical, Organic and Inorganic Methods; Springer: Berlin/Heideberg, Germany, 2006; p. 993. [Google Scholar]
Figure 1. Location of the study area and treatments.
Land 13 00481 g001
Figure 2. Soil organic carbon (average for 2014–2019, ±standard deviation). Letters indicate homogeneous groups according to Tukey’s procedure at a 0.05 significance level. Different letters between columns indicate that treatment means are significantly different at p < 0.05 according to Tukey’s test.
Land 13 00481 g002
Figure 3. Soil organic matter parameters (average for 2014–2019, ±standard deviation). The letters indicate homogeneous groups according to Tukey’s procedure at a 0.05 significance level. Different letters between slices in graphs of the same colour in rows indicate that treatment means are significantly different at p < 0.05.
Land 13 00481 g003
Figure 4. The contents of humic and fulvic acids in soil samples modified by adding biochar and fertiliser, as a function of total organic carbon content (Corg); p values represent differences between the slopes of linear fits.
Land 13 00481 g004
Table 1. An overview of the application of biochar and N fertiliser in all combinations of soil amendment treatments across the six years of the experiment.
Year and Sown Crop2014
Spring Barley
2015
Maize
2016
Spring Wheat
2017
Maize
2018
Spring Barley
2019
Maize
Soil AmendmentBiochar
(t ha−1)
Fertiliser
(kg ha−1)
Fertiliser
(kg ha−1)
Fertiliser
(kg ha−1)
Fertiliser
(kg ha−1)
Fertiliser
(kg ha−1)
Fertiliser
(kg ha−1)
Treatments
No fertilisation: N0
B0N00000000
B1N010000000
B2N020000000
Fertilisation: N1
B0N104016010016040108
B1N1104016010016040108
B2N1204016010016040108
Fertilisation: N2
B0N208024015024080162
B1N2108024015024080162
B2N2208024015024080162
Table 2. Trends of SOM parameters’ distribution in the biochar treatments for the vegetation seasons of 2014–2019.
TreatmentsEquationsR2TrendProbabilityTreatmentsEquationsR2TrendProbability
CorgHS ration in Corg
B0N0y = 0.08x + 11.60.2940increase**B0N0y = −0.38x + 44.50.4944decrease***
B10N0y = 0.04x + 12.50.0982increasen.s.B10N0y = −0.26x + 41.90.2995decrease**
B20N0y = 0.22x + 12.50.5375increase***B20N0y = −0.54x + 40.00.5178decrease***
B0N1y = −0.04x + 13.40.0667decreasen.s.B0N1y = 0.02x + 39.10.0019increasen.s.
B10N1y = −0.01x + 15.20.0015decreasen.s.B10N1y = −0.02x + 33.10.0020decreasen.s.
B20N1y = −0.03x + 18.00.0323decreasen.s.B20N1y = 0.002x + 28.70.0004increasen.s.
B0N2y = −0.16x + 16.20.2589decrease**B0N2y = 0.29x + 35.30.1592increase*
B10N2y = −0.08x + 17.10.1062decreasen.s.B10N2y = 0.10x + 30.70.0418increasen.s.
B20N2y = −0.06x + 16.80.1337decrease*B20N2y = 0.14x + 28.50.1332increase*
Share of HA in CorgShare of FA in Corg
B0N0y = −0.33x + 25.60.6211decrease***B0N0y = −0.05x + 19.00.0216decreasen.s.
B10N0y = −0.28x + 24.60.5315decrease***B10N0y = 0.02x + 17.10.0050increasen.s.
B20N0y = −0.40x + 22.70.6655decrease***B20N0y = −0.14x + 17.30.1080decreasen.s.
B0N1y = 0.05x + 19.60.0206increasen.s.B0N1y = −0.03x + 19.70.0030decreasen.s.
B10N1y = −0.05x + 18.70.0303decreasen.s.B10N1y = 0.03x + 14.50.0086increasen.s.
B20N1y = −0.03x + 15.80.0109decreasen.s.B20N1y = 0.03x + 12.80.0166increasen.s.
B0N2y = 0.15x + 17.80.1178increasen.s.B0N2y = 0.14x + 17.40.0987increasen.s.
B10N2y = 0.06x + 16.40.0291increasen.s.B10N2y = 0.04x + 14.30.0114increasen.s.
B20N2y = 0.08x + 14.60.0865increasen.s.B20N2y = 0.06x + 13.90.0456increasen.s.
Notes: n.s.—non-significant; * p < 0.05; ** p < 0.01; *** p < 0.001; y = Corg, share of HS in Corg, share of HA in Corg, and share of FA in Corg distribution with time x = months during the vegetation seasons of 2014–2019 (n = 30).
Table 3. Humus parameters (average for 2014–2019, ±standard deviation).
TreatmentsCHSCHACFACHA:CFA RatioQHS4/6QHA4/6
g kg−1
B0N04.96 ± 0.34 a2.62 ± 0.37 a2.38 ± 0.37 a1.15 ± 0.29 a4.63 ± 0.46 a3.88 ± 0.35 a
B10N04.99 ± 0.31 a2.67 ± 0.35 a2.29 ± 0.35 a1.21 ± 0.35 a4.54 ± 0.44 a3.85 ± 0.29 a
B20N04.85 ± 0.37 a2.51 ± 0.39 a2.33 ± 0.42 a1.17 ± 0.44 a4.61 ± 0.41 a3.90 ± 0.31 a
p-value0.27020.27420.70330.81810.66850.8597
B0N15.01 ± 0.35 a2.58 ± 0.33 a2.44 ± 0.48 a1.12 ± 0.33 a4.76 ± 0.53 a3.95 ± 0.38 a
B10N14.95 ± 0.25 a2.70 ± 0.35 a2.25 ± 0.37 a1.26 ± 0.38 a4.61 ± 0.41 a3.93 ± 0.33 a
B20N14.95 ± 0.35 a2.62 ± 0.33 a2.42 ± 0.66 a1.19 ± 0.28 a4.67 ± 0.45 a3.96 ± 0.40 a
p-value0.72210.38880.30260.25290.45050.9628
B0N25.28 ± 0.28 c2.68 ± 0.34 ab2.60 ± 0.12 b1.05 ± 0.23 a4.88 ± 0.48 b4.07 ± 0.38 a
B10N25.07 ± 0.30 b2.75 ± 0.43 b2.33 ± 0.43 a1.23 ± 0.27 b4.63 ± 0.28 a3.98 ± 0.39 a
B20N24.82 ± 0.29 a2.50 ± 0.30 a2.32 ± 0.15 a1.11 ± 0.26 ab4.66 ± 0.21 a3.94 ± 0.36 a
p-value0.00000.02350.00340.05340.03270.4408
Notes: CHS—carbon of humic substances, CHA—carbon of humic acids, CFA—carbon of fulvic acids, QHS4/6—colour quotient of humic substances, QHA4/6—colour quotient of humic acids. The letters indicate homogeneous groups according to Tukey’s procedure at a 0.05 significance level. Different letters between rows indicate that treatment means are significantly different at p < 0.05.
Disclaimer/Publisher’s Note: The statements, opinions and data contained in all publications are solely those of the individual author(s) and contributor(s) and not of MDPI and/or the editor(s). MDPI and/or the editor(s) disclaim responsibility for any injury to people or property resulting from any ideas, methods, instructions or products referred to in the content.

