Article

Research on the Decoupling Relationship between Transportation Land and Population Growth: A Case of Guangdong Province in China

1
School of Public Administration and Policy, Renmin University of China, Beijing 100872, China
2
School of Architecture and Urban Planning, Shenzhen University, Shenzhen 518060, China
*
Author to whom correspondence should be addressed.
Land 2024, 13(4), 484; https://doi.org/10.3390/land13040484
Submission received: 3 March 2024 / Revised: 26 March 2024 / Accepted: 5 April 2024 / Published: 9 April 2024

Abstract

:
The imbalance between the population, transportation, and construction is an important factor affecting coordinated regional development in China. Using transportation land area and population data from 2010, 2015, and 2020 in 121 counties (cities and districts) of Guangdong Province, this study analyzes the spatiotemporal changes in transportation land and population structure. It explores the relationship between transportation land and population size changes using exploratory spatial data analysis (ESDA) and decoupling models. Research suggests the following: (1) From 2010 to 2020, the per capita transportation land in various districts and counties of Guangdong Province showed a hierarchical structure of “low center and high periphery”. Conversely, the proportion of transportation land to construction land displayed a “high center and low periphery” characteristic. (2) During the same period, the total amount of transportation land in the peripheral areas of the Pearl River Delta was higher than that in the PRD (the Pearl River Delta) and the gap widened each year. Meanwhile, the proportion of transportation land to construction land in the peripheral areas of the Pearl River Delta was consistently higher than that in the PRD. (3) From 2010 to 2015, the relationship between population growth and transportation land in Guangdong Province showed a hierarchical pattern, while from 2015 to 2020, the pattern became more complex, and regional imbalance intensified. The decoupling results of PRD showed weak decoupling and expanding negative decoupling from 2010 to 2020. The peripheral areas of the Pearl River Delta are characterized by strong negative decoupling and expanding negative decoupling. Research has shown that although Guangdong Province is one of the most developed provinces in China, the mismatch between transportation land and population size in economically underdeveloped areas has become increasingly severe, with changes in the provincial population distribution pattern. The decoupling phenomenon between the transportation land and population is very obvious, and the policy of achieving regional balanced development through transportation infrastructure construction needs to be reviewed.

1. Introduction

Transportation land is a crucial component of China’s construction land, designated for the construction of transportation infrastructure, including highways, railways, airports, ports, etc. [1]. The transportation network serves as a vital foundation for regional economic development, and the amount of transportation land to some extent reflects the level of development of the transportation network [2]. Since the late 1970s, when the Chinese central government implemented the reform and opening-up policy, China has experienced rapid economic growth, with urban construction land continuously expanding and the construction of transportation infrastructure accelerating. The development of transportation infrastructure is considered an important experience for China’s rapid economic growth [3]. In particular, in regions of China where economic development has been relatively rapid, transportation systems have been continuously optimized and expanded, and the rapid expansion of transportation land has become a prominent feature of land use change in China [4]. The 2022 Chinese Natural Resources Statistical Bulletin indicated that China’s total transportation land area has reached 101,800 square kilometers, an increase of 3.89 times compared to 2002, with an average annual growth rate of 8.26% [5].
While the construction of transportation systems holds positive significance for regional economic development and sustainable growth, the substantial increase in transportation-related land use is a noteworthy concern. If the proportion of land occupied by transportation infrastructure construction is disproportionately large, it can significantly affect the rational use of existing land resources, potentially leading to a waste of land resources. On the one hand, the large-scale increase in transportation land consumes substantial land resources, resulting in the fragmentation of land use and negative ecological impacts [6]. On the other hand, the investment required for transportation construction is substantial, but the economic returns are slow [7]. Low utilization rates of transportation facilities not only lead to the significant waste of land resources but also increase the financial burden on cities [8]. Thus, a reasonable scale for transportation land is crucial for promoting regional coordination and sustainable development.
In China, the adage “If you want to get rich, build roads first” has been a pivotal strategy for local governments in economic development. The concept of balanced transportation has been viewed as an important method to strengthen economic connections between developed and underdeveloped regions and to narrow the disparities in regional development. Consequently, over the past few decades, Chinese local governments have dedicated themselves to transportation infrastructure construction, laying the foundation for economic growth [4,9]. Moreover, influenced by the concept of coordinated regional development, a significant amount of public investment by the government has been skewed towards underdeveloped areas, leading to the extensive construction of transportation systems in many underdeveloped regions [10,11]. While transportation development can indeed improve conditions in underdeveloped areas to some extent, excessive transportation infrastructure construction is a cause for caution. Especially in recent years, profound changes have occurred in China’s regional economic structure and demographic structure. The population in underdeveloped regions is accelerating its shift towards developed areas [12], and the imbalance between population and transportation development has become increasingly severe [13]. Faced with the dual contradictions of regional balanced development and the waste of transportation resources, research on the relationship between transportation land and the population scale offers new perspectives to address this issue.
There is a relatively limited amount of research directly addressing the relationship between transportation land and the population. From the perspective of literature relevance, current researchers tend to focus on analyzing the coupled relationship between population and land use changes, as well as the impact of transportation land. In existing research on the coupled relationship between population and land changes, quantitative analysis methods have been primarily employed. Common analytical techniques include the MCCA model, the coupling coordination model, the Tapio decoupling model, econometric models, etc. [14,15,16,17]. For instance, Feng Qiu et al. utilized spatial econometric methods to analyze the Edmonton–Calgary Corridor (ECC) region of Alberta, Canada. Their findings indicated a significant spatial interaction between population growth and urban land development, with population growth promoting land development, which in turn attracted suburban and rural residents to migrate to urban areas, thereby driving population growth [16]. Hung Chak Ho et al., based on a combined comparison of spatial multicriteria analysis, zonal statistics, and spatiotemporal modeling, examined population growth and land development in the continental United States from 2001 to 2011 to identify regions of population pressure. They discovered that the Midwest and Southern states in the United States will face less population pressure in future land development, while the southeast coast, Washington state, northern Texas, and the Southwest will face greater pressure due to faster population growth compared to suitable land loss [17]. Leonardo Bianchini et al. used principal component analysis to assess the spatial changes in per capita land use change indicators at five time points in Rome from 1949 to 2016. The results indicate that the mismatch between Rome’s urban expansion and population growth is increasing, highlighting the unsustainable characteristics of the current development pattern [18]. In China, there is also a wealth of research on the relationship between population and land changes. For example, Yongsheng Wang et al. used the Tapio decoupling model to study the relationship between the area of rural residential land and the resident population in the Yellow River Basin. The results indicated that the rural man–land relationship in the Yellow River Basin is not harmonious, characterized by a loss of the resident population in rural areas and an expansion of rural residential land areas [19]. Congmou Zhu et al., using the urban–rural construction land structure transformation index, established a theoretical model to reveal the relationship between urban–rural construction land transformation and urban–rural population flow. They found that the relationship between construction land and population flow in the Yangtze River Delta city group transitioned from a coupled state from 2000 to 2005 to a weak decoupling state from 2005 to 2015, with significant regional differences [20].
The academic community has conducted extensive research on transportation land. The construction of transportation land has been widely demonstrated to have a very positive significance in promoting regional economic development [21,22,23]. For instance, Eva Ivanova et al. employed time series and correlation analysis to study the transportation network of Czechoslovakia from 2000 to 2011, discovering a strong correlation between GDP development and the construction of transportation infrastructure. High-quality transportation facilities contribute to the direct inflow of external capital, thereby enhancing regional competitiveness [23]. C. P. Ng et al. analyzed time-series cross-sectional data from 60 countries over a period of 3 decades from 1980 to 2010 using fixed-effects panel linear regression, finding that the increase in road length per thousand people led to an increase in export volume, contributing to economic growth [22]. However, in terms of the relationship between transportation land construction and rural development, the promotion effect of transportation land construction shows significant regional differences. For instance, Sam Asher et al. used fuzzy regression discontinuity designs, and comprehensive household and firm census microdata to assess the impact of India’s USD 40 billion national rural road construction program, discovering that the main effect of transportation land growth is to facilitate the movement of workers out of agriculture. Even with better market connections, remote areas still lack economic opportunities [24]. John Gibson et al., based on the cross-sectional data of 4000 rural households in Indonesia from 1993 to 2000, proved that improving the accessibility and quality of rural road facilities would bring benefits to rural development [25]. Even though there are differences in the research of different scholars, it is undeniable that transportation land is a very important entry point for studying regional development. Research on the relationship between transportation land and population changes can provide a basis for addressing regional coordinated development.
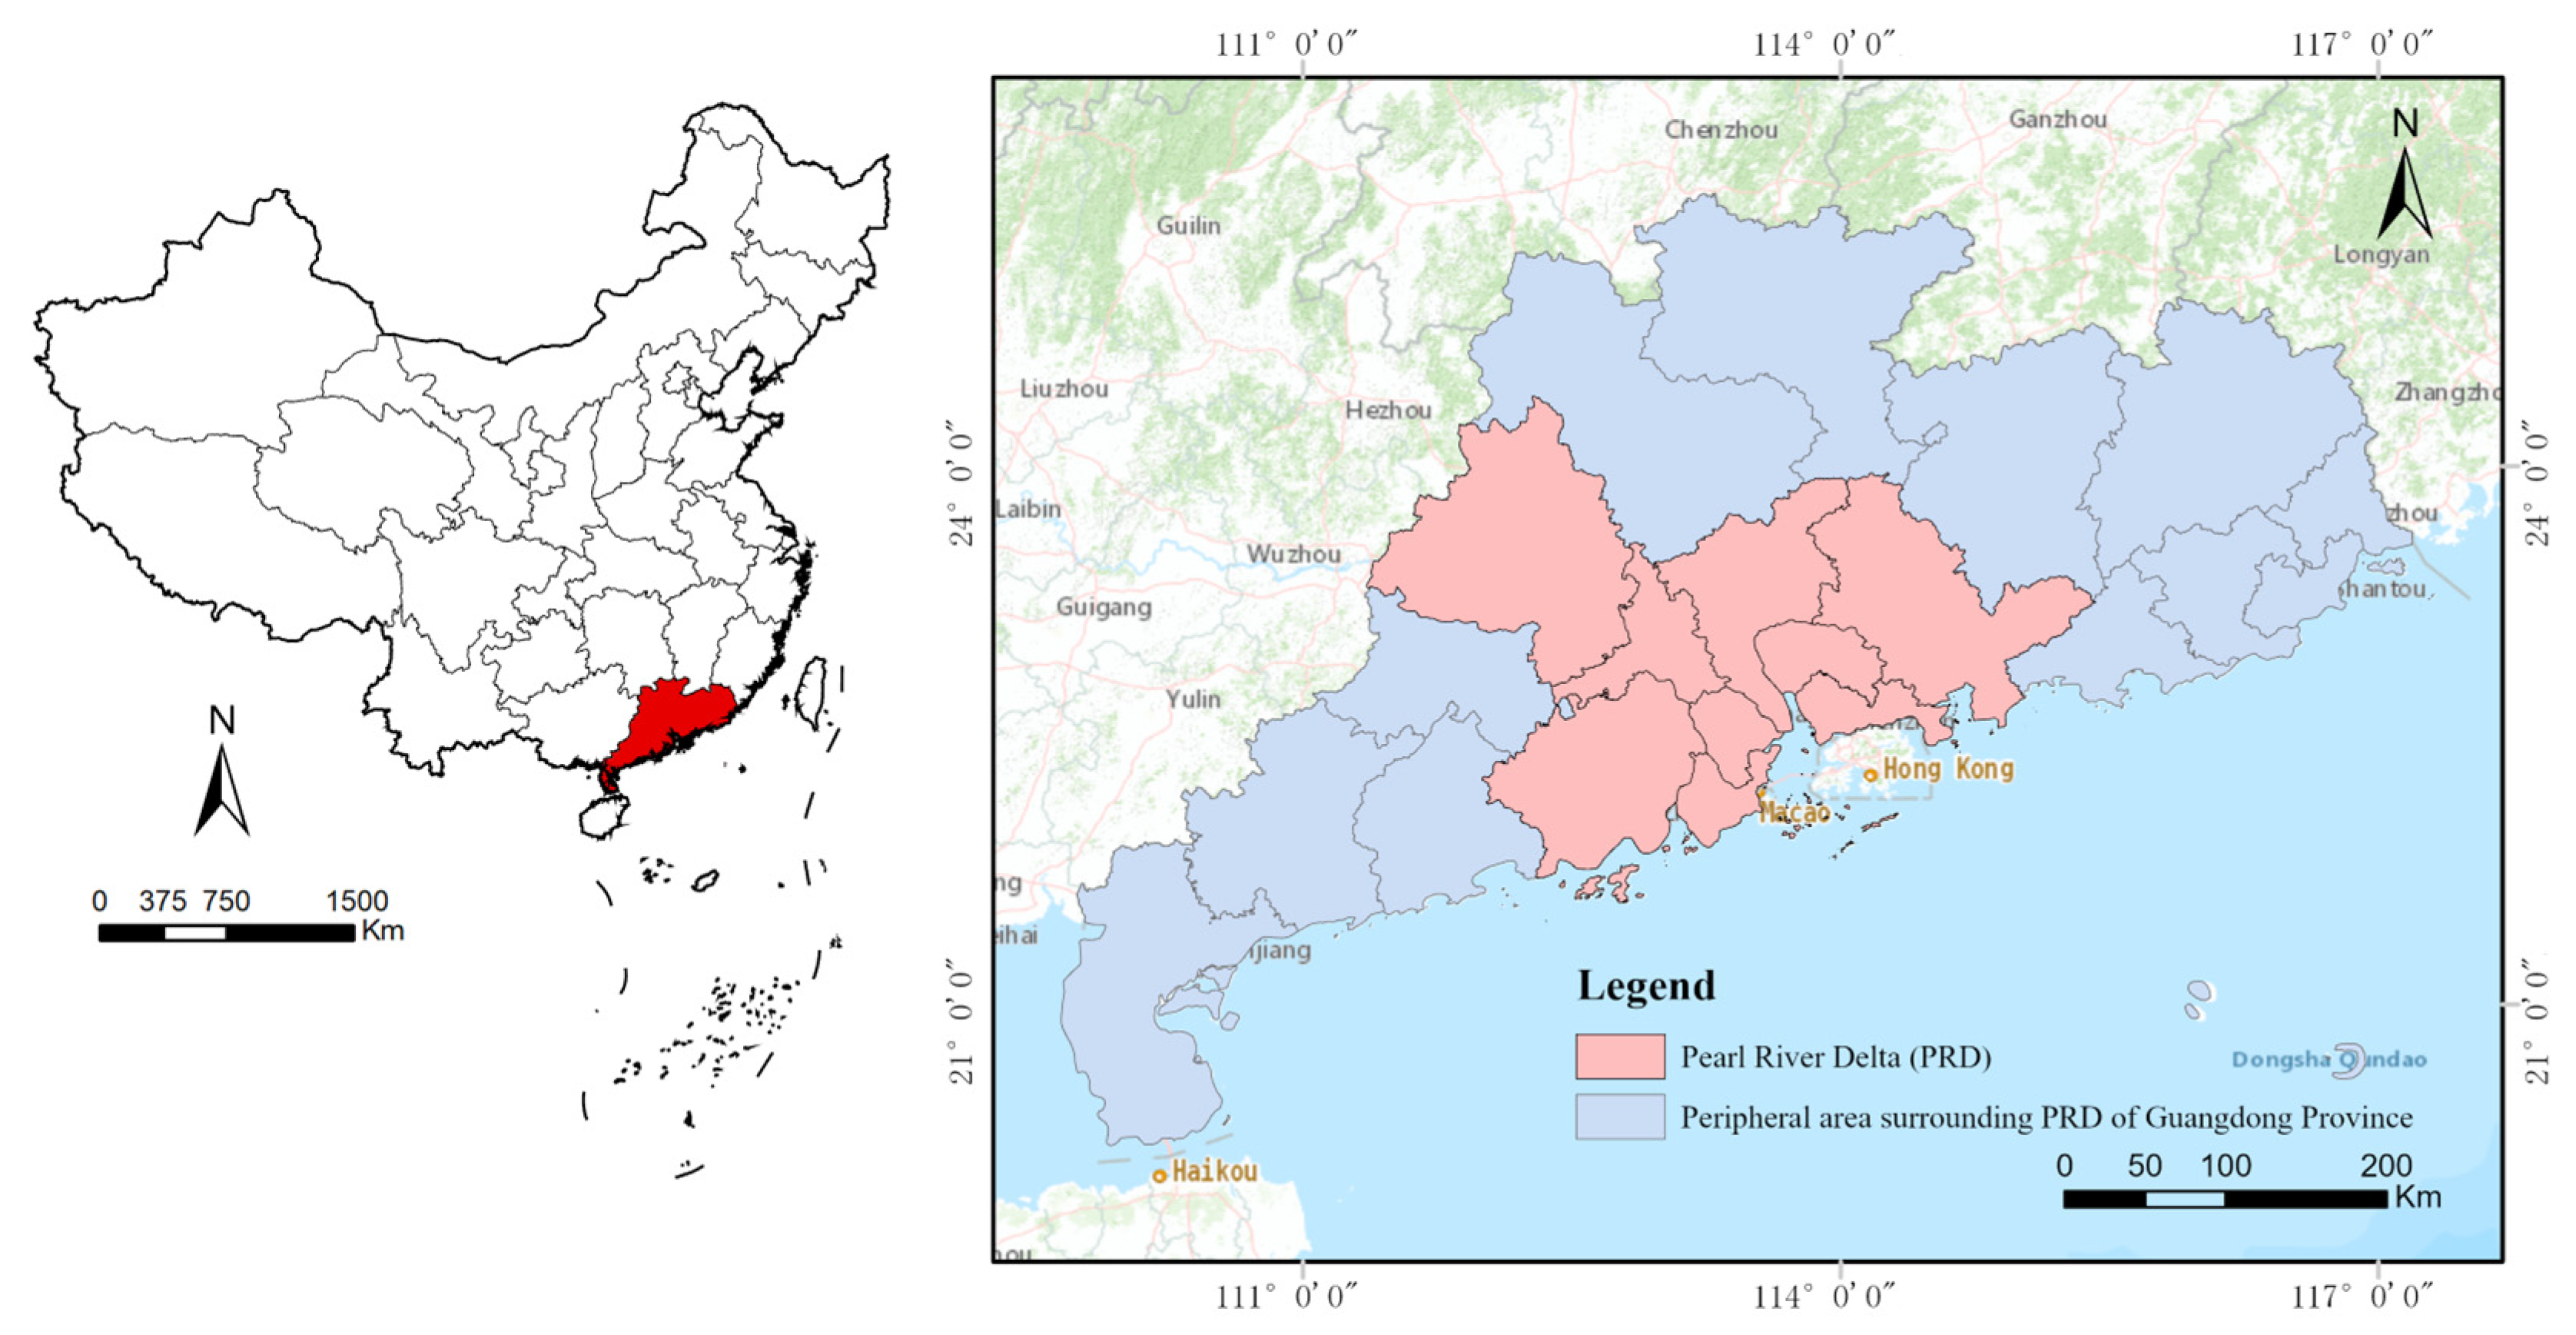
Overall, the current study has its clear limitations. Firstly, there are relatively few studies on the analysis of the spatiotemporal and structural characteristics of transportation land in China. Moreover, the few existing studies use national-scale sample data, and there is a lack of research on provincial-scale transportation land. Secondly, scholars often analyze construction land as a whole in relation to the population, with limited research on the specific types of construction land and their relationship with population size. Based on the aforementioned considerations, this study takes Guangdong Province as a case study to analyze the dynamic relationship between transportation land and the population, aiming to unveil the equilibrium predicaments faced during the process of regional development in China. Guangdong, situated in the southern part of the Chinese Mainland, is one of the most economically developed provinces in China, with an urbanization rate reaching 74.79%. However, Guangdong is also one of the most unequally developed provinces in China, with significant disparities on the population and economic scale across regions within the province, and it presents an evident “center-periphery” structure (Pearl River Delta vs. peripheral areas surrounding the Pearl River Delta). The most economically developed center of Guangdong is the nine-city cluster of the Pearl River Delta, which includes Guangzhou, Foshan, Zhaoqing, Shenzhen, Dongguan, Huizhou, Zhuhai, Zhongshan, and Jiangmen. In 2023, the PRD economy surpassed CNY 11 trillion, accounting for 81% of the province’s GDP. Regionally balanced development has been a persistent policy direction for the Guangdong Provincial Government, which has also invested heavily in transportation infrastructure in recent years in pursuit of balanced development and to narrow the gap between the center and the periphery [26]. Therefore, it is imperative to focus on Guangdong Province as a case study to conduct specialized research on the regional balance issues faced by China’s most developed provinces and to assess the relationship between changes in transportation land and population structure. This study attempts to answer the following two questions: (1) What is the spatiotemporal pattern of transportation land use in Guangdong province, China, from 2010 onwards, and what are its characteristics? (2) What is the relationship between transportation land and population growth in Guangdong province from 2010 onwards? Are there features of mismatch between population and transportation land?

2. Study Area and Data

2.1. Study Area

Guangdong Province stands as the vanguard of China’s reform and opening up, maintaining the top spot in the country’s provincial economic aggregate for 33 consecutive years. However, due to the cumulative effects of various factors such as geographical location, resource endowments, policy systems, humanities and history, Guangdong’s regional development exhibits a pronounced gradient and uneven characteristics. The province is characterized by a distinct “center-periphery” structure, with the Pearl River Delta (PRD) serving as the core region and the eastern, western, and northern mountainous areas forming the periphery (Figure 1). The PRD is the region with the most industrialized and best development environment in the province, and it is also one of the most economically advanced areas in the nation. The PRD is also among the most densely populated regions in China [27]. The PRD has attracted a diverse population from across the country, with the peripheral area surrounding the PRD of Guangdong Province (Ps-PRD) being one of the regions with the most significant population loss. Population resources and productivity development levels in Ps-PRD are reasonable, and compared to the PRD, they fall behind in terms of economic development, resource conditions, cultural technology, and infrastructure [28].
The subject of this study encompasses 121 administrative units at the district (county) level and above in Guangdong Province. (As Dongguan and Zhongshan cities do not have county-level administrative divisions and directly govern township-level administrative units, they are studied as a single unit.) This study primarily focuses on land use and population data from 2010, 2015, and 2020, creating two comparative periods: 2010–2015 and 2015–2020. The land data used in this study are derived from land resource surveys published by the Guangdong Provincial Department of Natural Resources. The socio-economic data primarily come from statistical yearbooks of various cities in Guangdong Province.

2.2. Methodology

This paper employs a decoupling model and the exploratory spatial data analysis (ESDA) method for the correlation analysis of transportation land and population economics. Specifically, the ESDA method is utilized to analyze the spatial heterogeneity of transportation land growth and population changes in Guangdong Province at a holistic level. The decoupling model is employed to analyze the coupling relationship between the expansion of transportation land and population growth, thereby assessing the coordination between the two.

2.2.1. Decoupling Model

Decoupling analysis is commonly employed in research related to economics, land, transportation, resource depletion, environmental stress, and other domains [29]. The OECD categorizes decoupling degrees into two scenarios: relative decoupling and absolute decoupling [30]. Within this framework, absolute decoupling refers to the phenomenon where environmental variables remain stable or decline concurrently with economic development, while relative decoupling is defined as a situation where both the rate of economic growth and the rate of change in environmental variables are positive, but the rate of change in environmental variables is less than that of economic growth. In contrast to the OECD decoupling approach, which lacks stability due to its reliance on a fixed base period, the Tapio decoupling model is flexible and resilient, providing a reasonable position for different combinations of resource and environmental change and population growth. The focus of Tapio’s decoupling model research is primarily on resources and the environment [31], such as energy consumption [32] and the circular economy domain [33], with a focus on empirical analyses of asynchronous changes between these factors. Notably, the Tapio decoupling model has greater applicability in exploring land use changes and their associated influencing factors [34]. Therefore, this study adopts the Tapio decoupling model.
The objective of this study is to investigate the relationship between the growth of transportation land and demographic changes, employing the decoupling model’s elasticity coefficients to analyze the extent of their coupled decoupling. This study utilizes the rates of change in transportation land L i and population P i , along with the elasticity coefficients α i , to construct the decoupling model between the transportation land and population.
L i = D t , i D 1 , i D 1 , i × 100 %
P i = P t , i P 1 , i P 1 , i × 100 %
α i = L i P i = D t , i D 1 , i / D 1 , i P t , i P 1 , i / P 1 , i
Based on Tapio’s decoupling model, the relationship between the growth of transportation land and population changes can be categorized into negative decoupling, decoupling, and coupling types [35]. In practical applications, to avoid over-significantly interpreting minor changes in the variables, the elasticity coefficient is typically considered as coupling when it varies within a range of 20% around the value of 1.0, i.e., the decoupling index between 0.8 and 1.2 is classified as “coupling”. Additionally, the changes in the variables themselves may be positive or negative. Therefore, the coupling is further divided into growth coupling and recessive coupling. Based on the range of decoupling variables, decoupling is further categorized into three subtypes: weak decoupling, strong decoupling, and recessive decoupling. Similarly, negative decoupling is also divided into three subtypes: expansive negative decoupling, strong negative decoupling, and weak negative decoupling. For specific calculation and judgment criteria, see Table 1.

2.2.2. Exploratory Spatial Data Analysis

This paper employs exploratory spatial data analysis tools to investigate the spatial distribution patterns of transportation land and population size changes across different regions in Guangdong Province. By analyzing the correlation and degree of correlation between the observed values at a given location and those at neighboring locations, exploratory spatial data analysis methods explore the characteristics of spatial distribution. Using ArcGIS 10.2, this study employs the Getis-Ord Gi* statistics index method to conduct a spatial exploration of the hotspots and coldspots of per capita transportation land and the population for each administrative unit in Guangdong Province. The Getis-Ord Gi* statistics index method is also a form of local autocorrelation analysis. A positive correlation indicates that an object belongs to a high-value spatial cluster, or a hotspot, with higher values around it; when it is negatively correlated, it indicates a low-value spatial cluster, or a coldspot, with lower values around it [36]. The Getis-Ord Gi* statistics index method can effectively reveal the spatial distribution pattern of an object [37]. Based on ArcGIS 10.2, spatial visualization of the data is conducted to reveal the evolution trend of the spatial agglomeration distribution pattern of per capita transportation land and population in Guangdong Province, allowing for direct observation of the spatial evolution of the cold- and hotspots in terms of both types of agglomeration.

3. Results

3.1. Analysis of the Transportation Land Distribution Pattern

3.1.1. Overall Analysis

As shown in Figure 2. in 2010, Guangdong Province had a total transportation land area of 2787.05 km², which increased to 3394.19 km² by 2020. From 2010 to 2020, Guangdong Province’s transportation land, both in terms of total area and its proportion of all construction land, generally showed a trend of uniform growth. A peak was reached in 2018, with transportation land accounting for 16.7% of the construction land. After 2019, Guangdong Province’s transportation land growth significantly slowed down, followed by a slight rebound.
In 2010, among various types of transportation land, rural roads had the greatest consumption of land resources(Figure 3). However, over the subsequent decade, the proportion of rural roads in transportation land consistently decreased, with the land use decreasing from 1308.53 km2 in 2010 to 1007.29 km2 in 2020. In contrast, the growth rate of highway land was the fastest, surpassing that of rural roads and reaching 61% in 2020. The sizes of the railway land, airport, and port terminal land are relatively small.
Generally speaking, the scale of transportation land is related to the administrative jurisdiction area of each district and county. However, directly comparing the total amount of transportation land across districts and counties makes it difficult to summarize patterns. Therefore, this study calculates the per capita transportation land and the proportion of transportation land area in construction land use for each district and county in Guangdong Province, from both per capita and per-unit area perspectives (Figure 4). By comparing the spatial variation in per capita transportation land in each district and county in Guangdong Province, a “low in the center, high at the periphery” layered structure was observed overall during the period 2010–2020. The central region of the Pearl River Delta generally presents a high population density and a low per capita transportation land. The next is the peripheral area of the central region of the Pearl River Delta, which is within the median range. The area with the highest per capita transportation land is the marginal region around the Pearl River Delta, especially clustered in the northern and eastern Guangdong border areas. The distribution of transportation land proportion in the total regional area is contrary to per capita transportation land, exhibiting a “high in the center, low at the periphery” feature, meaning that the proportion of transportation land in the total area is high in the central region and low in the periphery. Additionally, the distribution of transportation land proportion in the total regional area also shows a characteristic of a high proportion in coastal areas and a low proportion in inland regions.

3.1.2. Characteristics of Transportation Land in the PRD and Peripheral PRD of Guangdong Province

In Guangdong Province, the structure of transportation land generally exhibits a “center-periphery” distribution pattern. To further investigate the characteristics of transportation land distribution in Guangdong Province, a comparative analysis is conducted between the transportation land in the PRD and the peripheral PRD of Guangdong Province.
Comparing the total transportation land and its proportion in the construction land of the peripheral PRD of Guangdong Province with the PRD (Figure 5), it was observed that the total transportation land in the peripheral PRD of Guangdong Province surpassed that of the PRD during 2010–2020, with an increasing gap year by year. The transportation land in the PRD experienced a slower increase than that in the peripheral area over these 10 years. Concurrently, the proportion of transportation land in the peripheral PRD of Guangdong Province consistently exceeded that of the PRD. This is primarily related to the Guangdong Provincial Government’s policy in recent years to achieve balanced regional development by refining the province’s transportation network. The Guangdong Provincial Government has continuously invested substantial funds in infrastructure construction in the underdeveloped peripheral PRD of Guangdong Province.
Comparing the structural changes in the transportation land of the PRD and the peripheral PRD of Guangdong Province, it can be observed that the PRD has consistently been dominated by road land use from 2010 to 2020. The early rural road land use in the peripheral PRD of Guangdong Province accounted for a significant proportion. Over the 10-year period, the amount of road land use increased significantly, surpassing the rural road land use by 2020. Additionally, the PRD and the peripheral PRD of Guangdong Province exhibit a similar trend of evolution, with rapid growth in road land use, particularly in the peripheral PRD of Guangdong Province during the period 2015–2020, while the area of rural road land use has slowly decreased. This also confirms the statement mentioned earlier that Guangdong Province has carried out significant investment and development in transportation infrastructure in the peripheral PRD of Guangdong Province in recent years.

3.2. Analysis of the Relationship between Population Growth and Transportation Land in Guangdong Province

3.2.1. Relationship between Per Capita Transportation Land and Population Hotspots

This study further investigates the relationship between the population and transportation land. We employed the Getis-Ord Gi* index to analyze the spatial agglomeration characteristics and spatiotemporal differences in per capita transportation land and population.
The results indicate that, between 2010 and 2020, there was a minimal overall change in the per capita transportation land and population hotspot distribution pattern in Guangdong Province. The hotspots of per capita transportation land were concentrated in Shaoguan City and its surroundings in the northern region of Guangdong, with later expansion to include the regions of Meizhou City and Lianzhou City. The coldspots of per capita transportation land were primarily concentrated in the PRD and Chaozhou City in the eastern region of Guangdong. The coldspots in the PRD showed a trend of increasing annually, while those in the western region of Guangdong decreased year by year. The population hotspots were consistently concentrated in the Pearl River Delta region.
The results of the hotspot analysis indicate that there is a significant spatial disparity between the per capita transportation land hotspots and population distribution hotspots in Guangdong Province, exhibiting a certain degree of mismatch characteristics. Specifically, regions with high per capita transportation land are peripheral areas with small population sizes, particularly in the northern region of Guangdong where per capita transportation land far exceeds that of the surrounding areas. This may be related to two factors: Firstly, as the Pearl River Delta is located in the southern part of the Chinese Mainland, most of the external transportation routes require passage through the northern region, thereby accounting for a significant proportion of transportation land. Figure 6 shows that the hotspots of per capita transportation land are all located where the Beijing–Guangzhou and Beijing–Kowloon railways pass through, which run in the south–north direction. Secondly, the northern region of Guangdong has more mountainous terrain, with less developed economies and fewer overall inhabitants, resulting in the highest per capita transportation land in this area. The coldspots of per capita transportation land are primarily seen in the PRD, which is the most economically developed region in Guangdong Province but is densely populated, making it a coldspot for per capita transportation land.

3.2.2. Spatial Pattern of Decoupling Relationship

To further investigate the relationship between transportation land and population changes in Guangdong Province, we employ a decoupling model. This model analyzes the degree of decoupling between changes in transportation land and population size. Figure 7 presents the spatial patterns of decoupling relationships for the periods 2010–2015 and 2015–2020. Overall, the relationship between population growth and transportation land is diverse, with predominantly opposite changes and some parallel changes. The opposite changes are primarily characterized by a decrease in people and an increase in transportation land, while the parallel changes are primarily characterized by a parallel increase in both people and transportation land. From 2010 to 2015, the relationship between population growth and transportation land exhibited a layered pattern. The northern Guangdong region, the Leizhou Peninsula in western Guangdong, and the Chaoshan region in eastern Guangdong exhibited a strongly negative decoupling state with a decrease in people and an increase in transportation land. In the peripheral areas of the Pearl River Delta, both transportation land and population increased, but the rate of increase for transportation land was relatively faster. The PRD, on the other hand, showed a parallel increase in both people and transportation land, or a faster population increase than transportation land, indicating a relatively similar relationship between population growth and transportation land.
From 2015 to 2020, Guangdong Province experienced a diverse relationship pattern between population growth and transportation land, with increasing regional imbalances. The coupling relationship between the transportation land and population exhibited significant negative decoupling, which accounted for the largest portion and had intensified over time, increasing from 21.4% to 32.2%, leading to an increase in regions with mismatches in the relationship between population growth and transportation land. In the northern region of Guangdong, the decrease in land for transportation was somewhat mitigated, while it became more pronounced in the eastern region. This phenomenon may be associated with Guangdong’s recent focus on developing east–west transportation and increasing infrastructure construction in the eastern region. There was a notable shift in the coupling relationship of the PRD (Pearl River Delta) region, where many areas experienced population growth but a decrease in transportation land. Combined with the previously observed significant reduction in rural road land use in the PRD, the cause of this population-growth-related decrease in transportation land may be related to the further acceleration of urbanization in the PRD. Notably, during the period 2010–2015, regions with negative expansion decoupling and weak decoupling accounted for the largest proportion, exceeding half of all regions; by 2015–2020, this had shifted to dominance by strong negative decoupling and negative expansion decoupling. This indicates that during the 2010–2015 period, most regions experienced relatively rapid growth in both population and transportation land, while during 2015–2020, the rate of transportation land growth remained unabated, while population growth decelerated.
The decoupling results, categorized by region, are presented in Figure 8. The decoupling patterns of the PRD (Pearl River Delta) region consistently indicate weak and expanding negative decoupling during the period 2010–2020. This suggests that the growth of transportation land in the PRD has been relatively well coordinated with population increase. The Ps-PRD region exhibited the highest number of counties with expanding negative decoupling from 2010 to 2015, followed by strong negative decoupling. In the period 2015–2020, the peripheral regions of the Pearl River Delta exhibited the highest number of counties with strong negative decoupling. The expansion of transportation land and the reduction in the population in the Ps-PRD region have been prominent issues, with a decoupling pattern observed between transportation land and population growth.
This study employs the ArcGIS 10.2 spatial analysis module to analyze the spatial heterogeneity of the decoupling relationship between transportation land and population growth in Guangdong Province, the Pearl River Delta (PRD), and the peripheral area surrounding the PRD of Guangdong Province in two stages. The Moran’s I values and their corresponding correlation values (Z values, p values) are presented in Table 2. The overall Moran’s I index for Guangdong Province in the two stages is 0.100 and 0.189, respectively, indicating a weak spatial autocorrelation in the decoupling relationship in both stages, which gradually strengthens over time. This analysis suggests that in the past decade, the decoupling relationship between transportation land and population growth in Guangdong Province shows a certain spatial positive correlation between urban units, indicating a certain degree of aggregation of the decoupling degree between transportation land use and population among district units, but, overall, it is not very obvious.
The Moran’s I index for the decoupling relationship in the Pearl River Delta (PRD) showed no spatial correlation during the period 2010–2015, with a p-value greater than 0.05. However, for the period 2015–2020, Moran’s I index was 0.199, indicating a weak spatial autocorrelation. The Moran’s I index for the peripheral area surrounding the PRD of Guangdong Province showed no spatial correlation in the two periods, with p-values greater than 0.05. Overall, the spatial clustering of the decoupling relationship at the regional level is weak. The degree of clustering of the decoupling relationship at the district level also reflects the convergence and divergence of the relationship between transportation land growth and population change in different regions. For example, the Pearl River Delta (PRD) has a high level of urbanization, high transportation accessibility and utilization rates, and rapid population growth. Therefore, the degree of decoupling is relatively similar, showing strong spatial clustering. In contrast, the peripheral area surrounding the PRD of Guangdong Province has a low and slow urbanization level, with cities mainly in individual forms, insufficiently close inter-city connections, and large differences in urban socio-economic development levels. Therefore, the spatial clustering characteristics of the decoupling relationship are not obvious. The spatial heterogeneity of the decoupling relationship at the regional level also reflects the differences in the transportation land and population change between urban agglomerations.

4. Discussion and Conclusions

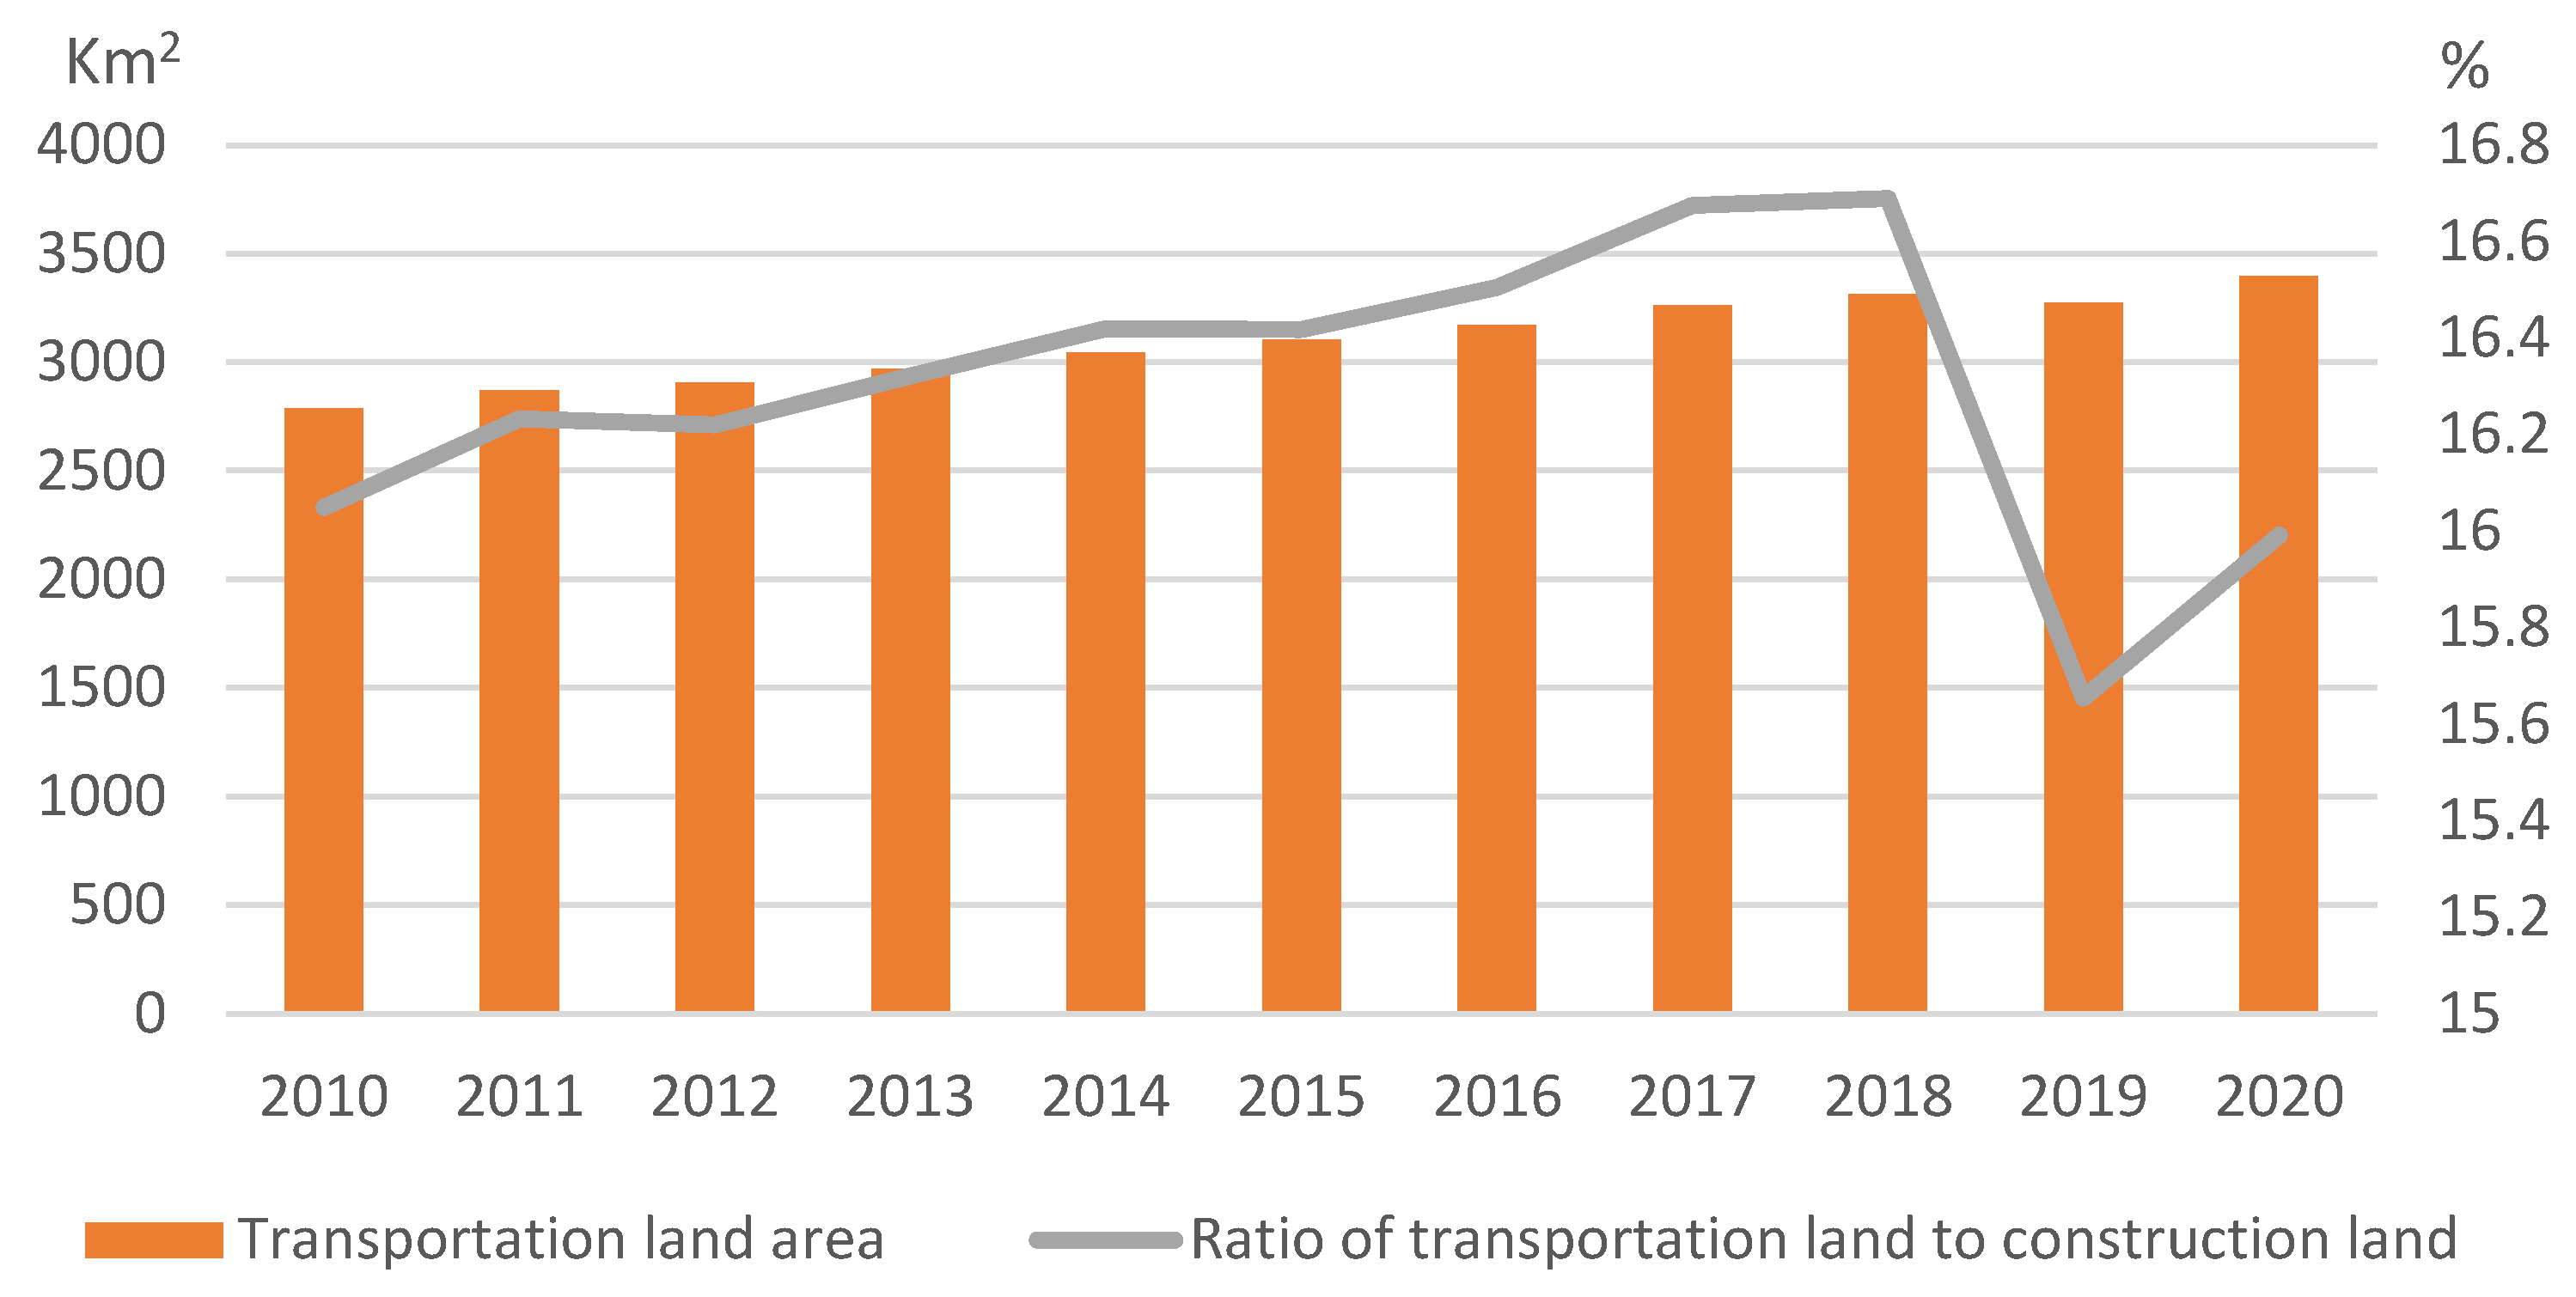
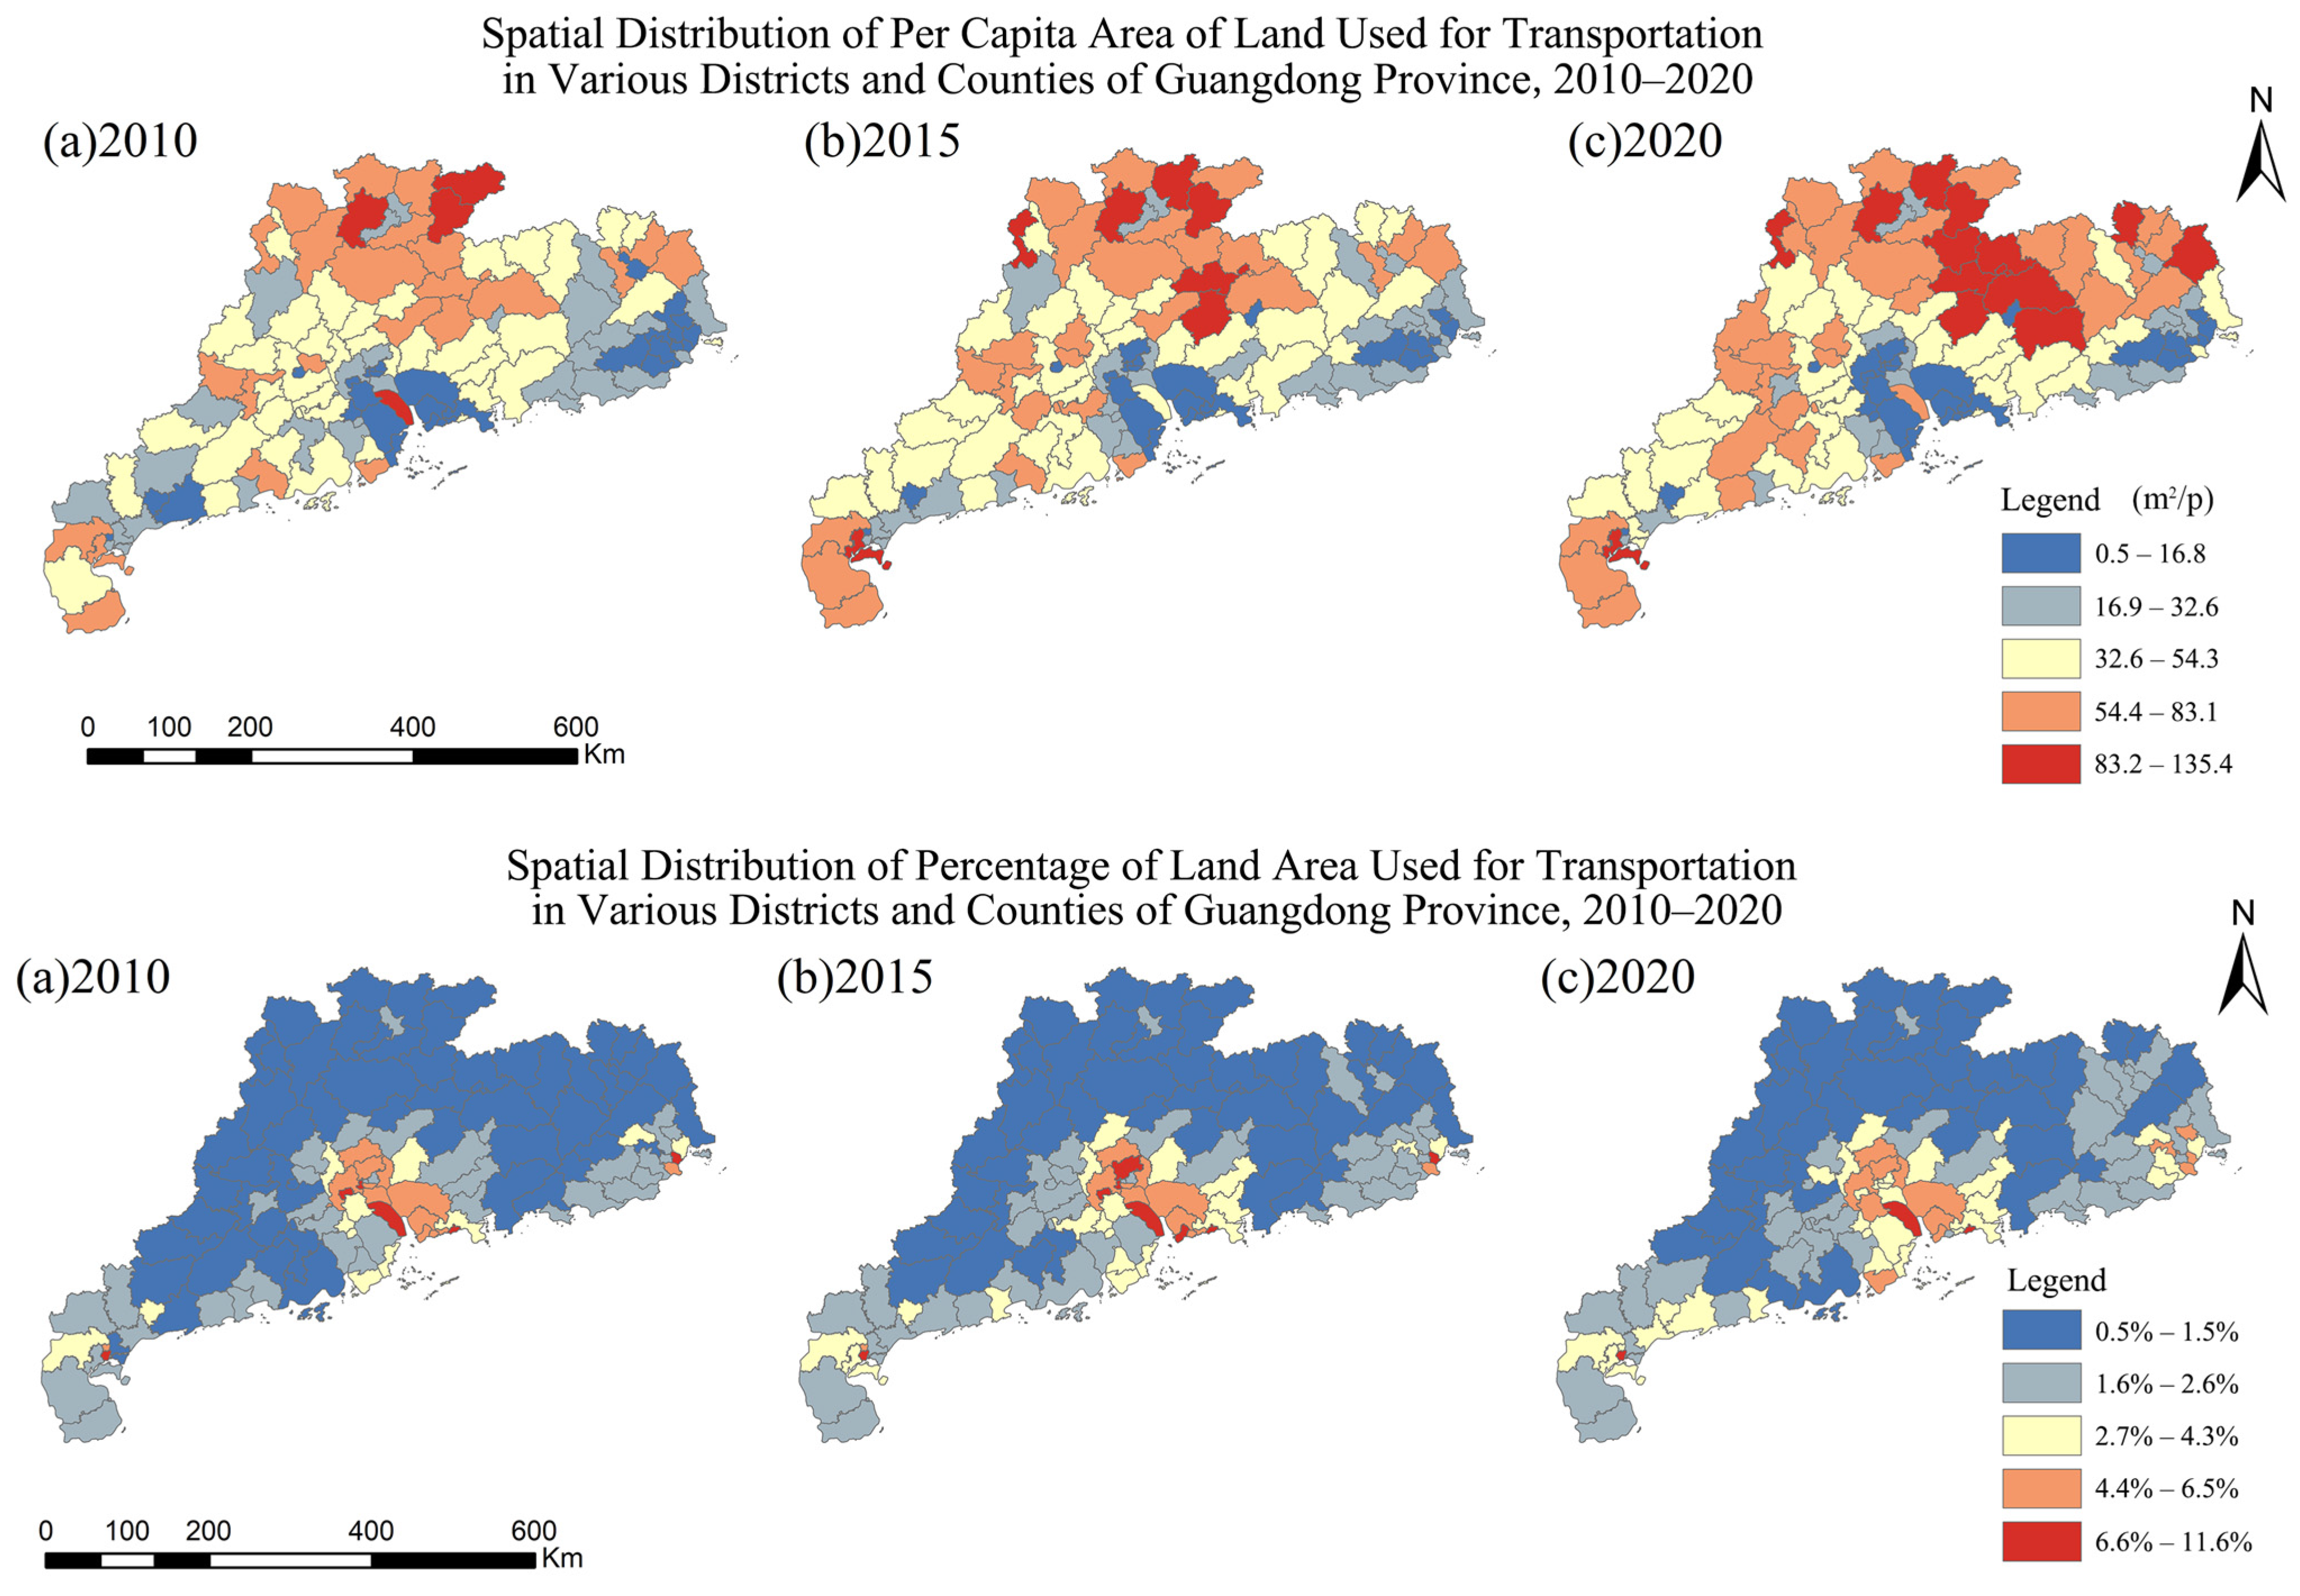
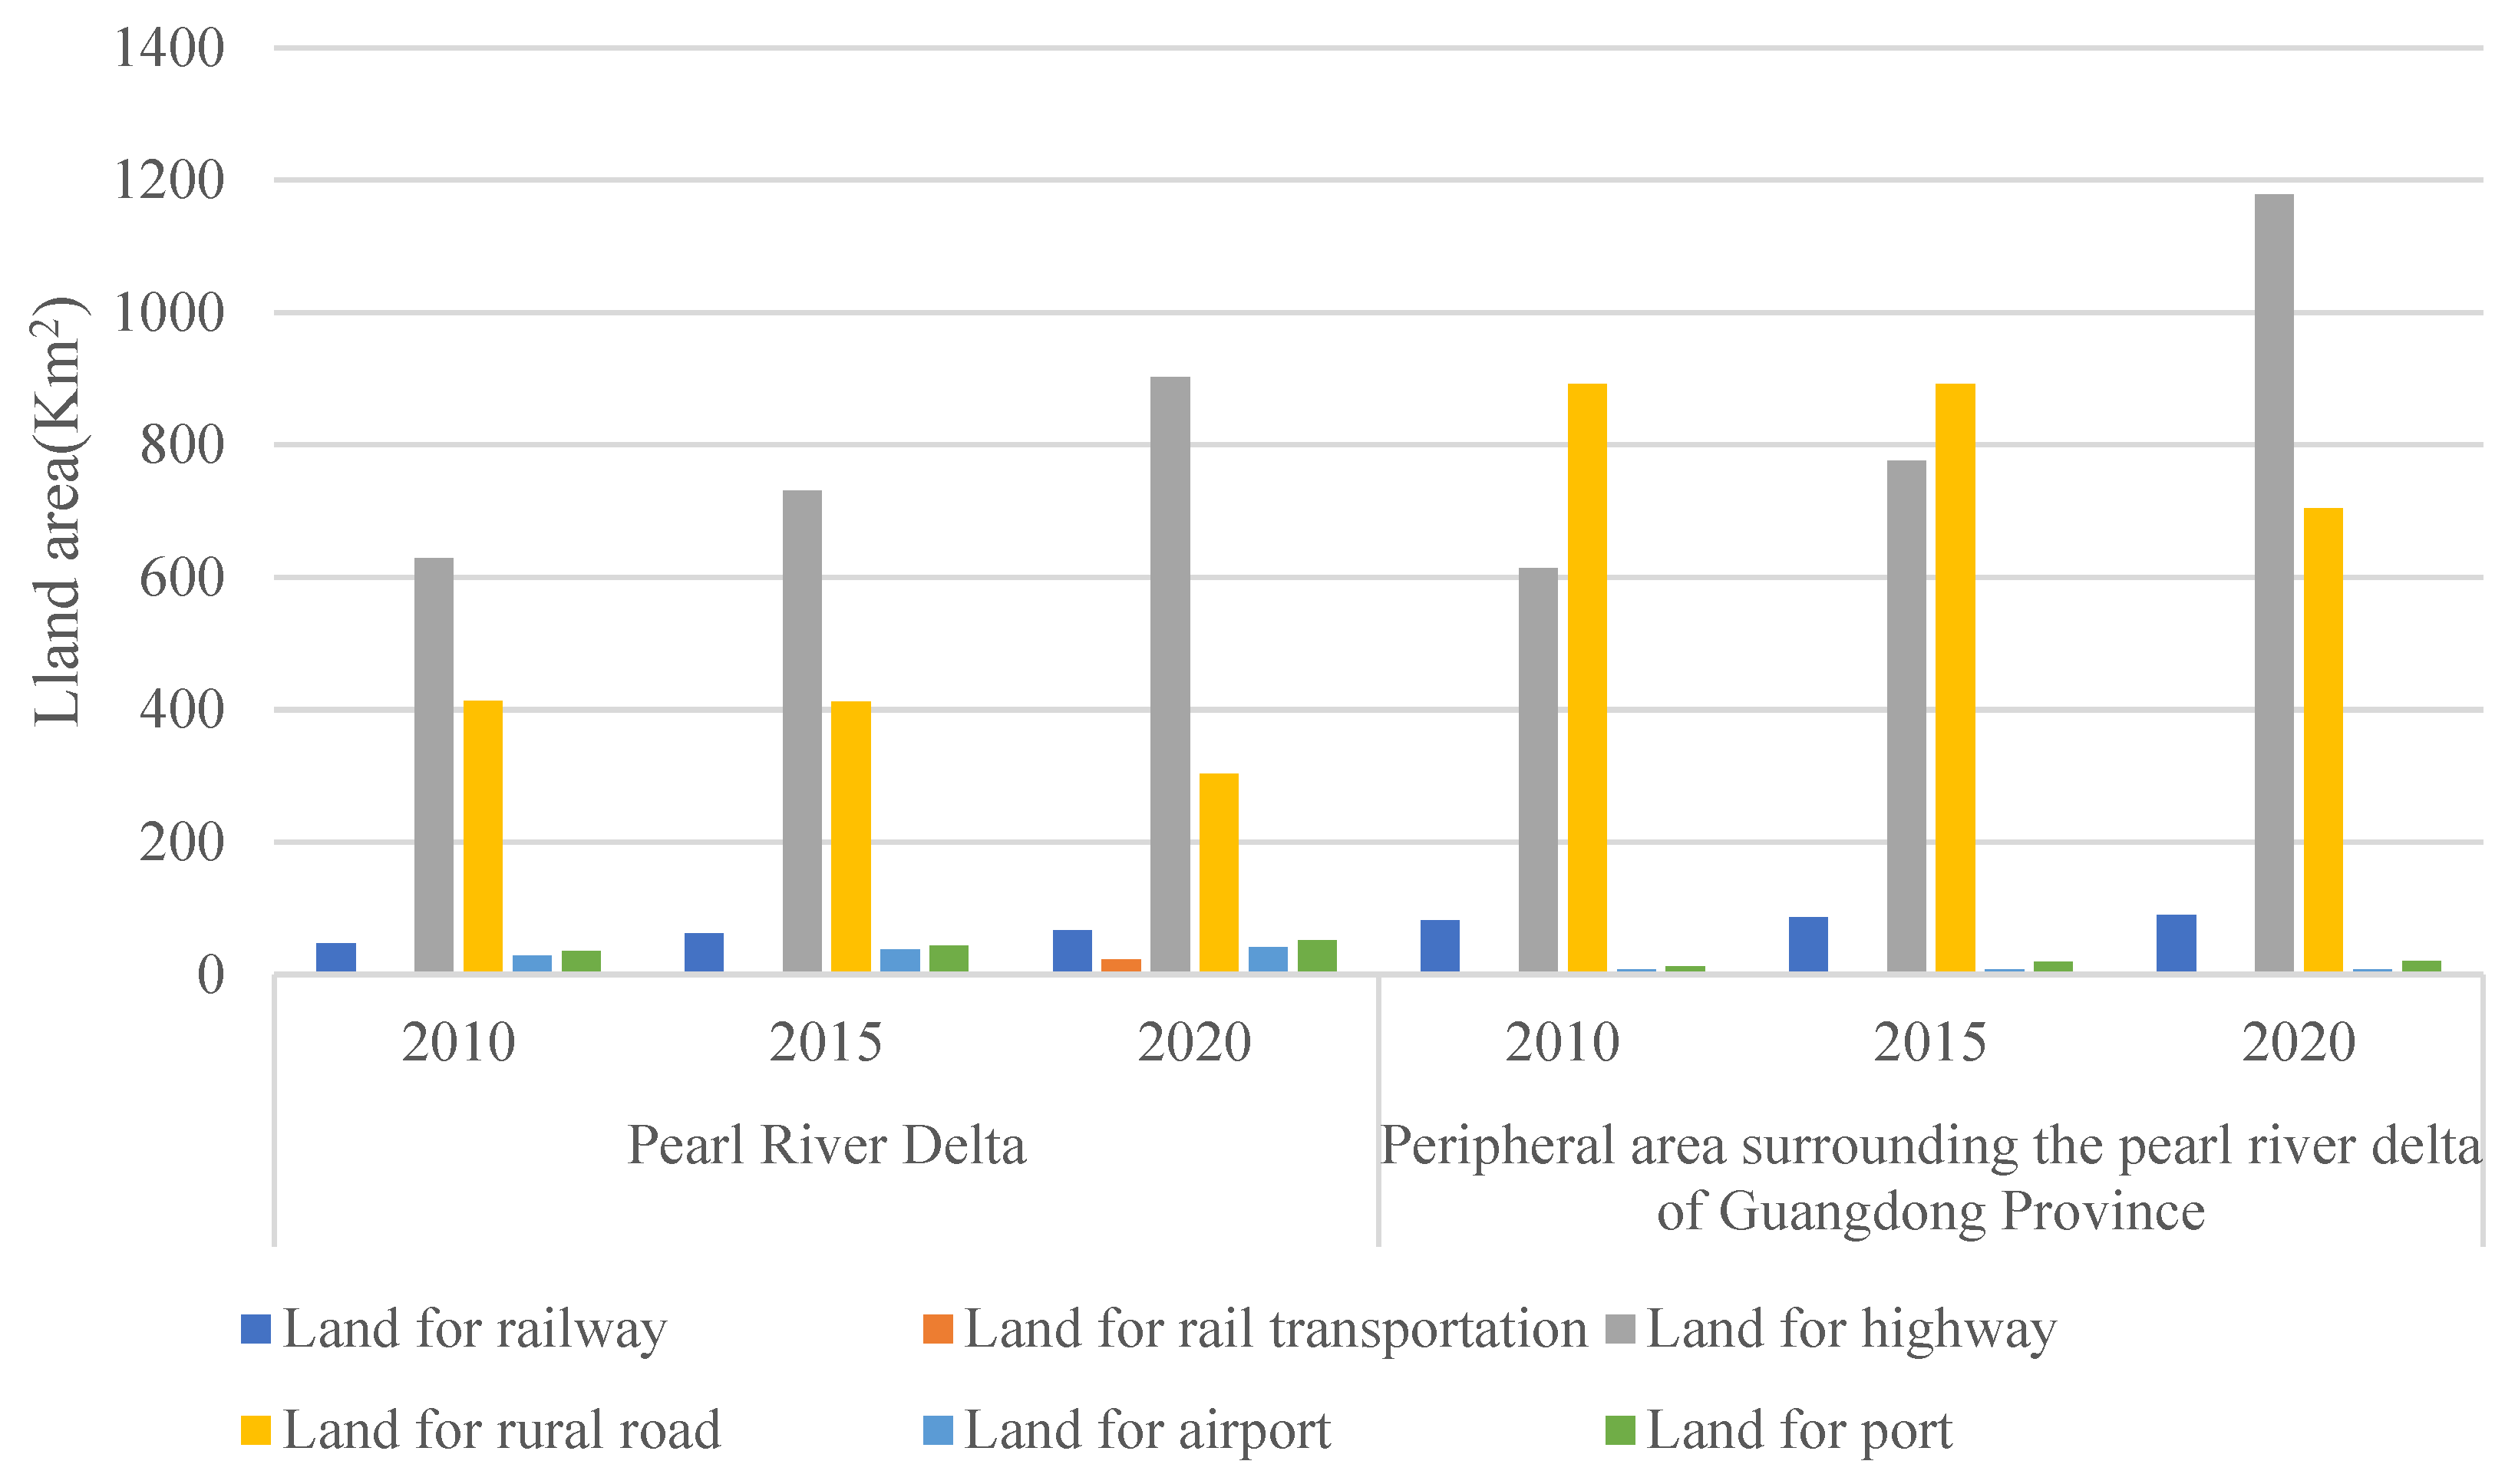
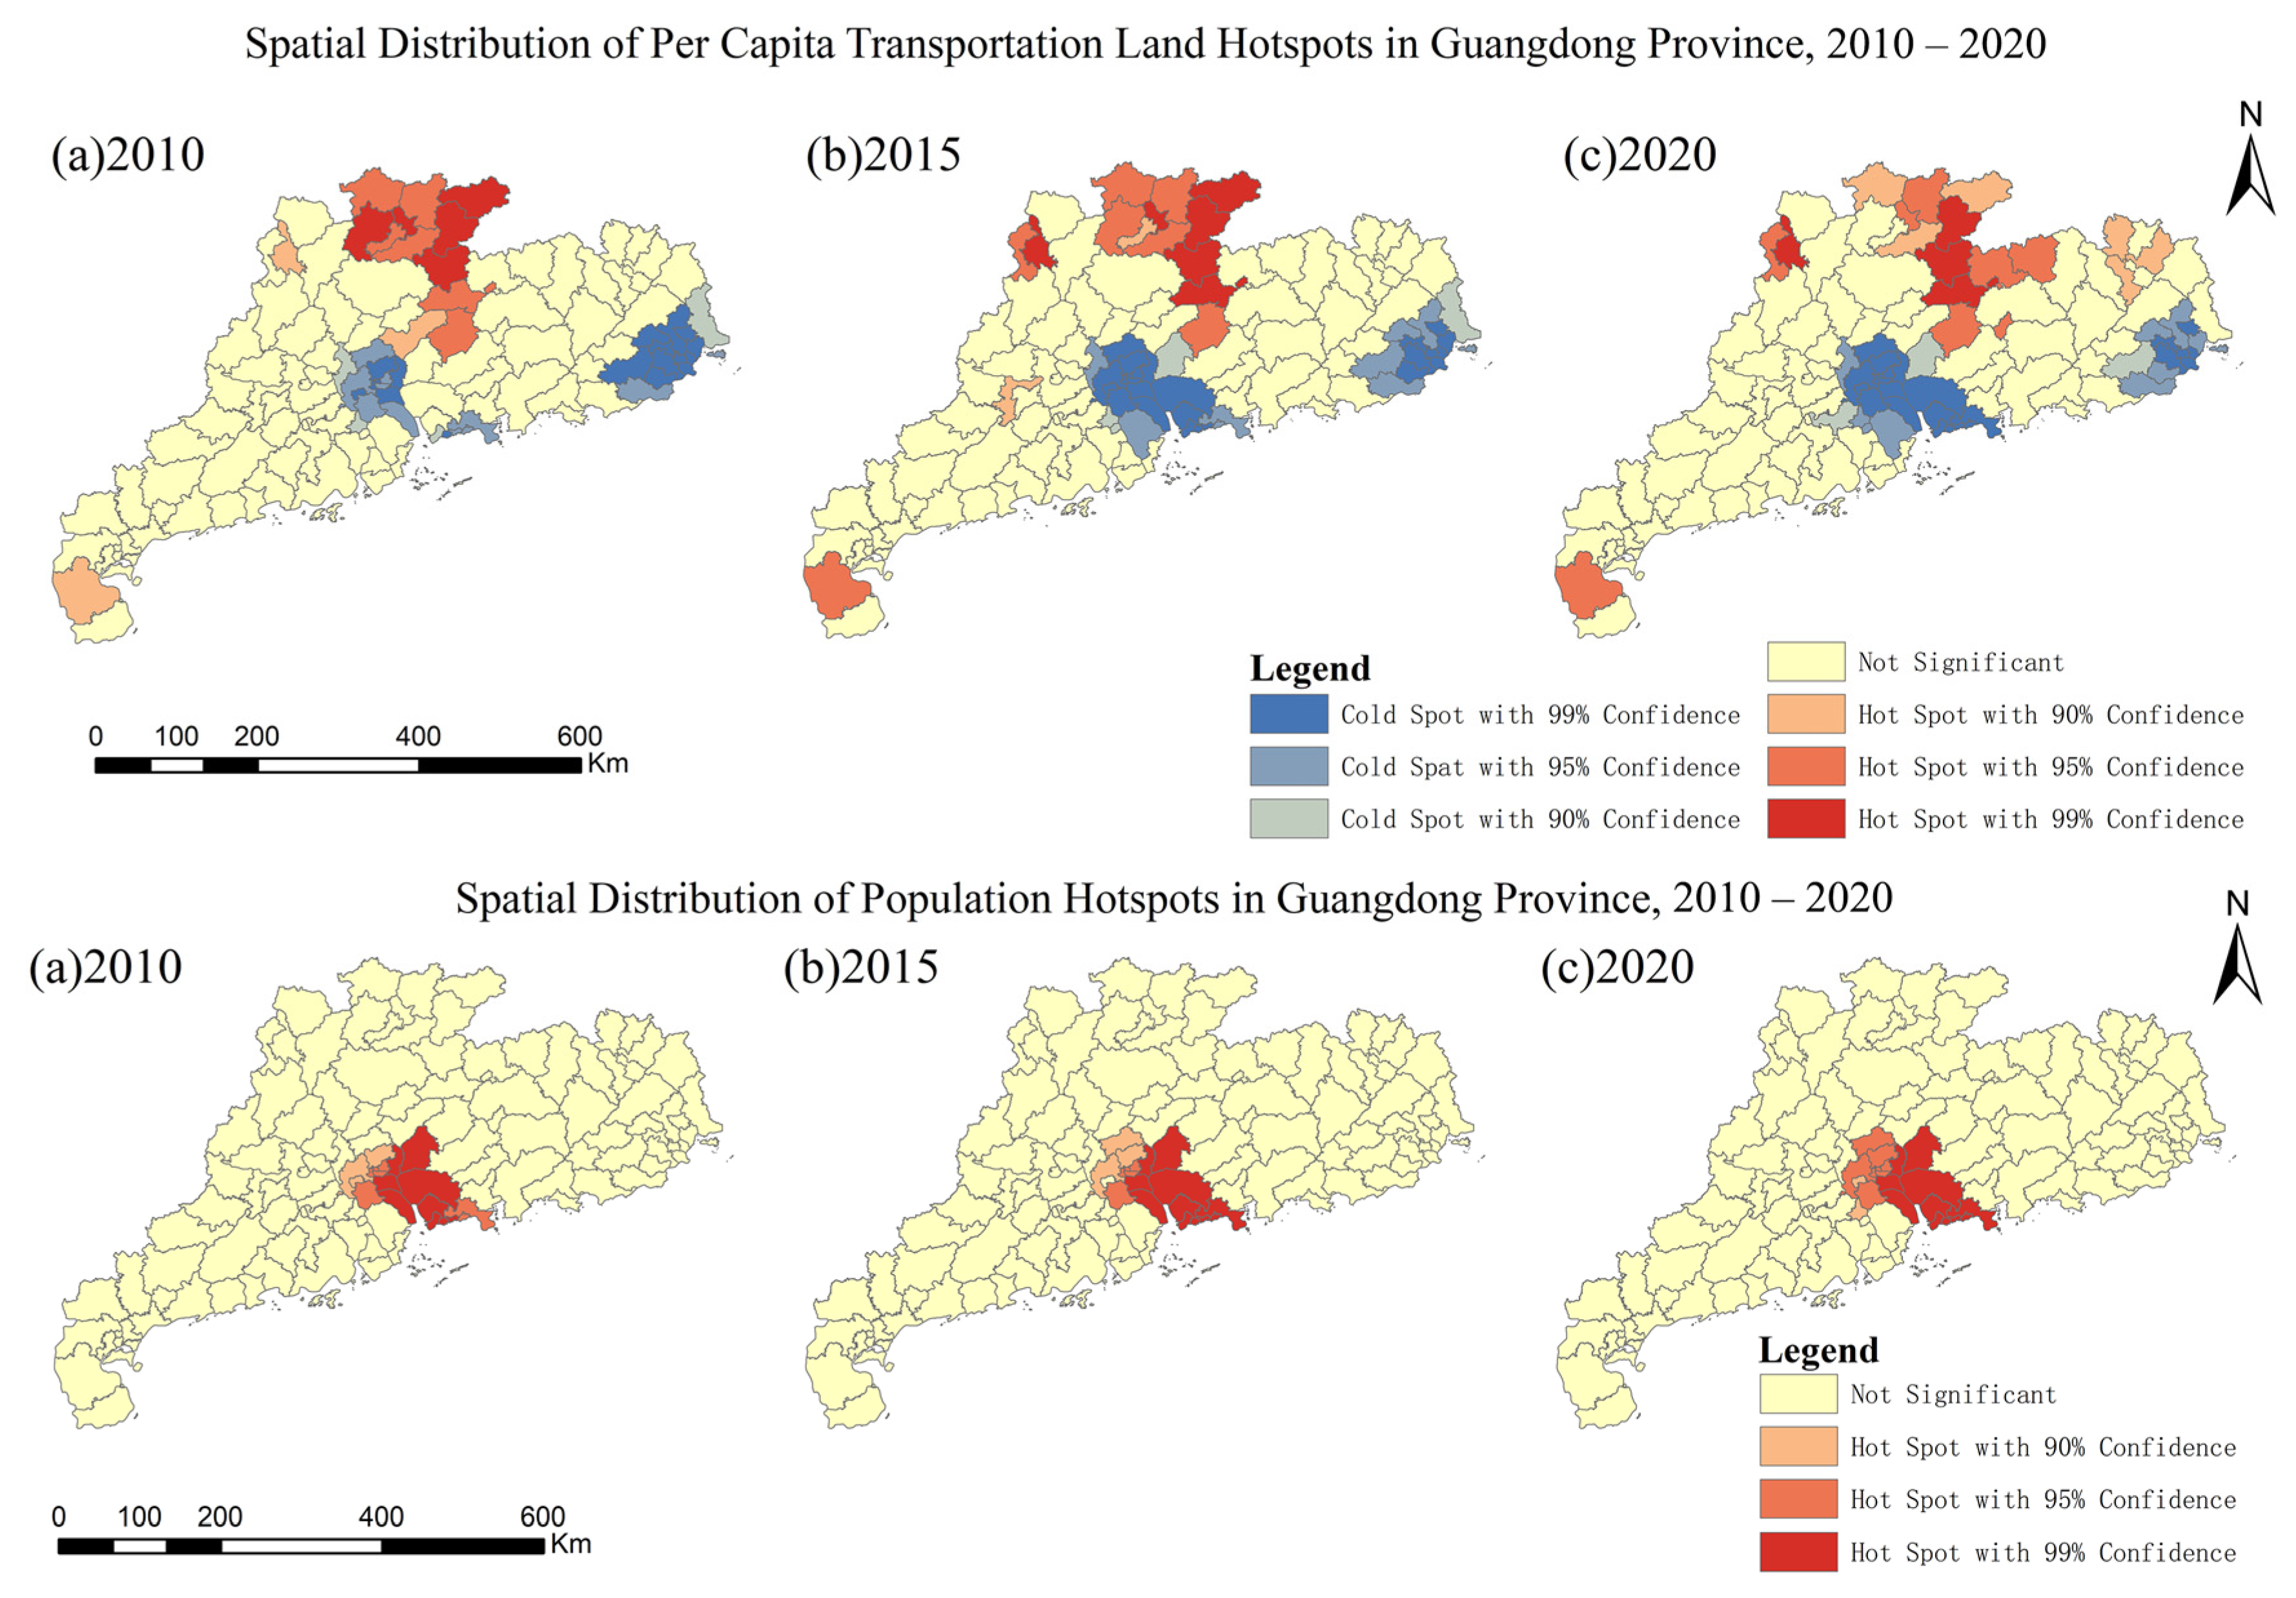
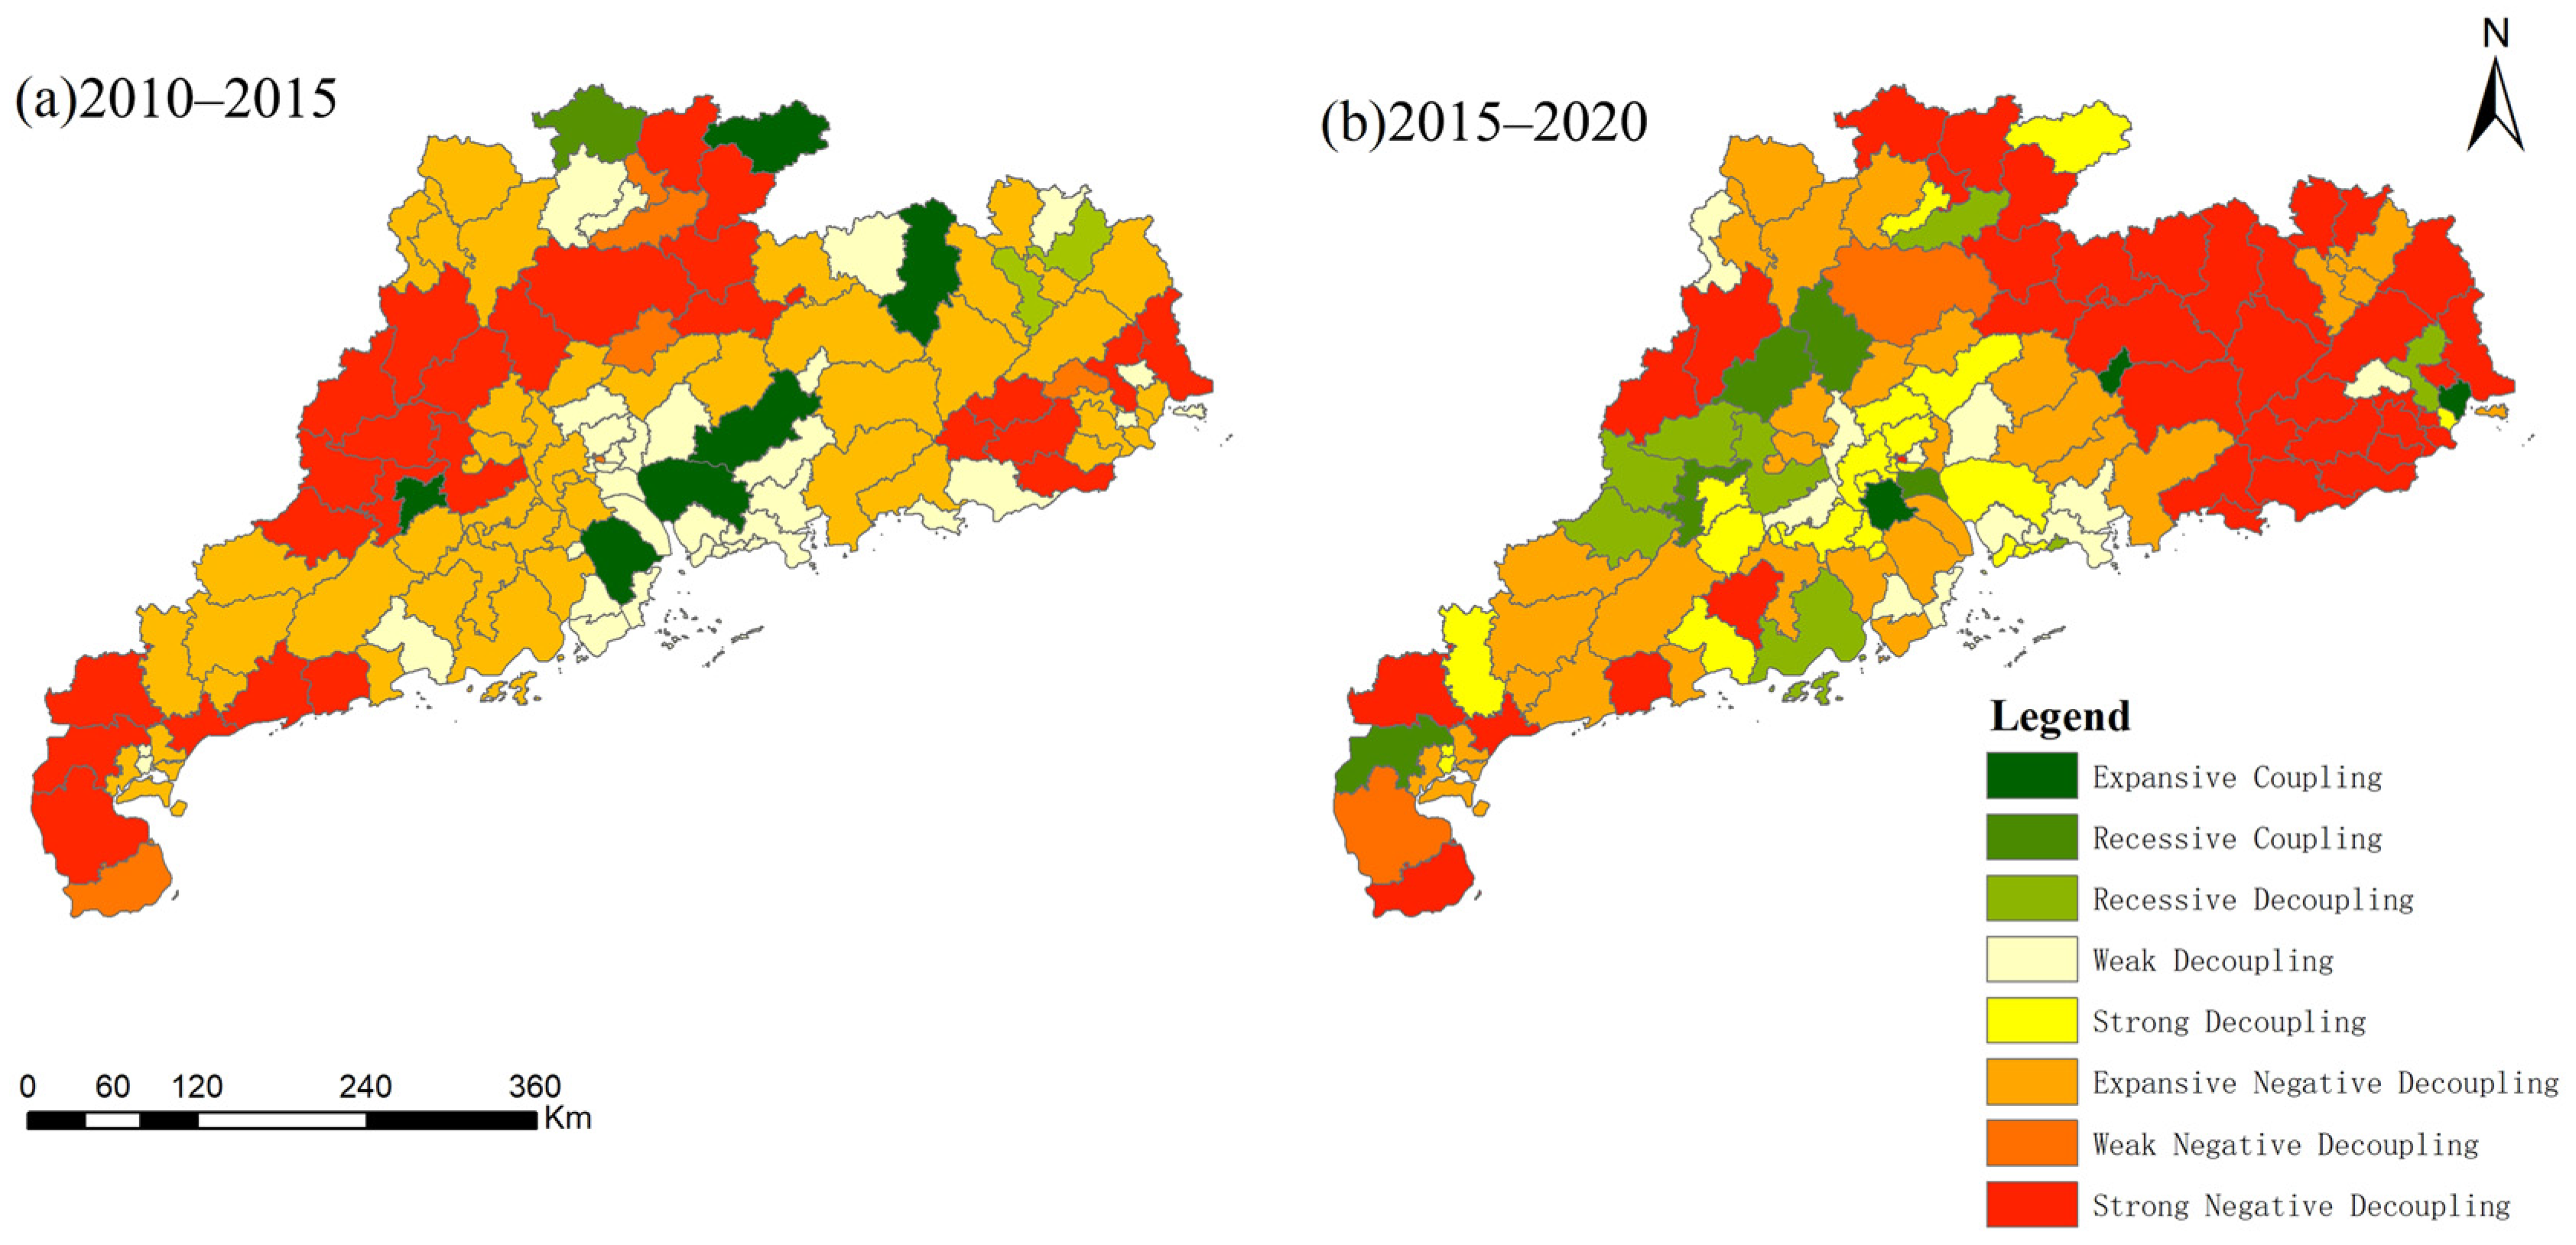
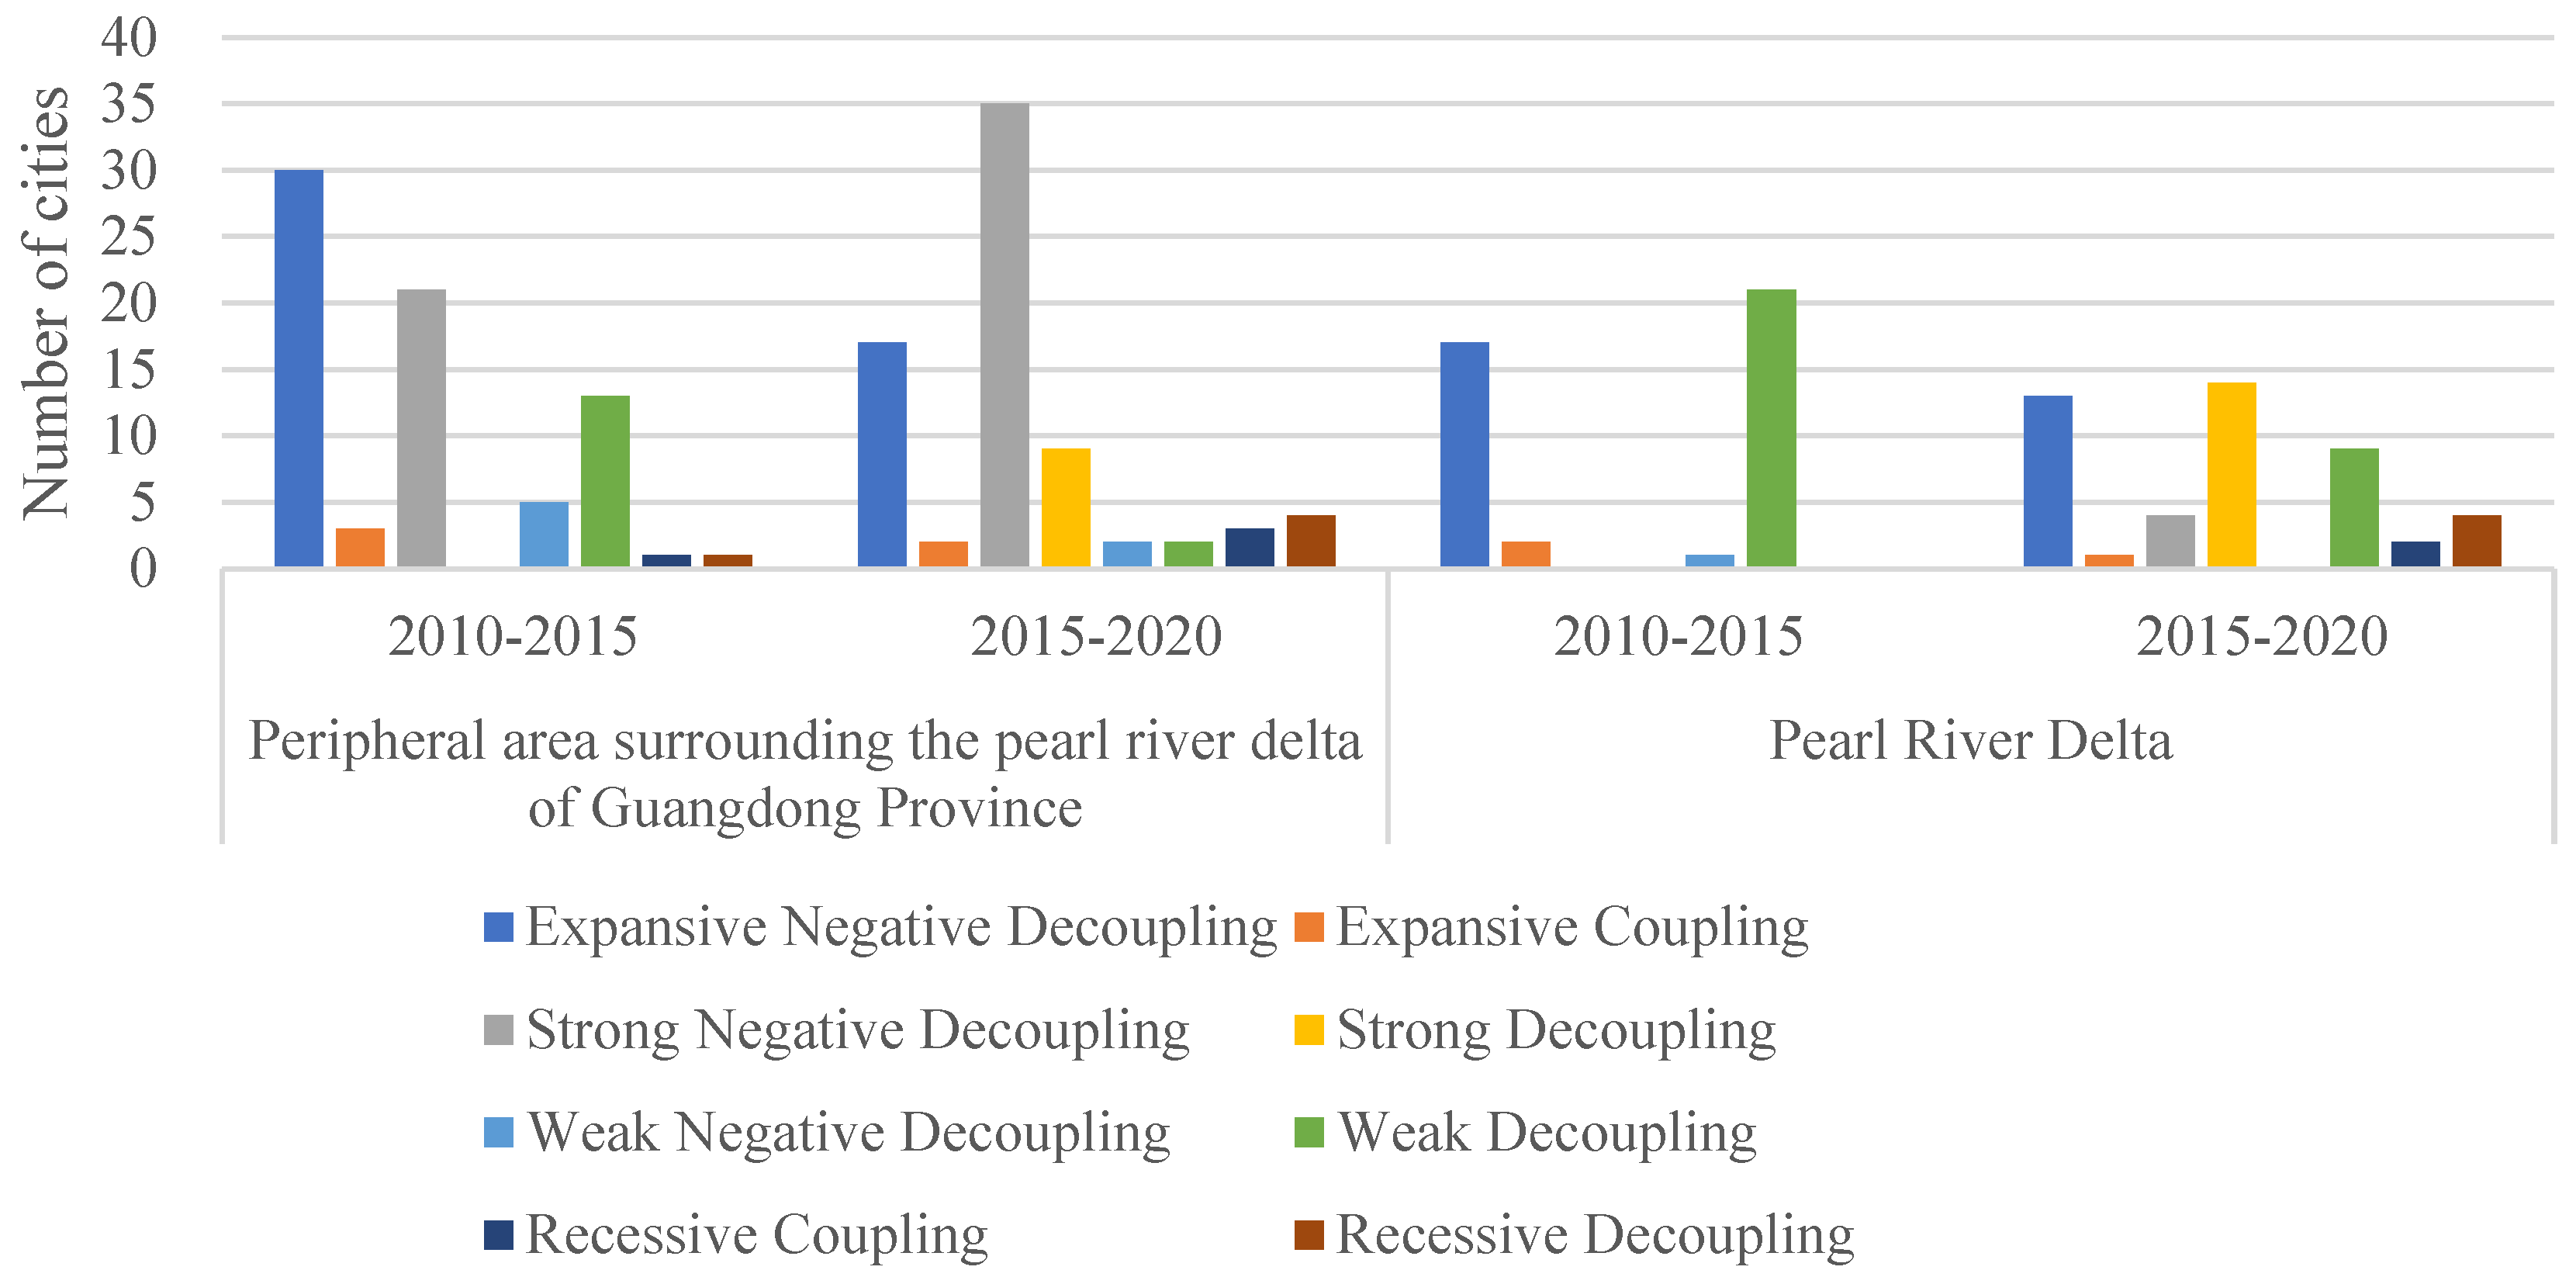
This study focuses on 121 counties (cities and districts) in Guangdong Province as the research area, analyzing the temporal and spatial changes and structural features of transportation land. This study employs exploratory spatial data analysis (ESDA) and decoupling models to explore the relationship between transportation land and population growth. The findings indicated the following: (1) From 2010 to 2020, the per capita transportation land in various districts and counties of Guangdong Province showed a hierarchical structure of “low center and high periphery”. Conversely, the proportion of transportation land to construction land displayed a “high center and low periphery” characteristic. (2) During the same period, the total amount of transportation land in the peripheral areas of the Pearl River Delta was higher than that in the PRD (the Pearl River Delta) and the gap widened each year. Meanwhile, the proportion of transportation land to construction land in the peripheral areas of the Pearl River Delta was consistently higher than that in the PRD. (3) There were significant spatial differences between the per capita transportation land hotspots and population distribution hotspots in Guangdong Province, exhibiting characteristics of a misalignment between human and transportation land. (4) According to the results of the Tapio decoupling model, from 2010 to 2015, the relationship between transportation land and population growth exhibited a layered pattern; from 2015 to 2020, the pattern of this relationship became more complex, with increased regional imbalances. The decoupling results for the PRD during 2010–2020 were dominated by weak decoupling and expansionary negative decoupling; for Ps-PRD, they were primarily strong negative decoupling and expansionary negative decoupling.
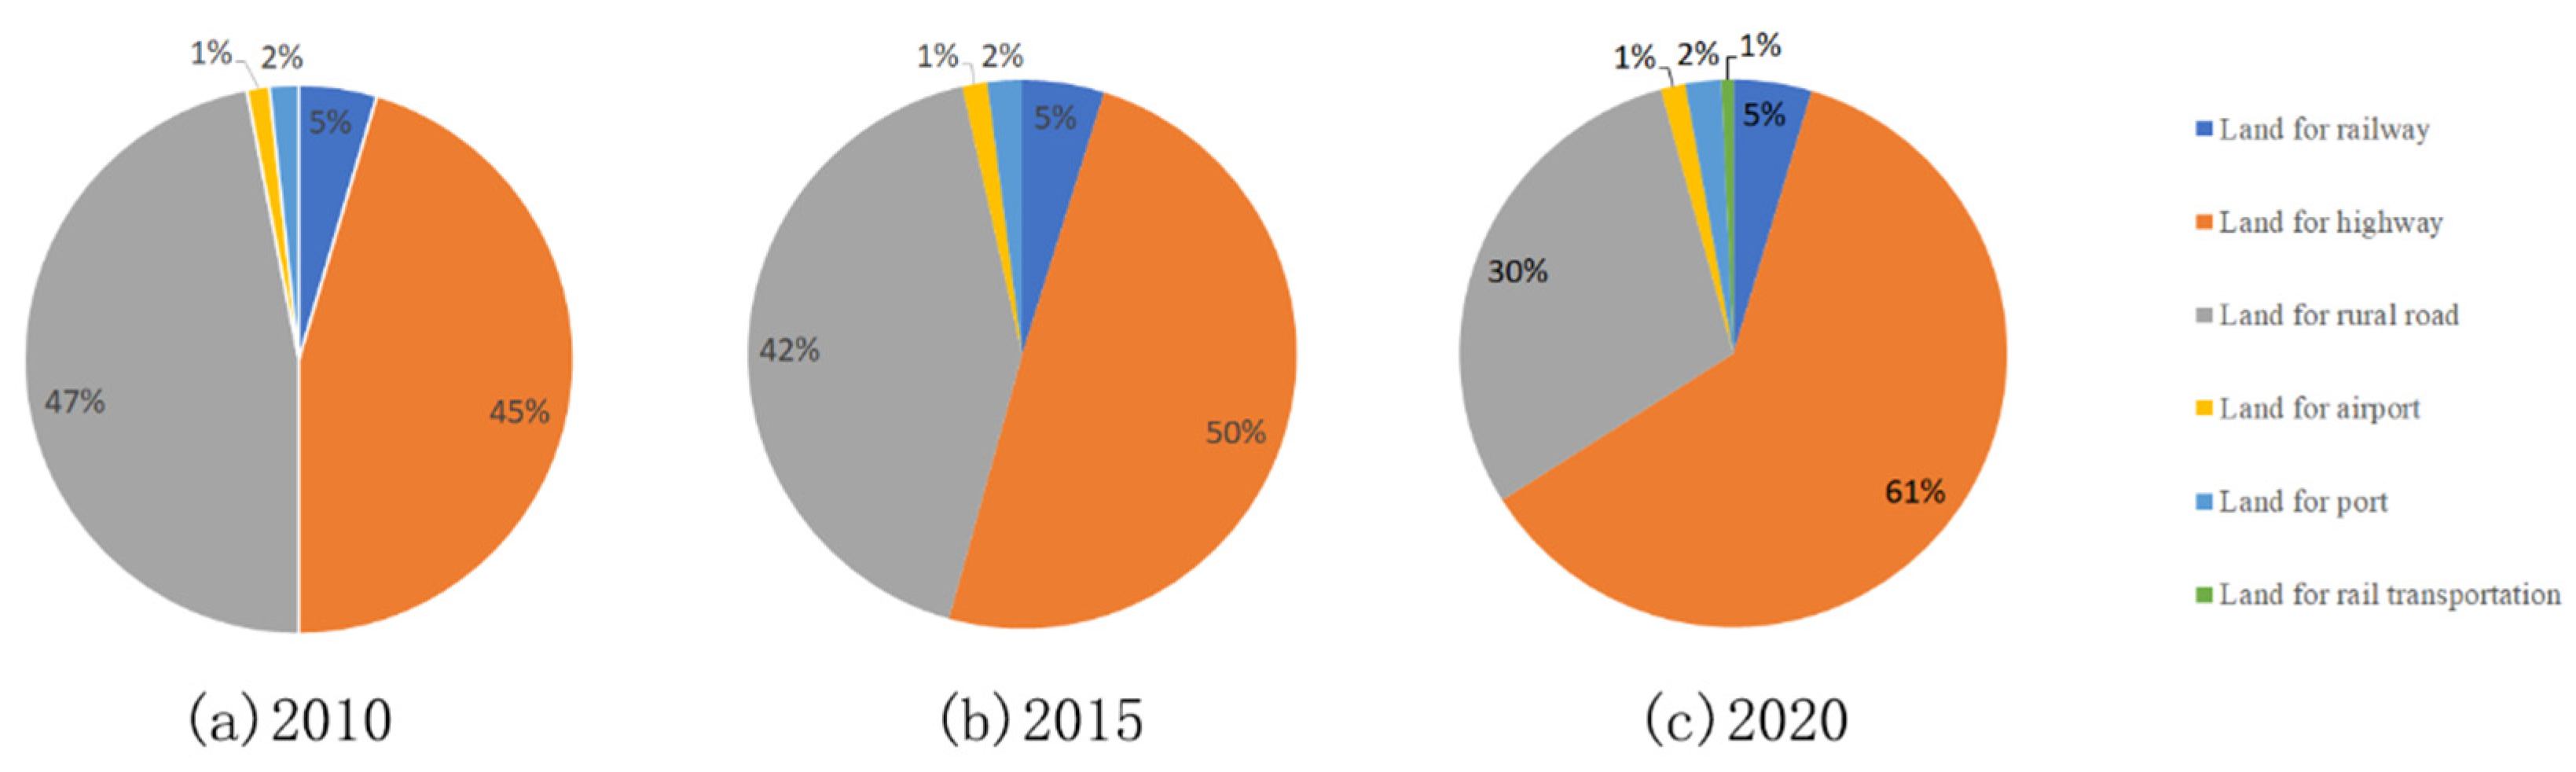
The relationship between transportation land and population distribution provides new insights for understanding regional balanced development. For developing countries like China, the construction of transportation systems is considered an important means to narrow regional development gaps. Particularly, increasing transportation infrastructure investment in underdeveloped areas to enhance transportation connections between underdeveloped and developed areas has long been regarded as an effective development strategy for achieving regional balance. However, this study found that with the changes in population distribution patterns, the mismatch between transportation land use and population size in economically disadvantaged areas has become more severe, and the decoupling phenomenon between the transportation land and population is very apparent. Looking at the transportation land structure of the peripheral area surrounding the Pearl River Delta (PRD) of Guangdong Province, rural road land accounted for the highest proportion before 2015. On the one hand, this is due to natural conditions, such as the rugged hilly terrain in these areas, combined with low socio-economic levels and low population agglomeration, leading to a large amount of rural infrastructure consuming valuable land resources and funds. On the other hand, this also forces us to reflect on the issue of transportation waste. Therefore, further sustainable development strategies are needed to address the problem of transportation land waste. It is worth noting that during the period 2015–2020, the highway land in the peripheral area surrounding the PRD of Guangdong Province grew rapidly. Combining recent news reports and published data, it can be seen that Guangdong Province has conducted a large amount of road construction in underdeveloped areas in recent years in order to radiate the economy of the Pearl River Delta region to the surrounding areas and drive the development of the peripheral area surrounding the PRD. Additionally, it cannot be ignored that as the area surrounding the PRD, the transportation roads connecting the PRD region with the outside world must pass through the peripheral area surrounding the PRD of Guangdong Province. These transportation lands, to some extent, also occupy the transportation land development indicators of the peripheral area surrounding the PRD of Guangdong Province and cause certain damage to its ecological environment. Balancing the sacrifices of underdeveloped areas with the gains of developed areas has always been a recognized global challenge. Currently, there have been some achievements in existing research on similar contradictions or problems, such as development and ecological protection or carbon emissions, but there is still little research on the fairness of transportation land development. In China, the layout of transportation land is greatly influenced by the higher-level government, especially in the construction of national strategic channels, where the multi-level government game is very complex.
In terms of policy recommendations, this study suggests that Guangdong Province should adopt differentiated policies to address diverse regional types and regional development disparities. For areas experiencing decoupling or connecting decline, urban cores that are in a shrinking stage should aim for intensive development to avoid the extensive construction of new transportation projects. This can be achieved by conducting transportation surveys and demand forecasts to develop reasonable transportation plans that balance transportation demand and resource supply. Additionally, optimizing urban industrial structures, providing more employment opportunities, and implementing preferential policies to attract the population can improve the efficiency of transportation infrastructure utilization.
For areas experiencing strong negative decoupling and expansionary negative decoupling, it is recommended to cautiously adjust the current expansion-oriented construction mode and promote high-quality transportation construction that is compatible with economic and social development, while considering efficiency and being within the range of fiscal affordability. Additionally, strategies may include leveraging existing transportation advantages, strengthening the construction of industrial supporting facilities to improve the business environment, enhancing cooperation between regions, leveraging regional comparative advantages, actively undertaking enterprise relocation and economic radiation from the Pearl River Delta region, and jointly promoting regional economic development. In addition, fully utilizing existing transportation infrastructure, nurturing new economic growth points, increasing investment in agriculture, services, and other fields to promote economic structural adjustment, transformation, and upgrade, may also be useful. Weak decoupling areas are mostly located in the central districts of cities with relatively good economic development. For these areas, it is necessary to strengthen the role of transportation in supporting populations and industries, and to fully leverage the population advantages.
Secondly, there is an urgent need to comprehensively improve the quality of transportation infrastructure supply. In the context of uneven regional development, it is necessary to address the regional differences in the supply structure of transportation infrastructure and achieve the optimal allocation of transportation elements. Aligning transportation development with regional population mobility trends to avoid blind investment and inefficient construction is crucial. Special attention should be given to areas where transportation construction is excessively large, the population is shrinking rapidly, and resource and environmental-carrying capacity are weak.
Lastly, regarding regional transportation infrastructure, its construction benefits have both temporal medium-to-long-term characteristics and spatial spillover effects. In terms of time, the multiplier effects of transportation infrastructure, such as improving productivity, driving employment, and enhancing market conditions, take time to accumulate. In terms of space, the construction of a cross-regional transportation corridor drives development over a larger geographical area and serves multidimensional comprehensive goals such as promoting economic, social, cultural, and national security. The investment in the peripheral area surrounding the Pearl River Delta (PRD) of Guangdong Province may not yield immediate results in the short term, which has, to some extent, led to the current mismatch between population and transportation land. However, from a long-term perspective, the investment in transportation land plays a role in driving the development of these economically backward areas. Evaluating transportation development from a land-use perspective requires a multidimensional global perspective that considers both short-term and long-term effects.
This study explores the spatiotemporal pattern and structural characteristics of transportation land in Guangdong Province, China, as well as its relationship with the spatial distribution of the population. It enriches the exploration of the spatiotemporal pattern of transportation land in China and the study of the relationship between specific land types and population sizes. The research results are beneficial for deepening our understanding of regional development differences and balancing resource supply, providing a theoretical basis for achieving regional sustainable development. However, the current study still has certain limitations that require further exploration. Firstly, the factors influencing the expansion of transportation land have not been further explored. Future research should increase the analysis of driving factors by adding more time series data, which may provide more policy insights. Secondly, the interaction between transportation land and the population has not been deeply analyzed, and future research should supplement and improve the relevant analysis. Finally, due to data limitations, this study did not distinguish between transportation infrastructure serving local communities and large corridors serving nationally important cities, neglecting the background differences caused by the characteristics of the two. Future research could differentiate between them and provide a detailed comparison of the results.
From the perspective of the “center-periphery” theory, this study links the research results with theoretical concepts. It analyzes the differences in transportation infrastructure supply and its relationship with the population in the center-periphery zone of Guangdong, China, under the background of regional imbalance development. This study uses the results to provide reference suggestions for regional policies and facility allocation, aiming to enhance our understanding of China’s changes, promote the connection between theory and empirical evidence, and provide a reference value for future research.

Author Contributions

Conceptualization, J.H. and J.Y.; methodology, S.D.; software, S.D.; resources, J.H. and H.C.; data curation, S.D. and S.Y.; writing—original draft preparation, J.H., S.D. and S.Y.; supervision, J.H. and H.C. All authors have read and agreed to the published version of the manuscript.

Funding

This project was funded by the Shenzhen Science and Technology Program (No. 20220810112113001) and the National Natural Science Foundation of China (No. 52378062).

Institutional Review Board Statement

Not applicable.

Informed Consent Statement

Not applicable.

Data Availability Statement

The original contributions presented in this study are included in the article; further inquiries can be directed to the corresponding author.

Conflicts of Interest

The authors declare no conflicts of interest.

References

  1. Jin, F.; Ding, J.; Wang, J.; Liu, D.; Wang, C. Transportation Development Transition in China. Chin. Geogr. Sci. 2012, 22, 319–333. [Google Scholar] [CrossRef]
  2. Prus, P.; Sikora, M. The Impact of Transport Infrastructure on the Sustainable Development of the Region—Case Study. Agriculture 2021, 11, 279. [Google Scholar] [CrossRef]
  3. Hong, J.; Chu, Z.; Wang, Q. Transport Infrastructure and Regional Economic Growth: Evidence from China. Transportation 2011, 38, 737–752. [Google Scholar] [CrossRef]
  4. Hou, Q.; Li, S.-M. Transport Infrastructure Development and Changing Spatial Accessibility in the Greater Pearl River Delta, China, 1990–2020. J. Transp. Geogr. 2011, 19, 1350–1360. [Google Scholar] [CrossRef]
  5. China Geological Survey. 2022 Chinese Natural Resources Statistical Bulletin. Available online: https://www.cgs.gov.cn/gzdt/dzhy/202304/t20230413_729068.html (accessed on 25 December 2023).
  6. Asher, S.; Garg, T.; Novosad, P. The Ecological Impact of Transportation Infrastructure. Econ. J. 2020, 130, 1173–1199. [Google Scholar] [CrossRef]
  7. Alam, K.M.; Li, X.; Baig, S.; Ghanem, O.; Hanif, S. Causality between Transportation Infrastructure and Economic Development in Pakistan: An ARDL Analysis. Res. Transp. Econ. 2021, 88, 100974. [Google Scholar] [CrossRef]
  8. Tarigan, H.; Matondang, A.R.; Lubis, S.; Sirojuzilam, S. The Effect of Road Transportation Infrastructure on Freight Transport Mobility and Regional Economy in Indonesia. J. Asian Financ. Econ. Bus. 2021, 8, 645–654. [Google Scholar] [CrossRef]
  9. Yu, N.; De Jong, M.; Storm, S.; Mi, J. The Growth Impact of Transport Infrastructure Investment: A Regional Analysis for China (1978–2008). Policy Soc. 2012, 31, 25–38. [Google Scholar] [CrossRef]
  10. Liang, Y.; Zhou, K.; Li, X.; Zhou, Z.; Sun, W.; Zeng, J. Effectiveness of High-Speed Railway on Regional Economic Growth for Less Developed Areas. J. Transp. Geogr. 2020, 82, 102621. [Google Scholar] [CrossRef]
  11. Hou, L.; Wu, L.; Ju, S.; Zhang, Z.; Zhu, Y.; Lai, Z. The Evolution Patterns of Tourism Integration Driven by Regional Tourism-economic Linkages—Taking Poyang Lake Region, China, as an Example. Growth Chang. 2021, 52, 1914–1937. [Google Scholar] [CrossRef]
  12. Zhou, Y.; Li, X.; Liu, Y. Land Use Change and Driving Factors in Rural China during the Period 1995–2015. Land Use Policy 2020, 99, 105048. [Google Scholar] [CrossRef]
  13. Yu, Z.; Zhao, P. The Factors in Residents’ Mobility in Rural Towns of China: Car Ownership, Road Infrastructure and Public Transport Services. J. Transp. Geogr. 2021, 91, 102950. [Google Scholar] [CrossRef]
  14. Han, H.; Li, H. Coupling Coordination Evaluation between Population and Land Urbanization in Ha-Chang Urban Agglomeration. Sustainability 2020, 12, 357. [Google Scholar] [CrossRef]
  15. Zhao, Z.; Fan, B.; Zhou, Q.; Xu, S. Simulating the Coupling of Rural Settlement Expansion and Population Growth in Deqing, Zhejiang Province, Based on MCCA Modeling. Land 2022, 11, 1975. [Google Scholar] [CrossRef]
  16. Tong, Q.; Qiu, F. Population Growth and Land Development: Investigating the Bi-Directional Interactions. Ecol. Econ. 2020, 169, 106505. [Google Scholar] [CrossRef]
  17. Chi, G.; Ho, H.C. Population Stress: A Spatiotemporal Analysis of Population Change and Land Development at the County Level in the Contiguous United States, 2001–2011. Land Use Policy 2018, 70, 128–137. [Google Scholar] [CrossRef] [PubMed]
  18. Bianchini, L.; Egidi, G.; Alhuseen, A.; Sateriano, A.; Cividino, S.; Clemente, M.; Imbrenda, V. Toward a Dualistic Growth? Population Increase and Land-Use Change in Rome, Italy. Land 2021, 10, 749. [Google Scholar] [CrossRef]
  19. Shi, L.; Wang, Y. Evolution Characteristics and Driving Factors of Negative Decoupled Rural Residential Land and Resident Population in the Yellow River Basin. Land Use Policy 2021, 109, 105685. [Google Scholar] [CrossRef]
  20. Zhu, C.; Zhang, X.; Wang, K.; Yuan, S.; Yang, L.; Skitmore, M. Urban–Rural Construction Land Transition and Its Coupling Relationship with Population Flow in China’s Urban Agglomeration Region. Cities 2020, 101, 102701. [Google Scholar] [CrossRef]
  21. Polyzos, S.; Tsiotas, D. The contribution of transport infrastructures to the economic and regional development: A review of the conceptual framework. Theor. Empir. Res. Urban Manag. 2020, 15, 5–23. [Google Scholar]
  22. Ng, C.P.; Law, T.H.; Jakarni, F.M.; Kulanthayan, S. Road Infrastructure Development and Economic Growth. IOP Conf. Ser. Mater. Sci. Eng. 2019, 512, 12045. [Google Scholar] [CrossRef]
  23. Ivanová, E.; Masárová, J. Importance of road infrastructure in the economic development and competitiveness. Econ. Manag. 2013, 18, 263–274. [Google Scholar] [CrossRef]
  24. Asher, S.; Novosad, P. Rural Roads and Local Economic Development. Am. Econ. Rev. 2020, 110, 797–823. [Google Scholar] [CrossRef]
  25. Gibson, J.; Olivia, S. The Effect of Infrastructure Access and Quality on Non-Farm Enterprises in Rural Indonesia. World Dev. 2010, 38, 717–726. [Google Scholar] [CrossRef]
  26. Yang, L.; Wu, D.; Cao, S.; Zhang, W.; Zheng, Z.; Liu, L. Transportation Interrelation Embedded in Regional Development: The Characteristics and Drivers of Road Transportation Interrelation in Guangdong Province, China. Sustainability 2022, 14, 5925. [Google Scholar] [CrossRef]
  27. Liao, Z.; Liang, S. Spatiotemporal Differences and Influencing Factors of Urban Vitality and Urban Expansion Coupling Coordination in the Pearl River Delta. Heliyon 2024, 10, e25682. [Google Scholar] [CrossRef] [PubMed]
  28. Gu, J.; Zhou, S.; Ye, X. Uneven Regional Development Under Balanced Development Strategies: Space-Time Paths of Regional Development in Guangdong, China. Tijd. Voor Econ. Soc. Geog. 2016, 107, 596–610. [Google Scholar] [CrossRef]
  29. Baajike, F.B.; Oteng-Abayie, E.F.; Dramani, J.B.; Amanor, K. Effects of Trade Liberalization on the Global Decoupling and Decomposition of CO2 Emissions from Economic Growth. Heliyon 2024, 10, e23470. [Google Scholar] [CrossRef] [PubMed]
  30. Organisation for Economic Co-operation and Development (OECD). Indicators to Measure Decoupling of Environmental Pressure from Economic Growth; OECD: Paris, France, 2002. [Google Scholar]
  31. Yang, F.; Shi, L.; Gao, L. Probing CO2 Emission in Chengdu Based on STRIPAT Model and Tapio Decoupling. Sustain. Cities Soc. 2023, 89, 104309. [Google Scholar] [CrossRef]
  32. Bianco, V.; Cascetta, F.; Nardini, S. Analysis of the Carbon Emissions Trend in European Union. A Decomposition and Decoupling Approach. Sci. Total Environ. 2024, 909, 168528. [Google Scholar] [CrossRef] [PubMed]
  33. Foster, V.; Dim, J.U.; Vollmer, S.; Zhang, F. Understanding the Challenge of Decoupling Transport-Related CO2 Emissions from Economic Growth in Developing Countries. World Dev. Sustain. 2023, 3, 100111. [Google Scholar] [CrossRef]
  34. Keshtkar, M.; Mobarghaee, N.; Sayahnia, R.; Asadolahi, Z. Landscape Ecological Security Response to Urban Growth in Southern Zagros Biome, Iran. Ecol. Indic. 2023, 154, 110577. [Google Scholar] [CrossRef]
  35. Tapio, P. Towards a Theory of Decoupling: Degrees of Decoupling in the EU and the Case of Road Traffic in Finland between 1970 and 2001. Transp. Policy 2005, 12, 137–151. [Google Scholar] [CrossRef]
  36. Carpio-Pinedo, J.; Romanillos, G.; Aparicio, D.; Martín-Caro, M.S.H.; García-Palomares, J.C.; Gutiérrez, J. Towards a New Urban Geography of Expenditure: Using Bank Card Transactions Data to Analyze Multi-Sector Spatiotemporal Distributions. Cities 2022, 131, 103894. [Google Scholar] [CrossRef]
  37. Liepa, L.; Rendenieks, Z.; Jansons, Ā.; Miezīte, O.; Dubrovskis, E. Mapping Forest Ecosystem Service Supply in Two Case Studies in Latvia. Appl. Geogr. 2023, 155, 102969. [Google Scholar] [CrossRef]
Figure 1. Study area overview.
Land 13 00484 g001
Figure 2. Growth of transportation land in Guangdong Province, 2010–2020.
Land 13 00484 g002
Figure 3. Structure of transportation land in 2010/2015/2020.
Land 13 00484 g003
Figure 4. Per capita area of land used for transportation and percentage of land used for transportation in various districts and counties of Guangdong Province.
Land 13 00484 g004
Figure 5. Comparison of Transportation Land Use Structure in Two Regions.
Land 13 00484 g005
Figure 6. Spatial distribution of per capita transportation land and population hotspots in Guangdong Province, 2010–2020.
Land 13 00484 g006
Figure 7. The spatial distribution of the decoupled relationship between transportation land use and population change in Guangdong Province, 2010–2020.
Land 13 00484 g007
Figure 8. Comparison of the degree of decoupling between the two regions.
Land 13 00484 g008
Table 1. Transportation land use and population decoupling status type.
TypeDecoupling State L i P i α i Definition
DecouplingWeak Decoupling≥0≥00~0.8Both are increasing, but the rate of population growth is relatively faster
Strong Decoupling<0>0<0Population increase, transportation land decrease, the relationship between population growth and transportation land is most rational
Recessive Decoupling<0<0>1.2Both have decreased, but the reduction in transportation land has been relatively faster
Negative DecouplingExpansive Negative Decoupling>0>0>1.2Both have increased, but the rate of growth in transportation land has been relatively faster
Strong Negative Decoupling>0<0<0Population decrease, transportation land increase, the relationship between population growth and transportation land is most unreasonable
Weak Negative Decoupling≤0≤00~0.8Both have decreased, but the deceleration of population growth is relatively faster
CouplingExpansive Coupling>0>00.8~1.2Both are increasing and relatively keep pace
Recessive Coupling<0<00.8~1.2Both are decreasing and relatively keep pace
Table 2. The spatial statistical variable of decoupling relationship between transportation land and population growth in Guangdong Province.
DistrictTimeStatistical Variables
Moran’s IZ-Valuep-Value
Guangdong Province2010–20150.1001.7520.047
2015–20200.1893.1770.003
PRD2010–20150.1031.2040.038
2015–20200.1992.2590.025
Peripheral area surrounding PRD of Guangdong Province2010–2015−0.0110.0320.490
2015–20200.1401.8960.058
Disclaimer/Publisher’s Note: The statements, opinions and data contained in all publications are solely those of the individual author(s) and contributor(s) and not of MDPI and/or the editor(s). MDPI and/or the editor(s) disclaim responsibility for any injury to people or property resulting from any ideas, methods, instructions or products referred to in the content.

