Article

Resilience Assessment of Historical and Cultural Cities from the Perspective of Urban Complex Adaptive Systems

1
Guangzhou Urban Planning & Design Survey Research Institute, Guangzhou 510060, China
2
School of Architecture, Tianjin University, Tianjin 300072, China
3
School of Political Science and Public Administration, Shandong University, Jinan 250199, China
*
Author to whom correspondence should be addressed.
Land 2024, 13(4), 483; https://doi.org/10.3390/land13040483
Submission received: 26 February 2024 / Revised: 21 March 2024 / Accepted: 3 April 2024 / Published: 9 April 2024
(This article belongs to the Special Issue Urban Resilience and Heritage Management)

Abstract

:
Due to the increasingly complex global climatic environment and the rapid development of China’s urban construction, China’s historical and cultural cities are experiencing an external impact as well as internal fragility. Representing the capacity of the urban system to address impact and pressure, resilience can effectively guarantee the sustainable development of historical and cultural cities. A scientific and reasonable resilience assessment system can guide the resilience construction of historical and cultural cities in an effort to effectively counter the impact and pressure they face. Therefore, it is necessary to research the resilience of historical and cultural cities. On the basis of the complex adaptive system (CAS), and by applying multiple assessment indicators, this paper established a resilience assessment system for China’s historical and cultural cities, comprising 38 indicators in six dimensions, to analyze the characteristics and the influencing mechanisms of the resilience of the historical and cultural cities and to reveal the inherent logic underlying their complex presentation. Using six historical and cultural cities in east China as an example, the study applied the assessment system to assess and analyze the different resilience levels of the cities. The comprehensive resilience of Changzhou City obtained the highest score at 0.64, indicating a higher degree of resilience; the scores of Yantai City, Huzhou City, and Nantong City were 0.59, 0.54, and 0.50, respectively, representing moderate degrees of resilience; the scores of Zhongshan City and Quzhou City were 0.44 and 0.40, respectively, exhibiting a lower degree of resilience. Moreover, the factors that result in an unbalanced development of urban resilience were explored from the perspectives of economy, system, and culture. The paper contains some significance in guiding the development of the resilience of historical and cultural cities.

1. Introduction

With the changes in the global climatic environment, rapid urbanization, and industrialization, many cities are facing both an external impact and internal vulnerabilities. Cities are facing numerous natural and social risks, including natural disaster risks such as earthquakes, floods, and sandstorms, ecological environment risks such as environmental pollution and ecological damage, public health risks such as epidemic transmission, and social stability risks such as drug abuse and group conflict events [1]. Due to these risks, research on the resilience of the city system is highlighted as a key topic in the research and practice regarding city management [2]. Cities and communities need to strengthen their resilience and improve citizens’ security and welfare to eliminate any possible challenges and dangers on the path to urbanization [3,4]. The requirement for sustainable city and community construction to address the risks of climatic change and ecological environment changes, as recorded in the Sustainable Development Goals (SDG), is an important aspect of city resilience enhancement [5].
As special types of cities and towns, historical and cultural cities have the dual properties of dwelling and legacy [6]. At present, it is clear that the living environment of historical and cultural cities has decayed, and the cultural connotations of their legacies have been lost [7], usually facing the problems of low-income group aggregation, population ageing, and backward infrastructure [8]. The 5000-year-old China has established some famous cities with a niche in history due to their profound cultural deposits and significant historical events. To protect these important cities and cultural relics, which were political, economic, and cultural centers in ancient times or the sites of modern revolutionary movements and important historical events, from destruction, in November 1982 [9], the term “historical and cultural city” was explicitly defined in the law [10,11]. This refers to cities containing abundant cultural relics, boasting great historical and cultural value and revolutionary significance, housing many historical and cultural relics, and boasting high emotional, social, and tourist value. Compared with ordinary cities and towns, historical and cultural cities are more complex, fragile, and prone to destruction following external impact. Following the acute impact of disasters, historical and cultural cities will suffer from the loss of people’s lives and property losses, and irreversible, heavy losses of cultural relics and resources. Referring to the city’s ability to withstand this impact and pressure, resilience can effectively ensure historical and cultural cities’ sustainable development [12]. Research on the resilience of historical and cultural cities can help to preserve historical relics and maintain cultural memory.
The word “resilience” first appeared in the fields of psychology and mechanical engineering, and engineering resilience was used to describe the ability to restore or recover, or the speed in restoring or recovering, constancy in the exogenous process [13,14]. According to numerous researchers, the concept of “resilience” was first used by C.S. Holling in his paper on system ecology, published in 1973 [15,16]. Resilience was defined as “the ability of the ecological system to recover to the stable status after disturbance”. In the late 1990s, the concept of resilience was transferred from ecology and psychology to social science. In this field, “resilience” stressed people’s ability to adapt to the environment, especially extreme environments [17,18] In 2002, the “ICLEI—Local Governments for Sustainability” first put forward the concept of “urban resilience” at the United Nations SDG Summit, and the term “resilient city” aroused the attention of academic circles worldwide. Internationally, the first document containing systematic research on resilient cities was D. R. Godschalk’s article, published in Natural Hazards Review in 2003 [19]. This defined the term resilient cities, pointing out that cities are vulnerable to the threats of natural hazards and terrorism and that founding resilient cities could help cities to effectively withstand these threats, as well as demonstrating how to apply the concept of “resilience” to urban planning from physical and social perspectives. The term resilience, as used in the paper, refers to evolutionary resilience. This means that the system basically adapts to the constantly changing internal and external factors by making changes that can help it to maintain the same structure, function, identity, and ability to receive feedback.
The “resilience” of historical and cultural cities is complex, and relevant research should be conducted in the directions of comprehensive treatment featuring whole process, multiple factors, and multiple dimensions [20]. As typical complex macrosystems, historical and cultural cities boast the basic characteristics of Complex Adaptive Systems (CAS), whose development and evolution laws can be explained by the CAS theory [21]. The CAS theory was officially proposed by the American Professor John Hollan at the 10th anniversary of the establishment of Santa Fe in 1994. The CAS theory can reveal the inherent operation rules in a complex system and provides a method that can be used to profoundly reveal the operation rules of the complex system [22]. The core viewpoint of the CAS theory is that the adaptability of the microcosmic bodies forms the emergent properties and complexity of the macroscopic system; nonetheless, there is complex high-order redundancy between the microcosmic system and the macroscopic system, and the resilience of the macroscopic system uses the self-adaptability of the microcosmic system, the emergent properties of the macroscopic system, and the negentropy process of the macroscopic system as its core. Cities themselves are open, complex adaptive systems. To apply the idea of resilience to urban construction, special attention should be paid to the initiative adaptation in the urban system, including the perception, the coping capacity, the optimizing capacity, and the recovery capability [23].
Cutter and Keller [24,25] have assessed urban resilience from the perspective of CAS and established a comprehensive resilience assessment system including economic, ecological, infrastructural, social, disaster, and material systems. The resilience assessment based on CAS theory can effectively guide the process of resilience practice. An effective and reasonable resilience assessment system can promote the resilience construction in historical and cultural cities so that these cities can effectively counter various forms of impact and pressure [26]. It is of great significance to conduct resilience assessments of historical and cultural cities based on the CAS theory. The purpose of the research is to, with the support of the CAS theory, research the resilience of historical and cultural cities, and establish a form of resilience that can be used to effectively evaluate the historical and cultural cities. Meanwhile, the comprehensive resilience evaluation method system of universal significance tries to provide technical support for the sustainable development of historical and cultural cities.
From the perspective of the basic idea of the Complex Adaptive System (CAS) theory and the multi-index assessment method, this research analyzed the resilience mechanisms of historical and cultural cities under the guidance of the CAS theory. From the perspective of the CAS of historical and cultural cities, a resilience assessment for historical and cultural cities was set up and an empirical resilience assessment was conducted, using the six historical and cultural cities in east China as examples (Figure 1 shows the research framework and systematic thinking).
The manuscript consists of five parts: the “Section 1” and “Section 2”, which describe the main characteristics of the target cities and the assessment methods that were applied, “Section 3”, which establishes the resilience assessment system of historical and cultural cities based on the CAS theory, “Section 4”, which introduces the results of the resilience assessment of each historical and cultural city, “Section 5”, which aims to explain, analyze, and compare the differences in the research results, and “Section 6”, which summarizes the whole article.
Our specific research contents were as follows:
(1)
Analyze the resilience system of historical and cultural cities under the guidance of the CAS theory;
(2)
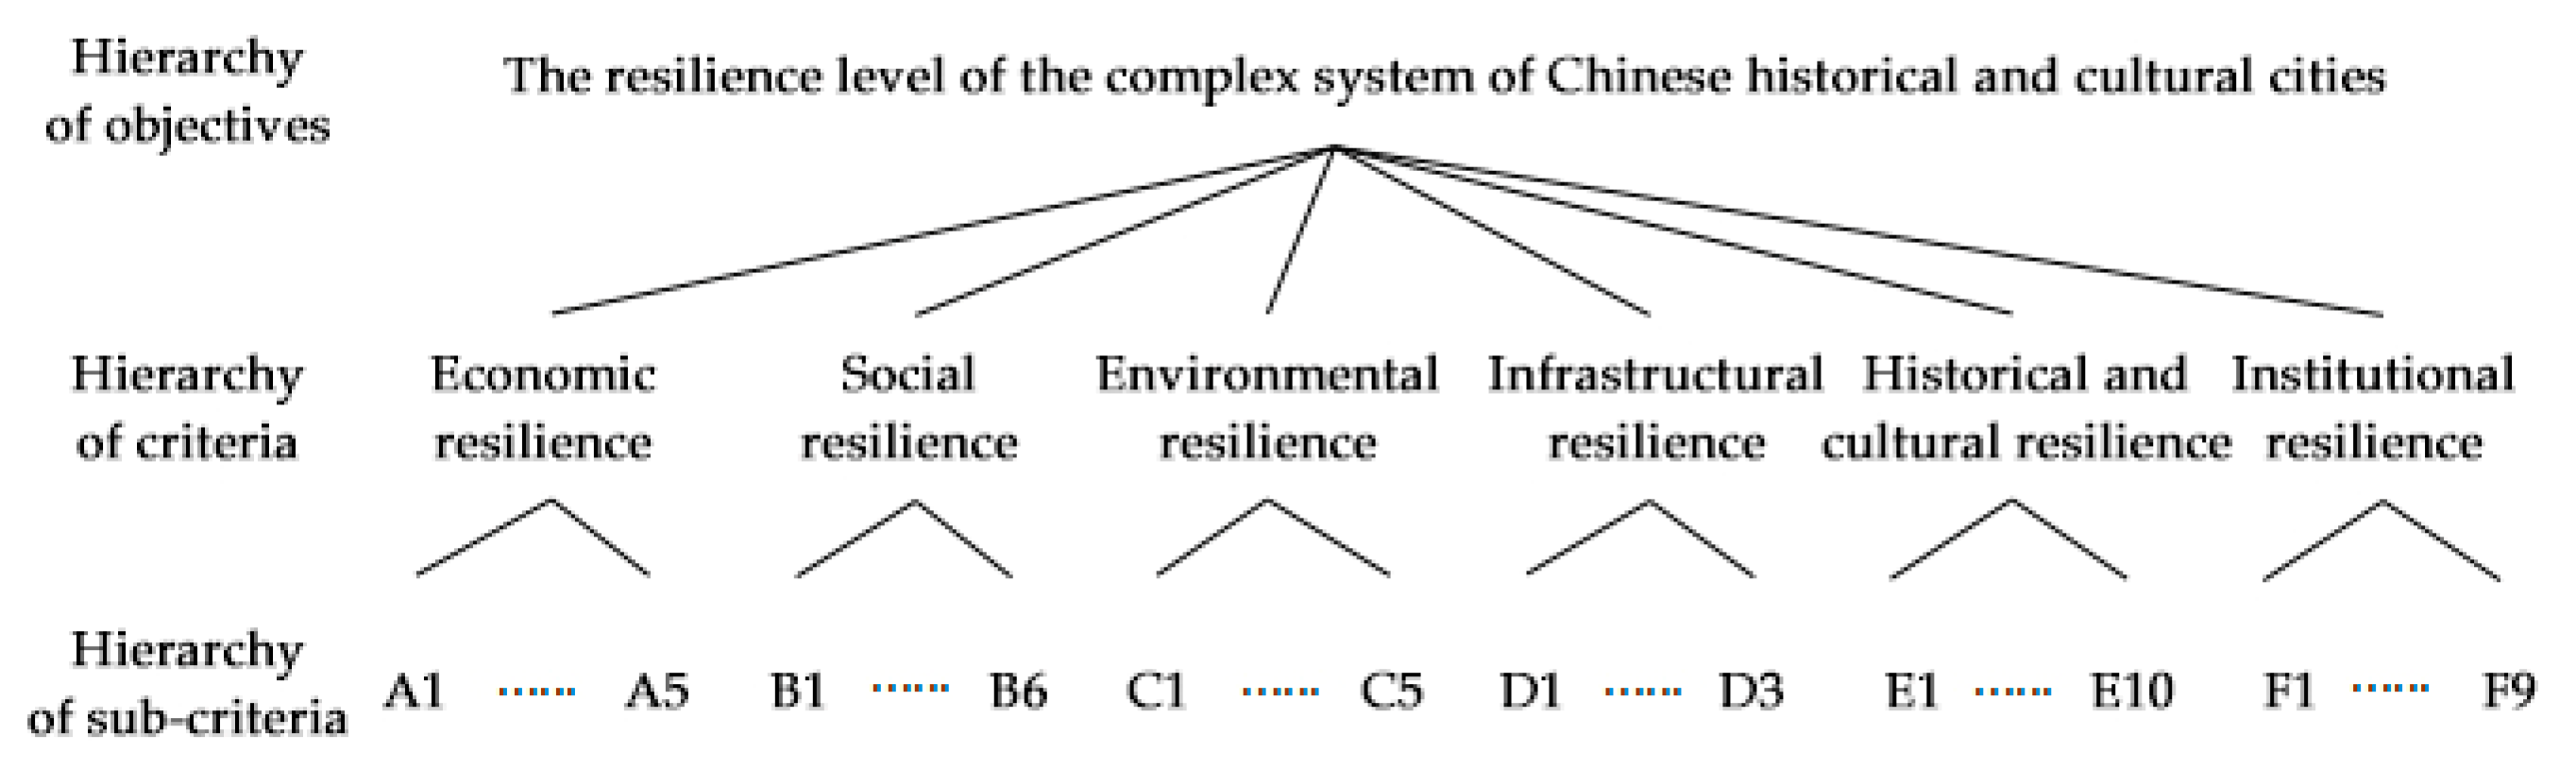
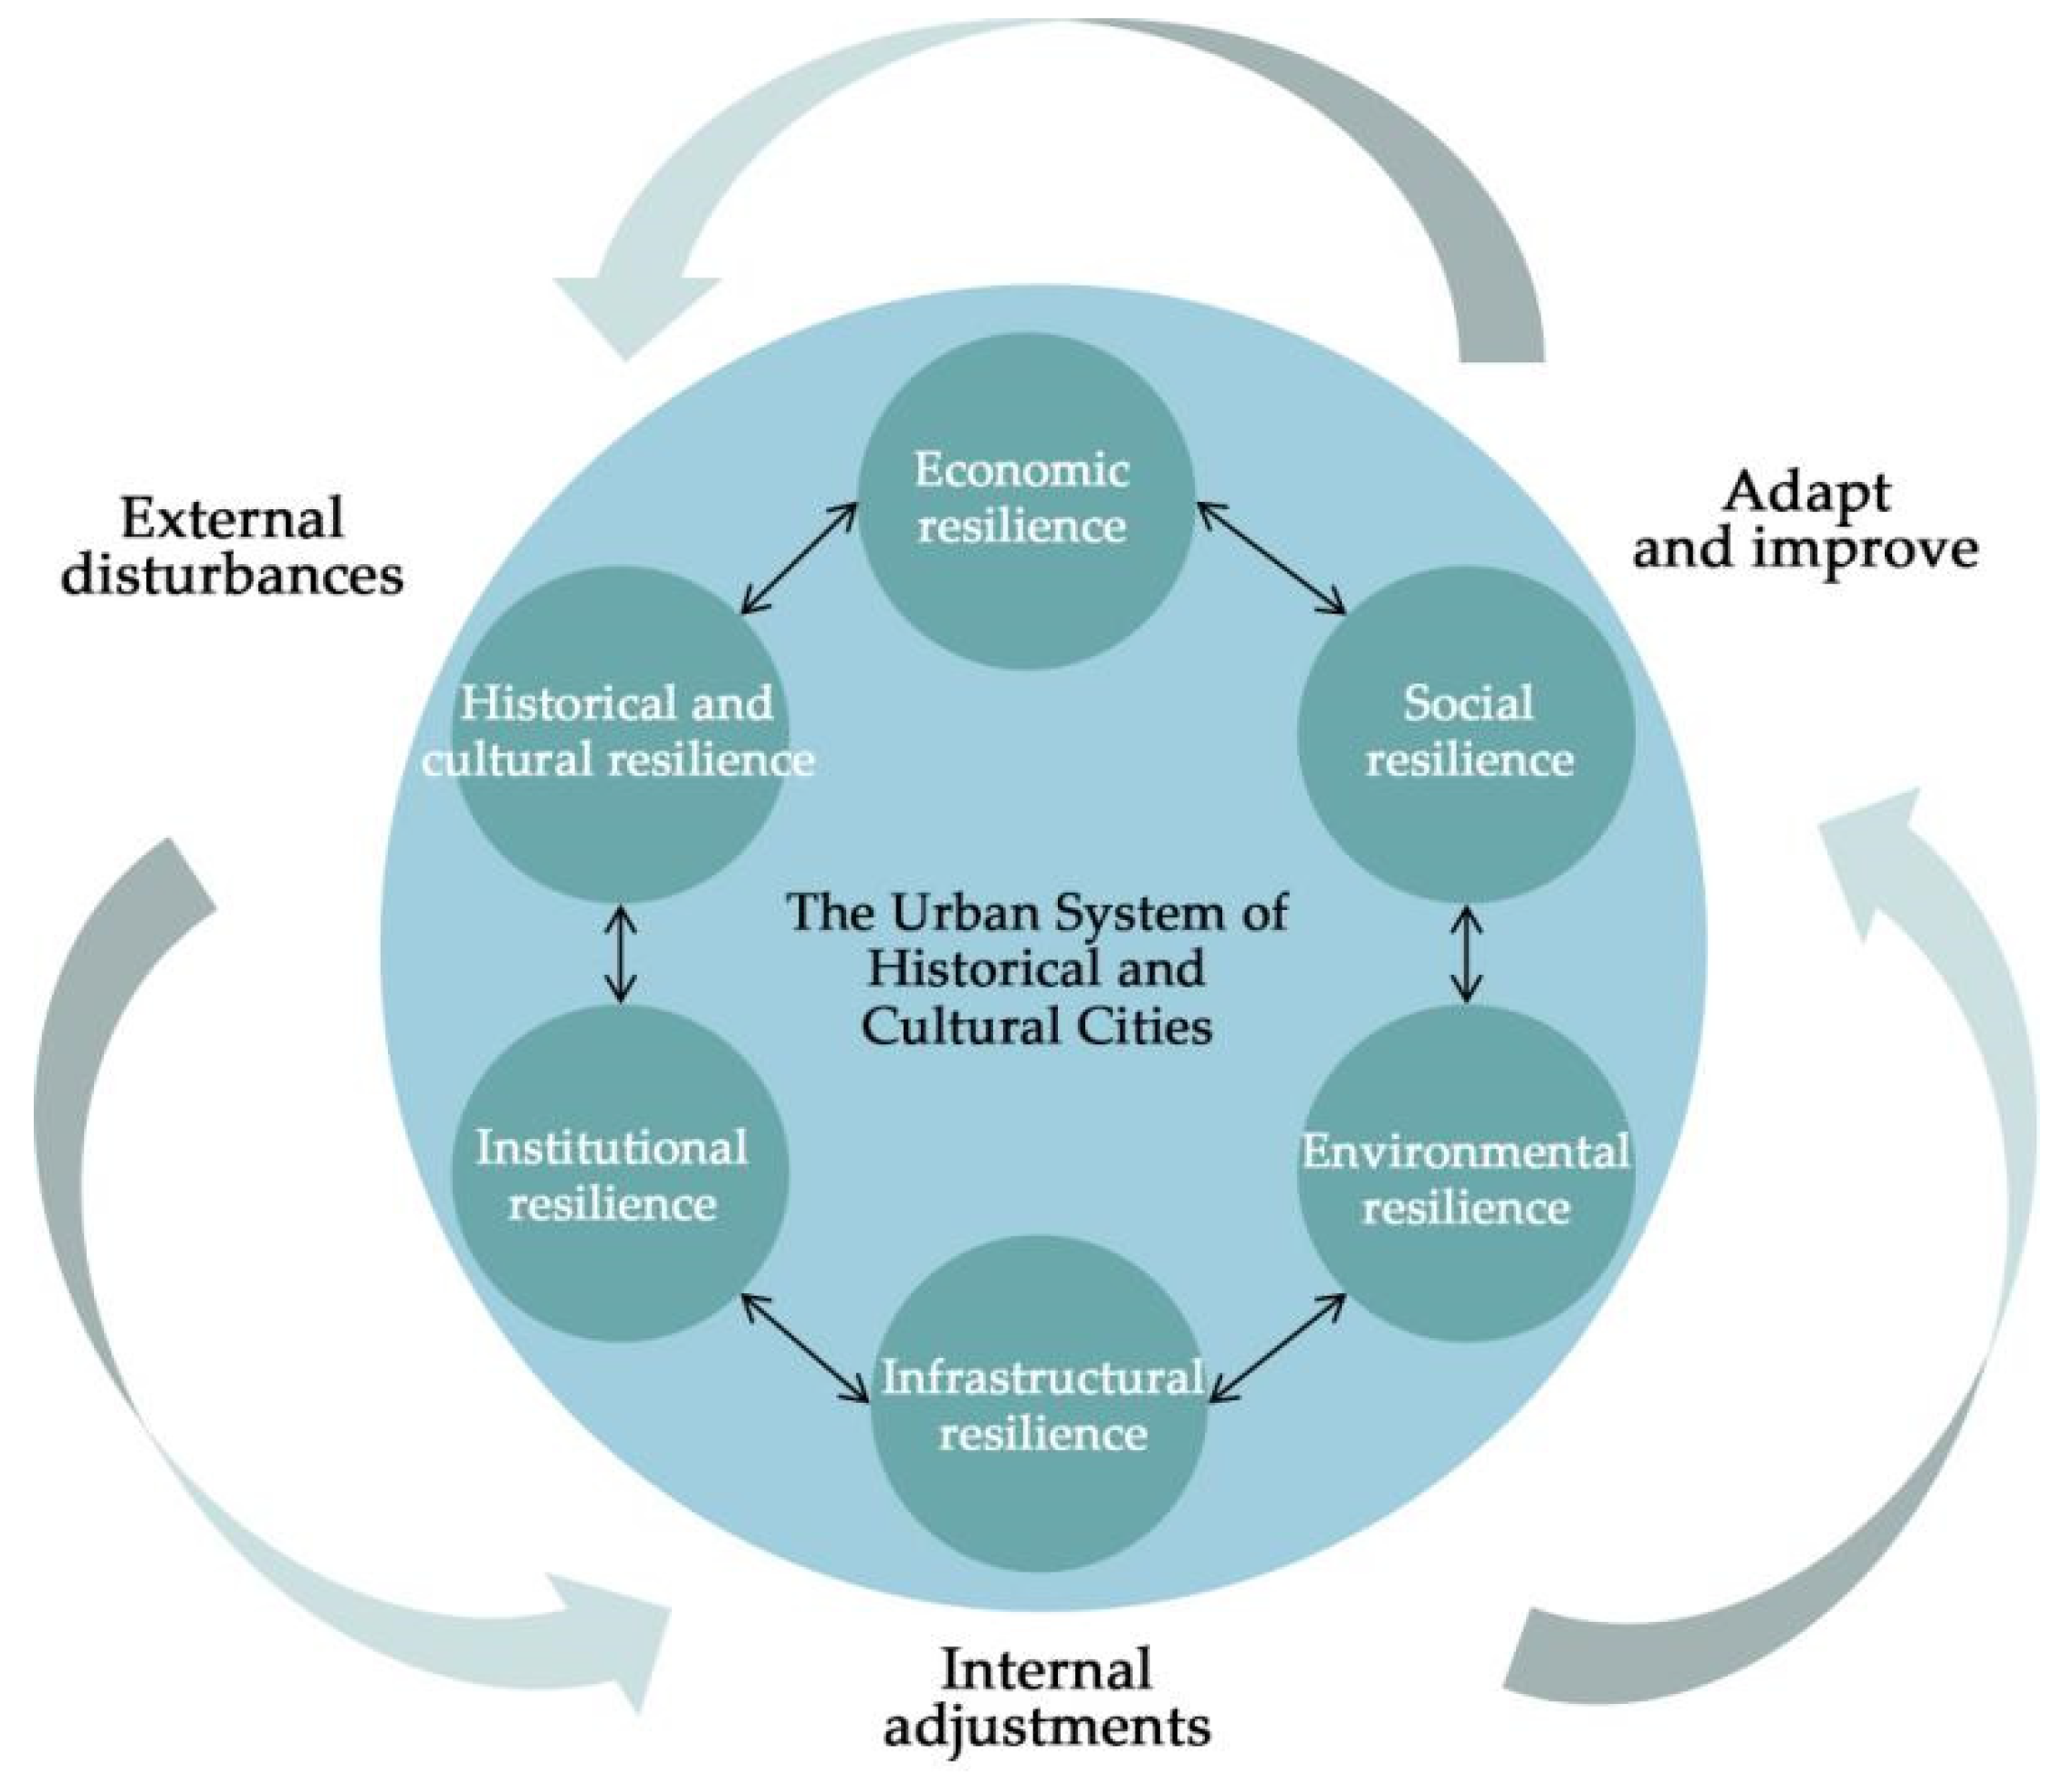
Looking at the CAS of historical and cultural cities, the paper sets up assessment dimensions and an index system featuring economic resilience, social resilience, environmental resilience, infrastructural resilience, historical and cultural resilience, and institutional resilience;
(3)
Evaluate the resilience degree of the six historical and cultural cities in east China on the basis of the CAS theory and explore the factors and function paths influencing the resilience of the cities.

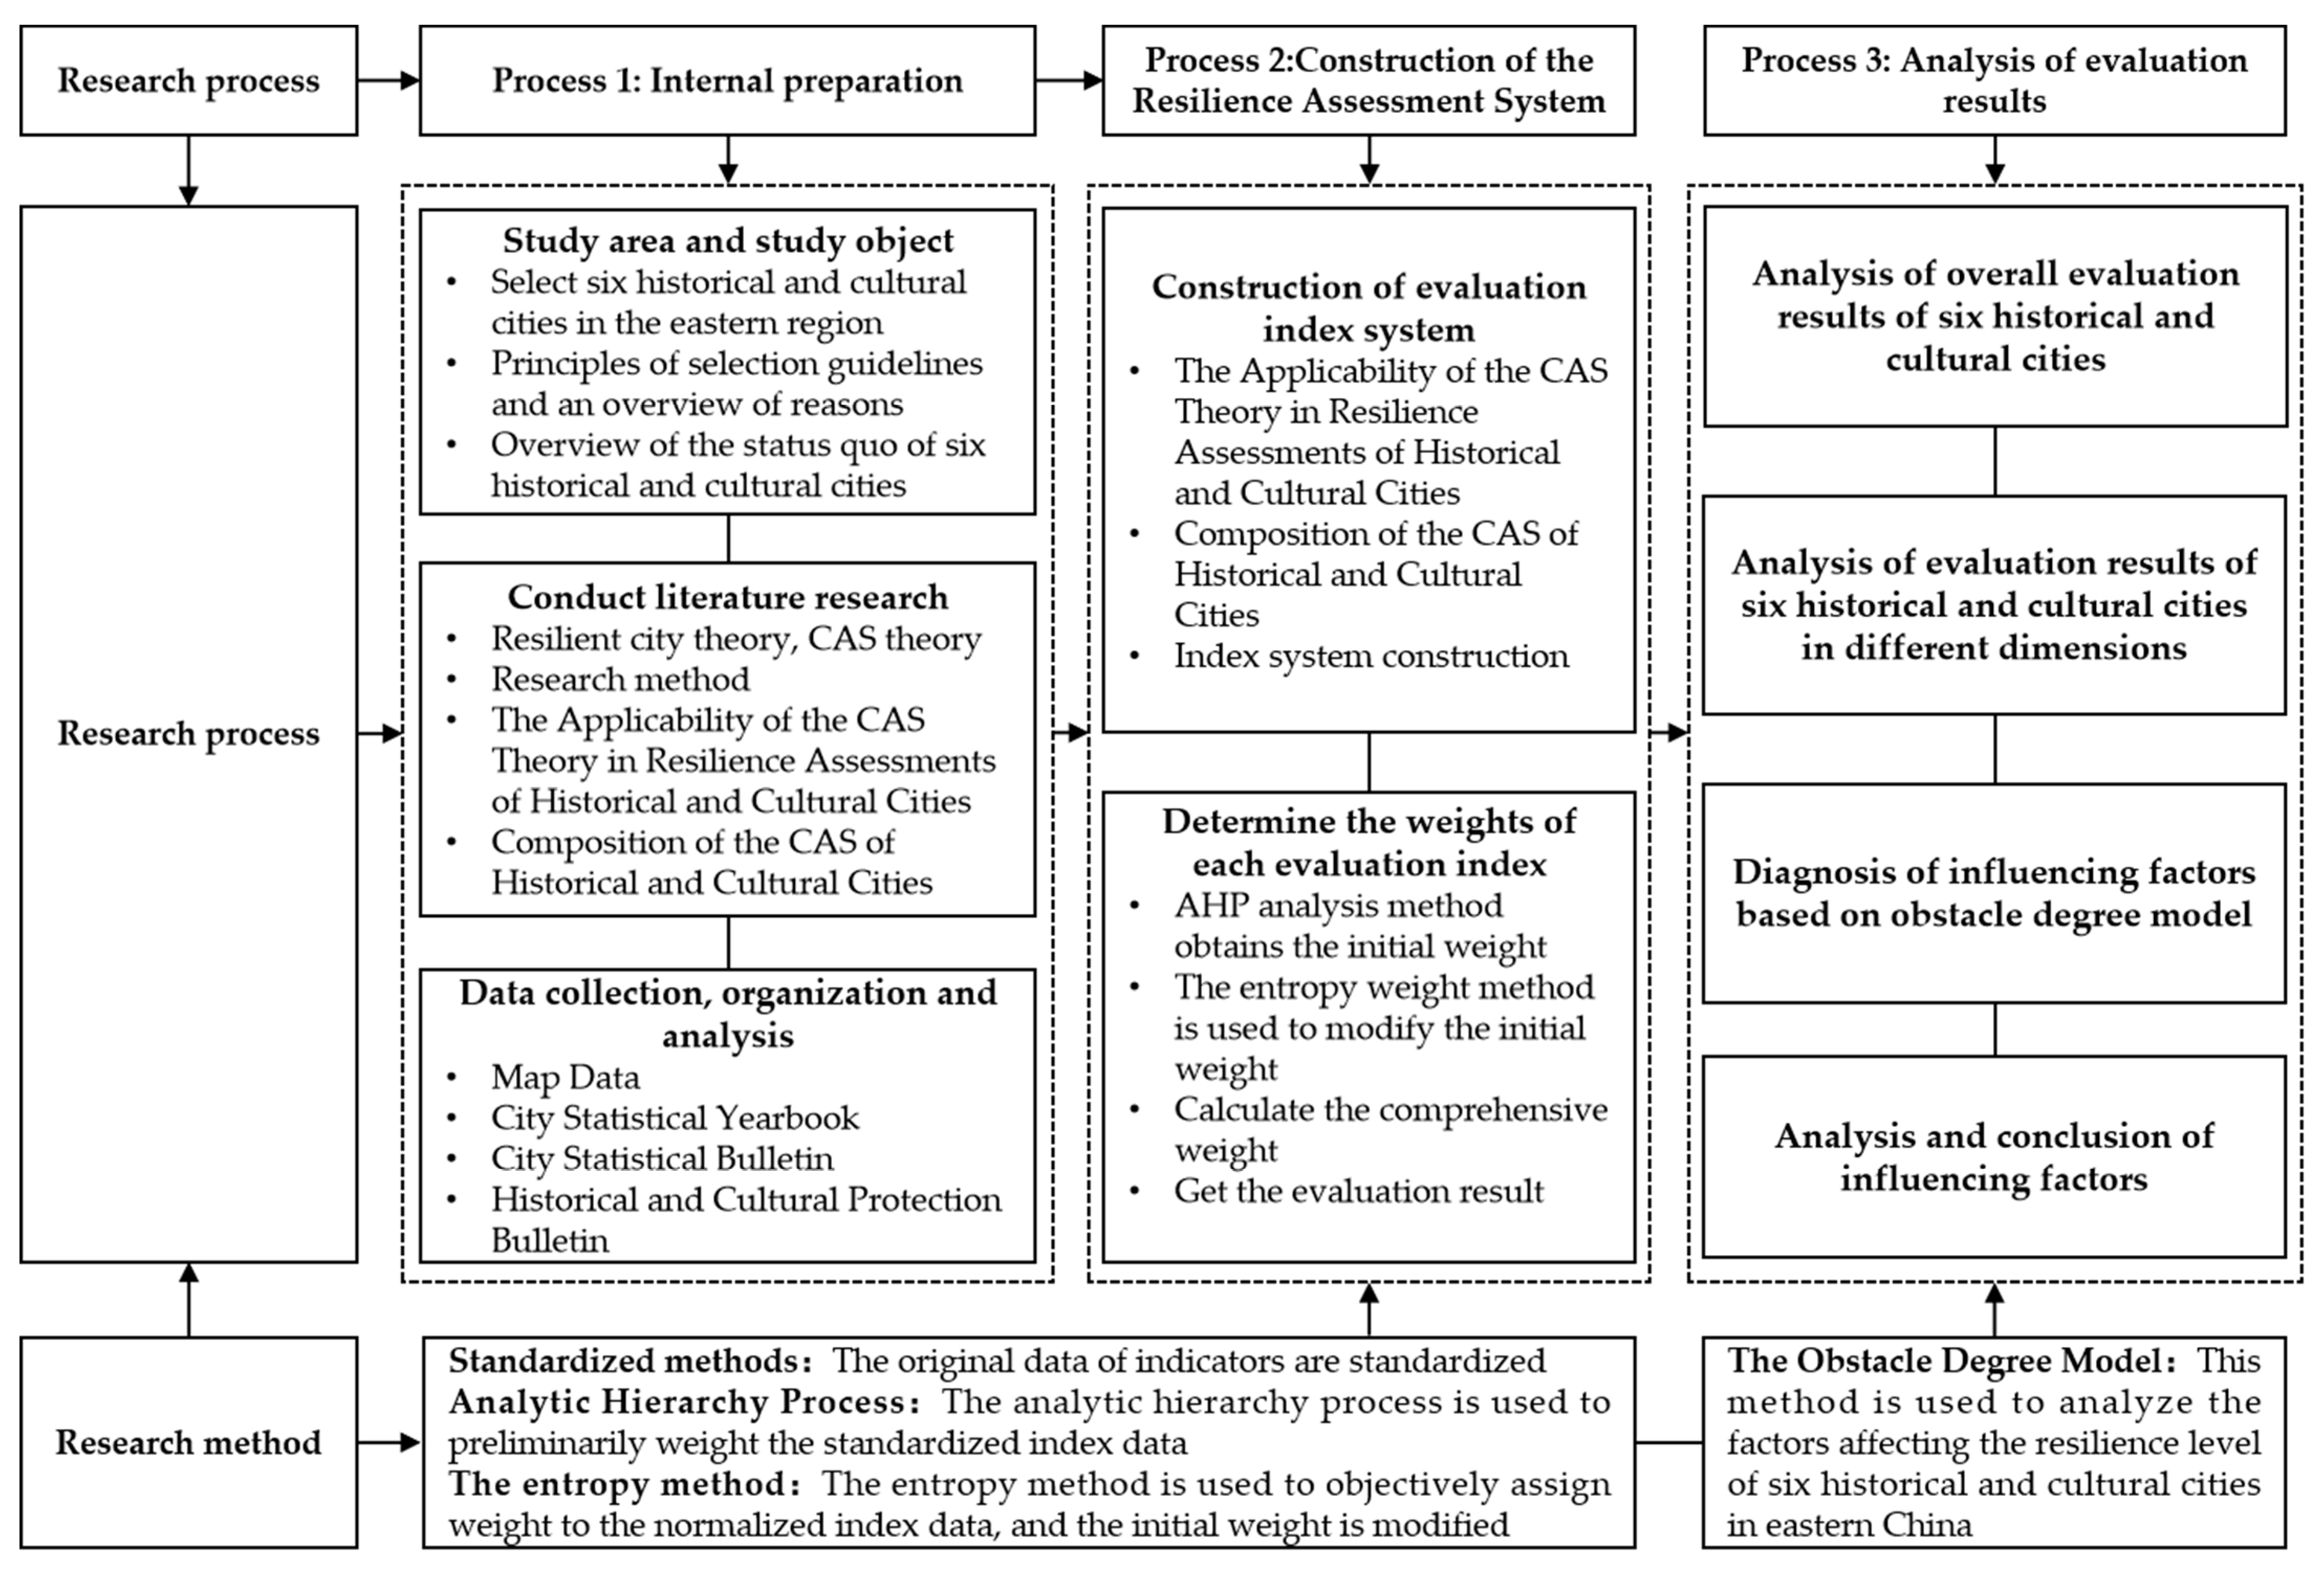
2. Materials and Methods
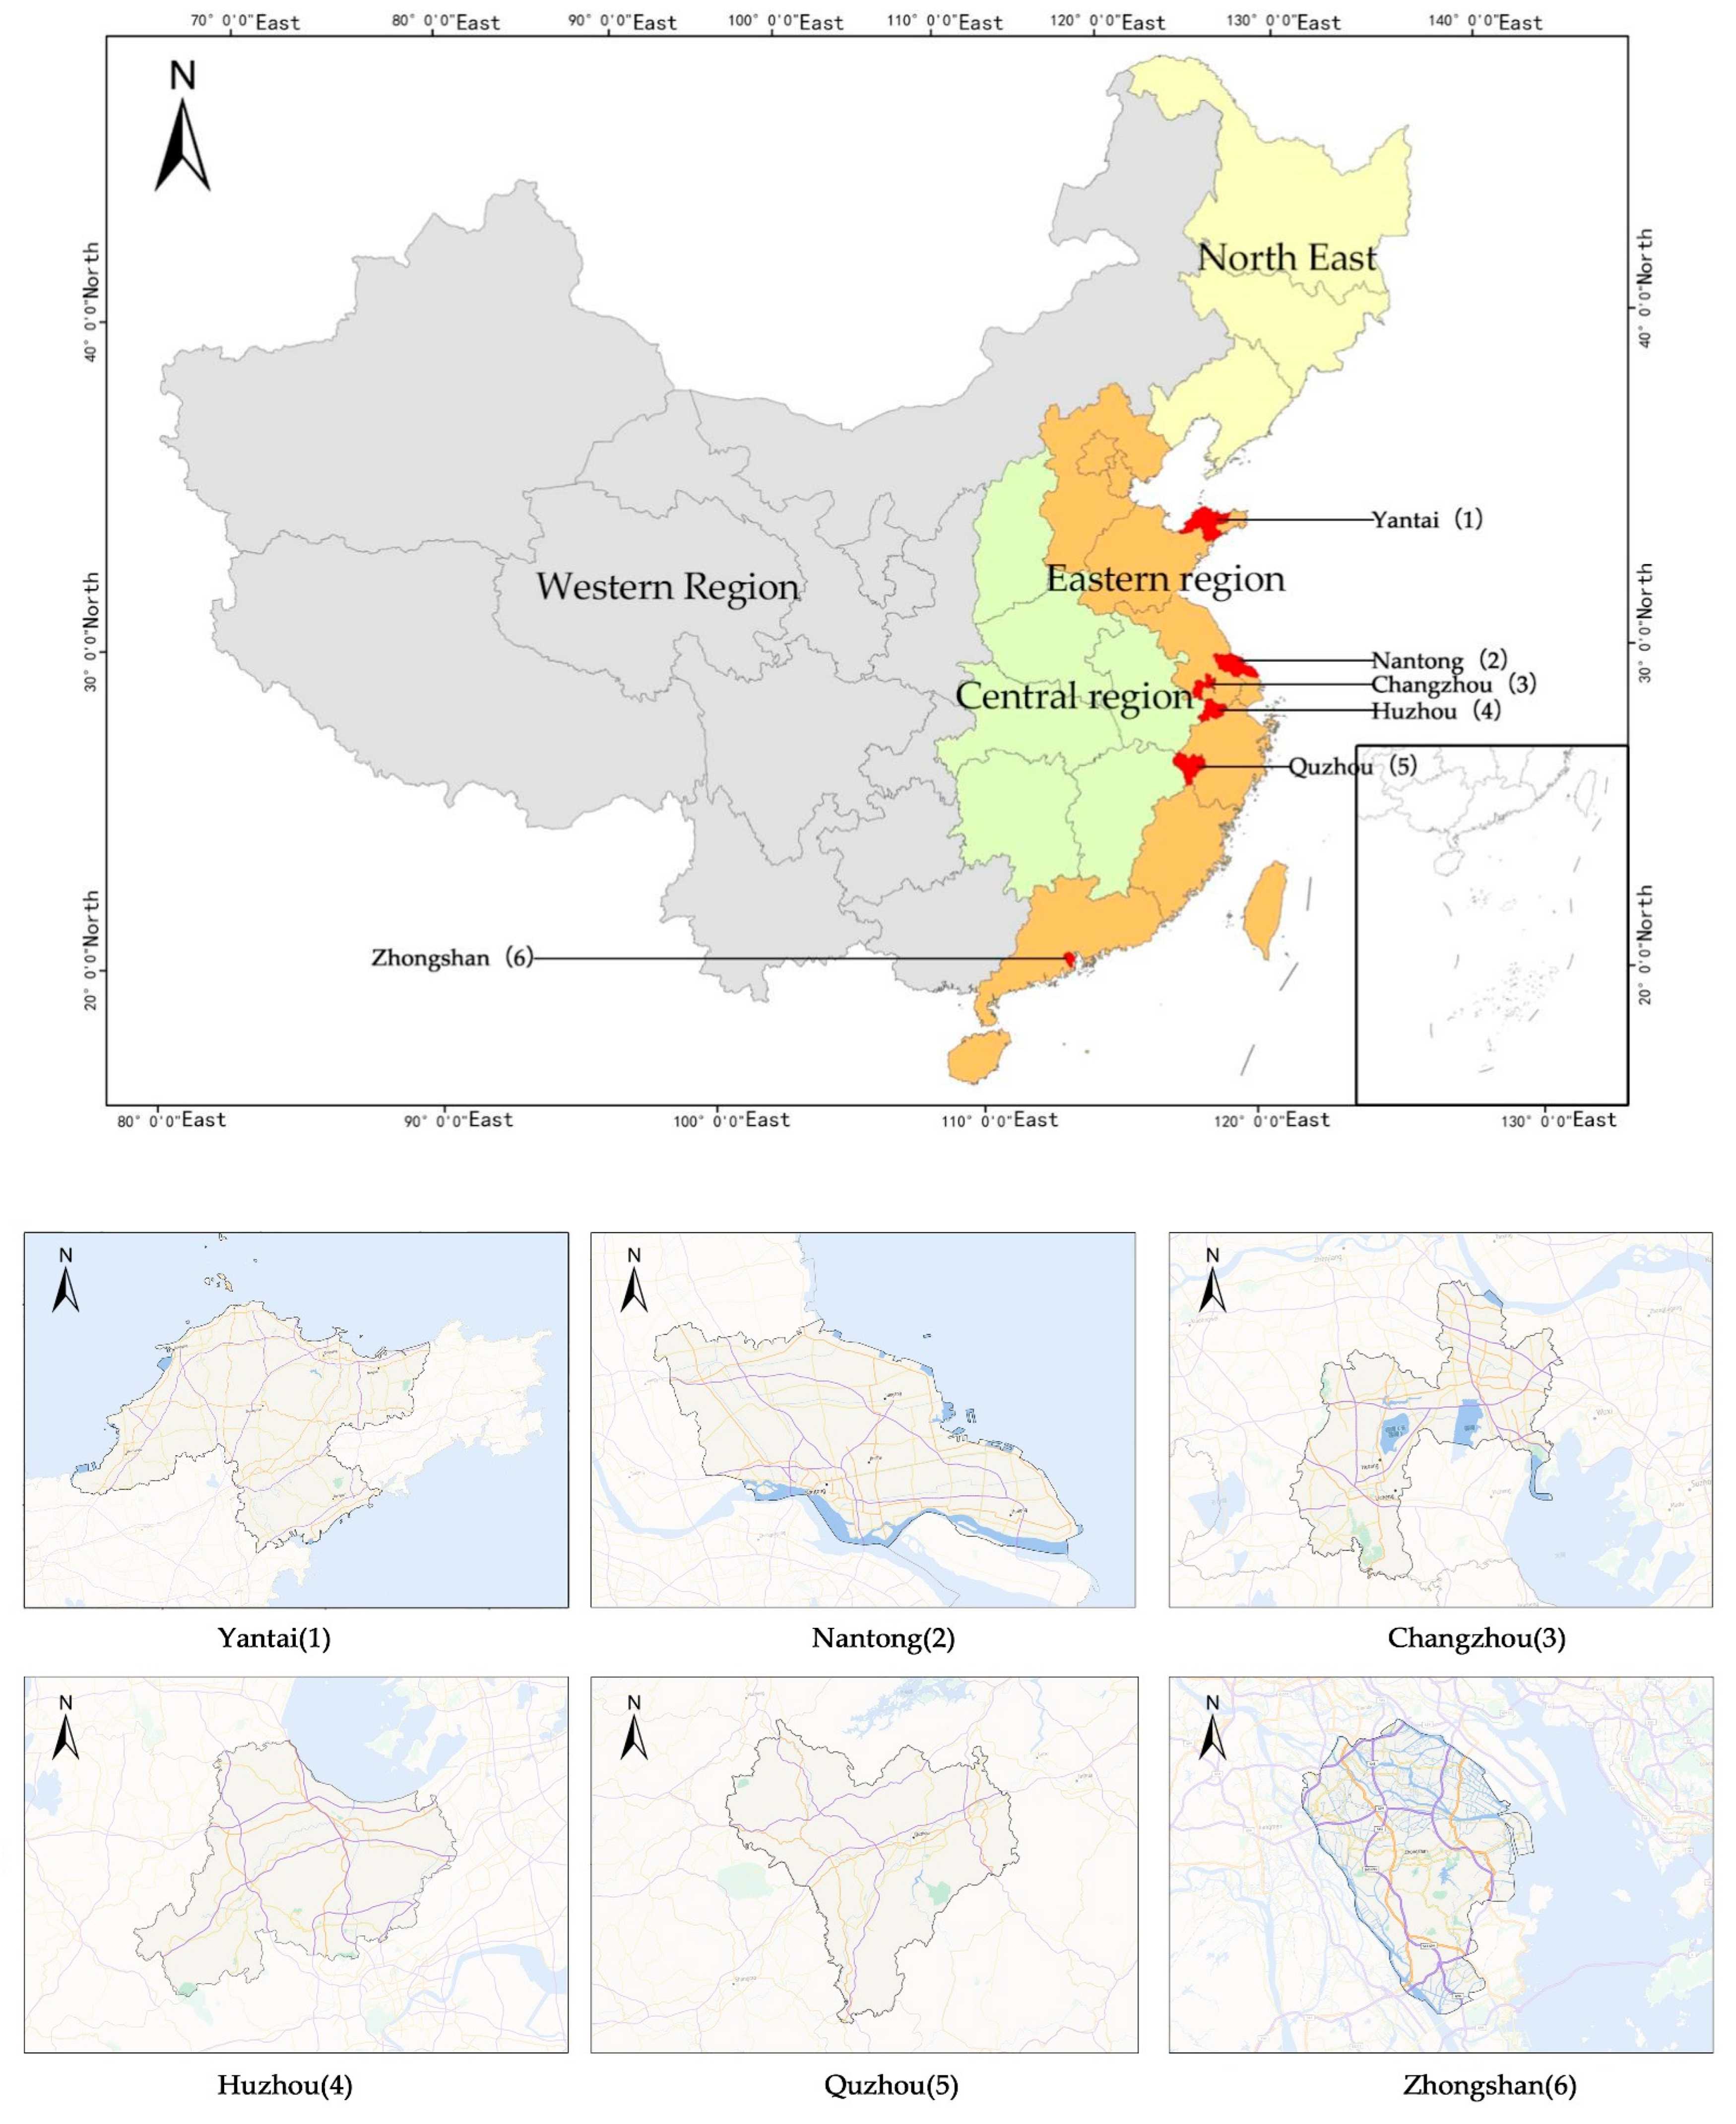
2.1. Study Area

The research area covers six historical and cultural cities in east China: Yantai, Tongzhou, Changzhou, Quzhou, Huzhou, and Zhongshan (Figure 2, Table 1). According to the Opinions of the Central Committee of the Communist Party of China and the State Council on Promoting the Rise of Central China and the Opinions of the State Council on Implementing the Policies and Measures of the Great Western Development Strategy, China’s economic zones are divided into eastern, central, western, and northeastern zones (Figure 2). The study area in the eastern coastal area of China lies on the eastern edge of east China and the western bank of the Pacific Ocean, tucked away between 18°09′35″ N–42°37′31″ N and 108°37′26″ E–122°13′42″ E and covering eight provinces and three municipalities, namely, from north to south, Beijing, Tianjin, Hebei, Shandong, Jiangsu, Shanghai, Zhejiang, Fujian, Taiwan, Guangdong, and Hainan. The reasons for selecting the study area are as follows:
The six cities are geographically located in eastern China, rich in historical and cultural resources, have the same characteristics of economic development, and have strong representation, which is also the reason for the sample selection.
(1) The urban system in east China is more complex and the historical and cultural resources are more abundant. Nonetheless, due to the rapid growth of the urban economy and population against the background of rapid urbanization, it is easy to neglect historical and cultural city conservation. Mostly from the perspective of economic benefits and efficiency, related economic sectors are more likely to stress rapid spikes in city construction or engineering project construction. Selecting the historical and cultural cities in east China as the study area allows for national typicality and is of great practical significance and scientific value.
(2) After the reform and opening-up movement in 1978, China’s center of economic growth gradually moved towards the eastern coasts. Thanks to the accelerated urban construction and economic growth, they became the area with the rapidest economic growth and the densest population. Statistics from the National Bureau of Statistics in 2022 show that 40 percent of the country’s population lives in the eastern coastal region, and the eastern coastal region accounts for more than half of the country’s GDP, reaching 54 percent.
Although the six selected cities have their own geological, historical, and cultural characteristics, they are generally similar in terms of economic growth and being located in east China. They can represent medium-sized cities in east China, and the research conclusions have strong generalizability.

2.2. Research Data

The map data in the research include the road network, the river system data, the built-up area data, and the historical and cultural resource data. From the Open Street Map, various data were obtained, like the longitude and latitude of highways, expressways, arterial highways, sub-arterial highways, and by-passes. The data on the administrative divisions were sourced from the Code for Statistical Division and the Urban–Rural Division of the National Bureau of Statistics. The data on the population, economic and ecological environment, infrastructure, and institutional facilities were sourced from the statistical yearbook and statistical bulletin of each city. The statistical data on the historical and cultural resources and the data on capital investment in the research were sourced from the statistical bulletin of historical and cultural protection for each city. The paper clarified and normalized the statistics and conducted an analysis of the data.
Based on the Rockefeller Foundation Resilience Assessment System, the 17 United Nations Sustainable Development Goals (SDG), the ISO37123 Urban Resilience Indicator System framework, and academic research (see Section 3.3), building the CAS of historical and cultural cities involves 38 indexes. Among them, the data of indexes such as A1, A2, A5, B1–B6, C1–C5, and D3 were all sourced from the cities’ statistical yearbooks and statistical bulletins for 2022; the data of indexes such as A3, A4, E1–E10, and F1–F9 were all sourced from the Historical and Cultural Protection Bulletin for 2022; the data of indexes such as D1 and D2 were sourced from the map data, the cities’ statistical yearbooks, and the cities’ statistical bulletins for 2022.

2.3. Research Method

The research methods involved in this paper include the standardization method, the analytic hierarchy process, the entropy evaluation method, and the obstacle degree method. After the data collection is completed, the dimensionality of indicators of different dimensions is reduced using standardized methods to reduce the dimensionality of data to the range [0, 1] (see Section 3.4). The standardized index data were weighted by an analytic hierarchy process (AHP), and the initial weights were determined after expert discussion (see Section 3.4). The entropy evaluation method was used to objectively weight the standardized indicator data, so as to modify the initially determined weights and obtain the final weights (see Section 3.4). The evaluation results of six historical and cultural cities are obtained by using the final weight. The obstacle degree method was used to explore the obstacle factors for the resilience development of six historical and cultural cities (see Section 5.1).

2.3.1. Standardized Methods

After data collection, due to the different dimensions obtained for different indexes, a de-dimensionalized treatment was needed, using the methods of standardization, normalization, and taking the logarithm, etc. [27,28,29] The dataset contained forward indexes and backward indexes, as well as positive numbers and negative numbers. Therefore, when the range of application of the different methods was comprehensively considered, the minmax standardized method was adopted to standardize the original data [30]. The purpose of this method is to map the raw data to the interval [0, 1]. The basic principle is to map the data to the interval [0, 1] by subtracting the minimum value from the original data, dividing by the difference between the maximum and the minimum value, and finally multiplying by 1.
For the forward indexes in the original data, the following equation was used:
X i j = [ X i j min X j ] [ max X j min X j ]
For the backward indexes in the original data, the following equation was used:
X i j = [ max X j X i j ] [ max X j min X j ]
In the formula, X i j represents the original data, X i j represents the standardized data, min represents the minimum value in the data set, and max represents the maximum value in the data set. The formula maps the raw data to an interval between 0 and 1 so that they have the same scale and range for easy data analysis and comparison.

2.3.2. Analytic Hierarchy Process (AHP)

The AHP is a decision-making analysis method put forth by T.L. Saaty in the 1970s [31]. It enables the modeling and quantification of the thinking process of decision-making in a complex system through decision-makers, and couples qualitative and quantitative methods. The method primarily stratifies the research problems and divides the problems into several levels and factors according to the characteristics and final objectives of the research. By comparing the split indexes and their degrees of importance, level-wise marks are made. The process determines the contribution of lower-level indexes to upper-level indexes and finally obtains the bottom-level index’s degree of importance to the general objectives. Generally speaking, AHP is used to set up the assessment index weights of the resilient cities. The research assessed this using the Yaahp 10.0 software.
Establishing the hierarchical structural model
To apply AHP to determine the assessment index weight, it is necessary to establish a hierarchical structural model, divide a complex problem into several factors, and form different hierarchies according to their properties and relations. The factors of the upper hierarchy should be taken as the criterion and influence the factors of the lower hierarchy. The hierarchical structure of the model is divided into three levels. The objectives layer is the purpose of the research and the problem to be solved, the criteria layer is the factor to be considered, and the sub-criteria layer is the influence factor that forms the influence factor. This study divided the resilient city assessment index system into a hierarchy containing the objectives, criteria, and sub-criteria (Figure 3).
Establishing the evaluation matrix for each hierarchy
According to Saaty, the evaluation matrix refers to the matrix showing the importance of the factors in the assessment hierarchy compared to a factor of the upper hierarchy according to each pair, for instance, by comparing the degree of influence of n factors X = { X 1 , , X n } against factor Z of the upper hierarchy. Each time, two factors, x i and x j , can be taken. a i j represents the ratio of the influence of x i and x j on Z. All the comparison results are shown in the matrix A = ( a i j ) n × n . Then, A shows the pair comparison evaluation matrix of ZX, which is listed below:
A = a 11 a 12 a 13 a 1 n a 21 a 22 a 23 a 2 n a 31 a 32 a 33 a 3 n a n 1 a n 2 a n 3 a n n
In Formula (3), a n n   = 1 and a i j   = 1/ a j i . The classification standard of a i j refers to Saaty 1~9 AHP, as shown in Table 2.
The study invited 15 middle-aged and young domestic scholars focusing on urban planning, heritage conservation, human geography, and government management to sequence and mark the hierarchical indexes with 1~9 scale markers. The selection of scholars followed two criteria: first, they should have been engaged in any one of the above spheres of learning for at least five years; second, they should have published at least three academic articles on any one of the above spheres of learning on SCI/SSCI/CSSCI in the past three years. The average marks of the scholars for each index established the evaluation matrix for the index of each hierarchy for follow-up analysis.
Single hierarchical arrangement and consistency check
Single hierarchical arrangement refers to the idea that evaluation matrix A corresponds to eigenvector W of the greatest eigenvalue λ m a x . A normalization processing of the results obtained the weight value of each factor in the hierarchy. The specific operation contained three steps, as follows:
First, calculate the product M i of the factors in each line of evaluation matrix A.
M i = j = 1 n a i j
Second, calculate the n power W i of M i .
W i = M i n
Third, normalize W i to obtain the index weight Z i .
Z i = W i i = 1 n W i
After obtaining the index weight, the matrix went through a consistency check with the following specific steps:
First, calculate the greatest eigenvalue λ m a x of evaluation matrix A.
λ m a x = 1 n · i = 1 n A W i W i
Second, calculate the consistency index CI.
C I = λ m a x n n 1
Third, compare this with the average random consistency index RI table and calculate the consistency ratio CR. If CR < 0.10, evaluation matrix A is considered to be consistent.
C R = C I R I
After checking, all the values of evaluation matrix CR of the indexes in all the hierarchies used in the study were smaller than 0.10. This suggests that the rankings on all hierarchies were consistent.
Total hierarchical arrangement and consistency check
After the ranking consistency check was conducted for all hierarchies, the index weights of all hierarchies were summarized to calculate the total arrangement consistency index.
C R = i = 1 n C I i a i i = 1 n R I i a i
When CR < 0.10, it was considered that the total hierarchical arrangement results were consistent. After calculation, the CR value in the study satisfied the consistency check. This suggests that the combined weight of the assessment index of the resilient cities via AHP met the standards. The index weights and combination weights of all hierarchies are shown in Table 2.

2.3.3. The Entropy Method

The entropy evaluation method is a method to objectively assign weight to the standardized index data. Through this method, the variation degree of each index can be obtained, and the weight of each index can be obtained by calculating the information entropy, which provides the basis for the comprehensive evaluation of multiple indicators. Calculation using the entropy evaluation method can eliminate the influence of human factors to make the results of the assessment data more objective, scientific, and reasonable. In information science, entropy is a metric used to measure the degree of disorder in the system, while information is a metric used to measure the degree of order in the system. In the evaluation matrix composed of m to-be-assessed schemes and n assessment indexes, the higher the degree of data dispersion, the lower the entropy, the more information there is, and the greater the weight of the index in comprehensive assessment. Conversely, the lower the difference degree of the index value, the higher the entropy, the less information there is and the less influence it has on the assessment results. According to this property, diversity factor g j was calculated using the entropy method to correct the index weight computed with AHP. This could largely overcome the randomness and conjecture caused by subjective evaluation and could effectively eliminate overlapping information in multiple indexes. The specific procedure consisted of the following four steps:
Standardize the original data
Standardize the raw data of indicators. See Formulas (1) and (2) for the data standardization method.
Calculate the proportion p i j of the jth index of the ith research object in X i j .
P i j = X i j i = 1 m X i j
Calculate the information entropy e j of the jth index.
e j = k · i = 1 m p i j · ln p i j
In this, e j   > 0, k > 0, k = 1 ln m .
Calculate the diversity factor g j of the jth index.
Diversity factor g j means that, for the given index j, the reduced diversity of X i j means there is a smaller g j and greater entropy value e j , and less information is provided; when all the X i j were equal, e j   = 0, and index j did not have the function of assessment; the greater diversity of X i j indicates there is a smaller e j and the index of the research target has more weight. The calculation result obtained using the entropy method is exhibited in Table 4. In this, w j is the index weight obtained using the entropy method but not the final comprehensive weight.
g j = 1 e j
Calculation of the comprehensive index:
Combine the results gained from the AHP method and the entropy method to calculate the comprehensive index weight.
Calculate the correction coefficient a j .
a j = Z i · g j
Normalize a j to obtain index correction weight W j .
W j = a j j = 1 m   a j

2.3.4. The Obstacle Degree Model

The obstacle degree model is used to diagnose the obstacle factors influencing the development of objects [32]. It is necessary to find the key restrictions to further development, unravel the main factors influencing the assessment results, clarify the degree of influence of the key constraints, and provide a sound basis for making effective and reasonable policies [33]. Introducing the obstacle degree model to assessments of the resilience level of the six historical and cultural cities in east China can effectively explore the factors hindering the development of resilience in these historical and cultural cities. The obstacle degree model uses the obstacle degree index to determine the classification index and the fundamental index. The factor contribution degree indicates the contribution of a single index to the total objective and can generally be represented by, the index weights of all items. The degree of deviation of the index, Q i j , represents the gap between the actual value of the indexes and the optimal target value; the obstacle degree, M i j , represents the degree of influence for all aspects or all indexes on high-quality development. The computational formula is listed as follows:
Q i j = 1 X i j
M i j = W j × Q i j i = 1 n W j × Q i j
In the formula, X i j represents the standardized value of a single index and W j indicates the weight of the jth index.

3. Construction of the Resilience Assessment System

3.1. The Applicability of the CAS Theory in Resilience Assessments of Historical and Cultural Cities

3.1.1. Consistency of Complexity Characteristics

The urban system is an open, complex system, researched not from a single perspective but from social, economic, ecological, and environmental perspectives [34]. From the perspective of a complex system, these dimensions compose different subsystems in the complex urban system. The resilience of the urban system focuses on different dimensions (subsystems) and the interactional system comprehensively shows the entire resilience of the urban system. The CAS theory provides theoretical support for solving complexity and is widely used in system science to interpret complexity. The resilience of historical and cultural cities is complex, and the CAS theory analyzes and resolves this complexity.

3.1.2. Consistency of Adaptability Evolution

The development of historical and cultural cities adapts according to the law of adaptability evolution. According to the research of Xiao Jing and Li Heping et al., the evolution of the adaptability of historical and cultural cities is divided into five stages: emergence, development, maturity, recession, and regeneration [35], with each stage being driven by different factors. The evolution of historical and cultural cities and the changes in system resilience can reveal the development of adaptability [36]. The CAS theory stresses that the complexity of the system derives from the adaptive changes in the subjects, and CAS theory can analyze the internal mechanism of the system adaptability and help to understand the historical resilience of cities and towns.

3.1.3. Consistency of Systematic Thinking

The available research has applied CAS theory to the planning, construction, and management of resilient cities. Looking at the elements, process, and interaction of the CAS, some scholars have pointed out that attention should be paid to the element of city fragility, understanding the key processes and interactions influencing city fragility, and developing the ability to handle this element’s structure and interactions to boost urban resilience [37]. From the perspective of the complex “social-ecological” system, some scholars have used the conceptual framework of enhancing system resilience to realize sustainable development [38]. Based on the CAS theory, Chinese scholars have established the CAS resilience assessment method and developed an urban resilience degree assessment model based on system structure, system environment, and system elements [39]. The research on the protection and resilience of historical and cultural cities upholds the idea of globality from the system perspective. The CAS theory, as a third-generation system theory, aims to guide the systematicity [40].

3.2. Composition of the CAS of Historical and Cultural Cities

According to the CAS theory, this paper studied the interplay between the factors of the selected historical towns. When facing an external impact, the complex system of historical and cultural cities undergoes an internal adaptation through the interaction between internal subsystems and the internal elements of the subsystems. The historical towns with better resilience usually maintain sound operation for all factors and obtain a dynamic balance between all factors and all links. The city system based on the CAS theory is composed of economic, social, environmental, infrastructural, and institutional factors. Historical and cultural cities boast not only the property of cities and dwellings but also the property of legacy, including historical and cultural traditions, religions, and beliefs, as well as the historical and cultural systems of cities [41,42].
This study divided historical and cultural cities into several subsystems, decomposed these subsystems according to various elements (Figure 4), and analyzed the mechanism of the whole system from the perspective of the CAS. The historical and cultural city system is divided into the following six subsystems: the economic subsystem, social subsystem, environmental subsystem, infrastructural subsystem, institutional subsystem, and historical and cultural subsystem. From the perspective of historical and cultural resources, the historical and cultural system consists of historical cities, historical towns and villages (traditional villages), historical sites, historical and cultural blocks, single historical relics, and intangible cultural heritage [43].

3.3. Index System Construction

The CAS of historical and cultural cities comprises economic, social, environmental, infrastructural, institutional, and historical and cultural subsystems. From the perspective of the measurement index, numerous scholars have developed various resilience measurement methods. L. Ilmola summarized the measurement of urban resilience through investigation, current statistical data, and multiple methods [44]. A. Sharifi pointed out that urban resilience should be measured from the perspective of the urban form [45]. When establishing a framework to assess and measure historical and cultural Chinese cities, this study referred to the research of R. Patel and L. Nosal [46]. In addition to this, the present study selected the indexes according to the resilience assessment system of the Rockefeller Foundation, the 17 UN Sustainable Development Goals (SDG), and the ISO37123 Urban Resilience Index System framework [47], as well as from the six aspects of the resilience of the economic system, the resilience of the social system, the resilience of the infrastructural system, the resilience of the environmental system, the resilience of the institutions, and the resilience of the historical and cultural system. It also used the CAS of the historical and cultural cities, gave full consideration to the distinctiveness of historical and cultural cities in east China, modified the indexes to satisfy the research requirements, and finally established a resilient assessment system composed of 38 indexes for the historical and cultural cities (Table 3). Indexes A1–A5, B1, B3–B6, C1–C5, D1–D3, E1–E5, E7–E9, and F1–F9 are “forward” indexes, and indexes B2, E6, and E10 are “backward” indexes.
“Forward” indexes are indicators that represent upward or forward development and growth, and the greater the value of these indicators, the better the evaluation. The “backward” indexes have the opposite significance to the “forward” indexes. Population density indicates a higher risk of exposure for cities and the more harm to the resilience development of historical and cultural cities. The more hidden risks there are to the cultural relics protection sites, the greater the possible harm to the resilience development of historical and cultural cities. The more hidden risks there are to historical buildings, the more possible harm there is to the resilience development of historical and cultural cities.
In the 38 indexes of the index system, the population density (social resilience), the cultural relics protection sites with hidden hazards (historical and cultural resilience), and the number of historical buildings with hidden hazards (historical and cultural resilience) were backward indexes, while the other 35 were forward indexes. Cronbach’s α was adopted to conduct a credit analysis of the standardized data. The result showed Cronbach’s α = 0.831, indicating higher credit for each assessment index. Cronbach’s alpha coefficient is a measure of the reliability of a scale or test. When Cronbach’s alpha coefficient is greater than or equal to 0.7, the measuring tool is considered to have good reliability. Therefore, a further analysis could be carried out.

3.4. Weight Coefficient of Resilience Assessment System

To conduct a multi-index comprehensive assessment, the assessment methods were divided into two types according to the source of the assessment data, namely, the subjective weighting assessment method and the objective weighting assessment method [48]. The subjective weighting assessment method usually uses a qualitative method. The expert makes a subjective assessment of the indexes to determine the index weight, for instance, using AHP and the Delphi method. This is applicable to problems for which a quantitative analysis is difficult to carry out. The objective weighting assessment method determines the index weight by exploring the relationship and the degree of variation in the indexes, for instance, the Principal Component Analysis (PCA) and the entropy method. The subjective weighting method contains the advantages of systematicity and conciseness, but, concurrently, has strong subjectivity. The experts’ professional experience and scholarly attainments will influence the assessment results. When there are many assessment indexes, the experts cannot weigh the comparative importance of all the indexes according to their experience. The objective weighting method can comprehensively consider the relationship between all indexes and determine the weight according to the initial information provided by the indexes, but it cannot completely reflect the inherent importance of some key indexes. Therefore, in practical research, the two methods are usually used together. This study also adopted this strategy. Firstly, it applied the standardization method to de-dimensionalize the index data, used the analytic hierarchy process to subjectively weight the indexes, and used the entropy evaluation method to modify the subjective weight of each index and calculate the comprehensive weight. The use of the standardization method can be seen in Section 2.3.1, that of the analytic hierarchy process in Section 2.3.2, and that of the entropy evaluation method in Section 2.3.3. The index weights obtained after combination weighting are shown in Table 4.

4. Results of CAS-Based Resilience Assessment for Historical and Cultural Cities

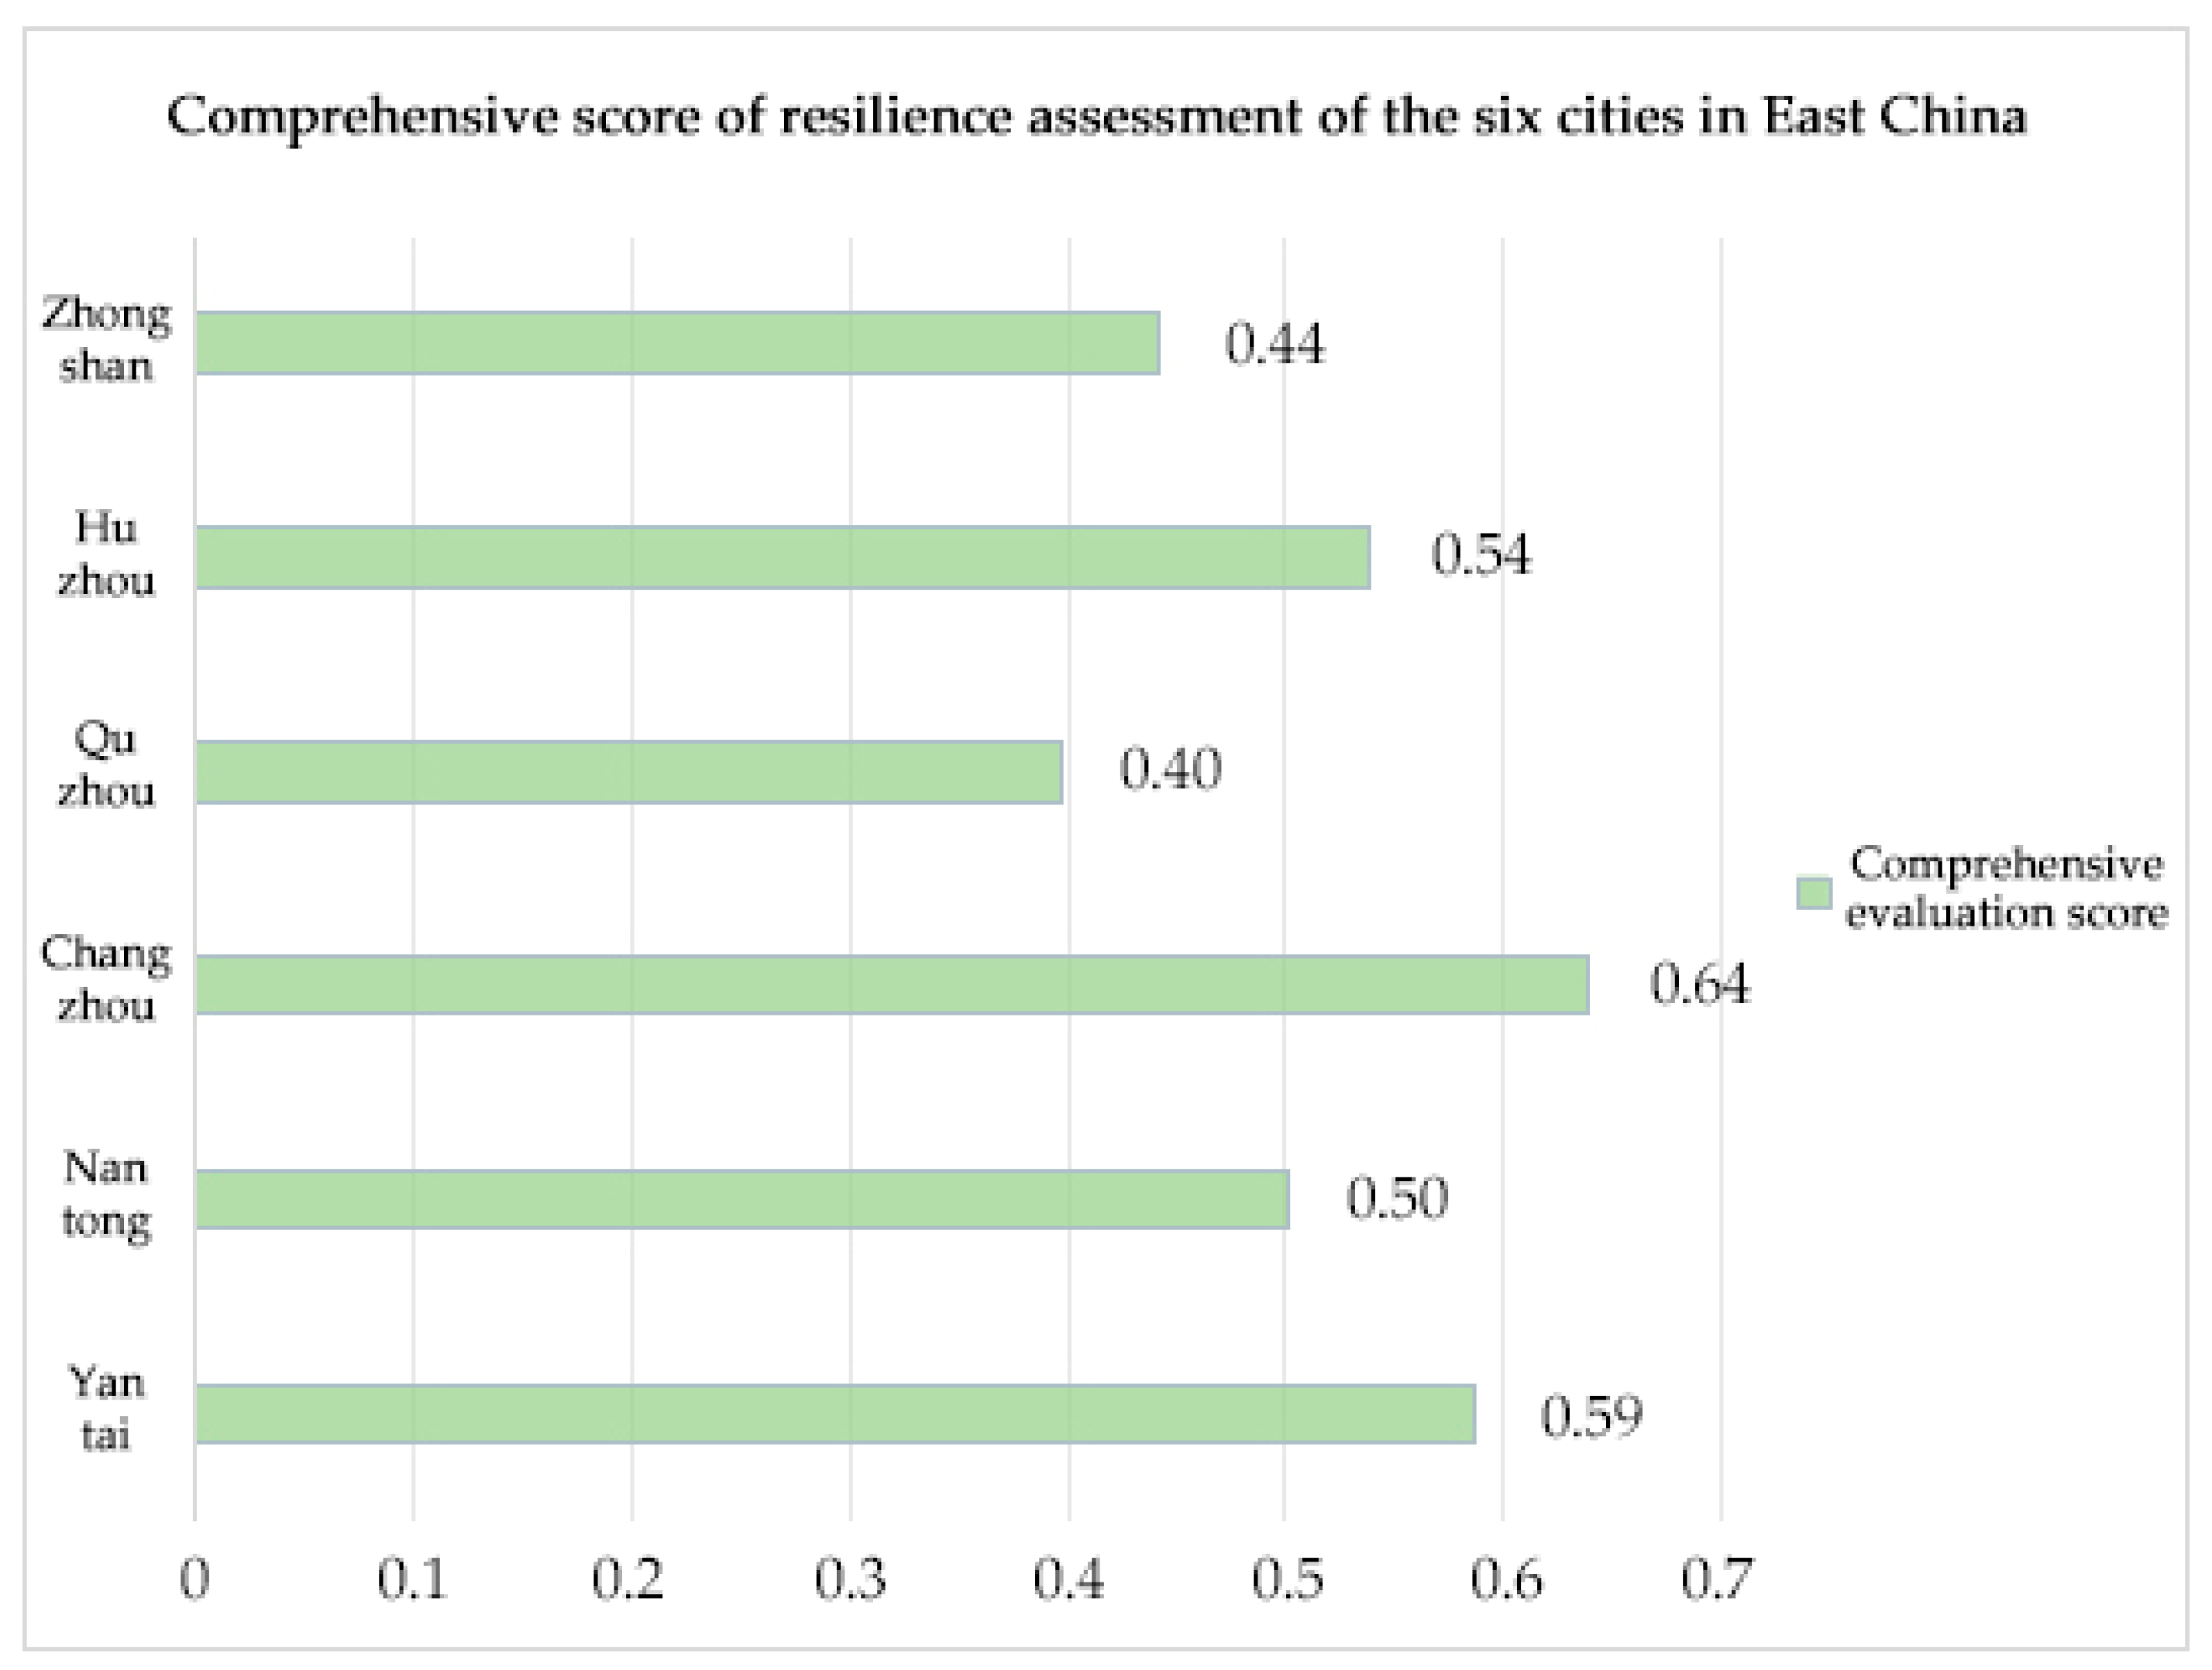
4.1. The Overall Assessment Result

The results of a resilience assessment of the six cities were calculated according to the modified index weights shown in Table 4. The research referred to the available literature and graded the city resilience using the standard deviation classification method (Table 5) [49]. According to the calculation results, a doubled standard deviation was taken as the graded gap, dividing the measurement level for risk assessment in Chinese historical and cultural cities from the perspective of resilience into five grades: low resilience, comparatively low resilience, medium resilience, comparatively high resilience, and high resilience.
Therefore, the degrees of resilience for the six historical and cultural cities in east China are different (Figure 5). According to the calculation steps of the resilience assessment index system for historical and cultural Chinese cities, the most resilient cities are as follows: Changzhou, with the highest score of comprehensive resilience at 0.64, a comparatively high degree of resilience; Yantai, the second, with a middling score of 0.59; Huzhou, the third, with a middling score of 0.54; Nantong, the fourth, with a middling score of 0.50; Zhongshan, the fifth, with a comparatively low score of 0.44; Quzhou, the last, with a comparatively low score of 0.40.

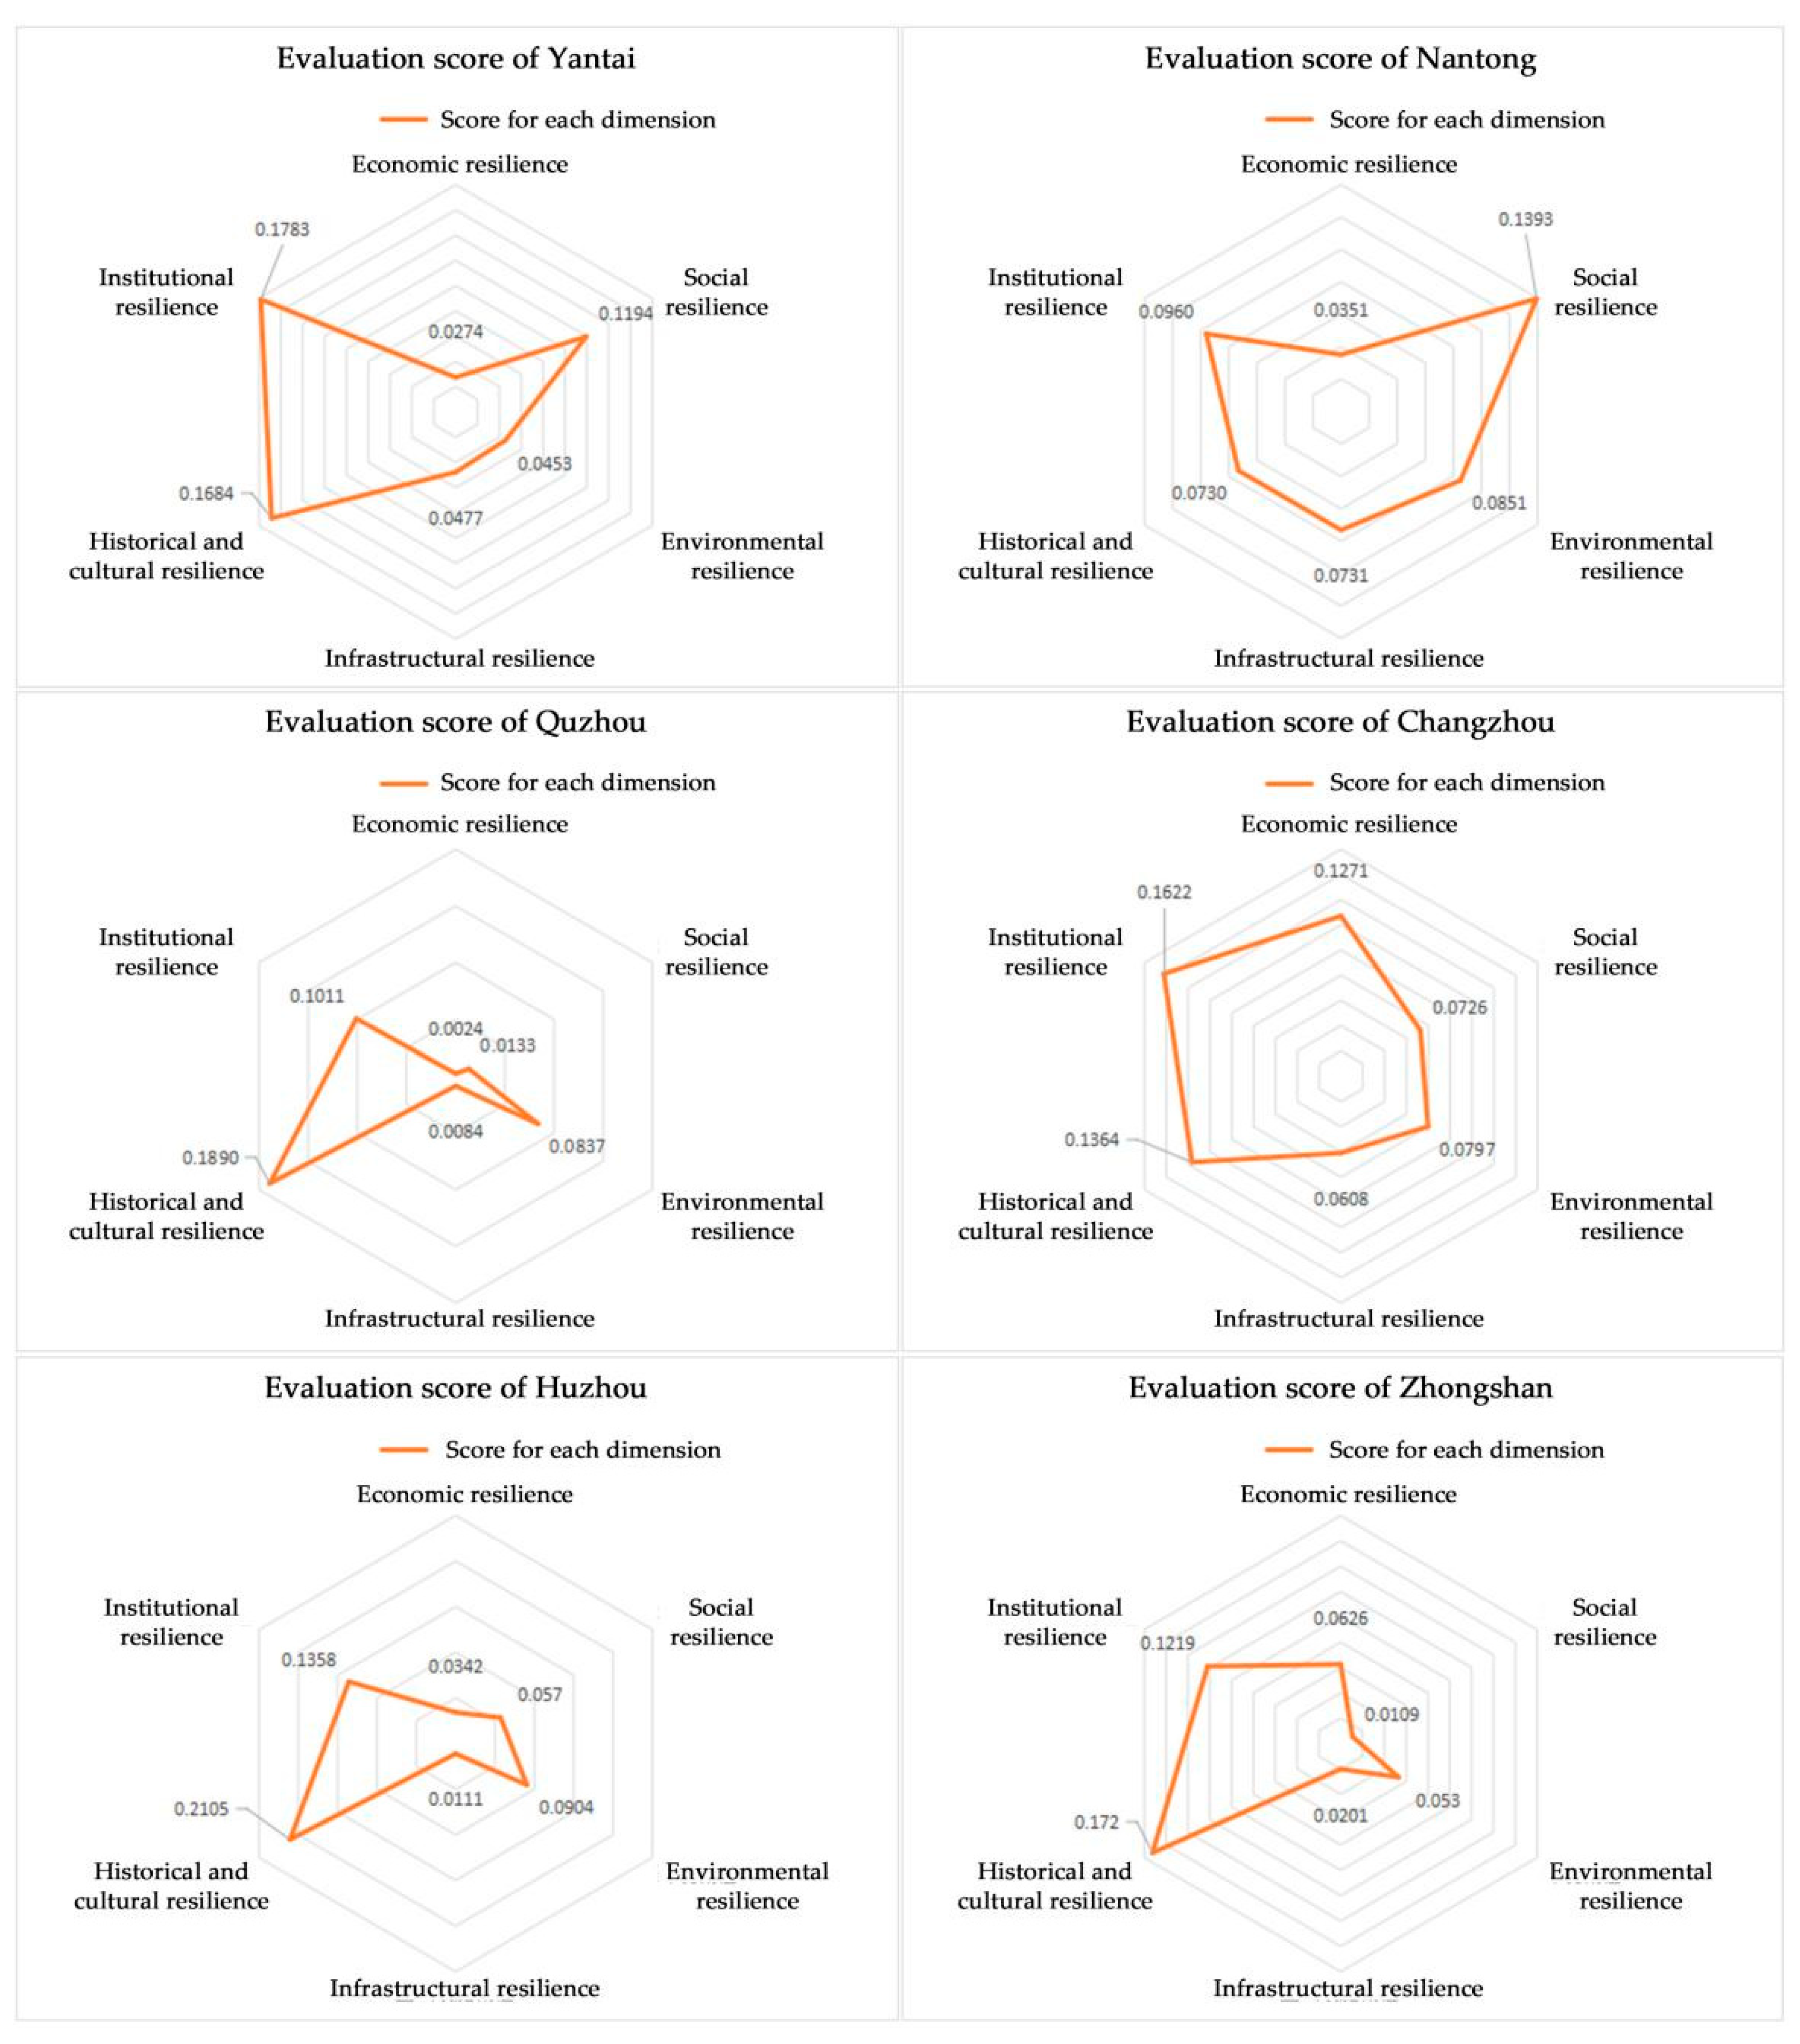
4.2. Result of Assessment in Different Dimensions

An internal vertical analysis of the cities, focusing on different dimensions, indicated that Yantai boasted advantages in terms of its institutional resilience, with a score of 0.1783, but showcased a comparatively low score for environmental resilience, with a score of 0.0453; Nantong obtained a comparatively high score for social resilience, with a score of 0.1393, but achieved a comparatively low score for economic resilience and historical and cultural resilience; Changzhou obtained an advantageous score of 0.1622 for institutional resilience but comparatively low scores of 0.0608 and 0.0726, respectively, for infrastructural resilience and social resilience; Quzhou obtained an advantageous score of 0.1890 for historical and cultural resilience but a comparatively low score of 0.0024 for economic resilience; Huzhou obtained an advantageous score of 0.2105 for historical and cultural resilience but a comparatively low score of 0.0111 for infrastructural resilience; Zhongshan obtained an advantageous score of 0.1724 for historical and cultural resilience but a comparatively low score of 0.0109 for social resilience (Figure 6).
The internal horizontal analysis of the cities according to different dimensions revealed the following: Changzhou obtained the highest score of 0.1271 for economic resilience, followed by Zhongshan, Nantong, Huzhou, Yantai, and Quzhou; in terms of social resilience, Tongzhou obtained the highest score of 0.1393 and Zhongshan the lowest, at 0.0109; in environmental resilience, Huzhou obtained the highest score of 0.0904 and Yantai the lowest, at 0.0453; in terms of infrastructural resilience, Nantong obtained the highest score of 0.0731, and Quzhou obtained the lowest score of 0.0084; in terms of historical and cultural resilience, Huzhou obtained the highest score of 0.2105 and Nantong the lowest score, at 0.0730; in terms of institutional resilience, Yantai obtained the highest score of 0.1783 and Nantong the lowest, at 0.0960 (Figure 6).

5. Discussion

5.1. Influence Factor Diagnosis Based on the Obstacle Degree Model

The obstacle degree model was used to diagnose and analyze the obstacles and degrees of obstacles hindering the resilient development of the six historical and cultural cities in east China. The use of the obstacle degree model can be seen in Section 2.3.4. Based on the comprehensive evaluation index system for the resilience of historical and cultural cities, the obstacle level was calculated at the sub-criterion level. The larger the degree of the indicated obstacle, the stronger the constraint on the improvement of urban resilience. Through an analysis of the obstacle level results, the obstacles that limit the development of the resilience of six historical and cultural cities can be accurately identified. Considering the large number of tertiary indexes, this paper calculated and sequenced the obstacle degrees of the top 15 obstacles, as follows (Table 6). The obstacle degree model uses the obstacle degree index to study the classification index and basic index. The factor contribution degree represents the contribution degree of a single indicator to the overall goal, which can generally be expressed by the weight of each indicator. The deviation degree of the index represents the gap between the actual value of the index and the optimal target value. The level of barriers represents the extent to which each aspect or indicator affects quality development (see Section 2.3.4 for the methodology). Table 6 indicates that, among the main obstacles hindering the resilient development of the six historical and cultural cities in east China, the six most frequent are as follows: A3 and A4 (the capital invested in repairing and conserving historical cities, blocks, and architecture, five times), =B3 (infrastructure coverage rate, five times), >D1 (public service facility coverage rate, four times), =A5 (per-capita GDP, four times), =A2 (urbanization level, four times), =B5 and B6 (the numbers of health workers and beds in healthcare settings, four times), and =C1 (per-capita area of parks and green land, four times). It can thus be seen that the “infrastructure coverage rate” and the “capital invested in repairing and conserving historical cities, blocks, and architectures” were the greatest obstacles, followed by the public service facility coverage rate, per-capita GDP, urbanization level, the amounts of health workers and beds in healthcare settings, and the per-capita area of parks and green land.

5.2. Influence Factor Analysis

(1) The infrastructure coverage rate and the public service facility coverage rate reflect the infrastructure facilities in a city. The more attention the construction of urban infrastructure receives, the more resilient the city, which is consistent with the research contained in the literature [20,50,51]. The infrastructure system plays an important role in guaranteeing the orderly flow of all kinds of elements. It is part of the fragility of the complex urban system and assumes the pivotal functions of guaranteeing the safe operation of the cities. Investment in and management of transportation and infrastructure can more tightly link the functions, allowing for them to support each other with a different space distribution. Complete infrastructural construction is not merely a necessary material condition for people’s lives but can also improve social and economic growth, build a more resilient urban hardware system, and hence ensure the sound development of urban resilience.
(2) The capital invested in repairing and conserving historical cities, blocks, and architecture represents the importance of history and culture in a city. The more attention a city pays to its history and culture, the higher the degree of urban resilience, which is consistent with the research in the literature [52,53]. The attention paid to history and culture can enhance a city’s historical and cultural resilience in a bid to boost the cultural resilience of the historical and cultural cities [54]. This can help a city’s cultural system or cultural community to maintain and extend its ability to stay afloat following disturbances, acute impact, or chronic pressure. Even if the city has suffered great damage, it can apply its cultural restoration capabilities to help the city excavate and revive the remaining cultural fragments and traces in the system.
(3) The per-capita GDP and the urbanization level can reflect the degree of a city’s economic growth, which can significantly boost the urban resilience. The higher a city’s economic growth level, the stronger the urban resilience, which is consistent with the research in the literature [55,56,57]. The resilience theory stresses the entire economic and social environment’s ability to adapt to and recover from risks [58]. The cities or regions with better economic growth have more economic and social resources, can more flexibly cope with complex, uncertain risk disasters, and boast the ability to take continuous precaution and resolution measures to protect against risk. In historical and cultural Chinese cities, the blocks with a higher economic growth level and more social diversity (vitality) have both a stronger ability to address various risks and a higher resilience level. Economically developed regions have a stronger ability to withstand disasters and more sufficient resources to realize rapid post-disaster recovery and rejuvenation.
(4) The numbers of health workers and beds in healthcare settings reflect a city’s social medical treatment and public health levels. The cities boasting higher levels of social medical treatment and public health have better urban resilience, which is consistent with the research in the literature [59,60]. Public health emergencies have increasingly become prominent urban problems. The Active Design Guidelines: Promoting Physical Activity and Health in Design was proposed by the New York Municipal Government in 2010 to create a healthy environment through planning and design. After this, in the development plans for many American cities, the idea of “resilience” was introduced to urban construction, which stressed the importance of public health in the sound operation of cities. The social and medical health resources of cities are important forces of post-disaster aid, and a complete social health system guarantees timely and orderly post-disaster aid and recovery. A higher proportion of health workers and beds in healthcare settings ensures that a city has a higher level of medical treatment and better public health, and a stronger ability to address risks. The cities with higher medical treatment and public health levels have greater risk awareness and better disaster prevention [61].
(5) The per-capita area of parks and green land reflects a city’s ecological environment. A higher urban ecological environment level promises a higher degree of urban resilience, which is consistent with the research in the literature [62]. The small green belts and wetland parks in cities can provide a good sensory experience while detaining and absorbing the polluting particulate matters. Road surfaces after rain have many nitrogen, sulfur, and phosphorus elements that are pollutants, but they also contain nutrient substances that are good for plant growth. This helps to improve the ecological environment and cities’ resilience.

6. Conclusions

With the theoretical support of the CAS theory, this paper adopted the standardization method, the analytic hierarchy process, the entropy evaluation method, and the obstacle degree method to analyze the resilience mechanisms in the CAS of historical and cultural cities, and it established a resilience assessment system composed of 38 assessment indexes to determine the CAS of historical and cultural cities. These were composed of the six subsystems of economy, society, environment, infrastructure, institution, and history and culture. Moreover, this paper evaluated the resilience of six historical and cultural cities, namely, Yantai, Changzhou, Nantong, Quzhou, Huzhou, and Zhongshan, and researched the factors influencing the resilience of the historical and cultural cities and the means by which they do this. The resilience assessment system constructed in this research includes not only conventional indexes that affect the resilience of all cities but also some indexes unique to historical and cultural cities. Thus, this assessment system is suitable for evaluating the resilience of cities with historical and cultural characteristics. The empirical application of this assessment system demonstrated how it could be applied to the resilient construction practice of historical and cultural cities. So, the study of this paper is limited to the assessment of resilience of cities with historical culture.
Through a resilience assessment of six historical and cultural cities in east China, this study established a national historical and cultural city resilience assessment index system and obtained the following conclusions: (1) The comprehensive resilience of Changzhou obtained the highest score at 0.64, indicating a higher degree of resilience; the scores of Yantai, Huzhou, and Nantong were 0.59, 0.54, and 0.50, respectively, representing moderate degrees of resilience; and the scores of Zhongshan and Quzhou were 0.44 and 0.40, respectively, exhibiting a lower degree of resilience. (2) Using the obstacle degree model, the paper found that the main obstacles influencing the resilience of the six historical and cultural cities in east China were the “infrastructure coverage rate”, the “public service facility coverage rate”, the “investment in repairing and protecting historical cities, blocks, and buildings”, the “per-capita GDP”, the “urbanization level”, the “number of health workers”, the “number of beds in hospitals” and the “per-capita green area in parks”.
With the theoretical support of the CAS theory, this paper researched the resilience of historical and cultural cities, setting up a comprehensive resilience assessment method system that can effectively evaluate the resilience of historical and cultural cities, and concurrently boasts universal significance in providing technical support for the sustainable development of historical and cultural cities. Furthermore, the resilience evaluation system of historical and cultural cities established in this paper can reflect the resilience and weakness of the historical and cultural cities in the case study, and can guide the development of resilience of historical and cultural cities in a targeted way, which has certain feasibility. The resilience of historical and cultural cities is a complex and systematic issue. The resilience of historical and cultural cities varies in different regions and among different types of cities. It is expected that future scholars will propose more scientific insights and research methods, so as to promote the research on the resilience of historical and cultural cities and promote their sustainable development.

Author Contributions

Conceptualization, T.C. and G.B.; methodology, T.C. and G.B.; software, T.C.; validation, Z.W.; formal analysis, T.C. and G.B.; investigation, T.C.; resources, T.C. and G.B.; data curation, G.B.; writing—original draft preparation, T.C.; writing—review and editing, G.B.; visualization, T.C. and Z.W.; supervision, G.B.; project administration, G.B.; funding acquisition, T.C. All authors have read and agreed to the published version of the manuscript.

Funding

This research was funded by the Guangzhou Collaborative Innovation Center of Natural Resources Planning and Marine Technology (No. 2023B04J0301), the Key-Area Research and Development Program of Guangdong Province (No. 2020B0101130009),the Guangdong Enterprise Key Laboratory for Urban Sensing, Monitoring and Early Warning (No. 2020B121202019), and the Science and Technology Foundation Project, Guangzhou Urban Planning & Design Survey Research Institute Co., Ltd. (RD12220202057).

Data Availability Statement

Data derived from the current study can be provided to the readers based on their explicit request.

Conflicts of Interest

The authors declare no conflicts of interest.

References

  1. Zheng, Y.; Xie, X.-L.; Lin, C.-Z.; Wang, M.; He, X.-J. Development as Adaptation: Framing and Measuring Urban Resilience in Beijing. Adv. Clim. Chang. Res. 2018, 9, 234–242. [Google Scholar] [CrossRef]
  2. Philibert Petit, E. Smart City Technologies plus Nature-Based Solutions: Viable and Valuable Resources for Urban Resilience. In Smart Cities Policies and Financing; Elsevier: Amsterdam, The Netherlands, 2022; pp. 377–398. ISBN 978-0-12-819130-9. [Google Scholar]
  3. Jabareen, Y. Planning the Resilient City: Concepts and Strategies for Coping with Climate Change and Environmental Risk. Cities 2013, 31, 220–229. [Google Scholar] [CrossRef]
  4. Naphade, M.; Banavar, G.; Harrison, C.; Paraszczak, J.; Morris, R. Smarter Cities and Their Innovation Challenges. Computer 2011, 44, 32–39. [Google Scholar] [CrossRef]
  5. World Commission on Environment and Development. Our Common Future; Oxford University Press: Oxford, UK, 1987; ISBN 9780192820808. [Google Scholar]
  6. Shao, Y.; Hu, L.J.; Zhao, J.; Chen, H. A Research on the Conservation Plan of the Human-Habitat World Heritage: Case Study of Pingyao Ancient City. Urban Plan. Forum 2016, 5, 94–102. (In Chinese) [Google Scholar]
  7. Shao, Y.; Chen, Y. Developing the Conservation and Design Guidelines for Historic Cities: The Case of Pingyao. Urban Plan. Forum 2020, 6, 102–109. (In Chinese) [Google Scholar]
  8. Ahern, J. From Fail-Safe to Safe-to-Fail: Sustainability and Resilience in the New Urban World. Landsc. Urban Plan. 2011, 100, 341–343. [Google Scholar] [CrossRef]
  9. Li, H. A Historical Survey of the Establishment Process and Ideological Origin of the National Historical and Cultural City System in 1982: On the Puzzlement of the Proponent of the Famous City System. Architect 2023, 2, 112–122. (In Chinese) [Google Scholar]
  10. Lan, W.J.; Hu, M.; Zhao, Z.S. Review, Feature Analysis and Prospect of the Historic City Conservation System. Urban Plan. Forum 2019, 2, 30–35. (In Chinese) [Google Scholar]
  11. Zhang, G.H.; Chen, B. The Chinese Experience of Historic City Protection: Forty Years of Historical and Cultural City System. China Anc. 2023, 37, 3–7. (In Chinese) [Google Scholar]
  12. Cutter, S.L.; Ash, K.D.; Emrich, C.T. The Geographies of Community Disaster Resilience. Glob. Environ. Chang. 2014, 29, 65–77. [Google Scholar] [CrossRef]
  13. Norris, F.H.; Stevens, S.P.; Pfefferbaum, B.; Wyche, K.F.; Pfefferbaum, R.L. Community Resilience as a Metaphor, Theory, Set of Capacities, and Strategy for Disaster Readiness. Am. J. Comm. Psychol. 2008, 41, 127–150. [Google Scholar] [CrossRef]
  14. Wilson, G. Community Resilience and Environmental Transitions, 1st ed.; Routledge: New York, NY, USA; London, UK, 2011; ISBN 978-1-84971-151-7. [Google Scholar]
  15. Berkes, F. Understanding Uncertainty and Reducing Vulnerability: Lessons from Resilience Thinking. Nat. Hazards 2007, 41, 283–295. [Google Scholar] [CrossRef]
  16. Djalante, R.; Holley, C.; Thomalla, F. Adaptive Governance and Managing Resilience to Natural Hazards. Int. J. Disaster Risk Sci. 2011, 2, 1–14. [Google Scholar] [CrossRef]
  17. Batabyal, A.A. The Concept of Resilience: Retrospect and Prospect. Environ. Dev. Econ. 1998, 3, 221–262. [Google Scholar] [CrossRef]
  18. Adger, W.N. Social and Ecological Resilience: Are They Related? Prog. Hum. Geogr. 2000, 24, 347–364. [Google Scholar] [CrossRef]
  19. Godschalk, D.R. Urban Hazard Mitigation: Creating Resilient Cities. Nat. Hazards Rev. 2003, 4, 136–143. [Google Scholar] [CrossRef]
  20. Karamouz, M.; Zahmatkesh, Z. Quantifying Resilience and Uncertainty in Coastal Flooding Events: Framework for Assessing Urban Vulnerability. J. Water Resour. Plann. Manag. 2017, 143, 04016071. [Google Scholar] [CrossRef]
  21. Bozza, A.; Asprone, D.; Manfredi, G. Developing an Integrated Framework to Quantify Resilience of Urban Systems against Disasters. Nat. Hazards 2015, 78, 1729–1748. [Google Scholar] [CrossRef]
  22. Chou, B.X. The “Characteristics” of Characteristic Towns Should Have Breadth and Depth. Archit. Des. Manag. 2017, 4, 46–49. [Google Scholar]
  23. Liao, J.; Le, S. Social Construction of Cultural Identity Vulnerability in Ancient Town and Its Significance: A New Mode of Pluralistic Discourse Analysis. Sci. Geogr. Sin. 2014, 34, 840–847. (In Chinese) [Google Scholar]
  24. Cutter, S.L.; Barnes, L.; Berry, M.; Burton, C.; Evans, E.; Tate, E.; Webb, J. A Place-Based Model for Understanding Community Resilience to Natural Disasters. Glob. Environ. Chang. 2008, 18, 598–606. [Google Scholar] [CrossRef]
  25. Keller, A.; Chieffo, N.; Opritescu, E. Resilience of historic cities and adaptation to climate change. Urban. Arhit. Constr. 2017, 8, 15–26. [Google Scholar]
  26. Bui, H.T.; Jones, T.E.; Weaver, D.B.; Le, A. The Adaptive Resilience of Living Cultural Heritage in a Tourism Destination. J. Sustain. Tour. 2020, 28, 1022–1040. [Google Scholar] [CrossRef]
  27. Renukadevi, P.; Rajiv Kannan, A. COVID-19 Forecasting with Deep Learning-Based Half-Binomial Distribution Cat Swarm Optimization. Comput. Syst. Sci. Eng. 2023, 44, 629–645. [Google Scholar] [CrossRef]
  28. Ba, J.L.; Kiros, J.R.; Hinton, G.E. Layer Normalization. arXiv 2016, arXiv:1607.06450. [Google Scholar]
  29. Ulyano, D.; Vedald, A.; Lempitsky, V.S. Instance normalization:the missing ingredient for fast stylization. arXiv 2016, arXiv:1607.08022. [Google Scholar]
  30. García, S.; Luengo, J.; Herrera, F. Data Preprocessing in Data Mining; Springer International Publishing: Berlin/Heidelberg, Germany, 2015; ISBN 9783319102467. [Google Scholar]
  31. Saaty, T.L. What Is the Analytic Hierarchy Process? In Mathematical Models for Decision Support; Springer: Berlin/Heidelberg, Germany, 1988. [Google Scholar]
  32. Qi, W.P.; Wang, Y.H.; Wan, Y. Multi-objective development evaluation of poverty- stricken households based on G-TOPSIS model: A case study from Fugong county, Yunnan province. Prog. Geogr. 2020, 39, 1024–1036. [Google Scholar] [CrossRef]
  33. Jin, H.F.; Shi, D.M.; Zhong, Y.J. Diagnosis of Obstacle Factors and Degradation Characteristics of Cultivated-Layer Quality for Red Soil Sloping Farmland. Trans. Chin. Soc. Agric. Eng. 2019, 35, 84–93. [Google Scholar]
  34. John, H.H. Hidden Order: How Adaptation Builds Complexity; Shanghai Scientific and Technological Education Publishing House: Shanghai, China, 2018; ISBN 978-7-5428-6911-1. [Google Scholar]
  35. Xiao, J.; Cao, K.; Li, H.P. The Evolution Laws and Layering Management Methodologies of Historic Urban Landscape. Urban Dev. Stud. 2018, 25, 11. (In Chinese) [Google Scholar]
  36. Li, J.Y.; Sun, C.; Zheng, X. Assessment of Spatiotemporal Evolution of Regionally Ecological Risks Based on Adaptive Cycle Theory: A Case Study of Yangtze River Delta Urban Agglomeration. Acta Ecol. Sin. 2021, 41, 2609–2621. (In Chinese) [Google Scholar]
  37. Desouza, K.C.; Flanery, T.H. Designing, Planning, and Managing Resilient Cities: A Conceptual Framework. Cities 2013, 35, 89–99. [Google Scholar] [CrossRef]
  38. Nyström, M.; Jouffray, J.-B.; Norström, A.V.; Crona, B.; Søgaard Jørgensen, P.; Carpenter, S.R.; Bodin, Ö.; Galaz, V.; Folke, C. Anatomy and Resilience of the Global Production Ecosystem. Nature 2019, 575, 98–108. [Google Scholar] [CrossRef] [PubMed]
  39. Chen, Z.D.; Chou, B.X.; Chen, H. Research on Resiliency Resilient City System: From Level Promotion and Robustness Strategy of Complex Adaptive Sys-Tems(CAS) Perspective. Urban Dev. Opment. Stud. 2021, 28, 1–9. (In Chinese) [Google Scholar]
  40. Christopher, A. The Timeless Way of Building; Intellectual Property Press: Beijing, China, 2002; ISBN 978-7-80011-627-8. [Google Scholar]
  41. Jacobs, J. The Death and Life of Great Ameircan Cities; Random House: New York, NY, USA, 1961. [Google Scholar]
  42. Forman, R.; Godron, M. Landscape Ecology; Science Press: Beijing, China, 1996; pp. 50–55. ISBN 9787030029140. [Google Scholar]
  43. Larkham, P.J. Planning History and Everyday Urban Change: An Appreciation of J.W.R. Whitehand (1938–2021). Plan. Perspect. 2022, 37, 205–209. [Google Scholar] [CrossRef]
  44. Ilmola, L. Approaches to Measurement of Urban Resilience. In Urban Resilience; Springer: Berlin/Heidelberg, Germany, 2016. [Google Scholar]
  45. Sharifi, A. Resilient Urban Forms: A Macro-Scale Analysis. Cities 2019, 85, 1–14. [Google Scholar] [CrossRef]
  46. Patel, R.; Nosal, L. Defining the Resilient City. In United Nations University Centre for Policy Research Working Paper; United Nations University Centre for Policy Research: New York, NY, USA, 2016. [Google Scholar]
  47. Hofmann, S.Z. 100 Resilient Cities Program and the Role of the Sendai Framework and Disaster Risk Reduction for Resilient Cities. Prog. Disaster Sci. 2021, 11, 100189. [Google Scholar] [CrossRef]
  48. Wang, D.j.; Zhou, Q.M.; Chang, Z.L. A New Multiple Indicator Comprehensive Evaluation Method. Stat. Decis. 2007, 7, 137–138. (In Chinese) [Google Scholar]
  49. Li, Y.; Zhai, G.F. China’s Urban Disaster Resilience Evaluation and Promotion. Planners 2017, 33, 5–11. (In Chinese) [Google Scholar]
  50. Bahena-Ayala, R.; ArreguÍN-CortÉS, F.I.; Cervantes-Jaimes, C.E. Assessing Resilience of Cities to Hydrometeorological Hazards. Tecnol. Cienc. Agua 2021, 12, 192–260. [Google Scholar] [CrossRef]
  51. Joerin, J.; Shaw, R.; Takeuchi, Y.; Krishnamurthy, R. The Adoption of a Climate Disaster Resilience Index in Chennai, India. Disasters 2014, 38, 540–561. [Google Scholar] [CrossRef]
  52. Dai, S.; Xu, H.; Chen, F. A Hierarchical Measurement Model of Perceived Resilience of Urban Tourism Destination. Soc. Indic. Res. 2019, 145, 777–804. [Google Scholar] [CrossRef]
  53. Gaber, R.M.; El-Kader, M.H.A.; Okba, E.M. Assessment of Urban Resilience Through the Development of an Urban Resilience Assessment Model (Resilience Perfor-Mance Index). Int. J. Eng. Res. Technol 2019, 12, 2423–2430. [Google Scholar] [CrossRef]
  54. Fabbricatti, K.; Biancamano, P.F. Circular Economy and Resilience Thinking for Historic Urban Landscape Regeneration: The Case of Torre Annunziata, Naples. Sustainability 2019, 11, 3391. [Google Scholar] [CrossRef]
  55. Bănică, A.; Muntele, I. Urban Transitions and Resilience of Eastern European Union Cities. East. J. Eur. Stud. 2017, 8, 45–69. [Google Scholar]
  56. Cutter, S.L.; Burton, C.G.; Emrich, C.T. Disaster Resilience Indicators for Benchmarking Baseline Conditions. J. Homel. Secur. Emerg. Manag. 2010, 7. [Google Scholar] [CrossRef]
  57. Razafindrabe, B.H.N.; Parvin, G.A.; Surjan, A.; Takeuchi, Y.; Shaw, R. Climate Disaster Resilience: Focus on Coastal Urban Cities in Asia. Asian J. Environ. Disaster Manag. (AJEDM) 2009, 1, 101. [Google Scholar] [CrossRef]
  58. Moghadas, M.; Asadzadeh, A.; Vafeidis, A.; Fekete, A.; Kötter, T. A Multi-Criteria Approach for Assessing Urban Flood Resilience in Tehran, Iran. Int. J. Disaster Risk Reduct. 2019, 35, 101069. [Google Scholar] [CrossRef]
  59. Ghasemzadeh, B.; Zarabadi, Z.S.S.; Majedi, H.; Behzadfar, M.; Sharifi, A. A Framework for Urban Flood Resilience Assessment with Emphasis on Social, Economic and Institutional Dimensions: A Qualitative Study. Sustainability 2021, 13, 7852. [Google Scholar] [CrossRef]
  60. Shi, Y.; Zhai, G.; Xu, L.; Zhou, S.; Lu, Y.; Liu, H.; Huang, W. Assessment Methods of Urban System Resilience: From the Perspective of Complex Adaptive System Theory. Cities 2021, 112, 103141. [Google Scholar] [CrossRef]
  61. Wang, Z.; Han, Z.; Liu, L.; Yu, S. Place Attachment and Household Disaster Preparedness: Examining the Mediation Role of Self-Efficacy. IJERPH 2021, 18, 5565. [Google Scholar] [CrossRef]
  62. Abdrabo, M.A.; Hassaan, M.A. An Integrated Framework for Urban Resilience to Climate Change—Case Study: Sea Level Rise Impacts on the Nile Delta Coastal Urban Areas. Urban Clim. 2015, 14, 554–565. [Google Scholar] [CrossRef]
Figure 1. Research framework and systematic thinking.
Land 13 00483 g001
Figure 2. Six famous historical and cultural cities in eastern China (Yantai, Nantong, Changzhou, Huzhou, Quzhou, Zhongshan).
Land 13 00483 g002
Figure 3. Hierarchical structural model of the resilience of historical and cultural Chinese cities.
Land 13 00483 g003
Figure 4. The resilience mechanism of the complex system of historical and cultural cities.
Land 13 00483 g004
Figure 5. Comprehensive score of the resilience assessment for six cities in east China.
Land 13 00483 g005
Figure 6. Scores of resilience assessments of the six historical and cultural cities in east China in different dimensions.
Land 13 00483 g006
Table 1. Characteristics of the six historical and cultural cities in east China.
CityProvinceEstablished as a Historical and Cultural City TimeUrban Area SituationUrban Population SizeHistorical and Cultural Characteristics
Yantai (1)Shandong2013The total area of Yantai is 13,930 km2.Housing 7.05 million permanent residents at the end of 2022.It was one of China’s earliest treaty ports and one of the origins of China’s modern national industry and commerce, boasting a long history and profound cultural deposits.
Nantong (2)Jiangsu2009The total area of Nantong is 8001 km2.Housing 7.74 million permanent residents at the end of 2022.This was a pivotal link between the Grand Canal system and the Maritime Silk Road, playing a vital historical role in China’s foreign trade, transportation, and transshipment, as well as exchanges with Japan and South Korea in ancient times.
Changzhou (3)Jiangsu2015The total area of Changzhou is 4385 km2.Housing 5.36 million permanent residents at the end of 2022.This was Yancheng, one of China’s earliest paddy field agricultural, economic, and cultural zones, as well as containing the unique ruins of the complete structure of an ancient city from the Spring and Autumn Period.
Huzhou (4)Zhejiang2014The total area of Huzhou is 5820 km2.Housing 3.41 million permanent residents at the end of 2022.This is an ancient city more than 2300 years old. Duke Chunshen of the Chu State in the Warring States Period was granted this land and built walls there.
Quzhou (5)Zhejiang1994The total area of Quzhou is 8844 km2.Housing 2.55 million permanent residents at the end of 2022.This was the ancestral home and the second homeland of Sage Confucius’s descendants, boasting large numbers of outstanding Confucians and enjoying the reputation of being the “hometown of Sage Confucius”.
Zhongshan (6)Guangdong2011The total area of Zhongshan is 1783 km2.Housing 4.43 million permanent residents at the end of 2022.In the course of historical development, Zhongshan City has a strategic position of “controlling the sea, suppressing the foreigners, and defending as the portal to Guangdong”.
Note: The data in the table are 2022 statistics.
Table 2. Saaty 1~9 AHP and their meanings.
Scale ValueMeaning
1The two compared indexes are of equal importance.
3The former of the two indexes is slightly more important.
5The former of the two indexes is significantly more important.
7The former of the two indexes is much more important.
9The former of the two indexes is extremely more important.
2, 4, 6, 8The median of the neighboring figures as judged
ReciprocalThe importance of the latter compared with the former
Table 3. The resilience assessment and measurement index system for historical and cultural Chinese cities.
Primary IndexSecondary IndexTertiary IndexUnitIndex Property
CAS resilience assessment and measurement of historical and cultural Chinese citiesEconomic resilience = APer-capita disposable income of urban residents = A1Yuanquantitative
Urbanization level = A2%quantitative
The capital investment in improving the infrastructure and public service facilities in historical cities and historical and cultural blocks in the last three years = A310,000 yuanquantitative
Please list the capital investment in historical architecture conservation and repair projects in the last three years (if any) = A410,000 yuanquantitative
Per-capita GDP = A5yuanquantitative
Social resilience = BRatio of population with college education and without high school education = B1%quantitative
Population density = B2person/km2quantitative
Number of sports or art troupes per 10,000 people = B3pcsquantitative
Number of libraries = B4pcsquantitative
Number of health workers = B510,000 peoplequantitative
Number of beds in health institutions = B6pcsquantitative
Environmental resilience = CPer-capita area of parks and green land = C1m2quantitative
The greening rate = C2%quantitative
The industrial solid wastes treatment rate = C3%quantitative
The sewage treatment rate = C4%quantitative
Harmless treatment rate of municipal solid wastes = C5%quantitative
Infrastructural resilience = DThe public service facility coverage rate = D1%quantitative
The infrastructure coverage rate = D2%quantitative
Per-capita urban road area = D3m2quantitative
Historical and cultural resilience = EHistorical cityscape and townscape protection = E1/qualitative
Total area of protected historical and cultural blocks = E2ha.quantitative
Proportion of signboards in historical and cultural blocks = E3%quantitative
Proportion of conserved and repaired cultural relics protection sites = E4%quantitative
Proportion of cultural relics protection sites for adaptive use = E5%quantitative
Number of cultural relics protection sites with hidden hazards = E6pcsquantitative
Total area of historical buildings = E7m2quantitative
Proportion of conserved and repaired historical buildings = E8%quantitative
Proportion of historical buildings of adaptive use = E9%quantitative
Number of historical buildings with hidden hazards = E10pcsquantitative
Institutional resilience = FConservation planning formulation for historical and cultural cities = F1/qualitative
Proportion of the amount of conservation planning for historical and cultural blocks going through formulation approval = F2%quantitative
Conservation planning formulation for historical and cultural towns = F3/qualitative
Conservation planning formulation for historical and cultural villages (traditional villages) = F4/qualitative
Intangible cultural heritage conservation = F5/qualitative
Setup of historical and cultural cities’ conservation administration = F6/qualitative
Number of local laws and regulations, administrative regulations and rules, and technical standards for historical and cultural cities’ conservation = F7pcsquantitative
Establishment of a long-term conservation mechanism for historical and cultural cities = F8/qualitative
Situation of disaster emergency organization, pre-arranged planning and routine drilling = F9/qualitative
Note: The historical and cultural blocks in the table refer to the blocks containing cultural relics or blocks that can comparatively completely reflect the traditional features of a historical period and the local ethnic features. The names were released by the Ministry of Housing and Urban–Rural Development of the People’s Republic of China and the National Cultural Heritage Administration; cultural relic protection sites refer to the units set up by the local government to protect cultural relics such as sites of ancient culture, ancient tombs, ancient architectures, stone cave temples, and stone carvings, whose names were released by the National Cultural Heritage Administration. Historical architectures, although not cultural relic protection sites, refer to the buildings and structures that boast some protection value, which were determined and released by the municipal or county people’s governments. The names of those that can reflect historical features and local characteristics were released by the Ministry of Housing and Urban–Rural Development of the People’s Republic of China. The “/” in the table indicates that there are no dot units.
Table 4. The results of modified index weights in a resilience assessment of historical and cultural Chinese cities.
The Weights Gained from AHPThe Weights Gained from the Entropy Evaluation Method Modified   Weights
Secondary IndexTertiary IndexWeightInformation
Entropy
ej
Diversity Factor
gj
Weight
Coefficient
wj
Correction Factor
aj
Correction Weight
Wj
Economic resilienceA10.0170.6340.3660.0240.0060.016
A20.0600.6840.3160.0210.0190.048
A30.0280.2470.7530.0490.0210.053
A40.0270.7310.2690.0170.0070.018
A50.0130.6890.3110.0200.0040.010
Social resilienceB10.0170.6650.3350.0220.0060.014
B20.0080.5650.4350.0280.0030.008
B30.0110.1600.8400.0540.0090.024
B40.0140.7060.2940.0190.0040.011
B50.0550.6290.3710.0240.0200.052
B60.0550.5540.4460.0290.0250.062
Environmental resilienceC10.0110.6130.3870.0250.0040.011
C20.0200.7180.2820.0180.0060.014
C30.0490.7330.2670.0170.0130.033
C40.0330.7330.2670.0170.0090.023
C50.0220.7330.2670.0170.0060.015
Infrastructural resilienceD10.0280.6940.3060.0200.0080.022
D20.0440.6180.3830.0250.0170.043
D30.0120.6940.3060.0200.0040.009
Historical and cultural resilienceE10.0390.3230.6770.0440.0270.068
E20.0130.6440.3560.0230.0050.012
E30.0110.7330.2670.0170.0030.007
E40.0250.4750.5250.0340.0130.033
E50.0180.6280.3720.0240.0070.017
E60.0250.4710.5290.0340.0130.034
E70.0130.6420.3580.0230.0050.012
E80.0240.6290.3710.0240.0090.023
E90.0280.6460.3550.0230.0100.025
E100.0170.0180.9820.0640.0170.043
Institutional resilienceF10.0170.6130.3870.0250.0060.017
F20.0140.7330.2670.0170.0040.010
F30.0140.4210.5790.0380.0080.021
F40.0140.6250.3750.0240.0050.014
F50.0130.6090.3910.0250.0050.013
F60.0730.7260.2740.0180.0200.051
F70.0340.5920.4080.0260.0140.035
F80.0360.5560.4440.0290.0160.041
F90.0500.6790.3210.0210.0160.041
Table 5. The CAS-based resilience assessment criteria for historical and cultural cities.
TypeAssessment Criterion
Low resilience0.0–0.2
Comparatively low resilience0.2–0.4
Medium resilience0.4–0.6
Comparatively high resilience0.6–0.8
High resilience0.8–1.0
Table 6. Diagnosis of the obstacles hindering the resilient development of the six historical and cultural cities in east China. (The factors labeled with the same color in the figure represent the influencing factors in the same category).
City/Obstacle FactorYantaiNantongChangzhouQuzhouHuzhouZhongshan
1C4 (7.722)A3 (0.075)C4 (3.393)C3 (8.913)D3 (0.110)D2 (0.063)
2C2 (0.086)A4 (0.071)C1 (0.082)E10 (2.621)D2 (0.100)D3 (0.063)
3C3 (0.086)B3 (0.063)B3 (0.068)D2 (0.087)D1 (0.074)C5 (0.049)
4A1 (0.086)A5 (0.055)D1 (0.059)D1 (0.087)A3 (0.066)C4 (0.049)
5A3 (0.083)F3 (0.042)F3 (0.047)A2 (0.052)A4 (0.063)C1 (0.049)
6D2 (0.075)F4 (0.042)F8 (0.047)A3 (0.052)B6 (0.049)A5 (0.049)
7B3 (0.072)F5 (0.042)F1 (0.047)A5 (0.051)A2 (0.048)A4 (0.049)
8A4 (0.064)F8 (0.042)D3 (0.044)A4 (0.050)B5 (0.045)D1 (0.047)
9A2 (0.057)A2 (0.041)E2 (0.042)A1 (0.047)F2 (0.037)A3 (0.042)
10A5 (0.043)E5 (0.038)E3 (0.042)B3 (0.044)F4 (0.037)B4 (0.040)
11E4 (0.041)E4 (0.038)E7 (0.042)B5 (0.044)F1 (0.037)B2 (0.040)
12E8 (0.039)E5 (0.038)E1 (0.042)B6 (0.044)A5 (0.036)B6 (0.040)
13E7 (0.035)E10 (0.038)B5 (0.042)B1 (0.044)B1 (0.036)B3 (0.039)
14E9 (0.033)E1 (0.038)B6 (0.039)C1 (0.037)B4 (0.034)B5 (0.035)
15F9 (0.029)C5 (0.038)E4 (0.037)F3 (0.029)C1 (0.034)B1 (0.035)
Disclaimer/Publisher’s Note: The statements, opinions and data contained in all publications are solely those of the individual author(s) and contributor(s) and not of MDPI and/or the editor(s). MDPI and/or the editor(s) disclaim responsibility for any injury to people or property resulting from any ideas, methods, instructions or products referred to in the content.

