Article

Carbon Sequestration Dynamics in Peri-Urban Forests: Comparing Secondary Succession and Mature Stands under Varied Forest Management Practices

1
National Institute for Research and Development in Forestry “Marin Drăcea”, 128 Eroilor Boulevard, 077190 Voluntari, Romania
2
Faculty of Silviculture and Forest Engineering, “Transilvania” University of Brașov, Șirul Beethoven 1, 500123 Brașov, Romania
*
Author to whom correspondence should be addressed.
Land 2024, 13(4), 492; https://doi.org/10.3390/land13040492
Submission received: 29 February 2024 / Revised: 3 April 2024 / Accepted: 8 April 2024 / Published: 10 April 2024
(This article belongs to the Special Issue Adaptive Sustainable Forest Management to Actual Societal Challenges)

Abstract

:
This study examines the impact of silvicultural and land-use management practices on carbon sequestration in peri-urban forest ecosystems, with a particular focus on human-induced carbon dynamics. The study area’s complex profile spans from a compact native forest to varying degrees of fragmentation. This included areas undergoing secondary succession forest without silvicultural interventions (No-SI) alongside sites subjected to high-intensity (High-SI) and low-intensity silvicultural interventions (Low-SI). The research assessed carbon stocks and sequestration in different carbon pools (living biomass, dead organic matter and soil) using field data, allometric equations and laboratory analysis. Findings reveal a significant correlation between the intensity of anthropogenic interventions and variations in carbon stocks. The CASMOFOR model facilitated the reconstruction of carbon stock and carbon-stock change dynamics over four decades (1980–2022), showing disparities in carbon storage capabilities linked to the structural characteristics of the sites. The Low-SI site had the highest carbon stock in all carbon pools (378 tonnes C ha−1), which is more than double compared to High-SI (161 tonnes C ha−1) or No-SI sites (134 tonnes C ha−1). However, the secondary succession forest (No-SI) demonstrated the highest annual carbon stock change (4.4 tonnes C ha−1 year−1), two times higher than the Low-SI mature stand (2.2 tonnes C ha−1 year−1), emphasising the resilience of forest ecosystems to recover and sustain carbon sequestration capacities after harvesting if forest land use remains unchanged. The study underscores the significant importance of anthropogenic interventions on carbon dynamics, especially for living tree biomass, which has consequences in enhancing carbon sequestration and contributing to emission reduction targets.

1. Introduction

According to the latest assessment report of the Intergovernmental Panel on Climate Change (IPCC) [1], greenhouse gas (GHG) emissions from human activities are the primary drivers of global temperature increases, with carbon dioxide (CO2) being a significant contributor to atmospheric changes. This escalation in CO2 levels is linked to the intensification of catastrophic environmental events, underscoring the urgency of addressing climate change [2,3,4,5]. In response, European policies, including the “fit for 55” climate package, aim to significantly reduce GHG emissions by 2050, striving for a net-zero emissions target [6].
Forests play a pivotal role in the global carbon cycle, primarily through carbon sequestration via photosynthesis, where CO2 is absorbed and stored in living biomass and the other significant fraction extent in dead organic matter and soil [7,8,9]. This process not only mitigates the rate of GHG accumulation in the atmosphere but also highlights the importance of forest management and afforestation in enhancing carbon stock changes [10]. However, the effectiveness of these practices is influenced by a multitude of factors, including biomass dynamics, forest structure, climatic conditions, and mortality rates [7,11]. On the other hand, forest management practices (FMP) and land use change in Europe over the last 250 years have contributed significantly to an increase in GHG emissions [12].
The Land Use, Land Use Change and Forestry (LULUCF) regulation provides a framework for accounting for CO2 emissions and removals related to land use and forestry activities. It emphasises the role of forests as either sources or sinks of GHGs, where land-use conversion activities are the main drivers for land emissions and a key factor influencing climate change [13]. This regulation is supported by IPCC guidelines, which offer methodologies for estimating and monitoring changes in carbon stocks across different land use categories and carbon pools [14]. Such comprehensive approaches allow the assessment of both the short-term impacts of forest management practices and the long-term substitution effects of using forest products instead of conventional materials with high CO2 emissions [11,15].
The changes in forest carbon dynamics due to forest management practices have been often investigated and debated [10,16,17,18]. Thus, prior studies on managed forests [19,20] showed that specific FMP can influence more or less the carbon balance along all pools (biomass, dead organic matter and soil) with potential implications on carbon mitigation [12,21]. Many studies have used different methodologies [22,23] and models [11,24,25] for the evaluation of carbon sequestration concerning various forest ecosystem properties and management practices [26,27,28]. Furthermore, for assessing the ecosystem’s carbon stock and sequestration under secondary succession, mismanaged or abandoned forests are crucial to understanding the status of each pool and dynamics, making these lands susceptible to changes [29,30,31].
In Romanian forests, a significant proportion of forest management practices aim to optimise carbon storage while supporting wood production, thus reflecting the country’s commitment to GHG mitigation under EU and UNFCCC frameworks [32]. Despite the traditional focus on wood production, there is a growing interest in quantifying the carbon sequestration capacity of Romanian forests, which are characterised by a wide range of climatic, vegetative and soil conditions due to their extensive altitudinal gradient [33]. Besides, studies on peri-urban forests in Romania quantifying the carbon stock and carbon stock change over time are very scarce, instead focusing on forest structure and diversity [34,35] or historical changes in the forest-covered areas [36]. Additionally, according to the National Forest Inventory [33], around half a million hectares of forest are outside of the national forest area, and peri-urban forests are partially one of them, with significant implications on the national greenhouse gasses inventory report regarding carbon sequestration by different pools [37].
This study aims to address the gap in research concerning carbon stock changes in Romanian forests, particularly in peri-urban forests and in the context of different FMPs. Utilising the CASMOFOR model [38] in concordance with the IPCC methodology, we seek to determine the impact of different harvest practices on carbon pools for the period 1990–2020. Our specific objectives include (1) assessing the carbon stocks for each pool (i.e., living tree biomass, dead organic matter and soil), (2) estimating the carbon sequestration capabilities, especially for living tree biomass, and (3) evaluating different scenarios based on different silvicultural practices (i.e., no intervention, low intervention and high intervention) for two mature native and one secondary succession forests.

2. Materials and Methods
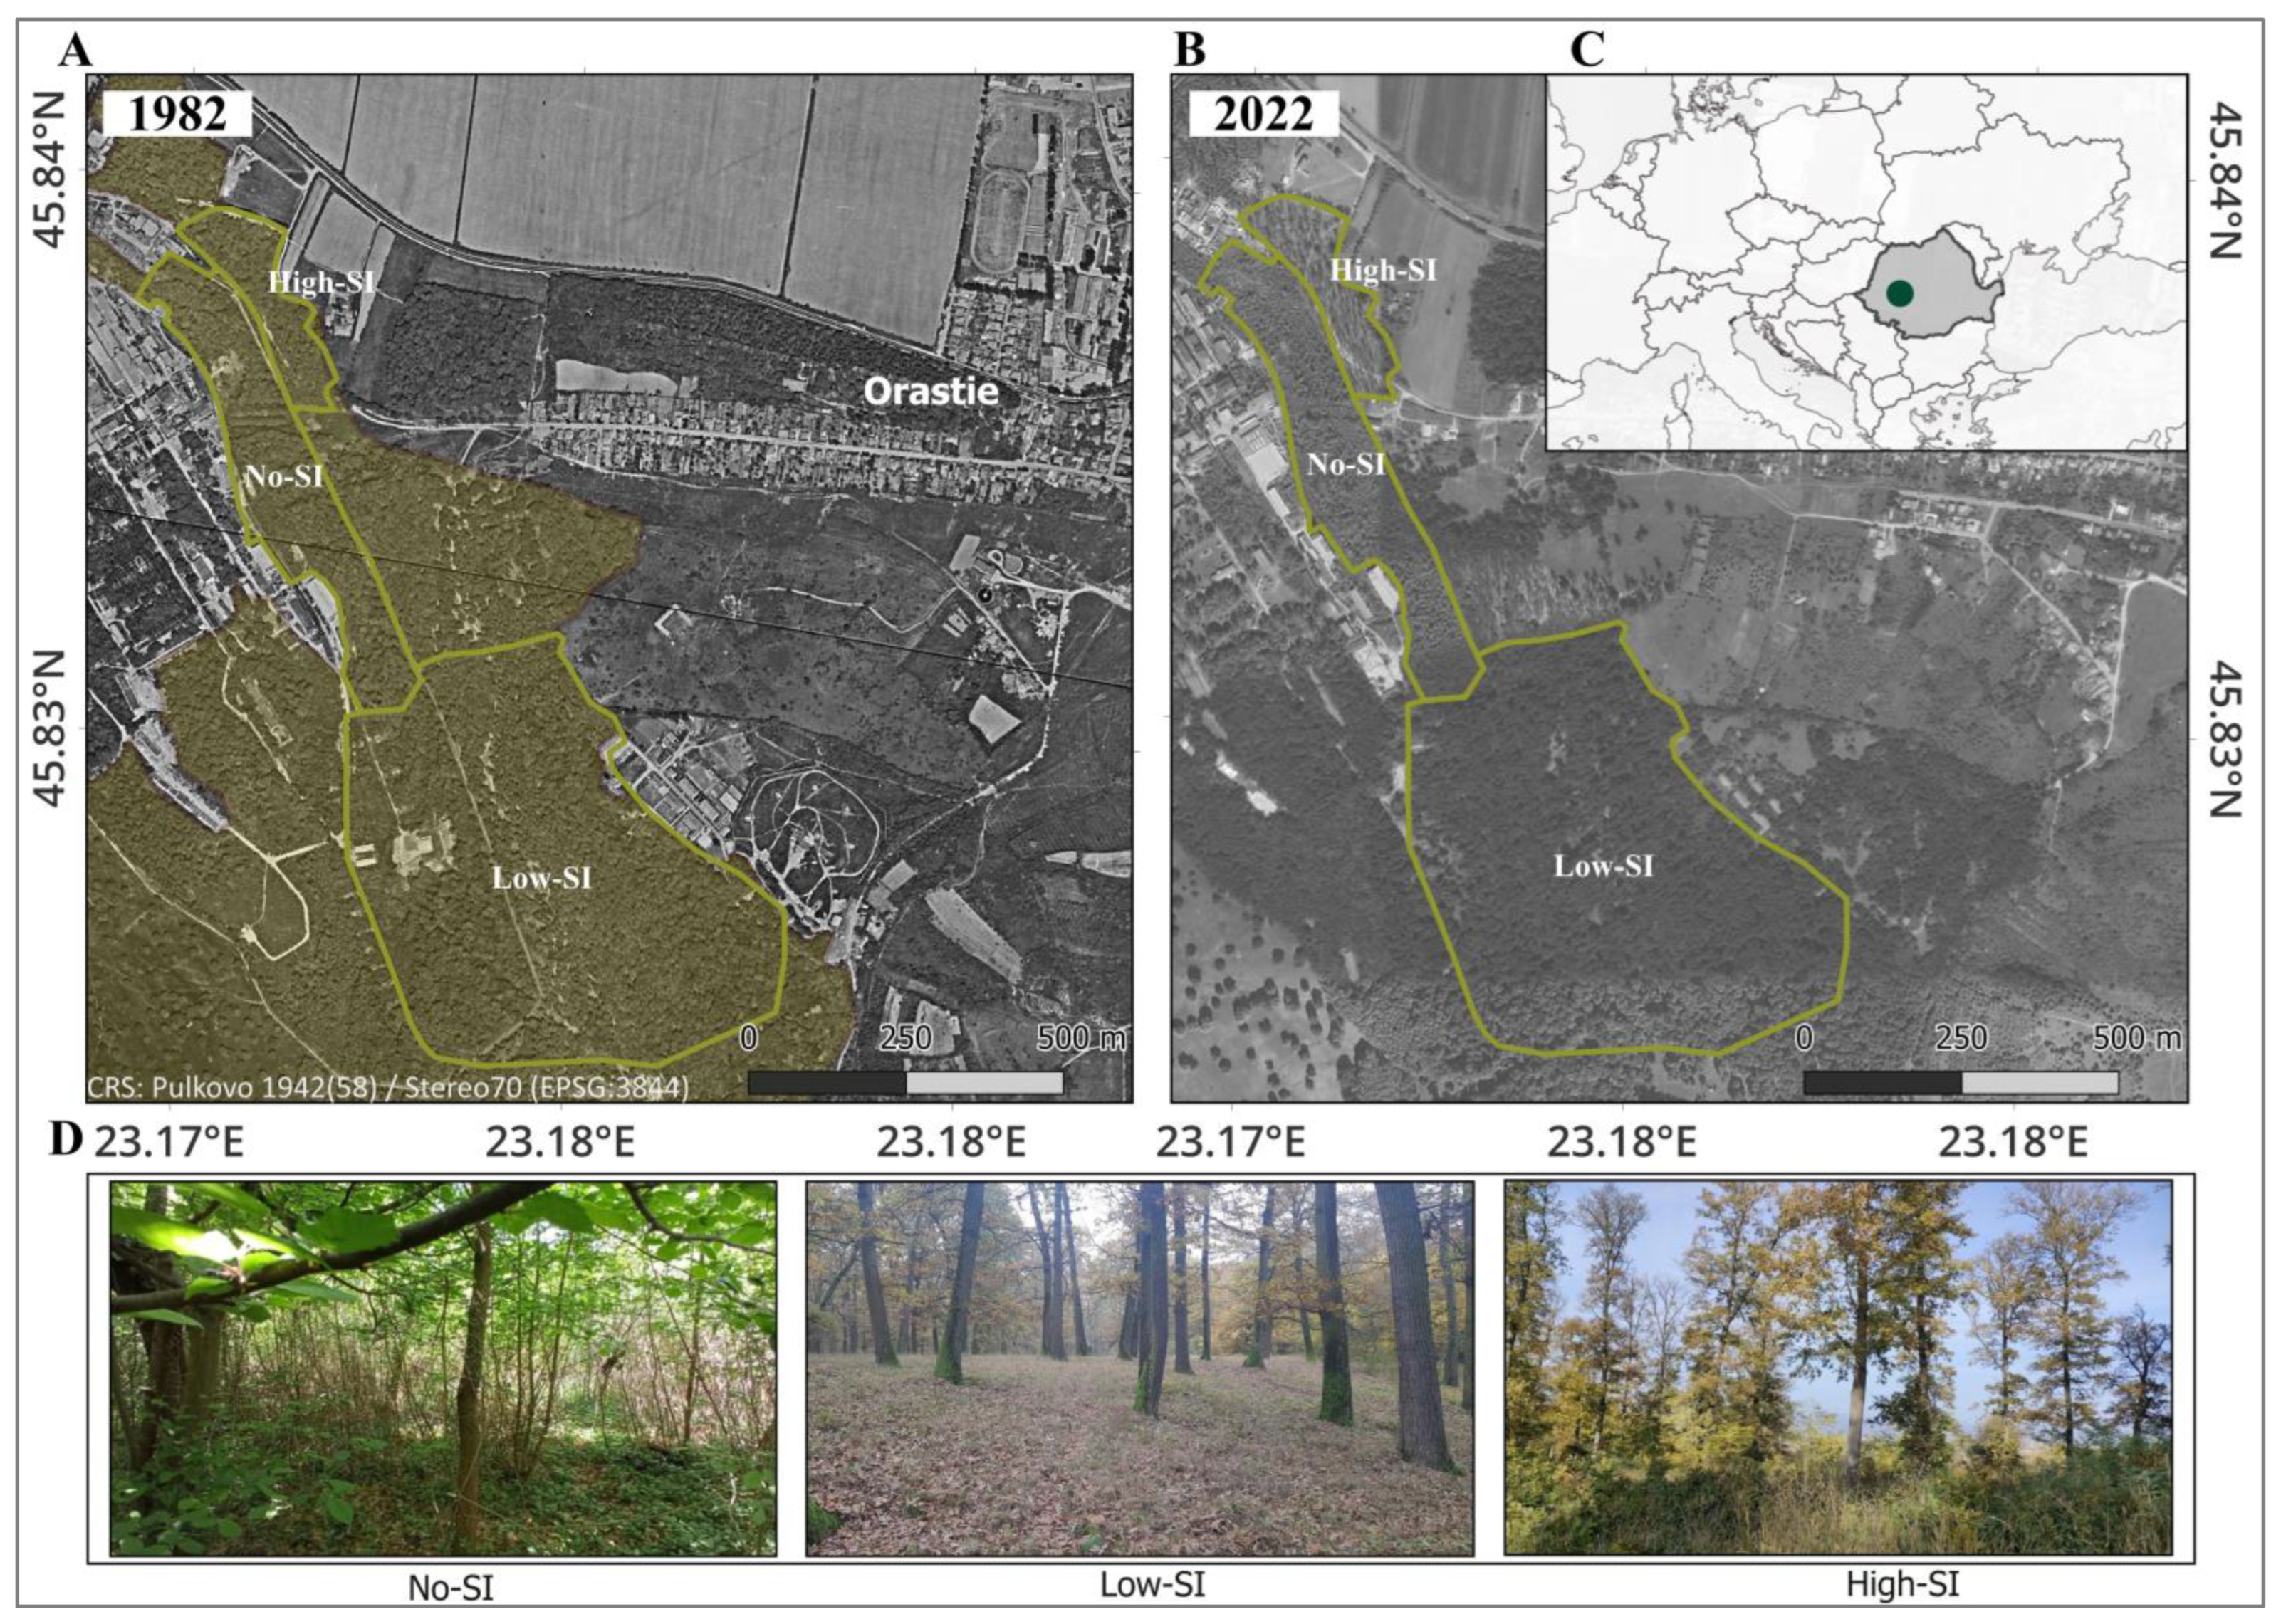
2.1. Study Area

The studied forest sites are located in the vicinity of Orăștie (45°50′9.456″ N and 23°10′10.876″ E), an industrial town in the Transylvanian hills of central Romania (Figure 1). All sites were situated in the same area close to each other, with an average elevation of 250 m above sea level, similar microclimatic conditions, soil type and geological substrate favourable for the natural growth of the Quercus genus. According to the Köppen and Geiger climate classification, the region is characterised by a continental climate (Cfb) with a total annual rainfall of 765 mm and a mean annual temperature of 10.5 °C [39]. The average slope is 10%, with a general western aspect. According to the Romanian soil classification [40], the dominant soil is Eutric Cambisol, with a sandy-clay texture. The geological strata at all study sites mostly contain sandstones and marl.

2.2. Experimental Layout

The study examines three neighbouring forest areas that have transitioned from their initial state as compact and mature forests (Figure 1A) to becoming landscapes fragmented to varying degrees by land use change and anthropogenic interventions starting with the 1990s. According to the site condition assessment detailed in the management plans, all three sites are classified as first or second class in terms of productivity out of five classes. This classification indicates the most productive site conditions for turkey oak, as per Giurgiu et al. [42].
The first site (No-SI) under investigation is an abandoned secondary succession forest without any silvicultural intervention regarding the regeneration (Figure 1D) since it was clear-cut in 1990. The expansion of industrial facilities after 1990, coupled with a change in the national legislation, led to approximately 10 hectares of the original old forest being entirely clear-cut. Initially, this land was cleared for urban conversion, but it was eventually abandoned, allowing nature to take over. This area, now within the boundaries of an industrial facility, hosts an area covered by woody vegetation with tree species, on average, 25 years old and has not been subject to any silvicultural regime. More than three decades later, the composition of the regenerated forest differs from the original, featuring a mixed composition of deciduous species such as turkey oak (Quercus cerris L.), field maple (Acer campestre L.), black locust (Robinia pseudacacia L.), wild cherry (Prunus avium L.) and other species (Table S1). The lack of any anthropogenic interventions has facilitated the development of a diverse understory, particularly along the boundary, with species including elder (Sambucus nigra L.), dog rose (Rosa canina L.) and common privet (Ligustrum vulgare L.) (Figure 1B,D).
The second site (Low-SI) under examination is an extension of the initial forest, now a mature, even-aged stand of about 120 years old. It has undergone minimal silvicultural interventions and is part of the 88-hectare Park Orăștie complex (Figure 1B,D). Before 1990, the area was used for military purposes, focusing on conservation management. Post-2000, it has served as a tourist destination while continuing conservation efforts. This forest, primarily composed of mature oak species, is protected, allowing only sanitary felling. Occasionally, this forest contains monumental and dead trees.
The third site (High-SI), under an extensive forest management regime, is characterised by a low crown cover of 30% and faces challenges with insufficient regeneration, with evidence of grazing, although forbidden according to silvicultural practices (Figure 1B,D). According to the forest management plan, the primary silvicultural intervention implemented was the group shelterwood system. The initial application of this management practice took place in 2010, targeting a harvesting intensity of approx. 65% of the stand’s volume. This approach to silvicultural interventions involves successive fellings designed to promote natural regeneration in gaps. The size and distribution of these gaps depend primarily on the species composition [43]. In all three sites, different management practices are applied following the silvicultural interventions documented in the forest management plans (i.e., the group shelterwood system in the High-SI site, sanitary felling in the Low-SI and the regrow of the forest after the total removal of the vegetation.

2.3. Trees Inventory Sampling and Carbon Estimation

To evaluate forest stand characteristics, we established a sampling system to capture the variation in vegetation homogeneity across forest sites. At sites classified as High-SI and Low-SI, with lower structural diversity, we sampled five plots of 500 m2 each. In contrast, due to the increased basal area and stand volume variability, nineteen 200 m2 plots were surveyed within the No-SI sites.
Field measurements were performed using standard forestry equipment, including a measuring tape and a Vertex V (Haglöf Sweden AB), to determine the diameter at breast height (d) and the height of each tree (h). To calculate tree volume and biomass, we applied specific allometric equations depending on the tree’s diameter. For trees with a d greater than 6 cm, we used a logarithmic equation proposed by Giurgiu et al. [42] at the country level:
log v = a 0 + a 1 log d + a 2 log d 2 + a 3 log h + a 4 log h 2
where v represents the tree volume (m3), d is the diameter at breast height (cm), h is the total height (m), and a0, a1, a2, a3, and a4 are the regression coefficients established for each forest species (Table S1).
For trees within this category, the total living biomass was estimated by adding the belowground volume, calculated using a root-to-shoot ratio of 0.22 for sessile oak and 0.20 for other deciduous species to the aboveground volume. Additionally, a wood density factor of 0.568 dry matter tons per cubic meter (DM tonnes m−3) was applied, as provided by Giurgiu et al. [42].
For trees smaller than 6 cm in d (i.e., juvenile trees found only in the NO-SI site), we utilised the equation from Blujdea et al. [44], Equation (2) to estimate the total living biomass, including belowground biomass (BGB):
B i o m a s s = e x p   ( a ) × d b × c f
where “Biomass” indicates the combined above and belowground biomass of young trees, exp is the exponential function, d denotes the diameter at breast height for young trees a, b are the regression coefficients, and cf is a correction factor (cf = exp( S E E 2 / 2 ), SEE- standard error of the estimate that accounts for the systematic bias introduced by back transformation ([44,45] Table S2).
We employed two methods to estimate the volume of dead wood within the inventoried areas. The volume of standing dead trees was estimated using the same logarithmic regression equation developed for living trees by Giurgiu et al. [42], as no long-standing dead trees were observed that would significantly affect stand volume calculations. The volume of lying dead trees was determined using the Huber method [42]. For biomass estimation, different wood densities were applied for standing (0.314 DM tonnes m−3) and lying trees (0.193 DM tonnes m−3), following the guidelines of Přívětivý et al. [46]. In the end, we estimated the carbon stock using a conversion factor (CF = 0.51 tonnes DM for broadleaves according to [47] to multiply with the resulting amount in biomass).

2.4. Dendrochronological Analysis to Capture Tree Growth

For the assessment of mean tree growth, a Pressler increment borer with a 5 mm diameter was used at breast height to extract a single core, chosen based on criteria like diameter representativeness (i.e., mean diameter at breast height), absence of damage or good health, for five inventory plots by each forest type. Thus, for each High and Low-SI site we analysed five growth samples and two from each dominant tree species in each plot in the No-SI site, a total of 36 sample cores analysed. Extracted cores underwent careful processing, including initial drying and mounting on special wooden supports. Cores were then sanded to create a flat surface highlighting annual ring boundaries, using abrasive strips with grain sizes recommended by Popa et al. [48]. Subsequently, cores were scanned at 1200 DPI using an Epson Expression 12,000 XL scanner (Seiko Epson Corporation, Japan) to capture the annual ring widths. Finally, they were quantified using CooRecorder software (version 9.3.1, [49]) for detailed image analysis. To ensure measurement accuracy, the COFECHA was employed, conducting correlation assessments over 50-year intervals, as outlined by Grissino-Mayer [50]. Additionally, average growth rates were determined by analysing the mean radial growth of each species over the past decade.

2.5. Soil Sampling Design and Specific Lab Analysis

For determinations of carbon stock in the forest floor (organic layer), in each studied site (No-SI, Low-SI, High-SI), twenty (four samples × five plots) litter samples were randomly selected. The litter samples were collected following the methodology outlined in the ICP Forests manual [51]. For the litter layer, samples were taken from inside a 20-cm diameter collar (area = 0.0314 m2) for each plot. Mineral debris and stones were removed, and any live plants were cleared from the harvest area using a metal knife. The dried leaves, fruit, and dead wood (less than 1 cm in diameter) were individually placed into labelled plastic bags and kept at up to 4 °C. The carbon concentration of the litter was determined using a specific laboratory method (dry combustion) after previously mixing, shredding and sieving (2 mm) the samples collected from the field for each position and plot. The carbon stock of the organic layer (litter) is calculated differently than that of the mineral layer [52]. Thus, it is obtained after multiplying the dry weight of all the organic material sampled per unit area with the carbon concentration.
Near the location of litter samples, five soil microprofiles (0–30 cm depth) per site were taken using a core device with an inner diameter of 5 cm. According to the standard method, the soil samples were air-dried and sieved (2 mm) for lab analysis. The soil organic carbon concentration was determined by dry combustion using a Leco TruSpec CHNS Micro Analyzer. The soil organic carbon stock was determined according to Adam’s formula [53], Equation (3):
S O C = S O C % × B D × d × [ 1 ( % s t o n e s ÷ 100 ) ]
where, SOC—soil organic carbon stock in mineral soil (kg m−2  × 10 = tonnes ha−1); SOC%—soil organic carbon concentration resulting from laboratory analysis (%); BD—soil bulk density (kg dm−3) measured using a dedicated metal cylinder with a known volume (core method); d—depth of the soil horizon (=30 cm); %stones—the percentage in mass of rock fragments.

2.6. Statistical Analysis and Modelling Framework

We first examined the data distribution to describe the variation of carbon stock among each pool and the influence of the silvicultural interventions across the three sites (No-SI, Low-SI, and High-SI). The normality and homogeneity of each carbon stock (CS) pool (i.e., aboveground biomass, belowground biomass, litter, deadwood, and soil) were assessed using the Shapiro-Wilk and Levene tests. Due to deviations from normality, we utilised the non-parametric Kruskal-Wallis test to assess if there are statistically significant differences in the distribution of the CS pool across the different sites. We then run a post hoc pairwise Wilcoxon test to assess differences between silvicultural intervention groups within each CS pool. The p-values were adjusted using the Benjamini-Hochberg (BH) method. All analyses utilised the R programming language, version 4.3.2 [54], using the following packages: car, stats and ggplot2 [55]. To evaluate the carbon stock dynamics and the annual carbon stock change at each site, the forest carbon accounting model CASMOFOR, developed by Z. Somogyi [56], was used and aligned with the IPCC methodology [47,57]. This model estimates annual carbon stocks for each carbon pool based on species composition and productivity class. The modelling exercise tracked the evolution of carbon storage over 42 years. Input data on initial species composition, starting stock, age class, and productivity class were gathered from the management plan’s historical data series. Consequently, all three sites followed a common trajectory until 1990.

3. Results

3.1. Structural Characteristics

The measurements of stand characteristics revealed significant variations among the forest sites regarding age, basal area, growth, and stocks, as summarised in Table 1. The No-SI site is distinguished by its notably young average age of 25 years, low basal area, and the lowest growing stock. However, it has a high density of trees per hectare (1132) and a diverse species composition, averaging nine broadleaf species. This site (No-SI) also features abundant regeneration, as indicated by the number of juvenile trees (d < 6 cm), in contrast with the other two forest sites, where the juvenile trees were not captured in the statistical design of the measurement. Furthermore, the No-SI forest exhibits the highest growth rate by volume at 11 m3 per hectare annually. Contradictorily, despite sharing similar ages (120–130 years), the other two sites exhibit significant differences due to their respective forest management practices. These differences manifest in tree density, where the Low-SI site has twice as many trees per hectare (120 trees) and three times the basal area (37 m3 per hectare) compared to the High-SI site. Additionally, annual growth rates at the No-SI site surpass those of the Low-SI and High-SI sites, which have low and high silvicultural interventions, respectively.

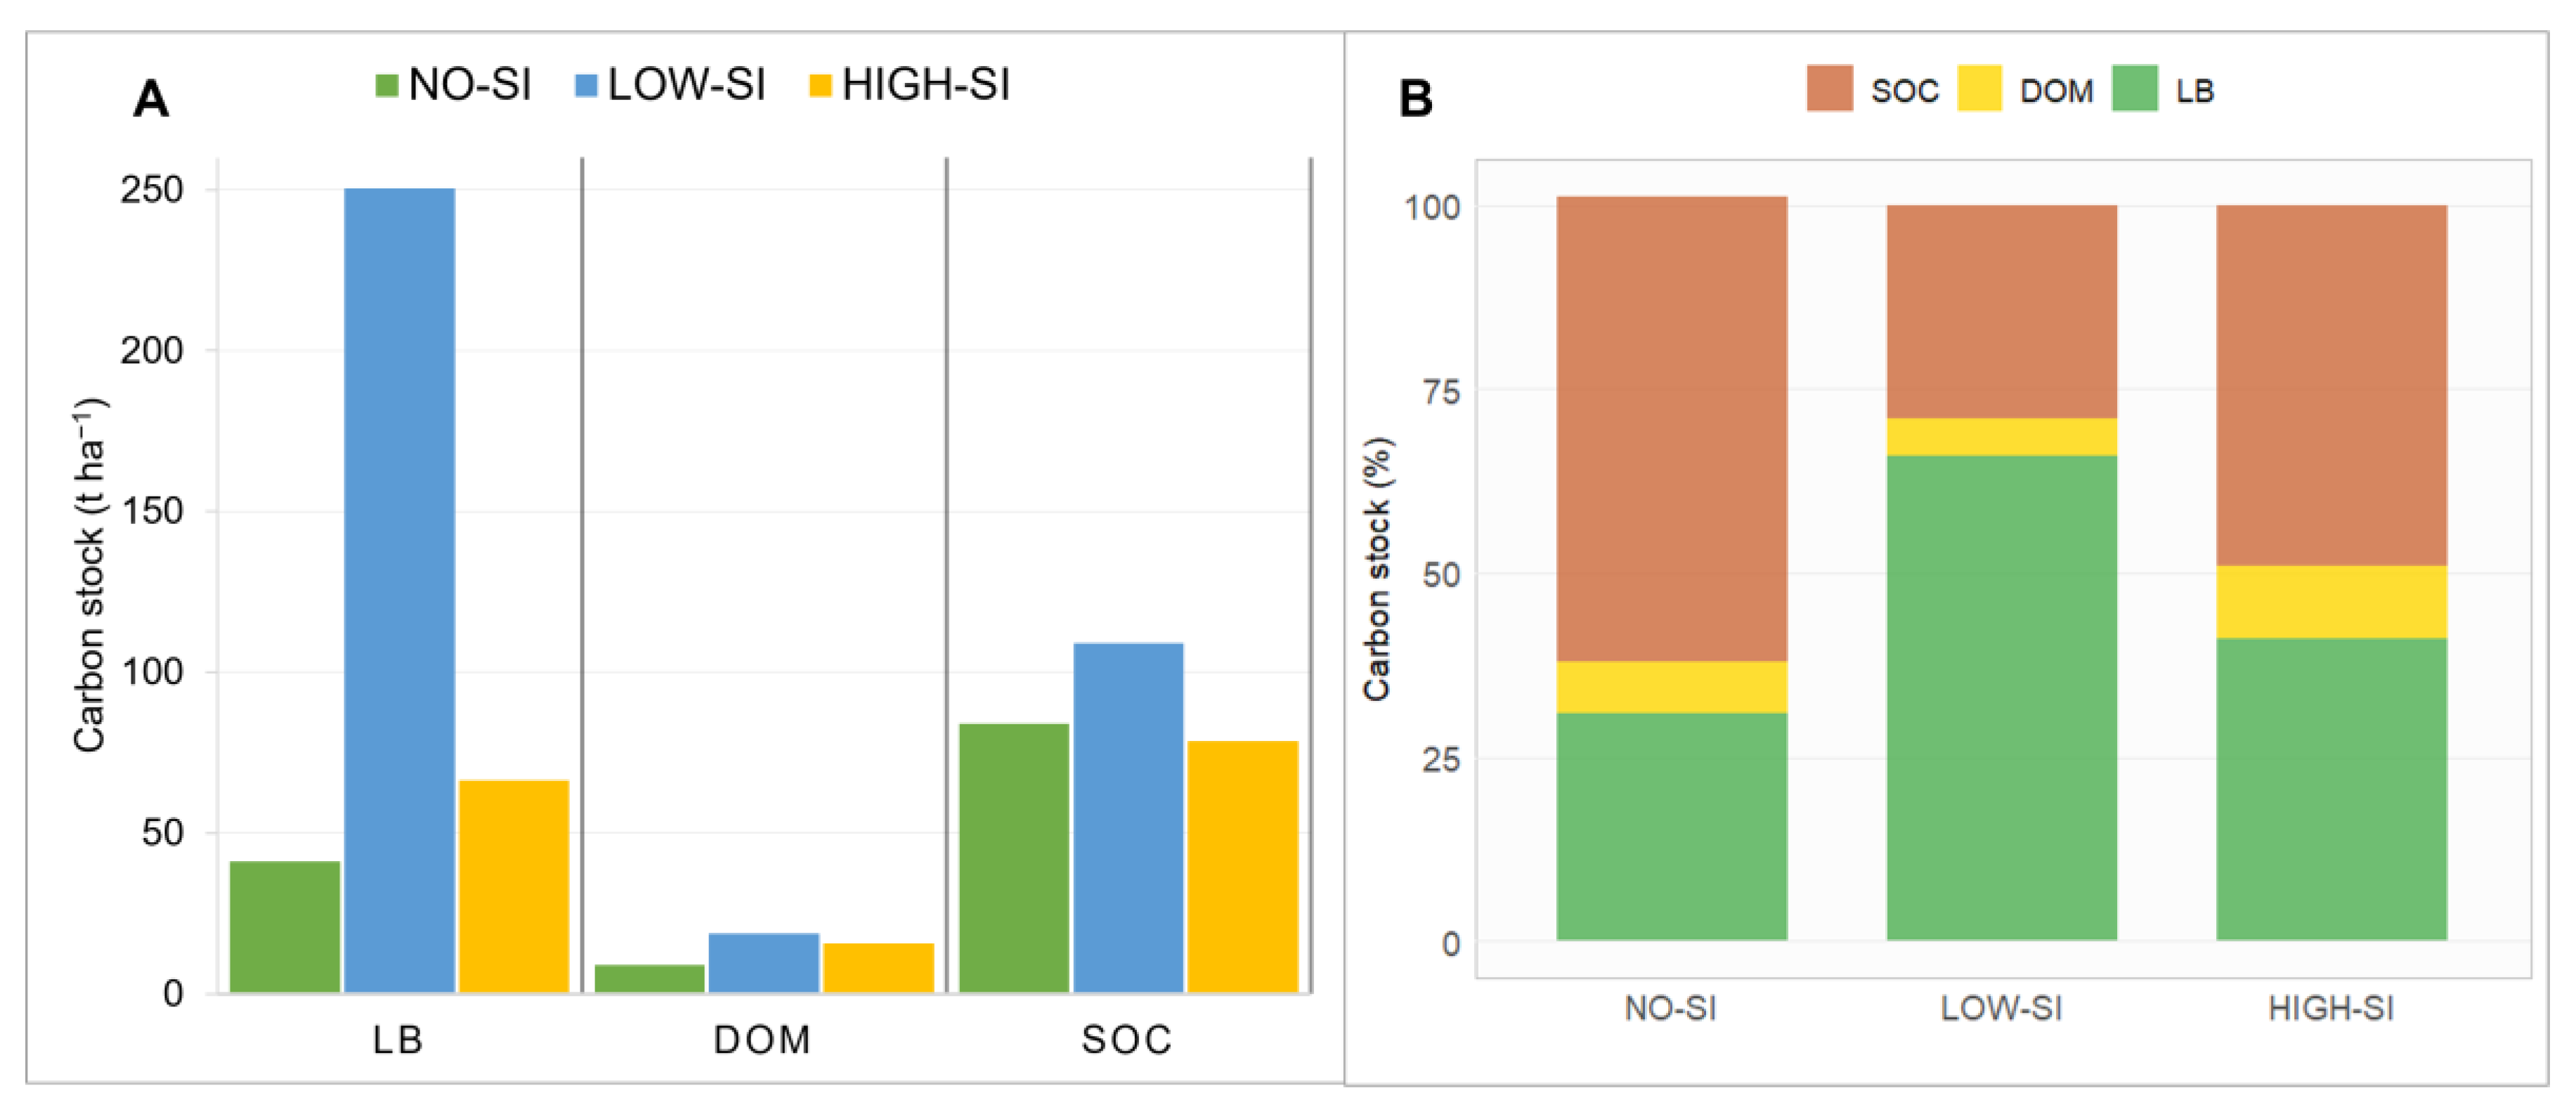
3.2. Carbon Stock in Each Pool

The current carbon stock in trees living biomass (LB, including above and belowground biomass), dead organic matter (DOM, sum of dead wood and litter layer), and soil organic carbon (SOC from soil mineral layer at 0–30 cm depth) is shown in Figure 2A, as a mean value for each site. As expected, the Low-SI site had the highest carbon stock, primarily attributed to the LB contribution, characterised by large living trees and minimal silvicultural interventions (i.e., sanitary felling). Accordingly, LB carbon stocks ranged from 41.2 tonnes C ha−1 (No-SI site) to 250.5 tonnes C ha−1 (Low-SI site), with an intermediate value recorded in the High-SI site (66.3 tonnes C ha−1). Moreover, the carbon stock from DOM followed a similar trend to that of the LB carbon stock. Additionally, the LB carbon stock of juvenile trees (dbh < 6 cm) was recorded only in the No-SI site (Figure 2, Table S3). This pattern was similar to the soil stocks, where we found the highest value in the Low-SI site compared to the other two forest sites, but with insignificant differences (Figure 2). On the other hand, the relative share of carbon stock showed the highest value in mineral soil for No-SI (63%), while for the Low-SI site, the highest value was recorded in living tree biomass (66%). In the High-SI site (Figure 2B), the relative share of carbon stock was relatively similar between living tree biomass (41%) and SOC (49%), even though the relative value of carbon stock for DOM recorded the highest value (10%) compared with the other sites.
According to the statistical analysis (Table 2 and Table S4), significant differences were observed, using the nonparametric Kruskal-Wallis test, in the aboveground carbon stock (CS_AGB) pool between the Low-SI and No-SI groups (p adj. < 0.01), as well as between Low-SI and High-SI (p adj. < 0.05). In the carbon stock dead wood (CS_DW) pool, a significant difference was also found between the High-SI and No-SI groups (p adj. < 0.01, Table S4). In addition, insignificant differences in other categories, such as in litter carbon stock (CS_litter) and soil carbon stock (CS_soil), suggest either no effect of forest management type or that the data did not have sufficient relevancy to detect any differences (Table 2).

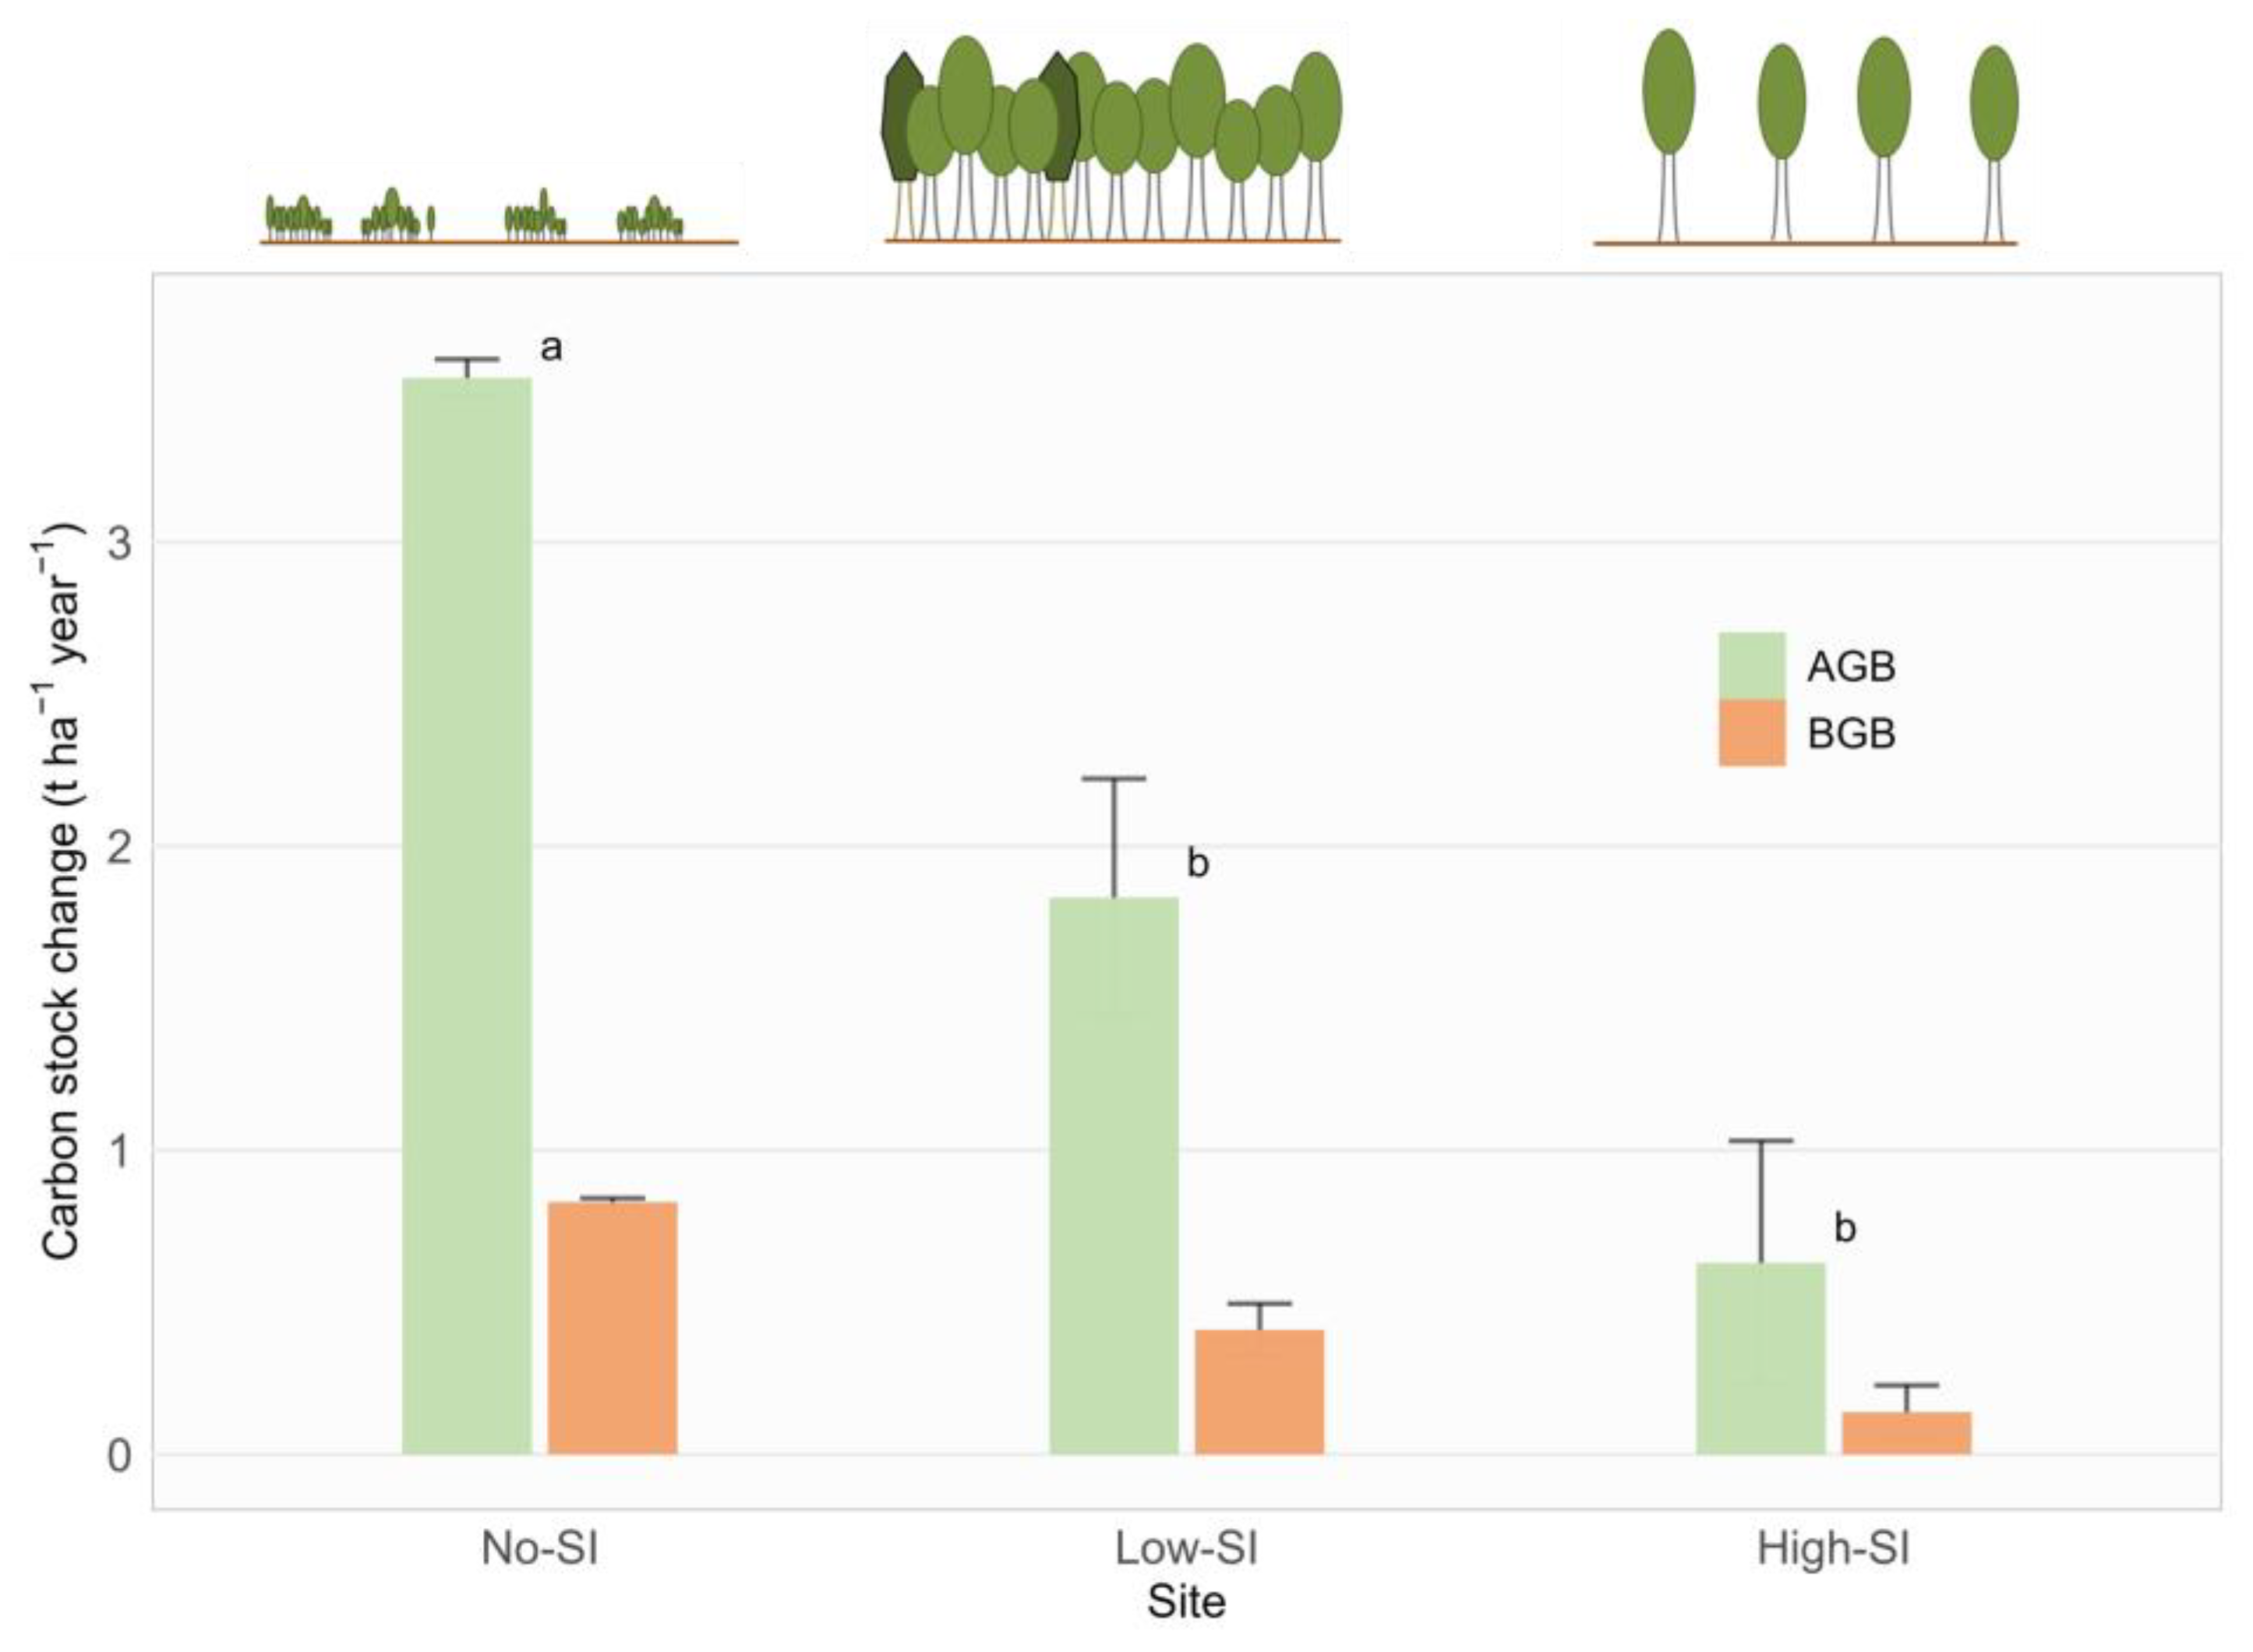
3.3. Annual Carbon Stock Change in Living Biomass

The annual carbon stock change (CSC), i.e., the difference between stocks in two consecutive years, shows a significant variation within the studied sites. (Figure 3). The stand where the shelterwood system was applied (High-SI) had the lowest annual rate of carbon stock change in living tree biomass, of approximately 0.77 tonnes C ha−1 year−1. In contrast, the secondary succession forest (No-SI) had the highest carbon stock change for living tree biomass (i.e., aboveground and belowground biomass) by approximately six times (4.37 tonnes C ha−1 year−1) than High-SI. The stand with low silvicultural interventions (Low-SI) recorded an intermediate amount of carbon stock change in living tree biomass (2.24 tonnes C ha−1 year−1).
The significant differences in carbon stock changes in the aboveground pool (CSC_AGB), using the Kruskal-Wallis test (Table 2 and Table S4), were found across all groups (i.e., Low-SI vs. No-SI, p adj. < 0.01, High-SI vs. No-SI, p adj. < 0.01 and High-SI vs. Low-SI, p adj. < 0.05).

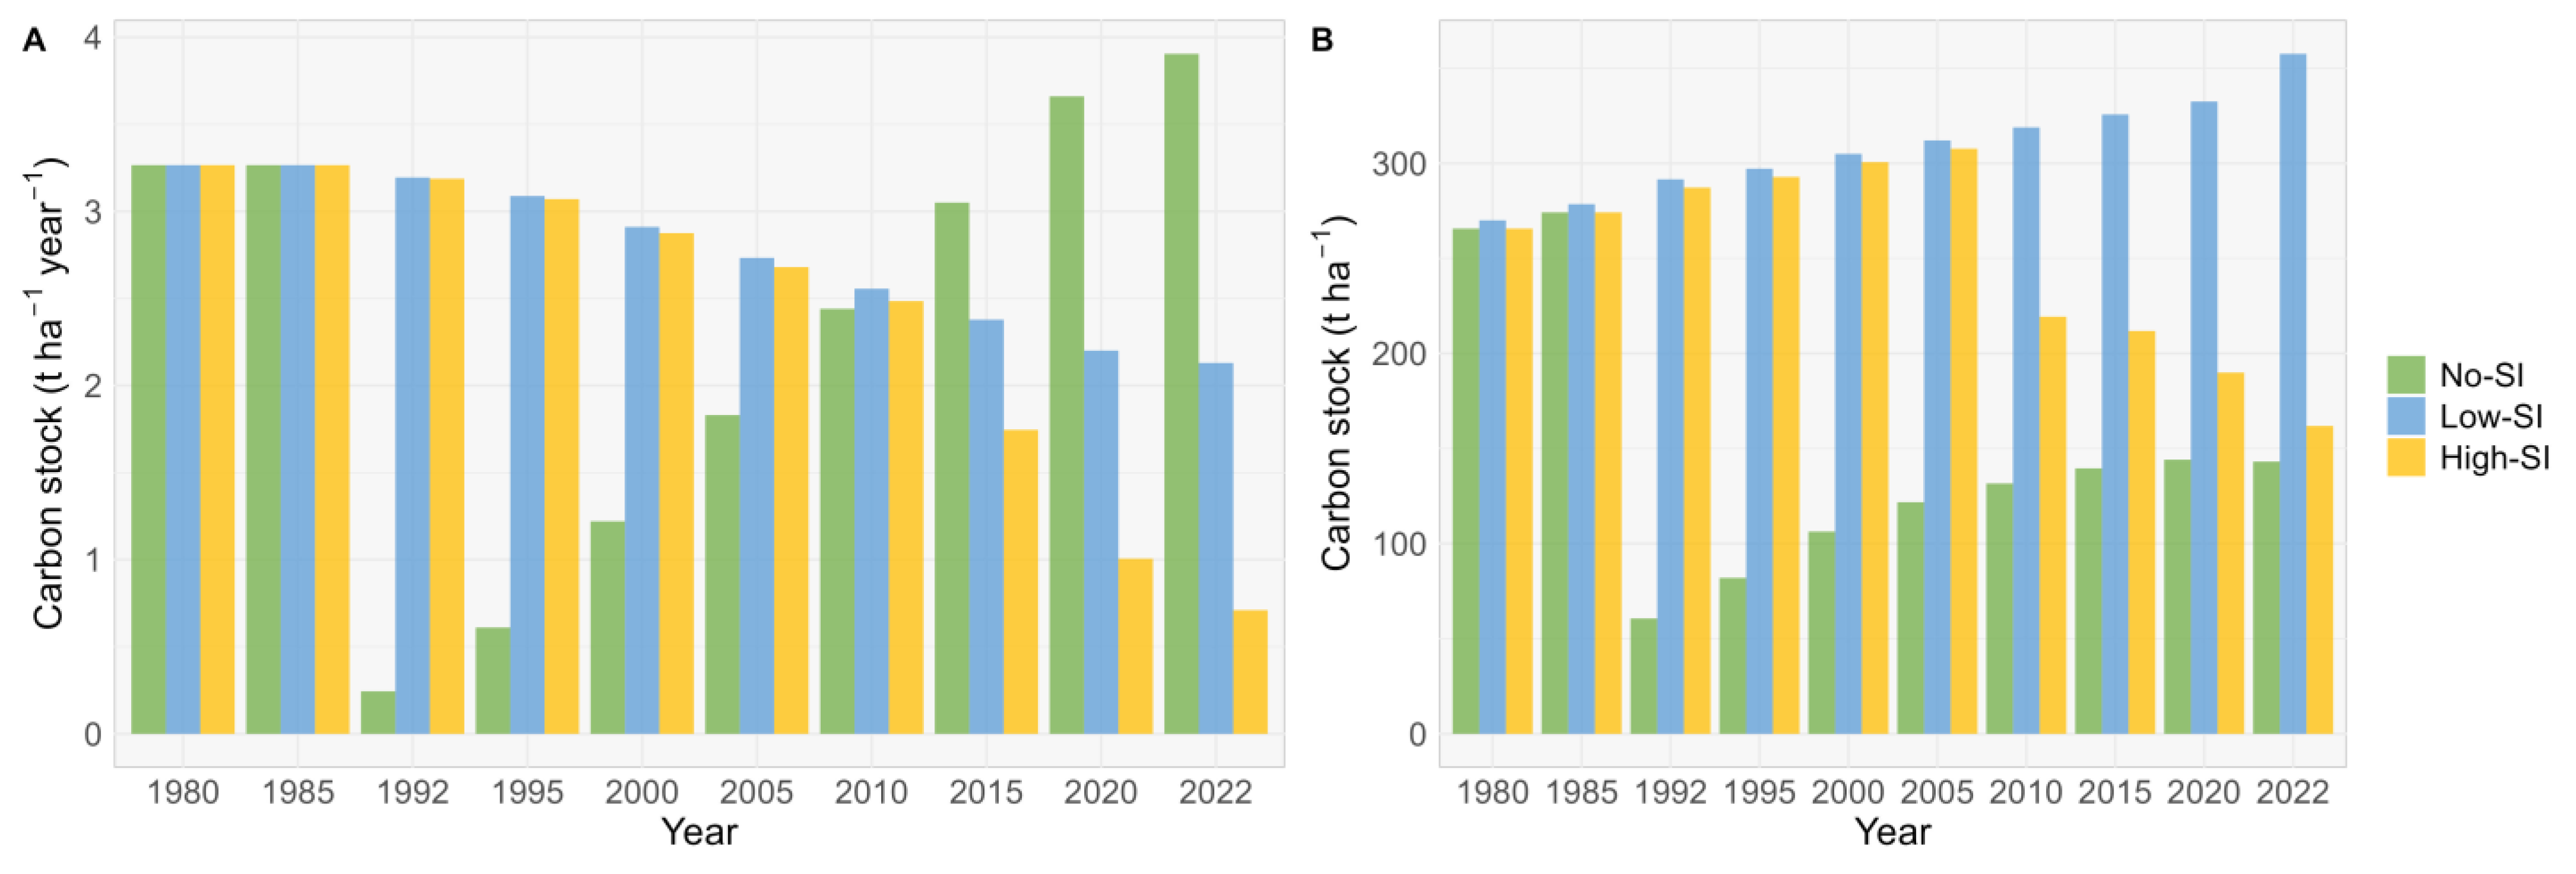
3.4. Historical Scenarios of Carbon Balance

According to the CASMOFOR model applied for each site, the total carbon stocks projected for each forest site show variation along the historical period (1980–2022). In the area (High-SI) where the forest was first partially harvested (2010), in all pools, especially AGB pools, an annual decreasing trend is observed, caused by higher annual harvest rates compared to biomass growth (Figure 4B). The same trend was observed in secondary succession forests (No-SI) in 1990 when the 10 ha mature native forest was harvested, and carbon stocks, especially from tree biomass, increased by the installed juvenile trees.
Significant differences in annual CSC across different sites are observed in tree-living biomass (Figure 4A). Interspecific differences in tree biomass mainly caused inherent variations in tree growth rate, stand age and historical forest management approaches. Carbon storage of the understory layer (i.e., grass and shrubs) is not considered. In the site where all forest vegetation was removed (i.e., 1990, No-SI), all pools were projected to slowly but steadily increase after the natural regeneration process, having the highest carbon accumulation potential. On the other hand, when examining the net carbon stock change, meaning the total carbon stored on the forest site (all carbon pools Figure 4B) over the past 42 years, the No-SI site exhibited the lowest average accumulation rate of 1 tonnes of carbon per year. This was closely followed by the site with high silvicultural intensity (High-SI) with an average accumulation rate of 1.6 tonnes of carbon per year. The site with the lowest management intervention (Low-SI) showed the highest average accumulation rate of 5.2 tonnes of carbon per year.

4. Discussion

Our study investigated the impact of land cover changes in a secondary succession forest, initially clear-cut for conversion to other land use, abandoned and regrew, without silvicultural intervention (regarding natural regeneration) over the last three decades. The influence of forest management practices is also examined: in a production forest where a group shelterwood system has been applied since 2010 and in a forest-protected area where only sanitary felling has been applied. The balance of all carbon pools (LB, DOM and SOC) and carbon dynamics (CSC) were calculated based on inventory data, which were also modelled and matched by the CASMOFOR carbon model [38]. According to statistical analysis (Table 2 and Table S4), the significant differences in specific carbon pool categories underscore the legacy effect of forest management practices on carbon stock and carbon stock change. This suggests that suitable management strategies could enhance carbon sequestration or preservation in forest ecosystems [17,58].
Overall, the mean carbon stock in the living biomass pools amounted to 119 tonnes ha−1 (41–251 tonnes ha−1, Figure 2, Table S3), which accounted for 31% (No-SI), 66% (Low-SI) and 41% (High-SI) of the total carbon storage, being in the range of the other temperate forest with more or less similar climatic and natural conditions [59,60]. Besides, comparing field data established estimates for different large areas and management is difficult because they were obtained using contrasting methods [61,62]. Therefore, the highest total carbon stock is contingent on the basal area of the trees (Table 1 and Table S3), and this structural parameter is used to estimate the level of C stock [62]. Indeed, Low-SI recorded the highest biomass C stocks, which is attributed on the one hand to the high number of larger trees specific to mature forests and on the other hand due to reduced less-intensive silvicultural interventions in comparison with High-SI stand, even though tree density in No-SI site recorded more than 2600 trees ha−1, including juvenile trees (Table 1). Thus, we can speculate that the current AGB differences between sites are the legacy of past forest management or the absence thereof.
Employing a modelling exercise by using a carbon budget model over 42 years of stand development (1980–2022), the study assessed the local impact of forest management practices on carbon stock and carbon stock changes across various pools (biomass, dead organic matter, and soil) within peri-urban forests (Figure 4). Our analysis considered forest structural differences, including forest composition and tree density variations. This approach was confirmed by the results obtained in previous studies, such as [38], which also employed the CASMOFOR model. Significant differences in tree biomass stocks among the three investigated forests were attributed to variations in stand volume and annual growth rate specific for each site (Table 1, Figure 2). According to the forest management plan and photo interpretation, this variation in carbon stock from biomass is due to the combined effects of each forest type’s stand age and harvest dynamics. Furthermore, forest structure, characterised mainly by forest composition and age class distribution, influenced forest productivity [63]. Thus, the forest with minimal silvicultural interventions (Low-SI) had the highest AGB; however, it did not have the most significant growth rate, as observed in the no management site (No-SI, Table 1 and Table S5). The fast biomass increment rate was higher in the early forest stage than in the mature forest, mainly because of the age-specific physiological characteristics and forest composition. Thus, the highest carbon stock change from living tree biomass was recorded at the No-SI site (Figure 3) where, fast-growing tree species (i.e., black locust, wild cherry and other species, Table S1) “sacrifice” part of their carbon gain capacity by decreasing their carbon stocks in time [64]. Reports from the literature suggest that the change in carbon stock can also be influenced by the variation of wood density [65], the proportion of lignin [66], or the successional status of the species [67]. Additionally, the annual growth rate variations can depend more on intraspecific competition and less on the stand age [7]. Nevertheless, the mortality rate might have also been influenced by the trees’ requirements for resource availability (light and nutrients) or the shade-tolerant character [68], specifically in forests characterised by a higher canopy closure, like in the No-SI site (Table 1). However, the highest carbon stock from DOM (sum of carbon from litter and dead wood) was determined in the mature and less intervened site (Low-SI), where the presence of adult dead trees was higher (2.2 tonnes C ha−1, Table S3). We figure out that this forest can be considered an old-growth forest, where tree mortality occurs as a relatively rapid event [69], and the main causes of mortality are due to natural disturbances [70]. On the other hand, low silvicultural intervention (i.e., sanitary feeling), determined by the intensity of cutting (i.e., 5 m3 ha−1 according to National Silvicultural Norms) and the low value of wood products (generally, firewood), may justify the highest amount of dead wood found in this forest (Low-SI).
The differences, even though statistically insignificant (p > 0.05), of carbon stocks from the litter layer between sites (Table 2 and Table S4) can be explained by certain factors such as plant community, microclimate and decomposer organisms, which can be reflected in the litter production and litter decomposition rate [30]. As we expected, the smaller litter layer mass was recorded in No-SI, which could be attributable to the mass of foliage and smaller branches by comparison with mature forests with large crowns of trees (Low-SI and High-SI, Figure 2, Table S3). Indeed, a past study [71] showed more abundant litter in mature forests than in younger forests, arguing that these differences are due to microbial populations adapted to deal with high loads of organic matter. Additionally, the light availability in the forests with large crowns, especially in mature and native forests (Low-SI and High-SI), can conduct a more favourable soil microclimate for decomposers with implications in the decay of litter, especially for the highest trees and lower stand density [64,72].
Soil carbon stock correlated negatively with tree productivity (carbon stock change from biomass) between sites (Figure 3), promoting the idea that change in C input has marginal consequences on belowground C accumulation [73,74]. Nevertheless, the carbon stock from mineral soil typically represented a significant proportion of total carbon pools, which made up only 29% in lowest intensity interventions (Low-SI), 49% in highest intensity interventions (High-SI), and 63% in secondary succession forest (No-SI) of the whole system (Figure 2, Table S3). This statement is consistent with prior studies [19]. Besides, the most determinant parameter to contribute to soil carbon sequestration could be the fraction of carbon transfer from litter and root to soil [64]. Therefore, it can be assumed that tree-living biomass is more sensitive to forest management than other pools, especially mineral soil, where silvicultural interventions can impact carbon stock differently [15]. According to a prior study [9], forest harvest reduced the soil carbon stock by about 8%, leading to significant losses in organic horizons and topsoil (0–15 cm) compared with deep soil layers. Indeed, there are no clear differences in the soil carbon stock recorded for each site (Table 2 and Table S4), meaning that anthropogenic disturbances have had no major impact on soil carbon stock loss in the last almost four decades. Besides, the soil carbon stocks started to recover within five decades following harvest [27,75,76]. Based on our findings, the highest soil carbon stock proceeded towards the oldest and least intense silvicultural intervention forest (Low-SI), which can be a common pattern from the ecological succession [71] point of view. This trend was consistent in mature forests, where carbon levels surpassed those in younger forests, characterised by a particular soil process, including carbon cycling and litter dynamics [30]. Overall, based on the type of silvicultural interventions, the literature may have contradictory results regarding the impact on soil carbon stocks [9]. Nevertheless, this effect of repeated thinning on mineral soil could also be neglected [77]. We can speculate that the natural regeneration of the new forest shortly after 1990 (No-SI), achieved quite early as a result of favourable conditions (soil and climate), mediated the negative effect of forest intervention on the SOC. Furthermore, according to the similar topography of each site (slope < 10% and western aspect) we figured out that a stabilizing effect of clay on SOC contributed to a steady soil leaching pattern. Indeed, a study conducted in Romanian forests [15] reported that increasing the management intensity will lead to a small or negligible soil carbon stock loss. Considering all the above, the assumption that a forest “do nothing” (no active silvicultural interventions) in the last few decades, representing a sink rather than a source of carbon stock, maybe a good perception, at least for landowners with small area forests, where offset credits can be a certainty for the near future [78,79]. In the case of natural site conditions specific to our study, the main results highlight the inherent ability of forest ecosystems to recover and maintain their carbon sequestration function over time, especially where the forest was clear-cut and then abandoned but remains unchanged (No-SI). Additionally, the variability in significance across different carbon pool categories especially highlighted the natural ecosystem dynamics and the varied impact of forest management practices. Nevertheless, some limitations that may have impacted the precision and accuracy of our study should be addressed. Firstly, our study relies on historical assumptions and involves a modelling exercise, which could introduce inherent uncertainties. One potential limitation lies in the accuracy of the CASMOFOR model, which, while a powerful tool, may not precisely capture carbon sequestration across diverse forest stands over time. Results using the CASMOFOR model are subject to uncertainties because of various factors [38] due to the used parameters, making the results more sensitive to our assumptions (that tree mortality and tree growth are relatively constant over all periods). The nonparametric analysis (Kruskal-Wallis test) confirmed the significant impact on some carbon pools (i.e., CS_AGB, CS_DW, CSC_AGB) while suggesting that other pools (i.e., CS_SOC) might be less sensitive or require more data for a conclusive analysis. Overall, the variations of carbon stock and carbon stock change are influenced by different factors such as silvicultural interventions (i.e., thinning, shelterwood) or the rate and intensity of natural disturbance (i.e., insect pests, wind storms, forest fires). Also, the sampling design (i.e., the number of increment cores, the number of plots, soil sampling) to reflect the description of forest heterogeneity, such as the No-SI stand, can be a source of errors. Thus, the more plots and sites with similar carbon sequestration rates for each forest management practice, the greater the applicability of the forest management practice from stand level to region level [80]. On the other hand, the influence of stand age on the carbon sequestration process should be considered [80], even though natural regeneration, especially in High-SI stands, has not been considered. Besides, data input from other vegetation types, such as understory (i.e., grass, shrubs), was considered negligible. Future research should incorporate additional data into the model to account for the correlation between climate change and disturbances, including both natural and anthropogenic influences.

5. Conclusions

The study findings show that to increase carbon sequestration in forest ecosystems, it is imperative to understand and quantify the impact of silvicultural management, especially in carbon budget modelling scenarios.
Based on our results, the silvicultural interventions or different tree-length harvesting systems (short and long-term) significantly influence the capacity of the forest to grow and implicitly store carbon within peri-urban forest ecosystems. Secondary succession forests without silvicultural interventions (No-SI) showcased enhanced resilience by exhibiting the highest annual carbon stock change. This underlines the critical capacity of forest ecosystems to recover and sustain carbon sequestration after disturbances, provided the land use remains unchanged. Nevertheless, we figured out that the silvicultural interventions exert strong control over living tree biomass but not in the soil. In addition, the similar topography (i.e., 10% slope) and soil conditions (i.e., sandy-clay texture) of the sites possibly contributed to a soil stable leaching pattern, with insignificant effect on differences of SOC between investigated forests. This finding highlights that soil C stocks are better maintained than living biomass C stocks against losses due to natural and anthropogenic disturbances. Also, the indispensable role of forest conservation and sustainable management practices in bolstering carbon sequestration is highlighted by the highest carbon stocks across all pools in the Low-SI. This is crucial for meeting emission reduction targets and mitigating climate change impacts, reinforcing the importance of strategic forest management.
Moreover, the model used (CASMOFOR) to highlight the carbon dynamic by each pool provided an acceptable solution for simulation carbon stocks under FMP, at least for oak species at stand scale. However, the model’s limitations are mostly related to data availability in large areas and other pools that were not investigated, such as understory vegetation. Our results of C stock and sequestration can be considered, especially in secondary succession forest areas, for the national GHG reports of Romania.

Supplementary Materials

The following supporting information can be downloaded at: https://www.mdpi.com/article/10.3390/land13040492/s1, Table S1. Coefficient regression established by each forest species; Table S2. Variables and correction factors established to estimate dry biomass for juvenile trees; Table S3. The mean value for each pool of carbon stocks (tonnes C ha−1); Table S4. A pairwise post hoc test on sites for each carbon pool was performed using the Wilcoxon signed-rank test with Bonferroni correction; Table S5. The mean value of annual living biomass is determined by tree volume, carbon stock, and carbon dioxide amount.

Author Contributions

Conceptualization, G.R.R., C.I.B. and S.P.; methodology, C.I.B., G.R.R., S.P., A.B.C., T.S. and A.Z.; software, G.R.R., S.P. and C.I.B.; validation, G.R.R., S.P. and S.L.; formal analysis, C.I.B., G.R.R. and S.P.; investigation, G.R.R. and S.L.; resources, C.I.B., G.R.R. and S.P.; data curation, C.I.B. and S.P.; writing—original draft preparation, C.I.B. and G.R.R.; writing—review and editing, C.I.B., G.R.R. and S.P.; visualisation, G.R.R., S.P. and C.I.B.; supervision, G.R.R., S.P. and S.L.; project administration, G.R.R. and C.I.B.; funding acquisition, G.R.R. and S.L. All authors have read and agreed to the published version of the manuscript.

Funding

This research was financed by the Ministry of Research, Innovation and Digitization, under the projects PN 23090101 and PN 23090203, within the FORCLIMSOC program (Sustainable Forest Management Adapted to Climate Change and Societal Challenges) and partially by the Ministry of Water, Environment and Forests, under the Contract 47/N/2019.

Data Availability Statement

The data presented in this study are available on request from the corresponding author.

Acknowledgments

The authors would like to thank the members involved in the soil carbon analysis laboratory of the Brașov Station Research Institute, INCDS “Marin Drăcea”. Also, we thank the three anonymous reviewers and editors for their valuable suggestions and comments on our manuscript.

Conflicts of Interest

The authors declare no conflicts of interest.

References

  1. Intergovernmental Panel on Climate Change (IPCC). Climate Change 2021—The Physical Science Basis: Working Group I Contribution to the Sixth Assessment Report of the Intergovernmental Panel on Climate Change; Cambridge University Press: Cambridge, UK, 2023. [Google Scholar]
  2. Charnley, S.; Diaz, D.; Gosnell, H. Mitigating Climate Change Through Small-Scale Forestry in the USA: Opportunities and Challenges. Small-Scale For. 2010, 9, 445–462. [Google Scholar] [CrossRef]
  3. McAfee, K. Green Economy and Carbon Markets for Conservation and Development: A Critical View. Int. Environ. Agreem. 2016, 16, 333–353. [Google Scholar] [CrossRef]
  4. Christidisa, N.; Stotta, P.A. Human Influence on Seasonal Precipitation in Europe. J. Clim. 2022, 35, 5215–5231. [Google Scholar] [CrossRef]
  5. Cacho, O.; Hean, R.; Karanja, F. Accounting for Carbon Sequestration and Its Implications for Land-Use Change and Forestry Projects. CABI Rev. 2009, 3, 1–17. [Google Scholar] [CrossRef]
  6. Köhl, M.; Linser, S.; Prins, K.; Talarczyk, A. The EU Climate Package “Fit for 55”—A Double-Edged Sword for Europeans and Their Forests and Timber Industry. For. Policy Econ. 2021, 132, 102596. [Google Scholar] [CrossRef]
  7. Nonini, L.; Fiala, M. Assessment of Forest Wood and Carbon Stock at the Stand Level: First Results of a Modeling Approach for an Italian Case Study Area of the Central Alps. Sustainability 2022, 14, 3898. [Google Scholar] [CrossRef]
  8. Nunes, L.J.R.; Meireles, C.I.R.; Pinto Gomes, C.J.; Almeida Ribeiro, N.M.C. Forest Management and Climate Change Mitigation: A Review on Carbon Cycle Flow Models for the Sustainability of Resources. Sustainability 2019, 11, 5276. [Google Scholar] [CrossRef]
  9. Mayer, M.; Prescott, C.E.; Abaker, W.E.A.; Augusto, L.; Cécillon, L.; Ferreira, G.W.D.; James, J.; Jandl, R.; Katzensteiner, K.; Laclau, J.-P.; et al. Tamm Review: Influence of Forest Management Activities on Soil Organic Carbon Stocks: A Knowledge Synthesis. For. Ecol. Manag. 2020, 466, 118127. [Google Scholar] [CrossRef]
  10. Ameray, A.; Bergeron, Y.; Valeria, O.; Montoro Girona, M.; Cavard, X. Forest Carbon Management: A Review of Silvicultural Practices and Management Strategies Across Boreal, Temperate and Tropical Forests. Curr. For. Rep. 2021, 7, 245–266. [Google Scholar] [CrossRef]
  11. Pilli, R.; Grassi, G.; Kurz, W.A.; Viñas, R.A.; Guerrero, N.H. Modelling Forest Carbon Stock Changes as Affected by Harvest and Natural Disturbances. I. Comparison with Countries’ Estimates for Forest Management. Carbon Balance Manag. 2016, 11, 5. [Google Scholar] [CrossRef]
  12. Nabuurs, G.-J.; Delacote, P.; Ellison, D.; Hanewinkel, M.; Hetemäki, L.; Lindner, M. By 2050 the Mitigation Effects of EU Forests Could Nearly Double through Climate Smart Forestry. Forests 2017, 8, 484. [Google Scholar] [CrossRef]
  13. Houghton, R.A.; House, J.I.; Pongratz, J.; Van Der Werf, G.R.; DeFries, R.S.; Hansen, M.C.; Le Quéré, C.; Ramankutty, N. Carbon Emissions from Land Use and Land-Cover Change. Biogeosciences 2012, 9, 5125–5142. [Google Scholar] [CrossRef]
  14. Didion, M.; Blujdea, V.; Grassi, G.; Hernández, L.; Jandl, R.; Kriiska, K.; Lehtonen, A.; Saint-André, L. Models for Reporting Forest Litter and Soil C Pools in National Greenhouse Gas Inventories: Methodological Considerations and Requirements. Carbon Manag. 2016, 7, 79–92. [Google Scholar] [CrossRef]
  15. Blujdea, V.N.; Viskari, T.; Kulmala, L.; Gârbacea, G.; Dutcă, I.; Miclăuș, M.; Marin, G.; Liski, J. Silvicultural Interventions Drive the Changes in Soil Organic Carbon in Romanian Forests According to Two Model Simulations. Forests 2021, 12, 795. [Google Scholar] [CrossRef]
  16. Birdsey, R.; Pan, Y. Trends in Management of the World’s Forests and Impacts on Carbon Stocks. For. Ecol. Manag. 2015, 355, 83–90. [Google Scholar] [CrossRef]
  17. Pilli, R.; Alkama, R.; Cescatti, A.; Kurz, W.A.; Grassi, G. The European Forest Carbon Budget under Future Climate Conditions and Current Management Practices. Biogeosciences 2022, 19, 3263–3284. [Google Scholar] [CrossRef]
  18. Haya, B.K.; Evans, S.; Brown, L.; Bukoski, J.; Butsic, V.; Cabiyo, B.; Jacobson, R.; Kerr, A.; Potts, M.; Sanchez, D.L. Comprehensive Review of Carbon Quantification by Improved Forest Management Offset Protocols. Front. For. Glob. Chang. 2023, 6, 958879. [Google Scholar] [CrossRef]
  19. Powers, M.; Kolka, R.; Palik, B.; McDonald, R.; Jurgensen, M. Long-Term Management Impacts on Carbon Storage in Lake States Forests. For. Ecol. Manag. 2011, 262, 424–431. [Google Scholar] [CrossRef]
  20. Ganatsas, P.; Tsakaldimi, M.; Karydopoulos, T.; Petaloudi, L.-M.; Papaemmanouil, A.; Papadopoulos, S.; Gerochristou, S. Carbon Pools in a 77 Year-Old Oak Forest under Conversion from Coppice to High Forest. Sustainability 2022, 14, 13764. [Google Scholar] [CrossRef]
  21. Calfapietra, C.; Barbati, A.; Perugini, L.; Ferrari, B.; Guidolotti, G.; Quatrini, A.; Corona, P. Carbon Mitigation Potential of Different Forest Ecosystems under Climate Change and Various Managements in Italy. Ecosyst. Health Sustain. 2015, 1, 1–9. [Google Scholar] [CrossRef]
  22. Liski, J.; Perruchoud, D.; Karjalainen, T. Increasing Carbon Stocks in the Forest Soils of Western Europe. For. Ecol. Manag. 2002, 169, 159–175. [Google Scholar] [CrossRef]
  23. Röhling, S.; Dunger, K.; Kändler, G.; Klatt, S.; Riedel, T.; Stümer, W.; Brötz, J. Comparison of Calculation Methods for Estimating Annual Carbon Stock Change in German Forests under Forest Management in the German Greenhouse Gas Inventory. Carbon Balance Manag. 2016, 11, 12. [Google Scholar] [CrossRef]
  24. Kim, H.; Kim, Y.-H.; Kim, R.; Park, H. Reviews of Forest Carbon Dynamics Models That Use Empirical Yield Curves: CBM-CFS3, CO2FIX, CASMOFOR, EFISCEN. For. Sci. Technol. 2015, 11, 212–222. [Google Scholar] [CrossRef]
  25. Sil, Â.; Fonseca, F.; Gonçalves, J.; Honrado, J.; Marta-Pedroso, C.; Alonso, J.; Ramos, M.; Azevedo, J.C. Analysing Carbon Sequestration and Storage Dynamics in a Changing Mountain Landscape in Portugal: Insights for Management and Planning. Int. J. Biodivers. Sci. Ecosyst. Serv. Manag. 2017, 13, 82–104. [Google Scholar] [CrossRef]
  26. Vesterdal, L.; Christensen, M. The Carbon Pools in a Danish Semi-Natural Forest. Ecol. Bull. 2007, 52, 113–121. [Google Scholar]
  27. Nave, L.E.; Vance, E.D.; Swanston, C.W.; Curtis, P.S. Harvest Impacts on Soil Carbon Storage in Temperate Forests. For. Ecol. Manag. 2010, 259, 857–866. [Google Scholar] [CrossRef]
  28. Blujdea, V.N.B.; Sikkema, R.; Dutca, I.; Nabuurs, G.-J. Two Large-Scale Forest Scenario Modelling Approaches for Reporting CO2 Removal: A Comparison for the Romanian Forests. Carbon Balance Manag. 2021, 16, 25. [Google Scholar] [CrossRef]
  29. Yang, B.; Zhang, W.; Lu, Y.; Zhang, W.; Wang, Y. Carbon Storage Dynamics of Secondary Forest Succession in the Central Loess Plateau of China. Forests 2019, 10, 342. [Google Scholar] [CrossRef]
  30. Badalamenti, E.; Battipaglia, G.; Gristina, L.; Novara, A.; Rühl, J.; Sala, G.; Sapienza, L.; Valentini, R.; Mantia, T.L. Carbon Stock Increases up to Old Growth Forest along a Secondary Succession in Mediterranean Island Ecosystems. PLoS ONE 2019, 14, e0220194. [Google Scholar] [CrossRef]
  31. Pérez-Hernández, J.; Gavilán, R.G. Impacts of Land-Use Changes on Vegetation and Ecosystem Functioning: Old-Field Secondary Succession. Plants 2021, 10, 990. [Google Scholar] [CrossRef]
  32. Blujdea, V.; Marin, G. Commitments and contribution of the forestry sector to the achievement of reduction targets of Romania’s GHG. B. Bucov. For. 2018, 18, 23–34. [Google Scholar] [CrossRef]
  33. Romanian National Forest Inventory (NFI). Available online: www.roifn.ro/site (accessed on 24 July 2023).
  34. Leca, Ș.; Popa, I.; Chivulescu, Ș.; Popa, A.; Pitar, D.; Dobre, A.C.; Pascu, I.S.; Apostol, B.; Badea, O. Structure and Diversity in a Periurban Forest of Bucharest, Romania. Ann. For. Res. 2023, 66, 139–153. [Google Scholar] [CrossRef]
  35. Chivulescu, S.; Cadar, N.; Hapa, M.; Capalb, F.; Radu, R.G.; Badea, O. The Necessity of Maintaining the Resilience of Peri-Urban Forests to Secure Environmental and Ecological Balance: A Case Study of Forest Stands Located on the Romanian Sector of the Pannonian Plain. Diversity 2023, 15, 380. [Google Scholar] [CrossRef]
  36. Geacu, S.; Grigorescu, I. Historical Changes in Urban and Peri-Urban Forests: Evidence from the Galați Area, Romania. Land 2022, 11, 2043. [Google Scholar] [CrossRef]
  37. National Inventory Report (NIR)-Romania. Available online: www.unfccc.int/documents/274077 (accessed on 24 July 2023).
  38. Somogyi, Z. Projected Effects of Climate Change on the Carbon Stocks of European Beech (Fagus sylvatica L.) Forests in Zala County, Hungary. For. J. 2016, 62, 3–14. [Google Scholar] [CrossRef]
  39. Harris, I.; Osborn, T.J.; Jones, P.; Lister, D. Version 4 of the CRU TS Monthly High-Resolution Gridded Multivariate Climate Dataset. Sci. Data 2020, 7, 109. [Google Scholar] [CrossRef] [PubMed]
  40. Țărău, D.; Rogobete, G.; Dicu, D.; Niţǎ, L. Romanian Soil Taxonomy System SRTS-2012. Res. J. Agric. Sci. 2012, 44, 140–148. [Google Scholar]
  41. U.S. Geological Survey (USGS) EROS Center (EDC). CORONA Satellite Photographs. Available online: http://earthexplorer.usgs.gov (accessed on 12 February 2024).
  42. Giurgiu, V.; Decei, I.; Drăghiciu, D. Metode Şi Tabele Dendrometrice [Methods and Yield Tables]; Editura Ceres: Bucuresti, Romania, 2004; pp. 27–575. [Google Scholar]
  43. Braga, C.I.; Crisan, V.E.; Petritan, I.C.; Scarlatescu, V.; Vasile, D.; Lazar, G.; Petritan, A.M. Short-Term Effects of Anthropogenic Disturbances on Stand Structure, Soil Properties, and Vegetation Diversity in a Former Virgin Mixed Forest. Forests 2023, 14, 742. [Google Scholar] [CrossRef]
  44. Blujdea, V.N.B.; Pilli, R.; Dutca, I.; Ciuvat, L.; Abrudan, I.V. Allometric Biomass Equations for Young Broadleaved Trees in Plantations in Romania. For. Ecol. Manag. 2012, 264, 172–184. [Google Scholar] [CrossRef]
  45. Dutcă, I.; Zianis, D.; Petrițan, I.C.; Bragă, C.I.; Ștefan, G.; Yuste, J.C.; Petrițan, A.M. Allometric Biomass Models for European Beech and Silver Fir: Testing Approaches to Minimize the Demand for Site-Specific Biomass Observations. Forests 2020, 11, 1136. [Google Scholar] [CrossRef]
  46. Přívětivý, T.; Baldrian, P.; Šamonil, P.; Vrška, T. Deadwood Density and Moisture Variation in a Natural Temperate Spruce-Fir-Beech Forest 2017. [CrossRef]
  47. Eggleston, H.S.; Buendia, L.; Miwa, K.; Ngara, T.; Tanabe, K. (Eds.) IPCC Guidelines for National Greenhouse Gas Inventories, Prepared by the National Greenhouse Gas Inventories Programme; IGES: Hayama, Japan, 2006. [Google Scholar]
  48. Popa, A.; Popa, I.; Roibu, C.-C.; Badea, O.N. Do Different Tree-Ring Proxies Contain Different Temperature Signals? A Case Study of Norway Spruce (Picea abies (L.) Karst) in the Eastern Carpathians. Plants 2022, 11, 2428. [Google Scholar] [CrossRef] [PubMed]
  49. Maxwell, R.S.; Larsson, L.-A. Measuring Tree-Ring Widths Using the CooRecorder Software Application. Dendrochronologia 2021, 67, 125841. [Google Scholar] [CrossRef]
  50. Grissino-Mayer, H.D. Evaluating Crossdating Accuracy: A Manual and Tutorial for the Computer Program COFECHA. Tree-Ring Res. 2001, 57, 205–221. [Google Scholar]
  51. Cools, N.; De Vos, B. Part X: Sampling and Analysis of Soil. Version 2020-1. In UNECE ICP Forests Programme Co-Ordinating Centre (Ed.): Manual on Methods and Criteria for Harmonized Sampling, Assessment, Monitoring and Analysis of the Effects of Air Pollution on Forests; Thünen Institute of Forest Ecosystems: Eberswalde, Germany, 2020; ISBN 978-3-86576-162-0. [Google Scholar]
  52. Baritz, R.; Seufert, G.; Montanarella, L.; Van Ranst, E. Carbon Concentrations and Stocks in Forest Soils of Europe. For. Ecol. Manag. 2010, 260, 262–277. [Google Scholar] [CrossRef]
  53. Dinca, L.; Sparchez, G.; Dincǎ, M.; Viorel, B. Organic Carbon Concentrations and Stocks in Romanian Mineral Forest Soils. Ann. For. Res. 2012, 55, 229–241. [Google Scholar]
  54. R Core Team. R: A Language and Environment for Statistical Computing; v4.3.2; R Foundation for Statistical Computing: Vienna, Austria, 2021. [Google Scholar]
  55. Fox, J.; Weisberg, S. An R Companion to Applied Regression; SAGE Publications: Thousand Oaks, CA, USA, 2018; ISBN 978-1-5443-3648-0. [Google Scholar]
  56. Somogyi, Z.; Hidy, D.; Gelybó, G.; Barcza, Z.; Churkina, G.; Haszpra, L.; Horváth, L.; Machon, A.; Grosz, B. Models and Their Adaptation. In Atmospheric Greenhouse Gases: The Hungarian Perspective; Haszpra, L., Ed.; Springer: Dordrecht, The Netherlands, 2011; pp. 201–228. ISBN 978-90-481-9950-1. [Google Scholar]
  57. Hiraishi, T.; Krug, T.; Tanabe, K.; Srivastava, N.; Baasansuren, J.; Fukuda, M.; Troxler, T.G. IPCC 2014, 2013 Revised Supplementary Methods and Good Practice Guidance Arising from the Kyoto Protocol; IPCC: Geneva, Switzerland, 2014; ISBN 978-92-9169-140-1. [Google Scholar]
  58. Keith, H.; Lindenmayer, D.; Mackey, B.; Blair, D.; Carter, L.; McBurney, L.; Okada, S.; Konishi-Nagano, T. Managing Temperate Forests for Carbon Storage: Impacts of Logging versus Forest Protection on Carbon Stocks. Ecosphere 2014, 5, art75. [Google Scholar] [CrossRef]
  59. Ciais, P.; Schelhaas, M.J.; Zaehle, S.; Piao, S.L.; Cescatti, A.; Liski, J.; Luyssaert, S.; Le-Maire, G.; Schulze, E.-D.; Bouriaud, O.; et al. Carbon Accumulation in European Forests. Nat. Geosci. 2008, 1, 425–429. [Google Scholar] [CrossRef]
  60. Vachnadze, G.; Tiginashvili, Z.; Tsereteli, G.; Aptsiauri, B.; Basilidze, L. Carbon Stock Sequestered in the Phytocenosis of Oak Forests in Georgia. Ann. Agrar. Sci. 2018, 16, 476–480. [Google Scholar] [CrossRef]
  61. Goodale, C.L.; Apps, M.J.; Birdsey, R.A.; Field, C.B.; Heath, L.S.; Houghton, R.A.; Jenkins, J.C.; Kohlmaier, G.H.; Kurz, W.; Liu, S.; et al. Forest carbon sinks in the northern hemisphere. Ecol. Appl. 2002, 12, 891–899. [Google Scholar] [CrossRef]
  62. Wijedasa, L.S.; Jain, A.; Ziegler, A.D.; Evans, T.A.; Fung, T. Estimating Carbon Biomass in Forests Using Incomplete Data. Biotropica 2021, 53, 397–408. [Google Scholar] [CrossRef]
  63. Ledermann, T.; Braun, M.; Kindermann, G.; Jandl, R.; Ludvig, A.; Schadauer, K.; Schwarzbauer, P.; Weiss, P. Effects of Silvicultural Adaptation Measures on Carbon Stock of Austrian Forests. Forests 2022, 13, 565. [Google Scholar] [CrossRef]
  64. Gao, Y.; Cheng, J.; Ma, Z.; Zhao, Y.; Su, J. Carbon Storage in Biomass, Litter, and Soil of Different Plantations in a Semiarid Temperate Region of Northwest China. Ann. For. Sci. 2014, 71, 427–435. [Google Scholar] [CrossRef]
  65. Petrea, S.; Radu, R.; Braga, C.; Cucu, A.; Serban, T.; Zaharia, A.; Pepelea, D.; Ienasoiu, G.; Petritan, I. The Role of Wood Density Variation and Biomass Allocation in Accurate Forest Carbon Stock Estimation of European Beech (Fagus sylvatica L.) Mountain Forests. Forests 2024, 15, 404. [Google Scholar] [CrossRef]
  66. Chave, J.; Coomes, D.; Jansen, S.; Lewis, S.L.; Swenson, N.G.; Zanne, A.E. Towards a Worldwide Wood Economics Spectrum. Ecol. Lett. 2009, 12, 351–366. [Google Scholar] [CrossRef] [PubMed]
  67. Thomas, S.; Malczewski, G. Wood Carbon Content of Tree Species in Eastern China: Interspecific Variability and the Importance of the Volatile Fraction. J. Environ. Manag. 2007, 85, 659–662. [Google Scholar] [CrossRef] [PubMed]
  68. Stephenson, N.L.; Van Mantgem, P.J.; Bunn, A.G.; Bruner, H.; Harmon, M.E.; O’Connell, K.B.; Urban, D.L.; Franklin, J.F. Causes and Implications of the Correlation between Forest Productivity and Tree Mortality Rates. Ecol. Monogr. 2011, 81, 527–555. [Google Scholar] [CrossRef]
  69. Luyssaert, S.; Schulze, E.-D.; Börner, A.; Knohl, A.; Hessenmöller, D.; Law, B.E.; Ciais, P.; Grace, J. Old-Growth Forests as Global Carbon Sinks. Nature 2008, 455, 213–215. [Google Scholar] [CrossRef]
  70. Larson, A.J.; Lutz, J.A.; Donato, D.C.; Freund, J.A.; Swanson, M.E.; HilleRisLambers, J.; Sprugel, D.G.; Franklin, J.F. Spatial Aspects of Tree Mortality Strongly Differ between Young and Old-Growth Forests. Ecology 2015, 96, 2855–2861. [Google Scholar] [CrossRef]
  71. Mayer, P.M. Ecosystem and Decomposer Effects on Litter Dynamics along an Old Field to Old-Growth Forest Successional Gradient. Acta Oecologica 2008, 33, 222–230. [Google Scholar] [CrossRef]
  72. Martius, C.; Höfer, H.; Garcia, M.V.B.; Römbke, J.; Förster, B.; Hanagarth, W. Microclimate in Agroforestry Systems in Central Amazonia: Does Canopy Closure Matter to Soil Organisms? Agrofor. Syst. 2004, 60, 291–304. [Google Scholar] [CrossRef]
  73. Lajtha, K.; Bowden, R.D.; Crow, S.; Fekete, I.; Kotroczó, Z.; Plante, A.; Simpson, M.J.; Nadelhoffer, K.J. The Detrital Input and Removal Treatment (DIRT) Network: Insights into Soil Carbon Stabilization. Sci. Total Environ. 2018, 640–641, 1112–1120. [Google Scholar] [CrossRef] [PubMed]
  74. Jörgensen, K.; Granath, G.; Lindahl, B.D.; Strengbom, J. Forest Management to Increase Carbon Sequestration in Boreal Pinus Sylvestris Forests. Plant Soil 2021, 466, 165–178. [Google Scholar] [CrossRef]
  75. Achat, D.L.; Fortin, M.; Landmann, G.; Ringeval, B.; Augusto, L. Forest Soil Carbon Is Threatened by Intensive Biomass Harvesting. Sci. Rep. 2015, 5, 15991. [Google Scholar] [CrossRef] [PubMed]
  76. James, J.; Harrison, R. The Effect of Harvest on Forest Soil Carbon: A Meta-Analysis. Forests 2016, 7, 308. [Google Scholar] [CrossRef]
  77. Bravo-Oviedo, A.; Ruiz-Peinado, R.; Modrego, P.; Alonso, R.; Montero, G. Forest Thinning Impact on Carbon Stock and Soil Condition in Southern European Populations of P. sylvestris L. For. Ecol. Manag. 2015, 357, 259–267. [Google Scholar] [CrossRef]
  78. Bigsby, H. Making Carbon Markets Work for Small Forest Owners. N. Z. J. For. 2009, 54, 31–37. [Google Scholar]
  79. Liu, X.; Cho, S.-H.; Armsworth, P.R.; Hayes, D.J. Where and When Carbon Storage Can Be Bought Cost Effectively from Private Forest Owners. Environ. Manag. 2021, 67, 930–948. [Google Scholar] [CrossRef]
  80. Clay, L.; Motallebi, M.; Song, B. An Analysis of Common Forest Management Practices for Carbon Sequestration in South Carolina. Forests 2019, 10, 949. [Google Scholar] [CrossRef]
Figure 1. Historical map of the study site obtained from original Corona (from 1982, [41]) image strip (A) and aerial map of the studied location in 2022 (B); Study location on the southeast European map (C); Current status of the three forest types studied (D): No-SI, No Silvicultural Interventions; Low-SI, Low Silvicultural Interventions; High-SI, High Silvicultural Intervention. The shaded yellow in (A) represents the initial (i.e., the year 1982) forest landscape; The dark yellow line represents the border for each site studied in the year 2022; In (C), the green dot represents the study location.
Land 13 00492 g001
Figure 2. Absolute contribution of the forest carbon pools (A) and relative contribution of the components to total carbon pools (B). The LB denotes the living biomass (AGB—aboveground biomass and BGB—belowground biomass), DOM represents dead organic matter (litter and dead wood), and SOC represents soil organic carbon; No-SI refers to the forest without silvicultural interventions, Low-SI indicates the forest with low-intensity silvicultural interventions while High-SI indicates the forest with high-intensity silvicultural interventions.
Land 13 00492 g002
Figure 3. Annual carbon stock change (tonnes C ha−1 year−1) for living trees biomass (LB) components (AGB—aboveground biomass, BGB—belowground biomass) of each investigated site. Significant differences are indicated with lowercase letters. Vertical lines represent standard deviations.
Land 13 00492 g003
Figure 4. Annual carbon stock changes in living biomass (A) and annual carbon stock considering all five pools (B) on each site. No-SI refers to the forest without silvicultural interventions, Low-SI indicates the forest with low-intensity silvicultural interventions, and High-SI indicates the forest with high-intensity silvicultural interventions.
Land 13 00492 g004
Table 1. Stand characteristics for each investigated forest site.
Stand CharacteristicsNo-SI
(M ± SD)
Low-SI
(M ± SD)
High-SI
(M ± SD)
Stand age (years)25 ± 1122 ± 1126 ± 3
Number of species in stand composition911
Trees density (N ha−1)1132.4 ± 415.4120.0 ± 12.768.0 ± 16.3
Juvenile trees (d < 2 cm) density (N ha−1) 1503.3 ± 869.8 NANA
Basal area (m2 ha−1)18.2 ± 3.7 37.4 ± 1.3 12.1 ± 1.8
Current annual increment (m3 year−1 ha−1)11.5 ± 3.86.3 ± 1.32.7 ± 1.4
Growing stock per area (m3 ha−1)135.8 ± 41.9691.0 ± 186.8187.9 ± 118.1
Data represent the mean value (M) ± standard deviation (SD); NA is not available data.
Table 2. Summary of Levene’s test for homogeneity of variance and Shapiro-Wilk normality test following the Kruskal-Wallis result test for carbon pool variability across forest management practices.
Carbon PoolLevene TestShapiro-Wilk W TestKruskal-Wallis Test
(Homogeneity of Variances)(Test of Normality)
FpWpHp adj.
CS_litter0.4680.6420.8020.009 **4.0360.133
CS_soil0.2980.7500.9380.4924.9090.086
CS_AGB0.1800.8360.744<0.001 ***9.7510.008 **
CS_DW2.4180.1110.721<0.001 ***10.9400.004 **
CSC_AGB4.46540.022 *0.9420.13418.703<0.001 ***
* p < 0.1, ** p < 0.01, *** p < 0.001.
Disclaimer/Publisher’s Note: The statements, opinions and data contained in all publications are solely those of the individual author(s) and contributor(s) and not of MDPI and/or the editor(s). MDPI and/or the editor(s) disclaim responsibility for any injury to people or property resulting from any ideas, methods, instructions or products referred to in the content.

