Abstract
Investigating the changes in the runoff and sediment coupling relationship in the Middle Yellow River Basin of China can not only deepen the understanding of soil loss control in arid areas, but also help solve key issues of regional ecological protection. Since the 1960s, soil- and water-conservation projects have been implemented in the Middle Yellow River Basin, inducing a significant reduction in runoff and sediment and changes in the relationship between runoff and sediment. The study identified the change points of coupling relationship between runoff and sediment in the Wuding River Basin (WRB) by constructing a diagnostic method based on coupling coordination degree and the Pettitt test; the study validated this using the Copula function and analyzed the impacts of erosion energy and underlying surface factors. The results showed the following: (1) the method based on coupling coordination degree and the Pettit test could accurately reflect the coupling relationship of runoff and sediment and identify two change points (1971 and 1996); (2) runoff and sediment in the WRB decreased gradually over three periods (P1, 1960–1970; P2, 1971–1995; P3, 1996–2020), with an average annual runoff of 15.34 × 10⁸, 10.72 × 10⁸, and 8.32 × 10⁸ m3 and average annual sediment load of 1.84 × 10⁸, 0.82 × 10⁸, and 0.32 × 10⁸ t, respectively; (3) the maximum possible joint design value of runoff and sediment under different return periods in P1 were all the highest, followed by P2 and P3, and the larger the return period, the higher the maximum possible joint design value; (4) runoff erosion power could promote runoff and sediment in PE (1960–2020), P1, P2 and P3 at a significant level, check dams and terrace could decrease runoff and sediment significantly in PE, and the highest contribution to runoff reduction was check dam (95.4%), while the highest contribution to sediment reduction was REP (93.8%). The study can provide a new way to analyze the changes in the runoff and sediment relationship and provide scientific support for runoff and sediment regulation in the Middle Yellow River Basin.
1. Introduction
A good runoff and sediment relationship is critical to the health of the river system and beneficial to regional ecosystem stability, economic prosperity, and human well-being [1,2,3]. Normally, runoff and sediment in the river system is mainly induced by rainfall and underlying surfaces, which dominate the amount of rainfall converted into runoff generated sediment yield [4,5]. As such indicating relationships among runoff, sediment and underlying surfaces can help to assess the effectiveness of conservation measures and improvements in river management [6,7].
As the primary source of sediment of the Yellow River, especially for the coarse sediment-producing area, to mitigate the severe soil loss in the Middle Yellow River Basin (MYRB) has always been a hot research topic [8]. After more than 60 years of comprehensive management, sediment in the MYRB during 2001 to 2018 decreased by 85% compared with that during 1919 to 1959 [9]. The major cause of this exciting result is the many conservation measures that have been adopted in the MYRB since the 1960s. These measures mainly contain check dam construction, terracing, tree and grass planting, which were implemented rapidly in the 1970s, 1980s and 1990s, respectively [10]. Among them, check dams constructed in gullies decrease sediment of river outlets by trapping upstream sediment [11]. Terraces reduce sediment by absorbing slope rainwater and diminishing runoff energy [12]. Vegetation restoration can improve soil property and enhance soil anti-erodibility so as to control runoff and sediment entering gullies [13]. Therefore, check dams and terraces were the primary factors to reduce sediment during the 1970s to 1980s. Meanwhile, vegetation restoration plays a key role after 1999, especially the Grain for Green project, which was implemented on the Loess Plateau to combat soil and water loss into the Yellow River.
The runoff and sediment reduction in the MYRB mainly due to the decrease in runoff and sediment of sub-catchments in this region [14], especially for the Wuding River Basin (WRB), which was the most significant sediment reduction tributary [15]. Since the 1960s, the underlying surface of the WRB has been gradually changed for check dam and terrace construction to enhance grain production [16]. After the 1970s, runoff and sediment sharply decreased, mainly due to the impacts of the underlying surface, while precipitation and evapotranspiration had little influence [17]. By using elasticity coefficient method, Jin and Li calculated the contribution of underlying surfaces, such as check dams and vegetation restoration, for runoff reduction accounting for 78.75% and for sediment reduction accounting for 87.78% [18]. Shi et al. obtained similar results in that the contribution of underlying surfaces to runoff and sediment reduction in the WRB was 75% and 89%, respectively [19]. Of course, some researchers also proposed that the contribution of precipitation and underlying surfaces to runoff and sediment reduction was approximately equal [20].
The essence of soil erosion is the process of erosion energy dissipation, transmission and redistribution [21]. And the change processes of erosion energy mainly take runoff as medium [22]. Improved underlying surfaces can change the movement state of runoff on slope and then regulate erosion energy, which dominates sediment transportation [23]. However, few have attempted to investigate the coupling changes in runoff and sediment and the responses to runoff erosion energy. In this paper, we applied the entirety perspective to indicate the coupling change characteristics of runoff and sediment in the WRB and the impacts of erosion energy and the underlying surface. The specific objectives were as follows: (1) to reveal the coupling change characteristics of runoff and sediment in different periods by using the coupling coordination degree model; (2) to determine the responses of sediment to erosion energy; and (3) to compare the importance of impacting factors to runoff and sediment change.
2. Materials and Methods
2.1. Site Description
The WRB (37°02′–39°00′ N, 107°47′–110°34′ E) is the primary tributary of the Yellow River, which is located in the hinterland of the Loess Plateau (Figure 1). The whole area of the WRB is about 30,261 km2, and the main channel length is 491 km. The elevation of the basin ranges from 600 to 1800 m and average slope of the riverbed is 1.8‰. The landform located in the south of main channel mainly belongs to the hilly–gully region, while the north of the main channel is situated in the wind–sandy region. The basin has a temperate continental monsoon climate. The average annual precipitation was 388 mm between 1960 and 2020, with 70% occurring from June to September. The average and maximum rainfall intensity is 5.4 mm h−1 and 51.2 mm h−1, respectively. The annual temperature ranges from 7.9 °C to 11.2 °C. The loess soil and aeolian sandy soil are the most widely distributed in the basin. Limited by higher temperature and good soil permeability, snowmelt erosion does not occur. As precipitation decreases from southeast to northwest, vegetation types in the southeast of the basin are mainly composed of forest steppe, while the north is mainly composed of desert steppe. Soil erosion in the basin worsens from northwest to southeast. However, because soil- and water-conservation construction has gradually been carried out since the 1960s, especially the implementation of the Returning Farmland to Forests and Grassland Project, soil and water loss in the whole basin has significantly improved.
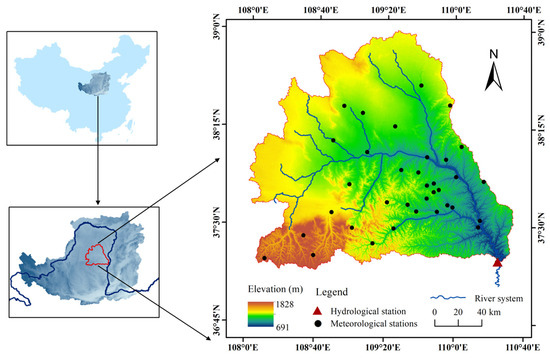
Figure 1.
Location of the WRB.
2.2. Data Preparation
Precipitation and runoff data used in the study were all from the Yellow River Basin Hydrological Yearbook from 1960 to 2020. The average daily runoff data came from the control hydrological station, Baijiachuan. The areal precipitation of the WRB was calculated using the Tyson polygon based on daily average precipitation data, which came from 36 rain-gauge stations in the WRB, including Hanjiamao, Hengshan, Zhaoshiyao, Suide, etc.
Land-use data came from the V1.0 dataset, a fine classification product of 30 m global land cover developed by the Aerospace Information Research Institute, Chinese Academy of Sciences [24]. The study used two periods of land-use data from 1985 and 2019, and the main types of land use were arable land, forest land, grassland, water body, construction land, and unused land, respectively.
The NDVI came from two datasets: GIMMS NDVI and MODIS NDVI. The GIMMS NDVI dataset was sourced from the National Oceanic and Atmospheric Administration “https://psl.noaa.gov (accessed on 12 April 2016)”, with a time series from 1983 to 2015. The spatial resolution of GIMMS NDVI is 8 km with a temporal resolution of 15 days. The MODIS NDVI dataset was sourced from the National Aeronautics and Space Administration “https://ladsweb.modaps.eosdis.nasa.gov/ (accessed on 4 July 2021)”, with a time series from 2000 to 2020. The spatial resolution of MODIS NDVI is 250 m and the temporal resolution is 16 days. According to the method proposed by Jia et al. [25], the study merged two time series together and extended the length of NDVI data from 1983 to 2020.
The information regarding check dams, especially large check dams, contained construction time, coordinates, controlled area, storage capacity and cumulative siltation capacity, which came from the 2011 National Water Resources Census. The information regarding terrace from 1960 to 2011 came from the 2011 National Water Resources Census, and others from 2011 to 2015 were extracted from the V1.0 dataset.
2.3. Methods
2.3.1. Coupling Coordination Degree Model
For a river system, the changes in runoff and its sediment are not independent [26]. Therefore, this study applied the coupling coordination degree to analyze the relationship between runoff and sediment in order to explore the coupling changes in runoff and sediment in the WRB. The formula is as follows:
where D represents the coupling coordination degree; C represents the coupling degree; T represents the comprehensive harmonic index of runoff subsystem and sediment subsystem; u1 and u2, respectively, represent contributions of the runoff subsystem and sediment subsystem to the overall river system; and a and b represent the undetermined coefficients, which often consider that the importance of two subsystems is equal, so a = b = 0.5.
The formula of C is as follows:
In the study, indicators of the runoff subsystem and sediment subsystem corresponded to runoff and sediment of the WRB, respectively. The study assumed that the larger the value of D, the better the coupling relationship of runoff and sediment.
2.3.2. Pettitt Test
The Pettitt test is a nonparametric test method that was conducted by A. Pettitt, which is based on the Mann–Whitney statistical function and used to determine the change in time series [27]. Assuming time t is the most likely point in which change occurs, the time series can then be divided into two parts before and after it. The two samples are x1, x2, …, xt, and xt+1, xt+2, …, xN. The formula for Ut,N is as follows:
where if (xi − xj) > 0, sgn(xi − xj) = 1; if (xi − xj) = 0, sgn(xi − xj) = 0; if (xi − xj) < 0, sgn(xi − xj) = −1.
When reaches the maximum value, the corresponding xt is considered the possible change point. The significance level (p) can be calculated by the following formula:
When p ≤ 0.05, the detected change point is just a significant change point.
2.3.3. Joint Distribution Function Fitting
The copula function is a linking function that can be used to describe the joint distribution of multiple variables and can connect any two marginal distribution functions [28]. As such, the calculation of marginal distribution model and joint distribution model are all based on it. When fitting marginal distribution of runoff and sediment, three popular probability distributions in hydrological analysis were used. They are Gamma distribution, Lognormal distribution and GEV (Generalized Extreme Value) distribution. Meanwhile, the K-S (Kolmogorov–Smirnov) test was used to examine the marginal distribution, and the AIC (Akaike information criterion) minimum criterion was used to determine the optimal marginal distribution [29]. The probability density functions of three marginal distributions are as follows:
- (1)
- Gamma distributionwhere α represents shape parameters; β represents scale parameter.
- (2)
- Lognormal distributionwhere μ represents the mean value of logarithm of variable; σ represents the standard deviation of logarithm of variable.
- (3)
- GEV distributionwhere k represents shape parameters; σ represents scale parameter; μ represents position parameter.
When fitting the joint distribution of runoff and sediment, three popular copula functions of Archimedean type were selected. Detailed information is shown in Table 1.

Table 1.
Three popular copula functions of Archimedean type.
The parameter estimation of the joint distribution function was determined using the maximum likelihood method. By calculating R2 of cumulative probabilities and empirical cumulative probabilities of three distribution functions, the optimal joint distribution function for runoff and sediment was selected.
2.3.4. Joint Return Period and Joint Design Value Calculating
The “OR” joint return period was used as the design control value for safety or risk to characterize the risk that runoff and sediment encounter [30]. For the risk, the occurring probability of unexpected events was considered, so we mainly considered the joint return period of runoff (X) and sediment (Y). The formula of the joint return period is as follows:
where TOR represents the joint return period, which stands for the return period when the design value of any one of the two variables (X and Y) was exceeded. C(u, v) represents the joint distribution function of the marginal distributions (u and v) for X and Y.
For any given joint return period, there are countless combinations of runoff (x) and sediment (y) theoretically that meet the design criteria. When the joint probability density function f(x, y) reaches its maximum value, the joint design value combination (x, y) is just the maximum possible combination for that return period [31]. The formula is as follows:
2.3.5. Cross-Wavelet Transform and Wavelet Coherence
Cross-wavelet transform is a signal analysis technique that combines wavelet transform with cross spectral analysis. This method can analyze the degree of mutual relationship between two time series in the time–frequency domain and identify the phase relationship of the time series in time–frequency space. The main approach is to extract the cross-wavelet energy spectrum and the coherence spectrum. The energy spectrum can reflect the relationship between two time series in the high-energy region, while the coherence spectrum focuses on the relationship between the two time series in the low-energy region [32]. Assuming that the continuous transformation results of two time series X (t) and Y (t) are and respectively, then the cross-wavelet spectrum is as follows:
The wavelet coherence spectrum is as follows:
where represents the complex conjugate of ; M represents the Smoother; represents the cross-wavelet spectral density of and its value reflects the degree of significant correlation between the two time series in the high-energy region; represents the cross-product of wave amplitude of two time series at a certain frequency; and represent the amplitude of two time series’ vibration waves, respectively.
2.3.6. Runoff Erosion Power
In order to determine the annual runoff erosion power, we used the formula proposed by Cheng et al. [33], which is:
where REP represents runoff erosion power, the unit is m4 s−1 km−2; represents the maximum runoff modulus, the unit is m3 s−1 km−2, the value is the ratio of Qm to A; Hy represents average annual runoff depth, the unit is m; Qm represents peak flow modulus, the unit is m3 s−1 km−2; A represents the area of the WRB, the unit is km−2; Qy represents average annual runoff amount, the unit is m3 s−1, the value is equal to the sum of monthly runoff amount within the year divided by 12; Δt represents time interval, the value is 2592 × 103 s, which is calculated based on 30 days per month.
2.3.7. Elastic Coefficient
The elastic coefficient approach, which is based on the Budyko hypothesis, has been frequently used to quantify the key driving factors of runoff and sediment change [34]. Zhang recommended the concept of elasticity for evaluating the sensitivity of sediment to changes in impacting factors [35]. The impacting factors (REP, check dam, terrace and NDVI) elasticity of runoff, sediment () are as follows:
where Ya represents the annual value of runoff, sediment load; Xa represents the annual value of one of the four factors; ΔYa represents the changes in Ya induced by Xa; ΔXa represents changes in annual X; represents the average value of Ya; represents the average value of Xa. The positive value of means Y increased with X, while the negative value means Y decreased with X increased.
Based on , the study estimated the contribution rate of four impacting factors to runoff and sediment changes. The contribution rate (CX) was calculated by the following formula:
where ΔYp represents the difference between the average value of Ya in the change period and average value of Ya in the reference period; ΔXp represents the difference between the average value of Xa in the change period and the average value of Xa in the reference period.
3. Results
3.1. Runoff and Sediment Relationship and Change Diagnosis
3.1.1. Coupling Changes in Runoff and Sediment
Figure 2a shows the time series plot of the coupling coordination degree of runoff and sediment load in the WRB from 1960 to 2020. Except for the 1960s, the values of coupling coordination degree were generally kept above 0.8. The maximum value of coupling coordination degree was 0.96 in 2005, while the minimum value was 0.60 in 1964. The coupling relationship between runoff and sediment in the basin has always been at a high level. The change points of the coupling coordination degree of runoff and sediment load in the WRB were 1971 and 1996 (Figure 2b). The coupling relationship between runoff and sediment load changed significantly in 1971 and 1996. The two change points were consistent with the results that were calculated by Zhou et al., which were 1971 and 1997 in the WRB [17].
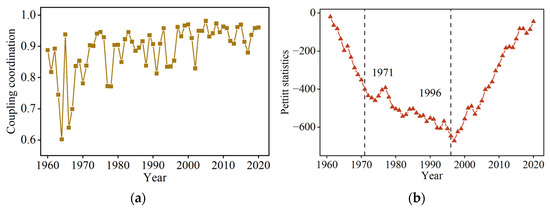
Figure 2.
Coupling changes in runoff and sediment load and its change points in the WRB from 1960 to 2020. (a) The coupling coordination degree of runoff and sediment; (b) the Pettitt test result of coupling coordination degree.
3.1.2. Change Point Verification Based on Copula Function
By using the copula function, the study constructed the optimal joint distribution cumulative probability between runoff and sediment and validated the change points of the relationship between runoff and sediment (Figure 3). Due to the fact that all annual runoff and sediment loads have passed the K-S test, the four common theoretical distribution functions can be used to describe annual runoff and sediment load. On this basis, the linear moment method was used to estimate the parameters of four theoretical distribution functions, and the R2 between the empirical cumulative probabilities of annual runoff and annual sediment load and the cumulative probabilities of the four theoretical distribution functions was calculated separately. According to the principle of R2 maximum, the optimal distribution functions for annual runoff and annual sediment load in the WRB from 1960 to 2020 were all GEV-type distribution (Figure 3a,b).
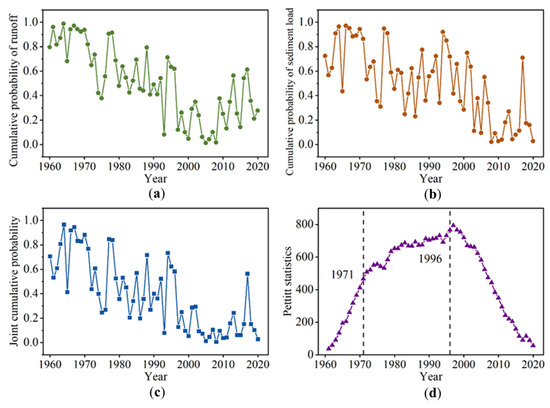
Figure 3.
Cumulative probability of optimal copula joint distribution of runoff and sediment in the WRB from 1960 to 2020. (a) The cumulative probability of runoff; (b) the cumulative probability of sediment load; (c) the joint cumulative probability of runoff and sediment; (d) the Pettitt test result of joint cumulative probability.
Based on the AIC criterion, Gumbel Copula was selected as the optimal copula from three Archimedean copulas. Then, it was used to connect the optimal marginal distribution function of runoff and sediment and to calculate the cumulative probability of the joint distribution function of it in the WRB (Figure 3c). Furthermore, the Pettitt test was used once more to identify the cumulative probability of the joint distribution function of runoff and sediment. The results are shown in Figure 3d. The cumulative probability of the joint distribution function of runoff and sediment in the WRB also showed significant change in 1971 and 1996. Therefore, the change diagnosis method for runoff and sediment relationship based on the coupling coordination degree can accurately identify the change point.
3.2. Characteristics of Runoff and Sediment before and after Change Points
In Figure 4, runoff of the WRB increased in P1 and P3 and decreased in P2, while sediment load only increased in P1 (1960–1970) and decreased in P2 (1971–1995) and P3 (1996–2020). However, in fact, runoff and sediment load in the basin showed a downwards trend wholly from 1960 to 2020. Precipitation in the three periods was 209.3 mm, 353.5 mm and 425.6 mm, respectively. And precipitation in the WRB has increased significantly (p < 0.01) over the past 60 years. The statistical results indicate that average annual runoff of the WRB gradually decreased in the three periods, with values of 15.34 × 10⁸ m3, 10.72 × 10⁸ m3 and 8.32 × 10⁸ m3, respectively. Average annual sediment load also gradually decreased in the three periods, with values of 1.84 × 10⁸ t, 0.82 × 10⁸ t and 0.32 × 10⁸ t, respectively. Sediment load in three periods decreased more significantly than runoff.
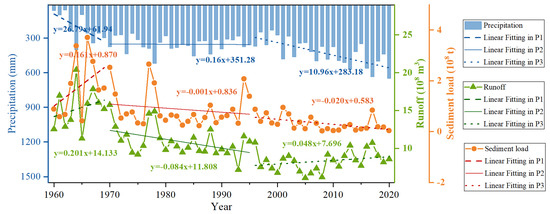
Figure 4.
Changes in precipitation, runoff and sediment load in the WRB for three periods.
Average annual runoff in P2 and P3 decreased by 30.1% and 47.8%, respectively, compared to P1. Meanwhile, average annual sediment load in P2 and P3 decreased by 55.4% and 82.6%, respectively, compared to P1. Moreover, the CV of runoff was 0.17 in P1 and 0.16 in P2 and P3. However, the CV of sediment load was 0.62 in P1, 0.76 in P2 and 0.89 in P3. The fluctuation of sediment load was more intense than runoff. It reflected that compared with runoff, sediment was more vulnerable to the impacting factors.
3.3. Joint Recurrence Characteristics of Runoff and Sediment
Analyzing the joint return period and joint design values of runoff and sediment can help indicate runoff and sediment change characteristics in the WRB and provide new management ideas for ecological construction in this basin. In Figure 5, it can be seen that under the same return period, the maximum possible joint design values of runoff and sediment load in the WRB were gradually decreased from P1 to P3. And with the return period increased, the maximum possible joint design value of runoff and sediment increased. However, under the return period of 200 years, the maximum possible joint design value of sediment in P2 was slightly smaller than that in P3. With soil and water conservation on the Loess Plateau promoted, the maximum possible joint design value of runoff and sediment in the WRB gradually decreased. However, there might appear a sharp increase in sediment due to extreme rainfall in some years.
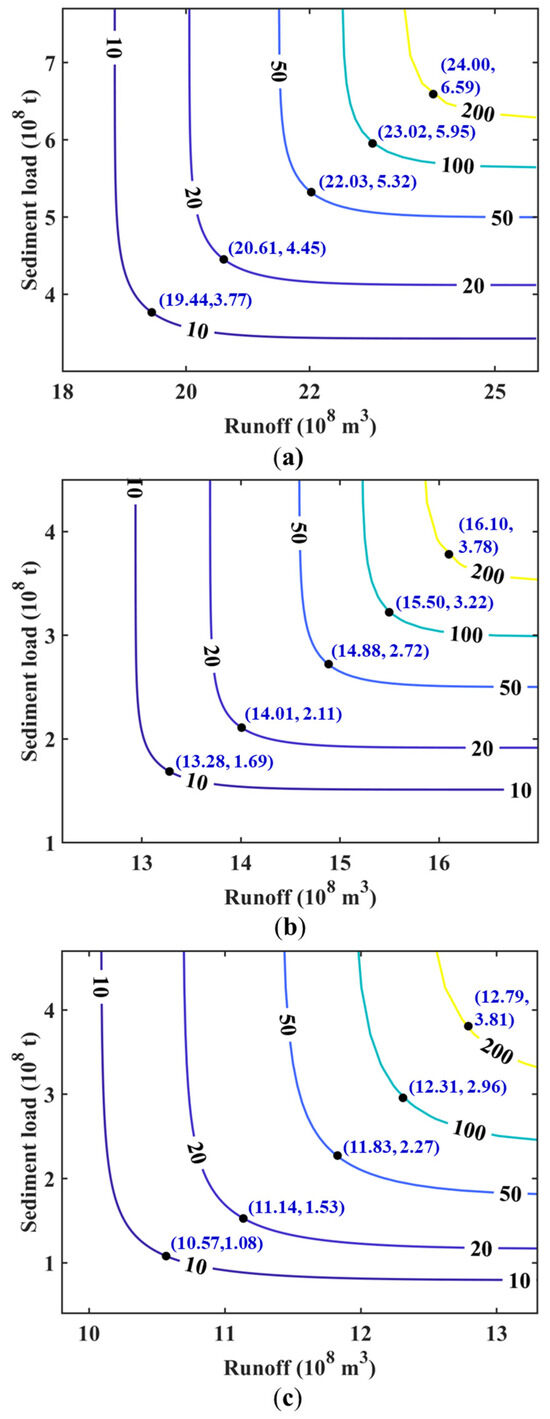
Figure 5.
Joint return period of runoff and sediment and its maximum possible combined design value in the WRB for three periods. (a–c) is the maximum possible combined design value under different joint return periods in P1, P2 and P3, respectively.
In Table 2, the change rates of maximum possible joint design value of runoff in P2 and P3 were smaller than sediment load at five return periods. Compared with P1, the maximum possible joint design value of runoff decreased by about 32% in P2, while the maximum possible joint design value of sediment decreased by 42% to 56%; the maximum possible joint design value of runoff in the WRB in P3 decreased by about 46%, while the maximum possible joint design value of sediment decreased by 42% to 72%. Compared with P2, the maximum possible joint design value of runoff in P3 maintained the decrease rate at 20%, while the decrease rate of maximum possible joint design value of sediment displayed large differences that changed by −36% to 0%.
Table 2.
Changing rates of maximum possible joint design value of runoff and sediment under different return periods in the WRB.
Since the 1960s, human activities, such as the construction of check dams, returning farmland to forest and irrigation, have led to a significant decrease in runoff and sediment in the WRB. Among them, returning farmland to forests and irrigation played a dominant role in runoff changes, while the construction of check dams played a dominant role in sediment load changes [36]. Moreover, the lifespan of small- and medium-sized check dams, which were built in the 1970s and 1980s, are mostly less than 20 years. Most of them were silted up or even failed after the middle of the 1990s. This is also the main reason for the significant change rates in the maximum possible joint design value of sediment in P2 and P3.
4. Discussion
4.1. Impacts of Runoff Erosion Energy on Sediment
As the underlying surface continually changes, runoff and its erosion energy in the WRB also changes accordingly [37]. Therefore, analyzing the relationship between runoff erosion energy and sediment can effectively demonstrate the regulating effects of underlying surface on improving soil erosion. As such, REP was selected as the erosion dynamics index to reveal the impact of underlying surface on sediment load in the basin from the perspective of runoff erosion energy. In Figure 6, sediment load in the WRB increased linearly with the increase in REP for three periods. The linear fitting relationship between sediment and REP in P2 was the best, with R2 of 0.88 (Figure 6b). The linear fitting relationship between sediment and REP in P3 was the worst, with R2 of only 0.35 (Figure 6c). The slope of the linear fitting function between REP and sediment was P1 > P2 > P3, indicating that the erosion capacity of unit runoff was gradually decreasing. The continuous promotion of soil- and water-conservation measures in the basin over the past 60 years has profoundly changed the erosion features of runoff erosion energy, ultimately acting out a decrease in sediment.
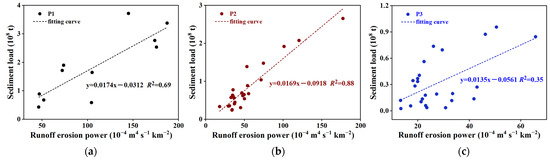
Figure 6.
Relationships between REP and sediment load in the WRB under three periods. (a) The relationship in P1; (b) the relationship in P2; (c) the relationship in P3.
On the basis of previous results and experiments, Moore and Burch indicated that sediment load increased with unit runoff erosion power linearly, especially for sediment particles with sizes of 0.2 mm and 0.3 mm [38]. By using an indoor scouring experiment, Li et al. proposed that the greater the runoff erosion energy consumed, the more sediment particles were detached and transported; the relationship between them was logarithmic function [21]. Based on pervious experiences and experiments, and by setting up five discharge intensities and ten slope gradients, Li et al. considered that runoff erosion power and sediment load existed in a linear relationship, and the higher the discharge intensity, the faster the speed that sediment load increased with runoff erosion power [23].
The study conducted cross-wavelet analysis on the relationship between REP and sediment load in order to support the periodic changes in sediment load and REP. Figure 7a showed the cross-wavelet energy spectrum of annual REP and annual sediment load in the WRB. There was a resonance period between annual REP and annual sediment load, which was about 0–4 years from 1962 to 1980. However, the change in annual REP lagged behind the change in annual sediment load from 1962 to 1970, while it stayed ahead in the opposite position from 1970 to 1980. Based on the wavelet coherence spectrum (Figure 7b), approximately 85% of the area was highly correlated between annual REP and annual sediment load in the entire time–frequency domain of the low-energy region. It indicated that REP was a representative factor affecting sediment load.
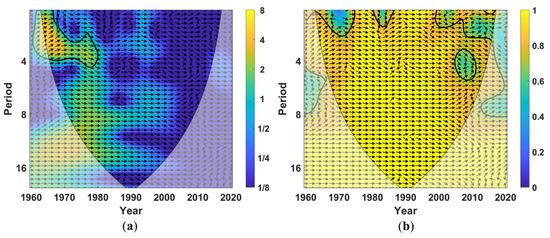
Figure 7.
Cross-wavelet transform of annual sediment and annual REP in the WRB. (a) The cross-wavelet energy spectrum; (b) the wavelet coherence spectrum. Note: The black thin line vertebral body represents the effective spectral value area, and the black thick line within the area represents a confidence interval of significance level of 0.05. Arrows reflect phase difference: arrows pointing 0~90 degrees and 270~360 degrees indicate that the change phase of annual REP and annual sediment load is consistent; arrows pointing 90~270 degrees indicate that the change phase of annual REP and annual sediment load is opposite; arrows pointing 0~180 degrees indicate that annual REP change leads annual sediment transport change; and arrows pointing 180~360 degrees indicate that annual REP change lags behind annual sediment load change.
4.2. Impacts of Underlying Surface Change on Runoff and Sediment
4.2.1. Check Dam and Terrace Construction
Compared with other conservation measures, check dam has more obvious advantages in blocking sand, silting up the land and increasing grain yield, and it is widely promoted in the Loess Plateau. Since the 1960s, the WRB has gradually implemented soil- and water-conservation measures, including terrace and check dam. In Figure 8a, there are tremendous changes in cumulative number and cumulative siltation capacity (CSC) of large check dams in the WRB over the past 60 years. Up to 2008, there were 1184 large check dams in the WRB, with the CSC of 13.97 × 10⁸ m3. It also can be seen that 1967–1975 was the first rapid construction period of check dams in the WRB, and the second peak appeared after 2000. Terrace was also widely constructed in the WRB and showed a continuous increase in cumulative area over the past 60 years, with a particularly fast growth rate from 1960 to 2000 (Figure 8b). After 2000, the construction speed of terrace in the WRB gradually slowed down. And until 2015, the cumulative area reached 1224.29 km2. The terrace area (TA) in the watershed during 2001 to 2015 increased by 5.62 km2 annually, which is much lower than that during 1960 to 2000 (increased by 27.78 km2 annually).
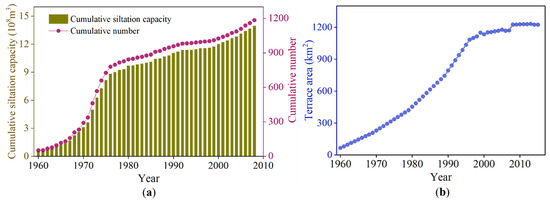
Figure 8.
Change trend in large check dam and terrace in the WRB. (a) The variation curve of CSC and cumulative number of check dam; (b) the variation curve of TA.
Combined with Figure 4, large dam constructed in the 1970s significantly reduced runoff and sediment in the WRB during that period and became the main reason for change point of coupling coordination between runoff and sediment in 1971. In addition, with most of check dams constructed in the 1970s and 1980s gradually filled up, their retention effects decreased, which also led to the increase in runoff and sediment in the mid to late 1990s [39]. In the WRB, Xu et al. thought that with effective area of check dams reached its highest value in the 1980s and decreased after the 1990s, which led to the rebound of sediment load [40]. Unfortunately, the changes in TA did not coincide with runoff and sediment in the study period. It seems that the influence of check dam on changes in runoff and sediment in the WRB was more significant than that of terrace. On the time scale of single rainfall, the contribution of check dams to sediment reduction was higher than terraces. Taking the “7•26” rainstorm in 2017 as an example, sediment load reduced by conservation measures in the Chabagou watershed reached 79%, of which check dams contributed 58% and higher than terraces [41].
4.2.2. Vegetation Restoration
Affected by human activities and climate change, as well as the structure, process and pattern of land use, the Loess Plateau region has undergone significant changes, which has led to changes in surface ecological and hydrological processes [42]. From Figure 9, it can be seen that the overall change in land use in the WRB over the past 30 years was a decrease in the area of cropland and barren land and an increase in the area of shrubland, grassland, water body and construction land. The area of cropland and barren land decreased from 668.22 km2 and 317.75 km2 in 1985 to 510.31 km2 and 95.33 km2 in 2019, respectively. The corresponding decrease proportion was 5.6% and 9.8%. The area of shrubland, grassland, water area and construction land increased from 0.27 km2, 1780.26 km2, 6.03 km2 and 6.30 km2 in 1985 to 3.37 km2, 2197.68 km2, 7.51 km2 and 18.65 km2 in 2019, respectively. The corresponding increase proportion was 0.1%, 14.7%, 0.1% and 0.4%.
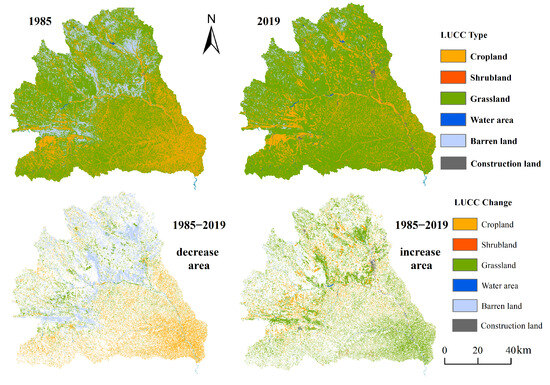
Figure 9.
Land-use changes in the WRB.
The decrease in the cropland and barren land’s area, as well as the increase in shrubland and grassland’s area, induced a significant improvement in the vegetation conditions in the basin. By interpreting remote sensing images, the increased shrubland and grassland in the WRB mostly transformed from rehabilitated land or abandoned land [43,44]. Since the implementation of the “Returning Farmland to Forests and Grassland” project in 1999, vegetation restoration in the WRB has made remarkable achievements. After 2000, NDVI has increased at an average annual rate of 0.01 to 0.48 in 2020 (Figure 10).
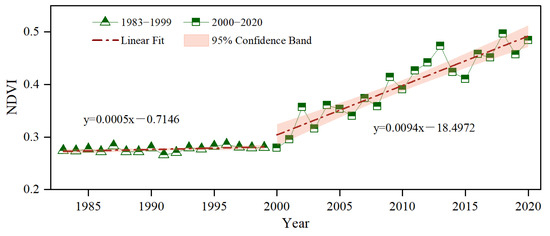
Figure 10.
NDVI changes in the WRB from 1983 to 2020.
Because vegetation can intercept more runoff than barren land and construction land [45], the increase in shrubland and grassland could be the cause of runoff reduction. Most of all, the infiltration capacity of shrubland and grassland is stronger than other land use [46]. Therefore, it is likely that vegetation restoration in the WRB caused the decrease in runoff and sediment. The effects of land type change on runoff and sediment load has been investigated in several catchments. In the Cau River catchment, Phan et al. identified that if 11.07% of vegetation land converted to cropland, runoff and sediment load could increase by 3.93% and 8.94%, respectively [47]. In the Be River catchment, Khoi et al. reported that approximately 14.07% of shrubland converted to cropland during 1990 to 2001; thus, runoff and sediment load increased by 1.2% and 11.3%, respectively [48].
4.3. Relationships between Runoff, Sediment and Impacting Factors
The correlation analysis of Pr (precipitation), REP, CSC, TA, and NDVI with runoff and sediment load is shown in Table 3. The negative correlation relationships between Pr and runoff and sediment load were all poor in PE. It seems that precipitation did not promote runoff and sediment load throughout the entire study period on the surface. Actually, it was because the contributions of conservation measures to runoff and sediment reduction were too high (even over 100%), which hid the contribution of Pr. Similar results actually existed in the Zhifanggou watershed [49] and the Qingshui River Basin [50]. In addition, since precipitation, runoff and sediment load all increased in P1 (Figure 4), Pr and runoff, sediment load had a significant positive correlation relationships (p < 0.01).
Table 3.
Relationships between runoff and sediment and impacting factors in the WRB.
The correlation coefficients between REP and runoff were all above 0.82 at four periods, which showed a highly significant correlation. The correlation relationship between REP and sediment load also reached a significant level (p < 0.01). CSC and TA all showed highly significant negative correlation with runoff and sediment load in PE, but CSC correlated with runoff (p < 0.05) and TA correlated with sediment load in P3 (p < 0.001). NDVI had a significant negative correlation with sediment load in PE and P3 (p < 0.05), but showed a complex relationship with runoff. The correlation between NDVI and runoff was not significant in PE but significant in P3 (p < 0.05). Among three conservation measures, engineering measures represented by check dam showed the most significant sediment reduction function [41]. Moreover, when vegetation condition reached a good level, vegetation could significantly reduce sediment while increasing runoff to a certain degree [51,52]. The inner cause was vegetation, which led to a regional precipitation increase and ultimately produced more runoff [53,54].
The elastic coefficients’ absolute value of REP, CSC, TA and NDVI to sediment was all higher than to runoff in Table 4. When REP increased by 1 m4 s−1 km−2, runoff and sediment increased by 0.32 × 10⁸ m3 and 1.18 × 10⁸ t, respectively. When CSC increased by 1 × 10⁸ m3, runoff and sediment decreased by 0.47 × 10⁸ m3 and 0.98 × 10⁸ t, respectively. When TA increased by 1 km2, runoff and sediment decreased by 0.39×10⁸ m3 and 0.92 × 10⁸ t, respectively. When NDVI increased by 1, runoff and sediment decreased by 0.12 × 10⁸ m3 and 1.98 × 10⁸ t, respectively. As the same type of measure, the sediment retaining ability of check dam was better than terrace [55,56]. For runoff reduction, the contribution rate of CSC was the highest (95.4%), followed by REP (72.6%), TA (71.1%) and NDVI (25.4%). For sediment reduction, the contribution rate of REP was the highest (93.8%), followed by CSC (85.1%), NDVI (75.8%) and TA (63.0%). The contribution rate of CSC and TA to runoff change was higher than sediment. This was because check dam and terrace reduced sediment mainly by intercepting runoff [57]. The contribution rate of NDVI to sediment reduction was significantly higher than runoff. This is related to the property of vegetation with stronger sediment and weaker runoff controlling [58].
Table 4.
Elastic coefficients and contribution rates of impacting factors to runoff and sediment.
The contribution of underlying surface to runoff and sediment load in the MYRB has been calculated by several researchers. By comparing runoff and sediment change of two basins from 1956 to 2010, Sun et al. reported that contributions of underlying surface to runoff and sediment reduction in the Jialu River Basin were 97.3% and 95.8%, respectively, and in the Kuye River Basin, they were 86.1% and 80.5%, respectively [59]. Similar results were also obtained in the Lan River Basin. Ma et al. calculated that with underlying surface improved, the contribution of conservation measures to runoff and sediment reduction during 1999 to 2018 even reached 117.9% and 103.5%, respectively, which can be compared with the reference period (1955–1982) [60]. It could be said that changes in underlying surface caused by conservation measures are the main factor affecting runoff and sediment reduction in the WRB. However, with underlying surface improved, the hydrological connectivity of the WRB decreased continuously, leading to more runoff being intercepted and infiltrated [61]. Less runoff meant less sediment transportation, so the ultimate result was decreased sediment load in the WRB. Meanwhile, since REP was calculated based on runoff, the relationship between them was definitely very close, and so was the relationship between REP and sediment load (Table 3). But once runoff with low sediment concentration is generated, REP in the basin increases rapidly, inducing a large amount of sediment [62]. This may explain why the contribution of REP to sediment load was the highest compared with underlying surface.
5. Conclusions
Based on runoff and sediment data from 1960 to 2020, and supplemented with underlying surface information, this study evaluated the coupling relationship between runoff and sediment in the WRB and revealed the impacts of erosion energy and underlying surface. Finally, the study reached the following conclusions:
- (1)
- By constructing a diagnostic method based on coupling coordination degree for change point in runoff and sediment relationship, it was identified that there are two change points in the runoff and sediment coupling relationship in the WRB, which were 1971 and 1996. The copula joint distribution of runoff and sediment verified that there were indeed two change points. The diagnosis method for the runoff and sediment coupling relationship can be used to identify the change point. Runoff and sediment decreased gradually in three periods.
- (2)
- Under the same return period, the value of maximum possible joint design value of runoff and sediment in P1 were all the highest, followed by P2 and P3. The change trend in the return period was similar to the maximum possible joint design value. The change rates of the maximum possible joint design value of runoff in P2 and P3 were smaller than sediment under five return periods. With the underlying surface improved, the change rates of maximum possible joint design value decreased.
- (3)
- Although sediment increased with the increase in REP in three periods, the erosion capacity of unit runoff was gradually decreased. The resonance period between annual REP and annual sediment load was about 0–4 years from 1962 to 1980. Approximately 85% of the area was highly correlated between REP and sediment load. REP could significantly increase runoff and sediment in PE, P1, P2 and P3. The contribution rates of REP to runoff and sediment were 72.6% and 93.8%, respectively. Check dam and terrace could significantly decrease runoff and sediment in PE; the contribution rates of them to runoff reduction were 95.4% and 71.1%, respectively, and their contribution rates to sediment reduction were 85.1% and 63.0%, respectively. NDVI could decrease sediment in PE and increase runoff in P3.
Author Contributions
Conceptualization: Q.Y. and H.G.; methodology and software: K.L. and Y.H.; formal analysis: H.G.; resources and data curation: Y.H.; writing—original draft preparation and writing—review and editing: Q.Y.; visualization: Y.H. and Q.Y.; supervision: Z.L.; funding acquisition: H.G. All authors have read and agreed to the published version of the manuscript.
Funding
This research was funded by the National Key Research and Development Program of China (No. 2022YFF1300803).
Data Availability Statement
Original data is available from the Yellow River Basin Hydrological Yearbook.
Acknowledgments
We express our thanks to Yellow River Institute of Hydraulic Research (YRIHR) for providing data, as well as the anonymous reviewers and editors for providing constructive suggestions that improved the manuscript greatly.
Conflicts of Interest
The authors declare no conflicts of interest.
References
- Douglas, I. Man, vegetation and the sediment yields of rivers. Nature 1967, 215, 925–928. [Google Scholar] [CrossRef]
- Best, J. Anthropogenic stresses on the world’s big rivers. Nat. Geosci. 2018, 12, 7–21. [Google Scholar] [CrossRef]
- Miao, C.Y.; Gou, J.J.; Fu, B.J.; Tang, Q.H.; Duan, Q.Y.; Chen, Z.S.; Lei, H.M.; Chen, J.; Guo, J.L.; Borthwick Alistair, G.L.; et al. High-quality reconstruction of China’s natural streamflow. Sci. Bull. 2022, 67, 547–556. [Google Scholar] [CrossRef] [PubMed]
- Jansen, I.M.L.; Painter, R.B. Predicting sediment yield from climate and topography. J. Hydrol. 1974, 21, 371–380. [Google Scholar] [CrossRef]
- Khoi, D.N.; Suetsugi, T. The responses of hydrological processes and sediment yield to land-use and climate change in the Be River Catchment, Vietnam. Hydrol. Process. 2014, 28, 640–652. [Google Scholar] [CrossRef]
- Yan, Q.H.; Lei, T.W.; Yuan, C.P.; Lei, Q.X.; Yang, X.Y.; Zhang, M.L.; Su, G.X.; An, L.P. Effects of watershed management practices on the relationships among rainfall, runoff, and sediment delivery in the hilly-gully region of the Loess Plateau in China. Geomorphology 2015, 228, 735–745. [Google Scholar] [CrossRef]
- Taye, T.; Moges, A. Implication of long-term watershed development on land use/land cover change and sediment loss in Maybar Sub-Watershed, South Wello Zone, Ethiopia. Cogent Food Agric. 2020, 7, 1863596. [Google Scholar] [CrossRef]
- Gao, P.; Mu, X.M.; Wang, F.; Li, R. Changes in streamflow and sediment discharge and the response to human activities in the middle reaches of the Yellow River. Hydrol. Earth Syst. Sci. 2011, 15, 1–10. [Google Scholar] [CrossRef]
- Zhao, Y.; Hu, C.H.; Zhang, X.M.; Lv, X.Z.; Yin, X.L.; Wang, Z.Y. Response of sediment discharge to soil erosion control in the middle reaches of the Yellow River. Catena 2021, 203, 105330. [Google Scholar] [CrossRef]
- Tang, K.L. Soil and Water Conservation in China; Science Press: Beijing, China, 2004. [Google Scholar]
- Jin, Z.; Cui, B.L.; Song, Y.; Shi, W.Y.; Wang, K.B.; Wang, Y.; Liang, J. How many check dams do we need to build on the Loess Plateau? Environ. Sci. Technol. 2012, 46, 8527–8528. [Google Scholar] [CrossRef]
- Wei, W.; Chen, D.; Wang, L.X.; Daryanto, S.; Chen, L.D.; Yu, Y.; Lu, Y.L.; Sun, G.; Feng, T.J. Global synthesis of the classifications, distributions, benefits and issues of terracing. Earth Sci. Rev. 2016, 159, 388–403. [Google Scholar] [CrossRef]
- Mohammad, A.G.; Adam, M.A. The impact of vegetative cover type on runoff and soil erosion under different land uses. Catena 2010, 81, 97–103. [Google Scholar] [CrossRef]
- Li, M.; Zhang, C.Y.; Wang, H.Y.; Wang, S. Influence of ecological technology measures on the annual sediment load of the Wuding River. J. Resour. Ecol. 2017, 8, 385–391. [Google Scholar]
- Wang, W.Z.; Jiao, J.Y. Temporal and spatial variation characteristics of erosion and sediment yield in the Loess Plateau. Acta Geogr. Sin. 2002, 57, 210–217. [Google Scholar]
- Cai, Q.G. Soil erosion and management on the Loess Plateau. J. Geogr. Sci. 2001, 11, 53–70. [Google Scholar]
- Zhou, Y.Y.; Shi, C.X.; Du, J.; Fan, X.L. Characteristics and causes of changes in annual runoff of the Wuding River in 1956–2009. Environ. Earth Sci. 2013, 69, 225–234. [Google Scholar] [CrossRef]
- Jin, Z.; Li, J.Y. Analysis of driving factors for runoff and sediment variations during 1961 to 2012 in Wuding River Basin. Acta Agric. Jiangxi 2016, 28, 79–84. [Google Scholar]
- Shi, P.; Zhang, Y.; Ren, Z.P.; Li, P.; Gong, J.F. Land-use changes and check dams reducing runoff and sediment yield on the Loess Plateau of China. Sci. Total Environ. 2019, 664, 984–994. [Google Scholar] [CrossRef]
- Xu, J.; Wang, H. Influence of soil and water conservation measures on reducing in frequency of hyperconcentrated flows in the Wudinghe River basin. Environ. Earth Sci. 2011, 62, 1513–1520. [Google Scholar] [CrossRef][Green Version]
- Li, Z.B.; Lu, K.X.; Ding, W.F. Study on the dynamic process of rill erosion of loess slope surface. Int. J. Sediment Res. 2001, 2, 308–314. [Google Scholar]
- Ellion, W.D. Soil erosion studies, part I. Agric. Eng. 1947, 28, 145–146. [Google Scholar]
- Li, P.; Zhang, L.H.; Li, Z.B.; Zheng, L.Y. Dynamic Mechanics of Soil Erosion by Runoff on Loess Slope. Nat. Environ. Pollut. Technol. 2013, 12, 297–301. [Google Scholar]
- Zhang, X.; Liu, L.Y.; Chen, X.D.; Gao, Y.; Xie, S.; Mi, J. GLC_FCS30: Global land-cover product with fine classification system at 30 m using time-series Landsat imagery. Earth Syst. Sci. Data 2021, 13, 2753–2776. [Google Scholar] [CrossRef]
- Jia, S.F.; Zhu, W.; Lv, A.F.; Yan, T. A statistical downscaling algorithm of TRMM precipitation based on NDVI and DEM in the Qaidam Basin of China. Remote Sens. Environ. 2011, 115, 3069–3079. [Google Scholar] [CrossRef]
- Carriaga, C.C.; Mays, L.W. Optimal control approach for sedimentation control in alluvial rivers. J. Water Res. Plan. Manag. 1995, 121, 408–417. [Google Scholar] [CrossRef]
- Pettitt, A.N. A non-parametric approach to the change-point problem. Appl. Stat. 1979, 28, 126–135. [Google Scholar] [CrossRef]
- Yu, K.X.; Xiong, L.H.; Gottschalk, L. Derivation of low flow distribution functions using copulas. J. Hydrol. 2014, 508, 273–288. [Google Scholar] [CrossRef]
- Bozdogan, H. Model selection and Akaike’s information criteri on (AIC): The general theory and its analytical extension. Psychometrika 1987, 52, 345–570. [Google Scholar] [CrossRef]
- Salvadori, G.; De Michele, C.D. Frequency analysis via copulas: Theoretical aspects and applications to hydrological events. Water Resour. Res. 2004, 40, W12511. [Google Scholar] [CrossRef]
- Salvadori, G.; De Michele, C.; Durante, F. On the return period and design in a multivariate framework. Hydrol. Earth Syst. Sci. 2011, 15, 3293–3305. [Google Scholar] [CrossRef]
- Labat, D. Cross wavelet analysis of annual continental freshwater discharge and selected climate indices. J. Hydrol. 2020, 385, 269–278. [Google Scholar] [CrossRef]
- Cheng, S.D. The Effects of Vegetation Pattern on Erosion and Sediment Yield of Slope-Gully System-Watershed. Ph.D. Thesis, Xi’an University of Technology, Xi’an, China, 2016. [Google Scholar]
- Sankarasubramanian, A.; Limbrunner, J.F.; Vogel, R.M. Climate elasticity of streamflow in the United States. Water Resour. Res. 2001, 37, 1771–1781. [Google Scholar] [CrossRef]
- Zhang, J.J.; Gao, G.Y.; Fu, B.J.; Gupta, H.V. Formulating an elasticity approach to quantify the effects of climate variability and ecological restoration on sediment discharge change in the Loess Plateau, China. Water Resour. Res. 2019, 55, 9604–9622. [Google Scholar] [CrossRef]
- Bai, L.C.; Wang, N.; Jiao, J.Y.; Chen, Y.X.; Tang, B.Z.; Wang, H.L.; Chen, Y.L.; Yan, X.Q.; Wang, Z.J. Soil erosion and sediment interception by check dams in a watershed for an extreme rainstorm on the Loess Plateau, China. Int. J. Sediment Res. 2020, 35, 408–416. [Google Scholar] [CrossRef]
- Han, Y.; Yang, Q.N.; Gao, H.D.; Xu, H. Runoff and sediment characteristics of flood event in typical watershed on the Loess Plateau based on vegetation restoration. J. Soil Water Conserv. 2023, 37, 278–283. [Google Scholar]
- Moore, I.D.; Burch, G.J. Sediment transport capacity of shear and rill flow: Application of unit stream power theory. Water Resour. Res. 1986, 22, 1350–1360. [Google Scholar] [CrossRef]
- Liu, X.Y.; Yang, S.T.; Li, X.Y.; Zhou, X.; Luo, Y.; Dang, S.Z. The current vegetation restoration effect and its influence mechanism on the sediment and runoff yield in severe erosion area of Yellow River Basin. Sci. Sin. (Technol.) 2015, 45, 1052–1059. [Google Scholar]
- Xu, J.X.; Sun, J. Study of temporal variation of check dam construction in Wuding River Basin and some suggestion for some countermeasure. J. Soil Water Conserv. 2006, 2, 26–30. [Google Scholar]
- Xiao, P.Q.; Wang, L.L.; Yang, Z.S.; Jiao, P.; Wang, Z.H. Study on sediment benefits of soil and water conservation measures in typical watershed in the Loess Plateau under the heavy rainfall. J. Hydraul. Eng. 2020, 51, 1149–1156. [Google Scholar]
- Fu, B.J.; Wang, S.; Liu, Y.; Liu, J.B.; Liang, W.; Miao, C.Y. Hydrogeomorphic ecosystem responses to natural and anthropogenic changes in the Loess Plateau of China. Annu. Rev. Earth Planet. Sci. 2017, 45, 223–243. [Google Scholar] [CrossRef]
- Zhang, X.P.; Zhang, L.; Zhao, J.; Rustomji, P.; Hairsine, P. Responses of streamflow to changes in climate and land use /cover in the Loess Plateau, China. Water Resour. Res. 2008, 44, W00A07. [Google Scholar] [CrossRef]
- Feng, X.M.; Wang, Y.F.; Chen, L.D.; Fu, B.J.; Bai, G.S. Modeling soil erosion and its response to land-use change in hilly catchments of the Chinese Loess Plateau. Geomorphology 2010, 118, 239–248. [Google Scholar] [CrossRef]
- Ma, X.; Xu, J.C.; Luo, Y.; Aggarwal, S.P.; Li, J.T. Response of hydrological processes to landcover and climate changes in Kejie watershed, South-West China. Hydrol. Process. 2009, 23, 1179–1191. [Google Scholar] [CrossRef]
- Bai, P.; Liu, X.M.; Zhang, Y.Q.; Liu, C.M. Assessing the impacts of vegetation greenness change on evapotranspiration and water yield in China. Water Resour. Res. 2020, 56, e2019WR027019. [Google Scholar] [CrossRef]
- Phan, D.B.; Wu, C.C.; Hsieh, S.C. Impact of climate change on stream discharge and sediment yield in northern Vietnam. Water Resour. 2011, 38, 827–836. [Google Scholar] [CrossRef]
- Khoi, D.N.; Suetsugi, T. Impact of climate and land-use changes on hydrological processes and sediment yield-a case study of the Be River catchment, Vietnam. Hydrol. Sci. J. 2014, 59, 1095–1108. [Google Scholar] [CrossRef]
- Yu, R.H.; Wang, G.L.; Yang, Y.F. Attribution analysis of water and sediment changes based on Budyko Hypothesis-Taking the samall watershed of Zhifanggou in Ansai as an example. Res. Soil Water Conserv. 2023, 30, 86–92. [Google Scholar]
- Huang, K.; Lu, K.X.; Shen, Z.Z.; Zhang, G.J.; Ren, Z.P.; Li, P. Attribution analysis of runoff and sediment changes at different scales in the Qingshui River Basin. J. Irrig. Drain. 2023, 42, 93–98. [Google Scholar]
- Zhang, B.Q.; Tian, L.; Yang, Y.T.; He, X.G. Revegetation does not decrease water yield in the loess plateau of China. Geophys. Res. Lett. 2022, 49, e2022GL098025. [Google Scholar] [CrossRef]
- Wang, H.; Sun, F.B.; Xia, J.; Liu, W.B. Impact of LUCC on streamflow based on the SWAT model over the Wei River basin on the Loess Plateau in China. Hydrol. Earth Syst. Sci. 2017, 21, 1929–1945. [Google Scholar] [CrossRef]
- Liu, Y.; Ge, J.; Guo, W.D.; Cao, Y.P.; Chen, C.R.; Luo, X.; Yang, L.M.; Wang, S.Y. Revisiting biophysical impacts of greening on precipitation over the loess plateau of China using WRF with water vapor tracers. Geophys. Res. Lett. 2023, 50, e2023GL102809. [Google Scholar] [CrossRef]
- Lü, M.X.; Ma, Z.G.; Lü, M.Z. Effects of climate/land surface changes on streamflow with consideration of precipitation intensity and catchment characteristics in the Yellow River Basin. J. Geophys. Res. Atmos. 2018, 123, 1942–1958. [Google Scholar]
- Yuan, S.L.; Li, Z.B.; Chen, L.; Li, P.; Zhang, Z.Y. Influence of check dams on flood hydrology across varying stages of their lifespan in a highly erodible catchment, Loess Plateau of China. Catena 2022, 210, 105864. [Google Scholar] [CrossRef]
- Ran, Q.H.; Tang, H.L.; Wang, F.; Gao, J.H. Numerical modelling shows an old check-dam still attenuates flooding and sediment transport. Earth Surf. Proc. Land. 2021, 46, 1549–1567. [Google Scholar] [CrossRef]
- Wang, Z.Y.; Chen, Z.Y.; Yu, S.; Zhang, Q.; Wang, Y.; Hao, J.W. Erosion-control mechanism of sediment check dams on the Loess Plateau. Int. J. Sediment Res. 2021, 36, 668–677. [Google Scholar] [CrossRef]
- Braud, I.; Vich, A.I.J.; Zuluaga, J.; Fornero, L.; Pedrani, A. Vegetation influence on runoff and sediment yield in the Andes region: Observation and modelling. J. Hydrol. 2001, 254, 124–144. [Google Scholar] [CrossRef]
- Sun, Q.; Yu, K.X.; Li, Z.B.; Li, P.; Zhang, X.M.; Gong, J.F. The trends of streamflow and sediment and their driving factors in the middle reaches of the Yellow River. Acta Geogr. Sinca 2018, 73, 945–956. [Google Scholar]
- Ma, Y.X.; Xia, L.; Fan, Y.; Gao, Y.Y. Effects of land use and climate change on runoff and sediment variation in typical watershed of the Loess Plateau. J. Soil Water Conserv. 2021, 35, 38–45. [Google Scholar]
- Appels, W.M.; Bogaart, P.W.; van der Zee, S.E.A.T.M. Surface runoff in flat terrain: How field topography and runoff generating processes control hydrological connectivity. J. Hydrol. 2016, 534, 493–504. [Google Scholar] [CrossRef]
- Zhang, G.H.; Liu, Y.M.; Han, Y.F.; Zhang, X.C. Sediment Transport and Soil Detachment on Steep Slopes: I. Transport Capacity Estimation. Soil Sci. Soc. Am. J. 2009, 73, 1291–1297. [Google Scholar] [CrossRef]


Disclaimer/Publisher’s Note: The statements, opinions and data contained in all publications are solely those of the individual author(s) and contributor(s) and not of MDPI and/or the editor(s). MDPI and/or the editor(s) disclaim responsibility for any injury to people or property resulting from any ideas, methods, instructions or products referred to in the content. |
© 2024 by the authors. Licensee MDPI, Basel, Switzerland. This article is an open access article distributed under the terms and conditions of the Creative Commons Attribution (CC BY) license (https://creativecommons.org/licenses/by/4.0/).