Abstract
The olive tree is a significant woody crop in the Mediterranean basin, with the primary olive-growing areas located in the south and southwest of the Iberian Peninsula. Climate plays a crucial role in crop distribution, viability, production, and yield. The climatic and topographical conditions of Extremadura in southwestern Spain, were analysed to characterise and group the olive-growing areas. To achieve this, a Geographic Information System (GIS) was developed to locate all registered olive tree plots. The orientations and elevations of these were analysed, along with the average, minimum, and maximum temperatures, precipitation, and frost for the period of 1990–2021. The study reveals that olive groves in Extremadura are primarily situated at elevations ranging from 200 to 600 m above sea level. Additionally, it was found that the least common orientation is towards the north. Temperatures are not a constraint for olive growing, except in the mountainous areas in the north of the region; however, rainfall can be a limiting factor. In fact, 50% of the olive-growing area receives less rainfall than is considered adequate for optimal production. Frost days and the low probability of severe frosts are not a problem for olive growing in this region, except in the highest parts of the region. The scale of this study, at plantation level, will enable the implementation of measures aimed at climate change adaptation and mitigation.
1. Introduction
The olive tree (Olea europea L.) is a significant perennial woody crop in Europe, particularly cultivated in the Mediterranean area. The European Union (EU) has seen an increase in the area under olive cultivation in the last decade [1], with approximately 5.0 million ha currently occupied [1]. Spain is the world leader in terms of surface area, with 55% of the EU land, and is also the leading producer of olive oil, with 2.75 million hectares dedicated to olive cultivation. Of this, 94% is allocated to oil production, while the remaining 6% is for table olive production. Spain accounts for 70% of EU production and approximately 45% of the world’s olive oil production [2,3,4].
Climate is a critical factor that influences the distribution and viability of cultivated plants, affecting their growth, development, and crop production [5,6], particularly in olive groves [7,8,9]. The Mediterranean basin provides an optimal climate for cultivating olives [10,11,12]. The climate is usually temperate, warm, and dry during the summer and humid during the winter [13]. The establishment of olive-growing areas is primarily limited by temperature, while plantation yields are most significantly limited by water availability.
The optimal temperature range for the vegetative growth of olive trees is generally between 10 °C and 30 °C. Additionally, the optimal temperature range for carbohydrate synthesis in leaves is between 20 °C and 30 °C [14]. On the other hand, temperatures consistently above 16 °C affect bud differentiation [14], reducing flowering. Olive trees also require a period of low temperatures (0–7 °C) for bud differentiation [15]. However, it is important to note that the minimum winter temperature should not drop below −7 °C as this can cause serious damage to the trees. In fact, if the temperature falls to −12 °C, it can even result in the death of the trees. Additionally, a minimum temperature of −4.7 °C can cause significant defoliation of one- to two-year-old shoots and branches. However, the tree can recover its vegetative activity [16] by sprouting adult branches. Similarly, the cumulative impact of severe frosts during a phenological cycle affects the crop susceptibility to frost damage.
The cultivation of olive trees is limited by the elevation of the terrain. Altitudes above 800 m a.s.l. are unsuitable due to the incidence of frost and the short vegetative period in these elevated areas [15]. Mousa et al. [17] demonstrated that the fatty acid composition and phenolic content of olives vary with the altitude of the olive trees. Altitude has an impact on the phenological rhythm of olive trees, causing a delay in the phases of the productive period as altitude increases. This can result in a difference of up to 20 days, particularly in the date of fruit fall [18]. Additionally, altitude influences the fresh weight of the fruit, with higher weights observed at lower altitudes [7].
Rainfall is a crucial factor affecting both commercial olive and oil yields, with a minimum of 500 mm/year required to obtain acceptable commercial yields [12]. Values of 600 mm/year, 800 mm/year, and 1000 mm/year are considered sufficient, moderate, and good, respectively [14].
The Mediterranean region is well suited to olive growing due to its ideal climatic conditions. However, numerous studies warn that this area is highly vulnerable to climate change, which may threaten its suitability in the future [13,19]. This area is classified as a Hot Spot [20], and climate change leads to a reduction in precipitation [21,22] and an increase in temperatures [23,24].
Changes in temperature and precipitation regimes can result in higher evapotranspiration demand and lower soil water availability [25]. These changes can also affect olive phenology, such as an earlier flowering date and changes in the growing season [9,26,27]. As a result, the chemical properties of the oil, including acidity, oxidative degree, and fatty acid composition, may be compromised [28], which can directly impact fruit yield and oil quality [29,30,31,32].
Extensive research has been conducted on the impact of climatic conditions on olive cultivation in the Mediterranean region, particularly in Spain [33], Italy [34], and Portugal [35], using various methods [10,11]. Regional studies have also been carried out in Andalusia in southern Spain [36,37] and Alentejo in southern Portugal [38]. All studies have demonstrated the direct impact of climate on the spatial distribution of olive-growing regions. Spatial zoning is a fundamental tool for analysing the suitability and viability of olive production.
Spain has a highly diverse climate, with significant year-to-year variation and a wide range of extreme daily values [39]. Mean annual temperatures vary across the peninsula, averaging over 18 °C, and mean annual precipitation ranges from 150 mm to over 2500 mm [39]. The Extremadura region in southwestern Spain is known for the significant economic and social impact of olive cultivation, with the third largest olive grove area and production in Spain [2]; olive growing is integral part of the region’s cultural and gastronomic heritage [40].
Geostatistical techniques are essential for analysing the spatial distribution and climatic characterisation of crops. This is because climatic data are typically obtained from point data (stations), and it is necessary to obtain multivariate models that represent the spatial variation of climate (continuum) in areas of actual and potential cultivation. Several recent studies have employed these techniques [41,42,43], as they enable zoning analysis. Georeferenced information allows for the integration of multiple databases onto a single map, facilitating cross-referencing to evaluate the agricultural potential of a specific geographic region. This optimises agricultural production and enables the implementation of appropriate methods to describe the environmental variability of the area, thereby enhancing the value of each production zone.
The aim of this study is to characterise spatio-temporal topographic and climatic variables in the olive-growing regions of Extremadura. The uniqueness of this work lies in the fact that the characterisation is carried out with orchard-level resolution. Therefore, it accurately represents the conditions of this crop in Extremadura, showing similarities and differences between areas. This information is crucial for future studies and informed decisions on the management and production of olive groves in the region of Extremadura.
2. Materials and Methods
2.1. Study Area
This study was conducted in Extremadura, a region located in the southwest of Spain, covering an area of 41,634 km2. The region is renowned for its diverse ecosystems and topography, with an average elevation of 425 m above sea level (a.s.l.), a maximum of 2091 m a.s.l., and a minimum of 116 m a.s.l. (Figure 1). It is situated between latitudes 37°57′ and 40°29′ N and longitudes 4°39′ and 7°33′ W. Extremadura is an ecologically important region [44,45], with extensive forest areas and large areas dedicated to agriculture. It is crossed by two large rivers, the Guadiana and Tajo, which form fertile plains. The region accounts for 25.7% of Spain’s total dammed capacity, with a capacity of 14,456 hm3 [46]. This water is partially used for irrigated crops.
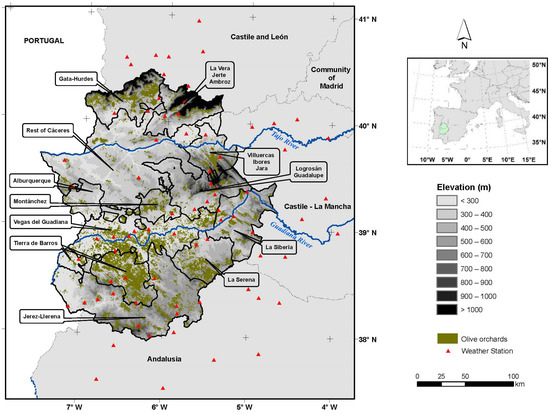
Figure 1.
Digital elevation model and olive-growing regions of Extremadura, showing olive groves and weather stations used in this study.
Extremadura has a Mediterranean climate with variable precipitation. The summers are hot and dry, while the winters can be rainy and mild or cold and dry. The mean annual temperature is 16.3 °C, with an annual precipitation of 668 mm as recorded from 1985 to 2017 [47]. Summer temperatures can reach 40 °C, and rainfall varies between years. The driest months are from June to September, and the rainiest are from October to May. Droughts occur every 8–9 years, lasting for approximately two years.
Extremadura is the third-largest autonomous community in Spain for olive oil production, with approximately 217,711 hectares of olive cultivation. It is also the second-largest producer of table olives [48]. The main farming system is extensive and dry farming. However, in recent years there has been a notable increase in the area dedicated to irrigation due to the rise of super-intensive plantations, which have also increased the average annual yield. Extremadura comprises two provinces, Cáceres and Badajoz, each with six olive-growing regions (Table 1). These regions are defined as homogeneous production areas in accordance with European Community (EC) Regulation No. 2138/97 [49]. The province of Badajoz accounts for 81.2% of the olive grove area in Extremadura. Additionally, Extremadura has three Protected Designations of Origin (PDOs) for virgin olive oil: Gata-Hurdes [50], Monterrubio [51], and Aceites Villuercas-Ibores-Jara [52].

Table 1.
Olive-growing area by olive-growing region (ha) and distribution in relation to its province (%), to Extremadura (%), and to the PDO in 2021 [48].
2.2. Database
The study used climate data from 75 meteorological stations of the Agencia Estatal de Meteorología (AEMET [53]) located in different regions of Extremadura and its surroundings (see Figure 1). The daily data were homogenised and verified following quality controls recommended by the World Meteorological Organisation (WMO) [54] and the Royal Netherlands Meteorological Institute (KNMI) [55]. The study period covered 30 years (1990–2021), to analyse climate variability and make reliable predictions according to the WMO [56]. To ensure data quality, missing data were filled in, and a homogenisation process was applied using the R package CLIMATOL [57] (https://www.climatol.eu/, last accessed on 27 February 2024).
The study analysed several climatic variables, including mean temperature (Tavg), mean annual maximum (Tx) and minimum (Tn) temperatures, annual rainfall (Rr), the number of frost days (FD), and the probability of occurrence of severe frost days (FD-sev) that affect the olive crop. Table 2 provides definitions of the variables used. The analysis was conducted using the statistical software SPSS 25.0.
Table 2.
Acronyms and definitions of the climatic and topographic variables used in this research.
Elevation and orientation data were obtained with a resolution of 200 m for the analysis of the topographic variables. The elevation data were obtained using Digital Elevation Model of Spain (DEM200). The topographic orientation, expressed in degrees, was calculated from the elevation by determining the angle of maximum slope for each cell, providing the direction where this slope is maximum.
Climatic and topographic variables were analysed for all polygons in Extremadura that contained at least one olive tree. The analysis was made possible using a high-resolution database that contains information on 335,411 olive tree polygons, representing 217,711 hectares of olive groves. The General Secretariat of the Ministry of Agriculture and Community Agricultural Policy of the Government of Extremadura [48] provided this database.
An analysis of variance (ANOVA) was conducted, followed by a Tukey test, to distinguish and categorise the olive-growing regions based on their climatic and topographic variables.
2.3. Modelling
The thermal values were calculated using a linear regression process, with elevation and latitude as predictors. The residuals from the regression were interpolated using the ordinary kriging technique [60,61,62]. The regression-kriging technique is applied to make independent projections for both the trend and the residuals. Therefore, any variable at a new unsampled point, x, is estimated as using the following formula:
where the trend, , is generated by linear regression analysis, and the residuals, , are estimated using the simple kriging algorithm. If are the estimated trend coefficients of the model, is the expected jth case at location , p is the number of predictors, are the weights determined by solving the simple kriging residual regression, , for the n sample points, the prediction is determined as follows:
This study employed two predictors: elevation (h) and latitude. The model used was . As a result,
The residual at each sampling point, , is calculated as the difference between the value of the variable and the expected trend .
Six digital raster models were created, each with a resolution of 1000 m × 1000 m, with one for each variable. ArcGIS was used for all calculations and maps, and the Geostatistical Analyst and Spatial Analyst extensions were used for geostatistical analysis. Figure 2 illustrates the methodology followed in this study to aid comprehension.
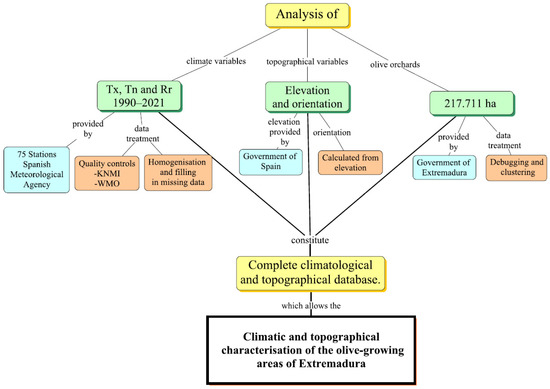
Figure 2.
Methodological diagram followed in this study.
3. Results and Discussion
3.1. Topographical Characterisation
The analysis of altitude in the olive grove plots in Extremadura shows that 49.18% (Table 3) of the olive grove area is distributed between 300 and 500 m a.s.l. The highest altitude at which olive trees are cultivated is 1200–1300 m a.s.l., located in the regions of Gata-Hurdes and La Vera-Jerte-Ambroz in the province of Cáceres. Olive groves at lower altitudes (<200 m) are located in the Vegas del Guadiana region of Badajoz (6.4%) (Table 3). To understand how the olive grove surface area is classified by altitude in each olive-growing region, please refer to Tables S1 and S2 in the Supplementary Materials. There is a 200 m difference in the cultivated area of olive trees between the two provinces. Olive trees in Badajoz are located at an altitude range of 200–400 m a.s.l., while those in Cáceres are located at an altitude range of 200–400 m a.s.l. Cáceres has 10% of olive trees located above 700 m a.s.l., which affects both production and quality [17,18,63]. This is because higher altitudes result in shorter cycles and lower fatty acid content. In Caceres, 5.8% of the olive groves are located at inappropriate altitudes (>800 m) [15]. This is problematic, as low temperatures and frequent frosts can directly impact the quality and chemical composition of the olive oil [17]. According to Mousa et al. [17], fruits from high altitudes contain a higher chlorophyll content, possibly because the olive trees mature more slowly. According to Osman et al. [64], oil obtained from lower altitude olive groves contains a higher amount of free fatty acids than that from higher altitudes, although the ratio of unsaturated/saturated acids is lower for lower altitude olive trees.
Table 3.
Classification of olive grove area (%) by altitude ranges in the olive-growing regions of Extremadura and the weather stations used.
At the regional level, the northern orientation has the lowest percentage of olive grove area, at 5.3%, while the other orientations have similar values, ranging from 11% to 16%. In the province of Cáceres, 50% of the olive-growing area is located at south (S), southeast (SE), and southwest (SW) orientations, while in Badajoz, almost 45% is located between the south (S) and west (W) orientations (Table 4). An example of this is the presence of olive groves in the northern mountains of the region, which are the highest and steepest. In the regions of La Vera-Jerte-Ambroz and Gata-Hurdes and Ibores, olive trees are mainly cultivated in the S, SW, and SE orientations (Figure 3).
Table 4.
Olive grove area (%) classified by orientation for the olive-growing regions, by province and for Extremadura in 2021.
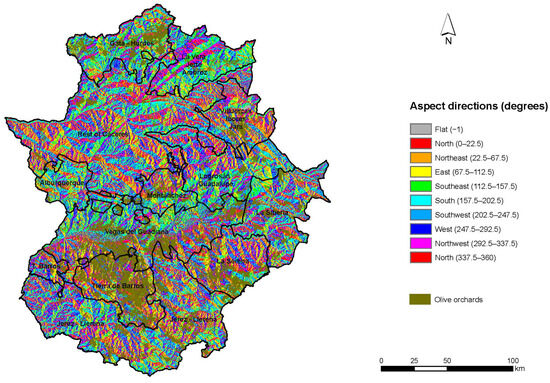
Figure 3.
Spatial representation of the orientation of the olive-growing regions in Extremadura.
Trentacoste et al. [65] found that olive oil production was significantly higher in the S, SE, and NE orientations compared to the N and NW orientations. In Extremadura, olive groves are more commonly distributed in the orientations that have the highest production. Similarly, researchers [65] discovered that the water content of the N–S orientations is higher than other orientations due to lower evapotranspiration, allowing for more vegetation development. However, due to the fact that the olive is a species with high thermal and radiation requirements, it is recommended that it be planted in the south, southeast or even southwest, which have the longest hours of sunshine and are more temperate than northern exposures [66,67].
The distribution of orientations in the olive-growing area by region follows a pattern similar to that of Extremadura. However, some differences can be found in certain regions, particularly in La Vera-Jerte-Ambroz and Logrosán-Guadalupe. In these regions, the predominant orientations are SE and S, accounting for 54% and 43% of the area, respectively. In contrast, the region of La Serena stands out, with the largest area facing NE and E, accounting for 32% of the olive-growing area (Table 4).
3.2. Temperature Characterisation
Table 5 shows the correlations obtained between climatic and topographic variables. Altitude is highly correlated with several climate variables. It is inversely proportional to temperature and directly proportional to other variables. Latitude also shows a similar trend, but the correlation value is lower. In contrast, longitude has little correlation with climatic variables. This correlation analysis assists in creating linear models (Table 6) to represent the variability of the Extremadura territory. The models aim to characterize the olive grove area (Figure 4, Figure 5 and Figure 6).
Table 5.
Pearson correlation between climatic and topographic variables for the region of Extremadura.
Table 6.
Linear models used in geostatistical interpolation.
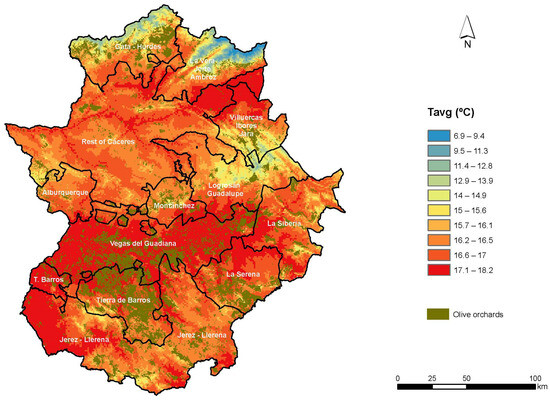
Figure 4.
Spatial representation of the average temperature (Tavg) in the olive-growing regions of Extremadura.
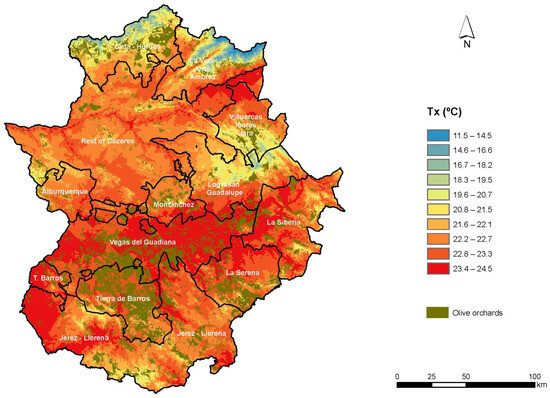
Figure 5.
Spatial representation of the maximum temperature (Tx) in the olive-growing regions of Extremadura.
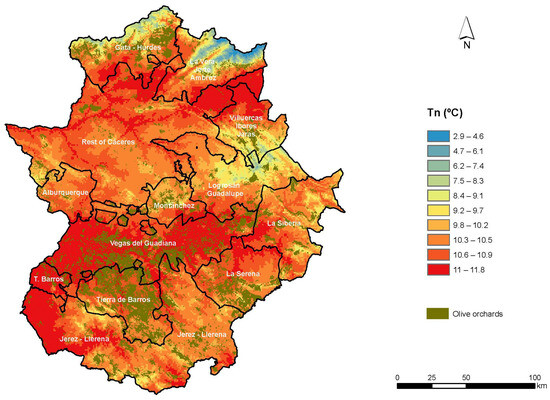
Figure 6.
Spatial representation of the minimum temperature (Tn) in the olive-growing regions of Extremadura.
A kriging regression was performed to obtain topographic and thermal variables in non-sampled points due to their high correlation. Table 6 shows the linear models used for this regression. However, ordinary kriging was used for the precipitation variable, as a kriging regression was not possible due to the low correlation between topographic variables and precipitation.
The olive-growing area in Extremadura has a mean annual temperature of 16.5 °C, with little variation between regions. The mean annual minimum temperature is 10.4 °C, and the mean annual maximum temperature is 22.5 °C, both of which are suitable for olive cultivation [14,15,68]. Additionally, the temperatures exhibit a low coefficient of variation, indicating climatic stability across the region. In general, the olive-growing regions of Cáceres exhibit lower average temperatures compared to those of Badajoz. Among these regions, La Vera-Jerte-Ambroz has the lowest mean and maximum temperature, but the highest spatial variability (6.7%) (Table 7). On the other hand, the Vegas del Guadiana region has the highest values for both variables, but with very low variability. This suggests that it is the warmest and most homogeneous area in terms of temperatures across its surface.
Table 7.
Average values and coefficient of variation (CV) for the climatic variables of the olive grove area in the provinces and olive-growing regions of Extremadura in the period 1990–2021.
Extremadura receives enough annual rainfall to support commercial yields [12,14]. The La Vera-Jerte-Ambroz region has the highest value (Table 7), while the La Serena region has a value slightly below the threshold for achieving acceptable commercial yields [12].
Olive groves are present throughout the region, with varying average temperature ranges (11–17 °C). However, olive trees are more commonly found in warmer regions, particularly in the Vegas del Guadiana and Tierra de Barros areas, which constitute approximately around 50% of the olive-growing land. These areas have a temperature above 17 °C, which is the highest in Extremadura (Table 8).
Table 8.
Olive grove area (%) classified by average temperature range (Tavg) for the olive-growing regions, by province and in Extremadura.
Olive growing is feasible throughout Extremadura in terms of average temperatures, with the exception of the highest areas of the northern regions (Gata-Hurdes, La Vera-Jerte-Ambroz and Ibores), where the average temperature falls below 15 °C (Figure 4). These regions are precisely where olive groves with lower mean annual temperatures are located, at higher altitudes and with a clear south–southwest orientation (Table 4).
The olive-growing regions of the province of Cáceres generally have lower average temperatures than those of Badajoz. An analysis of the regions reveals that Gata-Hurdes, La Vera-Jerte-Ambroz, and Ibores have a larger olive-growing area in average ranges, while Badajoz has a higher average temperature, which exceeds 16.5 °C (refer to Table 8). These results support the findings of Mafrica et al. [18] that olive cultivation thrives in mean annual temperatures between 14.4 °C and 17.7 °C. Furthermore, lower acidity in colder environments has been observed by other researchers, who attribute this to a higher concentration of free fatty acids in oils produced at lower altitudes [64].
The distribution of olive-growing areas for maximum and minimum temperature is almost identical to that of average temperatures, as shown in Figure 4, Figure 5 and Figure 6, respectively. Figure 5 displays the range of maximum temperatures, which varied between 14.5 and 24.5 °C (Table 9), while Figure 6 shows the distribution of minimum temperatures, which varied between 9 °C and 11 °C (Table 10). This range is optimal for olive growing. The regions with the highest temperatures (Vegas del Guadiana and Tierra de Barros) also have the warmest climate, with average maximum and minimum temperatures of over 22 °C and 10 °C, respectively. However, the olive grove surface area in the northern regions of Gata-Hurdes, Ibores, and La Vera-Jerte-Ambroz is obtained at lower temperature ranges, with a maximum of 19.5 °C in Tx and a minimum of 9 °C in Tn.
Table 9.
Olive grove area (%) classified by maximum temperature range (Tx) for each olive-growing area.
Table 10.
Olive grove area (%) classified by minimum temperature range (Tn) for each olive-growing region, by province and in Extremadura.
In Cáceres, 89% of the olive groves are located in areas with annual maximum temperatures ranging from 19.5 °C to 23.3 °C. In Badajoz, 82% of the olive groves are located in areas with annual maximum temperatures ranging from 22.1 °C to 24.5 °C (Table 9). The minimum temperature (Figure 6) shows that the olive-growing areas of Cáceres have values between 9 and 11 °C, and those of Badajoz have values of 10–12 °C (Table 10). The thermal amplitude in Badajoz was 12.3 °C, and in Cáceres it was 11.5 °C. This wide range of temperatures may negatively affect the fat content of the fruit [69].
3.3. Precipitation Characterisation
In terms of mean annual rainfall (Rr), there is considerable variation in values across regions (Figure 7), ranging from 390 mm to 1300 mm. However, more than 50% of olive-growing regions fall within the range of rainfall values below 490 mm (Table 11). The Mean annual rainfall is very close to 500 mm/year, a value that is considered to be the limit for obtaining acceptable commercial yields [12]. This indicates the adaptation of the olive grove to conditions of low water availability, since a large part of the olive grove area in Extremadura is cultivated under these conditions.
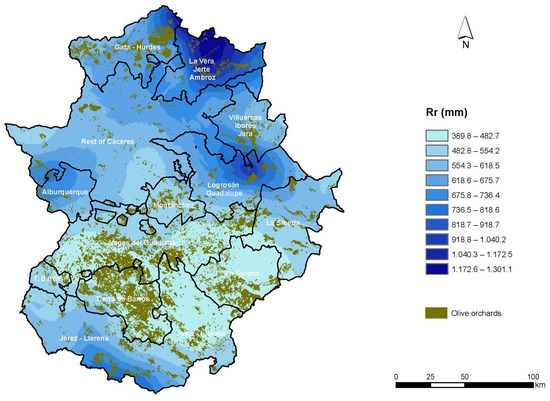
Figure 7.
Spatial representation of annual rainfall (Rr) in the olive-growing regions of Extremadura.
Table 11.
Olive grove area (%) classified by average annual precipitation (Rr) for each olive-growing region, by province and in Extremadura.
There is a significant difference in the average total rainfall between the olive-growing regions of Badajoz and Cáceres. In Badajoz, 68.7% of the olive-growing area has an average annual rainfall of less than 490 mm, while in Cáceres, it is 50% of the area, with values ranging from 600–715 mm (Table 11 and Figure 7).
The regions of Resto de Cáceres, Gata-Hurdes, and Ibores are known for receiving rainfall between 600 and 715 mm, while La Vera-Jerte-Ambroz has the highest rainfall of all the olive-growing regions, with 50% of its area receiving between 900 and 1150 mm. On the other hand, in the regions of La Serena, Vegas del Guadiana, and Tierra de Barros over 75% of the olive-growing area has a rainfall of less than 490 mm. Alburquerque has the highest percentage of olive grove area in the Badajoz region that receives higher rainfall, specifically in the ranges of 490–600 mm and 6001–715 mm, with a percentage of 94.5%. Studies conducted in southern Spain [70,71] shown a correlation between annual rainfall and olive production. Furthermore, other studies on olive phenology [72,73] indicate that increased rainfall can positively affect olive production in regions with dry climates, such as the province of Badajoz.
3.4. Frost Characterisation
Table 12 shows that during the studied period, there were no olive-growing regions in Extremadura with less than eight frost days per year. On average, Extremadura experiences between 24–32 frost days per year, with 52.3% of the olive-growing area falling within this range. Notably, 80.2% of the olive grove surface area in the province of Cáceres experiences between 24–32 frost days per year, while in Badajoz, only 45.8% of the area falls within this range. Figure 8 clearly distinguishes the olive-growing surface area of Vegas del Guadiana from that of Cáceres. Among all regions, Vegas del Guadiana has the smallest area of olive groves affected by a high number of frost days (1.8%). In contrast, the northern regions of Cáceres, including Gata-Hurdes, La Vera-Jerte-Ambroz, Logrosán-Guadalupe, and Ibores, have the largest areas of olive trees affected by frost days. In the province of Badajoz, La Serena stands out for having 93% of its olive-growing area affected by a high number of frost days. When analysing the impact of frost days on olive trees, it is important to consider not only the number of frost days but also the severity of the frosts. Olive trees can withstand temperatures close to 0 °C without apparent damage [74].
Table 12.
Distribution of olive grove area (%) by number of annual frosts (FD) by olive-growing region, by province and in Extremadura.
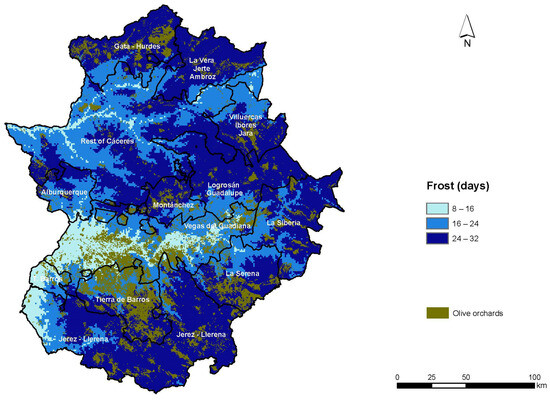
Figure 8.
Spatial representation of the number of annual frosts (FD) in the olive-growing regions of Extremadura.
Table 13 presents the annual probability of days with severe frosts. In Extremadura, there is a 5.8% chance of having one to five severe frosts per year in 5.8% of the years. The regions situated in the north of Cáceres (La Vera-Jerte-Ambroz, Logrosán-Guadalupe, and Ibores) have the highest probability of severe frosts, with more than 10% of the years having between one and five severe frosts. Furthermore, the Logrosán-Guadalupe region is the sole area that encounters severe frosts for 5–10 days and more than 10 days, with a probability of 2.1% and 3.1%, respectively. This can significantly affect olive production in the region, as repeated severe frosts can lead to defoliation [16]. Therefore, this variable is a distinguishing factor for olive cultivation in Extremadura.
Table 13.
Probability (%) in years of occurrence of severe frosts (SF) (Tn < −4.7 °C) by ranges of number of days in the olive-growing regions, in the provinces and in Extremadura for the period 1990–2021.
The ANOVA statistical test and Tukey’s multiple comparisons post-test were used to group olive-growing regions based on their thermal climatic conditions. Six homogeneous groups were identified for the thermal variables (Tagv, Tx, and Tn). The first group, consisting of the olive-growing regions of La Vera-Jerte-Ambroz and Ibores (Figure 9a–c), had the lowest temperatures. On the other hand, the last group, comprising La Siberia, Vegas del Guadiana, and La Serena (Figure 9a–c), experienced the warmest temperatures. Overall, the mean, minimum, and maximum temperatures show a low coefficient of variation, indicating minimal inter-annual temperature fluctuations.
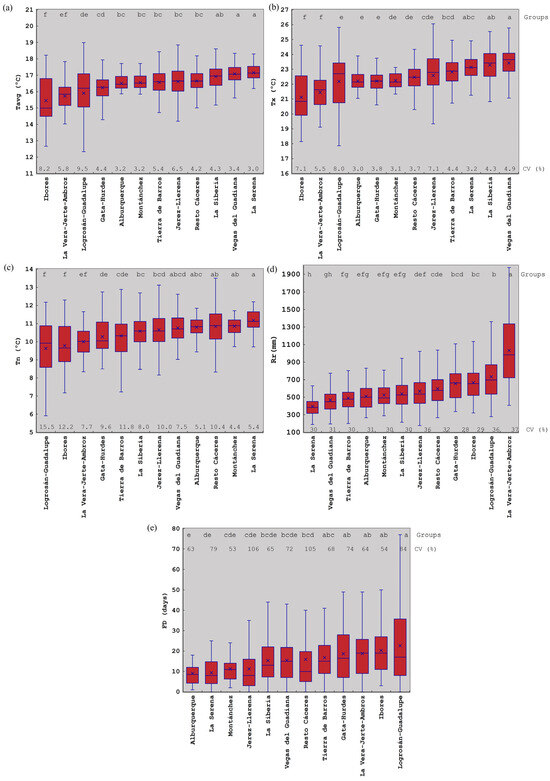
Figure 9.
Box plots for climatic variables by olive-growing regions together with homogeneous groups, denoted by letters, where (a) mean temperature, (b) maximum temperature, (c) minimum temperature, (d) annual rainfall, and (e) number of frost days after application of the ANOVA statistical test and the Tukey post-test, with p < 0.05 and coefficient of variation (%).
The data show that there are eight homogenous groups based on total average precipitation. La Serena and Vegas del Guadiana belong to the first group, with the lowest precipitation, averaging around 396–467 mm. On the other hand, the region of La Vera-Jerte-Ambroz has the highest precipitation, with an average of 1034 mm. This region has the highest values for total average precipitation in Extremadura (Figure 9d). The coefficient of variation values are generally high, indicating significant inter-annual variation and a considerable difference between minimum and maximum values. On the other hand, Figure 9d presents annual rainfall values that suggest that olive cultivation may be limited by rainfall, except in the Vera-Jerte-Ambroz region, where the minimum rainfall is 408 mm, which guarantees acceptable olive production.
Regarding the number of frost days (Figure 9e), Alburquerque has the lowest number of frost days and one of the lowest coefficients of variation. This means that its olive groves have the lowest risk of frost damage. Frost damage severity to olive trees is determined by various factors, such as the minimum temperature reached, duration of exposure, physiological state [75,76], and variety [77]. In the Logrosán-Guadalupe area, olive trees are susceptible to frost damage due to prolonged exposure, although the extent of damage varies from year to year. This region is followed by Ibores, La Vera-Jerte-Ambroz, and Gata Hurdes, with a lower inter-annual variability.
3.5. Relationship between Altitude and Climatic Variables in the Olive Grove Area in Extremadura
It was found that temperature and precipitation were affected by altitude (Table 14). Precipitation tends to increase with altitude, while temperature decreases. Figure 10a–c shows a significant linear relationship between temperature and altitude. The negative thermal gradient is 0.6 °C, 0.7 °C, and 0.5 °C per 100 m for mean, maximum, and minimum temperature, respectively. Determining the gradient for precipitation and frost days is challenging due to their variation with altitude, as shown in Figure 10d,e, which lacks a significant linear relationship.
Table 14.
Mean values of annual precipitation (Rr), mean (Tavg), minimum (Tn), and maximum (Tx) temperature by altitude range in the period 1990–2021.
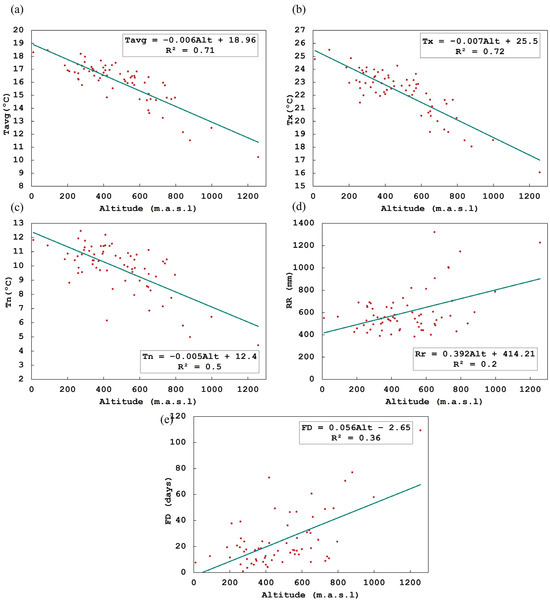
Figure 10.
Scatter plots (red dots) and regression line (green line) of (a) mean temperature, (b) maximum temperature, (c) minimum temperature, (d) total precipitation, and (e) number of frost days versus altitude.
A study carried out in Cordoba [78], southern Spain, found that altitude and slope were the topographical factors that most influenced olive phenology at the local level. These factors could delay the onset of certain phases of the olive cycle, production, and quality, similar to the case of vines [79]. However, they could also serve as a measure of adaptation to climate change by identifying areas that will reach temperatures too high for olive cultivation in the future.
4. Conclusions
The olive-growing area in Extremadura is mainly located between 200 and 600 m above sea level. The largest olive-growing areas are situated in the southern and western orientations, while the northern orientation is the least common. This distribution is consistent across all olive-growing regions, except for Gata-Hurdes, La Vera-Jerte-Ambroz, and Ibores, where the southeastern orientation is also prominent.
According to the analysis of thermal conditions in Extremadura, the majority of its surface area is appropriate for olive cultivation. However, the higher altitude areas in the north, where average annual temperatures drop below 11 °C, are not suitable. However, in some regions of the province of Badajoz, such as Jerez-Llerena, La Serena, Tierra de Barros, and Vegas del Guadiana, the annual rainfall is below 500 mm, which may pose a constraint in terms of rainfall characteristics. Nevertheless, it is noteworthy that over 50% of the olive-growing area in Extremadura is situated in regions with an annual rainfall of less than 490 mm, indicating the remarkable capacity of the crop to adapt to low rainfall. All olive-growing regions experienced at least 24–32 frosts per year, with a higher frequency of frosts in the northern regions of Extremadura. This may affect production, as there is a greater likelihood of severe frosts.
Thermal similarities have been found among olive-growing regions, allowing them to be grouped together homogeneously. The group with the highest temperatures comprises La Siberia, Vegas del Guadiana, and La Serena, all located in the province of Badajoz and at lower altitudes. However, the group of regions with the lowest temperatures consists of Ibores, Logrosán-Guadalupe, and La Vera-Jerte-Ambroz in the province of Cáceres. As regards rainfall, there are greater differences among the 12 olive-growing regions.
Due to the current context of climate change, it is anticipated that Extremadura will experience higher temperatures and increased aridity. This high-resolution study, conducted at the orchard level, will facilitate precise decision making regarding the implementation of climate change adaptation and mitigation measures. Possible measures to improve crop resilience include selecting more resistant varieties, changing the management system and plot orientation, implementing deficit irrigation, and relocating plantations to higher altitudes. Therefore, it is essential to analyse trends and future scenarios of these variables to quantify the magnitude of climate change.
Supplementary Materials
The following supporting information can be downloaded at: https://www.mdpi.com/article/10.3390/land13040495/s1, Table S1: Olive grove area (ha) classified by altitude (m) in the olive-growing regions of Badajoz; Table S2: Olive grove area (ha) classified by altitude (m) in the olive-growing regions of Cáceres.
Author Contributions
Conceptualization F.H. and C.A.; methodology, F.H. and A.G.-M.; software, C.A. and L.L.P.; validation, F.H. and C.A.; formal analysis, C.A., L.L.P. and A.G.-M.; investigation, F.H., C.A., L.L.P., A.G.-M., L.R. and F.J.R.; resources, C.A., L.R. and L.L.P.; data curation, C.A. and L.R.; writing—original draft preparation, F.H. and C.A.; writing—review and editing, F.H.; visualization, C.A., L.R. and F.H.; supervision, F.H.; project administration F.H.; funding acquisition, F.H. and A.G.-M. All authors have read and agreed to the published version of the manuscript.
Funding
This research was funded by the Junta de Extremadura and the European Regional Development Fund (ERDF) through the project IB20056 (“Impacto del cambio climático en el cultivo del olivo en Extremadura, Caracterización, zonificación y futuros escenarios”) and GR18088 (Research Group RNM028).
Data Availability Statement
Data are contained within the article and Supplementary Materials.
Acknowledgments
This study was made possible thanks to the collaboration of the Agencia Estatal de Meteorología (AEMET).
Conflicts of Interest
The authors declare no conflicts of interest.
References
- FAOSTAT. Available online: https://www.fao.org/faostat/es/#data/QCL (accessed on 5 May 2023).
- Ministerio de Agricultura Pesca y Alimentación Anuario de Estadística. Available online: https://www.mapa.gob.es/es/estadistica/temas/publicaciones/anuario-de-estadistica/2021/default.aspx?parte=3&capitulo=07&grupo=12 (accessed on 19 April 2023).
- European Union (EU). Statistics | Eurostat. Available online: https://ec.europa.eu/eurostat/databrowser/view/ORCH_TOTAL__custom_5826819/default/table?lang=en (accessed on 19 April 2023).
- EUROSTAT. Aceite de Oliva. Available online: https://agriculture.ec.europa.eu/farming/crop-productions-and-plant-based-products/olive-oil_es (accessed on 20 April 2023).
- Agovino, M.; Casaccia, M.; Ciommi, M.; Ferrara, M.; Marchesano, K. Agriculture, Climate Change and Sustainability: The Case of EU-28. Ecol. Indic. 2019, 105, 525–543. [Google Scholar] [CrossRef]
- Calzadilla, A.; Rehdanz, K.; Betts, R.; Falloon, P.; Wiltshire, A.; Tol, R.S.J. Climate Change Impacts on Global Agriculture. Clim. Chang. 2013, 120, 357–374. [Google Scholar] [CrossRef]
- Di Vaio, C.; Nocerino, S.; Paduano, A.; Sacchi, R. Influence of Some Environmental Factors on Drupe Maturation and Olive Oil Composition. J. Sci. Food Agric. 2013, 93, 1134–1139. [Google Scholar] [CrossRef] [PubMed]
- Lombardo, N.; Marone, E.; Fiorino, P.; Godino, G.; Madeo, A.; Alessandrino, M. Influence of Growing Season Temperatures in the Fatty Acids (FAs) of Triacilglycerios (TAGs) Composition in Italian Cultivars of Olea Europaea. Adv. Hort. Sci. 2008, 22, 49–53. [Google Scholar]
- Pérez-López, D.; Ribas, F.; Moriana, A.; Rapoport, H.F.; De Juan, A. Influence of Temperature on the Growth and Development of Olive (Olea europaea L.) Trees. J. Hortic. Sci. Biotechnol. 2008, 83, 171–176. [Google Scholar] [CrossRef]
- Fraga, H.; Moriondo, M.; Leolini, L.; Santos, J.A. Mediterranean Olive Orchards under Climate Change: A Review of Future Impacts and Adaptation Strategies. Agronomy 2020, 11, 56. [Google Scholar] [CrossRef]
- Fraga, H.; Pinto, J.G.; Viola, F.; Santos, J.A. Climate Change Projections for Olive Yields in the Mediterranean Basin. Int. J. Climatol. 2020, 40, 769–781. [Google Scholar] [CrossRef]
- Ponti, L.; Gutierrez, A.P.; Basso, B.; Neteler, M.; Ruti, P.M.; Dell’Aquila, A.; Iannetta, M. Olive Agroecosystems in the Mediterranean Basin: Multitrophic Analysis of Climate Effects with Process-Based Representation of Soil Water Balance. Procedia Environ. Sci. 2013, 19, 122–131. [Google Scholar] [CrossRef]
- Giorgi, F.; Lionello, P. Climate Change Projections for the Mediterranean Region. Glob. Planet. Chang. 2008, 63, 90–104. [Google Scholar] [CrossRef]
- Tombesi, A.; Tombesi, S.; Sbitri, M.O.; Serafini, F. Orchard Planning and Planting. In Production Tecniques in Olive Growing; International Olive Council: Madrid, Spain, 2007; pp. 17–40. [Google Scholar]
- Therios, I. Olives: Crop Production Science in Horticulture; CABI: Wallingford, UK, 2009. [Google Scholar]
- Lodolini, E.M.; Alfei, B.; Cioccolanti, T.; Zucchini, M.; Neri, D. Comparison of Frost Damages in Eleven Olive Cultivars after Two Freezing Events in Central Italy. Acta Hortic. 2022, 1346, 161–168. [Google Scholar] [CrossRef]
- Mohamed Mousa, Y.; Gerasopoulos, D.; Metzidakis, I.; Kiritsakis, A. Effect of Altitude on Fruit and Oil Quality Characteristics of ‘Mastoides’ Olives. J. Sci. Food Agric. 1996, 71, 345–350. [Google Scholar] [CrossRef]
- Mafrica, R.; Piscopo, A.; De Bruno, A.; Poiana, M. Effects of Climate on Fruit Growth and Development on Olive Oil Quality in Cultivar Carolea. Agriculture 2021, 11, 147. [Google Scholar] [CrossRef]
- Giorgi, F. Climate Change Hot-Spots. Geophys. Res. Lett. 2006, 33, L08707. [Google Scholar] [CrossRef]
- Tuel, A.; Eltahir, E. Why Is the Mediterranean a Climate Change Hot Spot? J. Clim. 2020, 33, 5829–5843. [Google Scholar] [CrossRef]
- Bladé, I.; Cacho, I.; Castro-Díez, Y.; Gomis Bosch, D.; Gonzalez Samperiz, P.; Miguez-Macho, G.; Perez, F.F.; Rodriguez-Fonseca, M.B.; Rodriguez-Puebla, C.; Sanchez, E.; et al. Clima En España: Pasado, Presente y Futuro. In Informe de Evaluación Del Cambio Climático Regional; Pérez y Roberta Boscolo, F.F., Ed.; CLIVAR España: Madrid, Spain, 2010. [Google Scholar]
- Esteban-Parra, M.J.; Rodrigo, F.S.; Castro-Diez, Y. Spatial and Temporal Patterns of Precipitation in Spain for the Period 1880–1992. Int. J. Climatol. 1998, 18, 1557–1574. [Google Scholar] [CrossRef]
- Brunetti, M.; Maugeri, M.; Monti, F.; Nanni, T. Temperature and Precipitation Variability in Italy in the Last Two Centuries from Homogenised Instrumental Time Series. Int. J. Climatol. 2006, 26, 345–381. [Google Scholar] [CrossRef]
- Brunet, M.; Sigró, J.; Jones, P.; Saladié, Ò.; Aguilar, E.; Moberg, A.; Lister, D.; Walther, A. Long-Term Changes in Extreme Temperatures and Precipitation in Spain. Contrib. Sci. 2007, 3, 331–342. [Google Scholar]
- Tanasijevic, L.; Todorovic, M.; Pereira, L.S.; Pizzigalli, C.; Lionello, P. Impacts of Climate Change on Olive Crop Evapotranspiration and Irrigation Requirements in the Mediterranean Region. Agric. Water Manag. 2014, 144, 54–68. [Google Scholar] [CrossRef]
- Aguilera, F.; Fornaciari, M.; Ruiz-Valenzuela, L.; Galán, C.; Msallem, M.; Ben Dhiab, A.; la Guardia, C.D.; del Mar Trigo, M.; Bonofiglio, T.; Orlandi, F. Phenological Models to Predict the Main Flowering Phases of Olive (Olea europaea L.) along a Latitudinal and Longitudinal Gradient across the Mediterranean Region. Int. J. Biometeorol. 2015, 59, 629–641. [Google Scholar] [CrossRef] [PubMed]
- García-Mozo, H.; Mestre, A.; Galán, C. Phenological Trends in Southern Spain: A Response to Climate Change. Agric. For. Meteorol. 2010, 150, 575–580. [Google Scholar] [CrossRef]
- D’Imperio, M.; Dugo, G.; Alfa, M.; Maninia, L.; Segre, A. Statistical Analysis on Sicilian Olive Oils. Food Chem. 2007, 102, 956–965. [Google Scholar] [CrossRef]
- Servili, M.; Esposto, S.; Fabiani, R.; Urbani, S.; Taticchi, A.; Mariucci, F.; Selvaggini, R.; Montedoro, G.F. Phenolic Compounds in Olive Oil: Antioxidant, Health and Organoleptic Activities According to Their Chemical Structure. Inflammopharmacology 2009, 17, 76–84. [Google Scholar] [CrossRef]
- Greven, M.; Neal, S.; Green, S.; Dichio, B.; Clothier, B. The Effects of Drought on the Water Use, Fruit Development and Oil Yield from Young Olive Trees. Agric. Water Manag. 2009, 96, 1525–1531. [Google Scholar] [CrossRef]
- Fernandes-Silva, A.A.; Ferreira, T.C.; Correia, C.M.; Malheiro, A.C.; Villalobos, F.J. Influence of Different Irrigation Regimes on Crop Yield and Water Use Efficiency of Olive. Plant Soil 2010, 333, 35–47. [Google Scholar] [CrossRef]
- Nissim, Y.; Shloberg, M.; Biton, I.; Many, Y.; Doron-Faigenboim, A.; Zemach, H.; Hovav, R.; Kerem, Z.; Avidan, B.; Ben-Ari, G. High Temperature Environment Reduces Olive Oil Yield and Quality. PLoS ONE 2020, 15, e0231956. [Google Scholar] [CrossRef] [PubMed]
- Rodríguez Sousa, A.A.; Barandica, J.M.; Aguilera, P.A.; Rescia, A.J. Examining Potential Environmental Consequences of Climate Change and Other Driving Forces on the Sustainability of Spanish Olive Groves under a Socio-Ecological Approach. Agriculture 2020, 10, 509. [Google Scholar] [CrossRef]
- Orlandi, F.; Rojo, J.; Picornell, A.; Oteros, J.; Pérez-Badia, R.; Fornaciari, M. Impact of Climate Change on Olive Crop Production in Italy. Atmosphere 2020, 11, 595. [Google Scholar] [CrossRef]
- Andrade, C.; Fonseca, A.; Santos, J.A. Are Land Use Options in Viticulture and Oliviculture in Agreement with Bioclimatic Shifts in Portugal? Land 2021, 10, 869. [Google Scholar] [CrossRef]
- Arenas-Castro, S.; Gonçalves, J.F.; Moreno, M.; Villar, R. Projected Climate Changes Are Expected to Decrease the Suitability and Production of Olive Varieties in Southern Spain. Sci. Total Environ. 2020, 709, 136161. [Google Scholar] [CrossRef]
- Gabaldón-Leal, C.; Ruiz-Ramos, M.; de la Rosa, R.; León, L.; Belaj, A.; Rodríguez, A.; Santos, C.; Lorite, I.J. Impact of Changes in Mean and Extreme Temperatures Caused by Climate Change on Olive Flowering in Southern Spain. Int. J. Climatol. 2017, 37, 940–957. [Google Scholar] [CrossRef]
- Fraga, H.; Pinto, J.G.; Santos, J.A. Olive Tree Irrigation as a Climate Change Adaptation Measure in Alentejo, Portugal. Agric. Water Manag. 2020, 237, 106193. [Google Scholar] [CrossRef]
- Moreno, J.; Aguiló, E.; Alonso, S.; Álvarez Cobelas, M.; Anadón, R.; Ballester, F.; Benito, G.; Catalán, J.; De Castro, M.; Cendrero, A.; et al. Evaluación Preliminar de Los Impactos En España Por Efecto Del Cambio Climático; Centro de Publicaciones Ministerio de Medio Ambiente: Madrid, Spain, 2005. [Google Scholar]
- Folgado-Fernández, J.A.; Campón-Cerro, A.M.; Hernández-Mogollón, J.M. Potential of Olive Oil Tourism in Promoting Local Quality Food Products: A Case Study of the Region of Extremadura, Spain. Heliyon 2019, 5, e02653. [Google Scholar] [CrossRef]
- Hrnjak, I.; Lukić, T.; Gavrilov, M.B.; Marković, S.B.; Unkašević, M.; Tošić, I. Aridity in Vojvodina, Serbia. Theor. Appl. Climatol. 2014, 115, 323–332. [Google Scholar] [CrossRef]
- Fraga, H.; Malheiro, A.C.; Moutinho-Pereira, J.; Cardoso, R.M.; Soares, P.M.M.; Cancela, J.J.; Pinto, J.G.; Santos, J.A. Integrated Analysis of Climate, Soil, Topography and Vegetative Growth in Iberian Viticultural Regions. PLoS ONE 2014, 9, e108078. [Google Scholar] [CrossRef]
- Liu, X.; Zhang, D.; Luo, Y.; Liu, C. Spatial and Temporal Changes in Aridity Index in Northwest China: 1960 to 2010. Theor. Appl. Climatol. 2013, 112, 307–316. [Google Scholar] [CrossRef]
- Moral, F.J.; Rebollo, F.J.; Valiente, P.; López, F. Modeling of Atmospheric Pollution in Urban and Rural Sites Using a Probabilistic and Objective Approach. Appl. Sci. 2019, 9, 4009. [Google Scholar] [CrossRef]
- Blanco Salas, J.; Labrador, J.; Monago, F.; Vallejo, J.R.; Morán-López, R.; Vázquez, F.M.; Ruiz Téllez, T. Resultados Del Proyecto “Valorización de La Biodiversidad Vegetal Del Espacio Protegido ZIR Sierra Grande de Hornachos Como Fuente de Innovación Para El Desarrollo”. Conserv. Veg. 2020, 24, 10. [Google Scholar]
- SNCZI-Inventario de Presas y Embalses. Available online: https://sig.mapama.gob.es/snczi/index.html?herramienta=EstadisticasPresas (accessed on 4 May 2023).
- Facultad de Ciencias Económicas y Empresariales y Escuela de Ingenierías Agrarias, Universidad de Extremadura. La Agricultura y La Ganadería Extremeñas, 2018; Fundacion Caja Badajoz: Badajoz, Spain, 2019. [Google Scholar]
- Secretaría General de la Consejería de Agricultura y Política Agraria Comunitaria, G. de E. SIGPAC 2021-CC-BY4.0 CICTEX. Available online: http://sitex.gobex.es/SITEX/centrodescargas/view/11 (accessed on 8 April 2024).
- CE (Comunidad Europea). Reglamento (CE) No 2138/97 de La Comisión de 30 de Octubre de 1997; CE: Brussels, Belgium, 1997. [Google Scholar]
- UE (Unión Europea). Reglamento (CE) No 148/2007 de La Comisión de 15 de Febrero de 2007; UE: Brussels, Belgium, 2007. [Google Scholar]
- UE (Unión Europea). Reglamento (CE) No 240/2007 de La Comisión, de 6 de Marzo de 2007, Por El Que Se Registran Ciertas Denominaciones En El ’Registro de Denominaciones de Origen Protegidas e Indicaciones Geográficas Protegidas; UE: Brussels, Belgium, 2007. [Google Scholar]
- Extremadura. Decreto 128/2022, de 11 de Octubre, Por El Que Se Aprueba El Reglamento de La Denominación de Origen Protegida “Aceite Villuercas Ibores Jara”; Junta de Extremadura: Merida, Spain, 2022. [Google Scholar]
- AEMET Agencia Estatal de Meteorología (AEMET). Available online: https://www.aemet.es/es/portada (accessed on 16 February 2024).
- WMO World Meteorological Organization. Annual Report of the World Meteorological Organization 1966; WMO: Geneva, Switzerland, 1967. [Google Scholar]
- KNMI Royal Netherlands Meteorological Institute; ECAD European Climate Assessment & Dataset. Algorithm Theoretical Basis Document; Royal Netherlands Meteorological Institute KNMI: Utrecht, The Netherlands, 2013. [Google Scholar]
- OMS Organización Meteorológica Mundial. Guía de Prácticas Climatológicas; OMM: Geneva, Switzerland, 2018; ISBN 9789263301000. [Google Scholar]
- Guijarro, J. Homogenization of Climatic Series with Climatol; CLIMATOL, AEMET: Balearic Islands, Spain, 2018; Available online: https://climatol.eu/ (accessed on 8 April 2024).
- García-Martín, A.; Paniagua, L.L.; Moral, F.J.; Rebollo, F.J.; Rozas, M.A. Spatiotemporal Analysis of the Frost Regime in the Iberian Peninsula in the Context of Climate Change (1975–2018). Sustainability 2021, 13, 8491. [Google Scholar] [CrossRef]
- Ministerio de Transportes y Movilidad Sostenible Instituto Geográfico Nacional IGN. Available online: https://www.ign.es/web/cbg-area-cartografia (accessed on 5 April 2024).
- Bustamante, J. Cartografía Predictiva de Variables Climáticas: Comparación de Distintos Modelos de Interpolación de La Temperatura En España Peninsular. Graellsia 2003, 59, 359–376. [Google Scholar] [CrossRef][Green Version]
- Goovaerts, P. Using Elevation to Aid the Geostatistical Mapping of Rainfall Erosivity. Catena 1999, 34, 227–242. [Google Scholar] [CrossRef]
- Odeh, I.O.A.; McBratney, A.B.; Chittleborough, D.J. Further Results on Prediction of Soil Properties from Terrain Attributes: Heterotopic Cokriging and Regression-Kriging. Geoderma 1995, 67, 215–226. [Google Scholar] [CrossRef]
- Mailer, R.J.; Ayton, J.; Graham, K. The Influence of Growing Region, Cultivar and Harvest Timing on the Diversity of Australian Olive Oil. J. Am. Oil Chem. Soc. 2010, 87, 877–884. [Google Scholar] [CrossRef]
- Osman, M.; Metzidakis, I.; Gerasopoulos, D.; Kiritsakis, A. Qualitative Changes in Olive Oil of Fruits Collected from Trees Grown at Two Altitudes. Riv. Ital. Sostanze Grasse 1994, 71, 187–190. [Google Scholar]
- Trentacoste, E.R.; Connor, D.J.; Gómez-del-Campo, M. Effect of Olive Hedgerow Orientation on Vegetative Growth, Fruit Characteristics and Productivity. Sci. Hortic. 2015, 192, 60–69. [Google Scholar] [CrossRef]
- Trentacoste, E.R.; Gómez-del-Campo, M.; Rapoport, H.F. Olive Fruit Growth, Tissue Development and Composition as Affected by Irradiance Received in Different Hedgerow Positions and Orientations. Sci. Hortic. 2016, 198, 284–293. [Google Scholar] [CrossRef]
- Tang, Z.; Fang, J. Temperature Variation along the Northern and Southern Slopes of Mt. Taibai, China. Agric. For. Meteorol. 2006, 139, 200–207. [Google Scholar] [CrossRef]
- Krishna, K.R. Agroecosystems: Soils, Climate, Crops, Nutrient Dynamics and Productivity; Apple Academic Press: New York, NY, USA, 2013; ISBN 9780429170980. [Google Scholar]
- Mousavi, S.; de la Rosa, R.; Moukhli, A.; El Riachy, M.; Mariotti, R.; Torres, M.; Pierantozzi, P.; Stanzione, V.; Mastio, V.; Zaher, H.; et al. Plasticity of Fruit and Oil Traits in Olive among Different Environments. Sci. Rep. 2019, 9, 16968. [Google Scholar] [CrossRef] [PubMed]
- Ramos-Román, M.J.; Jiménez-Moreno, G.; Anderson, R.S.; García-Alix, A.; Camuera, J.; Mesa-Fernández, J.M.; Manzano, S. Climate Controlled Historic Olive Tree Occurrences and Olive Oil Production in Southern Spain. Glob. Planet. Chang. 2019, 182, 102996. [Google Scholar] [CrossRef]
- Rodrigo-Comino, J.; Senciales-González, J.M.; Yu, Y.; Salvati, L.; Giménez-Morera, A.; Cerdà, A. Long-Term Changes in Rainfed Olive Production, Rainfall and Farmer’s Income in Bailén (Jaén, Spain). EuroMediterr J. Environ. Integr. 2021, 6, 58. [Google Scholar] [CrossRef]
- Galán, C.; Vázquez, L.; García-Mozo, H.; Domínguez, E. Forecasting Olive (Olea europaea) Crop Yield Based on Pollen Emission. Field Crops Res. 2004, 86, 43–51. [Google Scholar] [CrossRef]
- Galán, C.; Cariñanos, P.; García-Mozo, H.; Alcázar, P.; Domínguez-Vilches, E. Model for Forecasting Olea Europaea L. Airborne Pollen in South-West Andalusia, Spain. Int. J. Biometeorol. 2001, 45, 59–63. [Google Scholar] [CrossRef] [PubMed]
- Barranco, D.; Ruiz, N.; Campo, M.G. Frost Tolerance of Eight Olive Cultivars. HortScience 2005, 40, 558–560. [Google Scholar] [CrossRef]
- Valverde, P.; Zucchini, M.; Polverigiani, S.; Lodolini, E.M.; López-Escudero, F.J.; Neri, D. Olive Knot Damages in Ten Olive Cultivars after Late-Winter Frost in Central Italy. Sci. Hortic. 2020, 266, 109274. [Google Scholar] [CrossRef]
- Bartolozzi, F.; Cerquaglia, F.; Coppari, L.; Fontanazza, G. Frost tolerance induced by cold acclimation in olive (Olea europaea) L. Acta Hortic. 2002, 586, 473–477. [Google Scholar] [CrossRef]
- Lodolini, E.M.; Alfei, B.; Santinelli, A.; Cioccolanti, T.; Polverigiani, S.; Neri, D. Frost Tolerance of 24 Olive Cultivars and Subsequent Vegetative Re-Sprouting as Indication of Recovery Ability. Sci. Hortic. 2016, 211, 152–157. [Google Scholar] [CrossRef]
- Oteros, J.; García-Mozo, H.; Vázquez, L.; Mestre, A.; Domínguez-Vilches, E.; Galán, C. Modelling Olive Phenological Response to Weather and Topography. Agric. Ecosyst. Environ. 2013, 179, 62–68. [Google Scholar] [CrossRef]
- Alikadic, A.; Pertot, I.; Eccel, E.; Dolci, C.; Zarbo, C.; Caffarra, A.; De Filippi, R.; Furlanello, C. The Impact of Climate Change on Grapevine Phenology and the Influence of Altitude: A Regional Study. Agric. For. Meteorol. 2019, 271, 73–82. [Google Scholar] [CrossRef]


Disclaimer/Publisher’s Note: The statements, opinions and data contained in all publications are solely those of the individual author(s) and contributor(s) and not of MDPI and/or the editor(s). MDPI and/or the editor(s) disclaim responsibility for any injury to people or property resulting from any ideas, methods, instructions or products referred to in the content. |
© 2024 by the authors. Licensee MDPI, Basel, Switzerland. This article is an open access article distributed under the terms and conditions of the Creative Commons Attribution (CC BY) license (https://creativecommons.org/licenses/by/4.0/).